Article

Driving Forces on the Distribution of Urban Ecosystem’s Non-Point Pollution Reduction Service

1
State Key Laboratory of Urban and Regional Ecology, Research Center for Eco-Environmental Sciences, Chinese Academy of Sciences, Beijing 100085, China
2
University of Chinese Academy of Sciences, Bejing 100049, China
3
Department of Landscape Architecture and Horticulture, College of Architecture and Design, Chongqing College of Humanities, Science & Technology, Chongqing 401524, China
4
Laboratory of Ecosystem Services and Spatial Planning, College of Landscape Architecture and Art Design, Hunan Agricultural University, Changsha 410128, China
5
Department of Landscape Architecture, College of Horticulture and Gardens, Southwest University, Chongqing 400100, China
*
Author to whom correspondence should be addressed.
Atmosphere 2023, 14(5), 873; https://doi.org/10.3390/atmos14050873
Submission received: 27 March 2023 / Revised: 6 May 2023 / Accepted: 10 May 2023 / Published: 16 May 2023
(This article belongs to the Special Issue Urban and Regional Nitrogen Cycle and Risk Management)

Abstract

:
In the context of increasing urbanization and worsening environmental pollution, nonpoint source pollution during high-frequency rainfall has become a major ecological problem that endangers residents in cities. This study takes Shenzhen as an example. On the basis of a large number of soil sample test data, and combined with relevant environmental variables, it has drawn the high-resolution, high-precision spatial distribution maps of soil attributes within the city. In addition, this paper combines the revised universal soil loss equation and the GeoDetector model to evaluate the supply capacity of nonpoint source reduction services in the city’s ecological space and the main driving factors of spatial distribution characteristics for different types of land. The study found that increasing soil point density and combining environmental variables can help improve the accuracy of spatial mapping for soil attributes. The ME, MSE, ASE, RMSE, and RMSSE of spatial mapping all meet the accuracy evaluation criteria and are better than many existing studies; the spatial distribution characteristics of soil attributes and nonpoint source reduction services show significant differences among the whole city, secondary administrative regions, and different types of land; the GeoDetector results show that among the three main types of land use (forested land, industrial land, and street town residential land), topographic factors, habitat-quality factors, and ecosystem types have the greatest impact on the spatial differentiation characteristics of nonpoint source reduction services. Among climate factors, only precipitation factors have the greatest impact on the spatial differentiation characteristics of services. Facing the above factors, the q-values calculated by the GeoDetector are all higher than 10%. The results of this study can provide information for making better decisions on regional ecological system management and soil protection and on restoration work aimed at improving nonpoint source reduction services.

1. Introduction

Since the Industrial Revolution, the global population has entered a period of rapid growth [1]. The United Nations predicts that by 2050, the global urban population will reach 68% of the world’s total population [2]. Technological development has accelerated the expansion of cities around the world to accommodate housing and production needs. However, highly intensive land-use patterns have achieved economies of scale while severely altering local soil texture characteristics [3,4,5,6]. This has led to the destruction of the soil environment and given rise to a series of ecological and environmental problems. For example, soil degradation can accelerate the degradation of local ecosystems and increase the risk of dust storm formation [7,8]. Some scholars have found through research that soil degradation can cause a reduction in the capacity of local ecosystem services and an increased risk of soil erosion [9]. In addition, while rapid technological development in agriculture has ensured global food security, the widespread application of chemical fertilizers and pesticides has also made the global soil environment increasingly polluted [10,11]. The excessive use of nutrients, such as nitrogen and phosphorus, has breached the soil environment’s metabolic threshold, posing constant threats to human lives. For example, studies have found that nutrient enrichment in mangrove soils can accelerate CO2 emissions, leading to an increase in global warming trends [12]. JunKang Guo et al. [13] have found by reviewing a large number of existing studies that using excessive fertilizer damages the integrity of soil characteristics.
Ecosystem services can effectively guarantee human ecological security and reduce environmental risks. Ecosystem services refer to all the benefits that humans obtain from ecosystems, including material supply services (such as providing food and water), regulation services (such as flood regulation, carbon fixation, water conservation, etc.), cultural services (such as landscape value enhancement, tourism, health care, etc.), and supporting services (such as biodiversity maintenance) [14,15,16,17,18,19]. Many studies have confirmed that ecosystem services can guarantee the ecological security of cities. Denis Maragno [20] and A. Rizzo [21] respectively took Dolo and Gorla Maggiore in Italy as case areas, and studied the positive effects of urban ecological space’s flood reduction service on overall urban ecological security; in addition, Chae Yeon Park [22] also found that a reasonable urban green space planning scheme can play a more effective cooling role, so that residents can avoid the torment of extremely high temperatures. Among all ecosystem services, the reduction of nonpoint source pollution is crucial. It refers to the function of ecosystems to maintain soil while reducing the entry of substances such as nitrogen and phosphorus into downstream water bodies (including rivers, lakes, reservoirs, etc.), ultimately reducing nonpoint source pollution in the downstream basin. A stable supply of nonpoint source reduction services can improve the quality of the agricultural production environment and achieve source reduction for pollutants and systemic health for the production environment, laying the foundation for green agricultural development while ensuring the safety of urban residents’ lives. However, it has been found that changes in soil texture characteristics and nutrient content can seriously affect the provision of local ecosystem services by altering the ecosystem’s structure and function [23,24]. As research by Donghua Luo has found, inappropriate concentrations of soil pollutants can have negative effects on the growth, development, and forestation of vegetation [25] and on a larger scale can reduce the ability of trees to provide ecosystem services. Turlough F. Guerin [26] found in his research on industrial land soil that soil compaction can have negative effects on the germination, emergence, and early growth of the roots and stems of some plants. Addressing soil environmental problems in megacities with high land intensification and large populations poses a significant challenge for researchers and city managers, and developing strategies to alleviate urban surface pollution pressure and enhance ecosystem surface reduction services is a pressing issue.
The existing studies on the spatial mapping of the physicochemical properties of soil are mostly based on different ecosystems [27,28,29] or small and medium-size cities, and they rarely use megacities as research cases. Moreover, there are few studies on the influencing factors of the spatial distribution of nonpoint source pollution reduction services. In China, a megacity refers to a city with a population of over 10 million and is typically characterized by high levels of urbanization, industrialization, and economic development [30,31]. Megacities face many soil environmental issues, such as soil pollution [32], soil degradation [33,34], and soil erosion [35]. These issues not only affect the ecosystem services of the city but also threaten the health and quality of life of urban residents. This article takes Shenzhen as a case study and, on the basis of a large number of soil sample data and environmental variables, draws high-resolution spatial distribution maps of soil particle size and soil pollutant (total phosphorus, total nitrogen) content for the entire city. Compared with existing research, this article has a higher density of points, considers more environmental variables, and has better mapping accuracy. Based on the spatial results of soil attributes, this article combines geospatial remote-sensing data, statistical data, and localized service function parameters to calculate and spatialize the nonpoint source pollution reduction services for the entire city. Finally, this article uses the geographic detector method to explore the main factors affecting the spatial distribution of nonpoint source pollution reduction services on different land types. The research results can provide a basis for decision-making for regional ecosystem management and soil protection and for restoration policies.

2. Materials and Methods
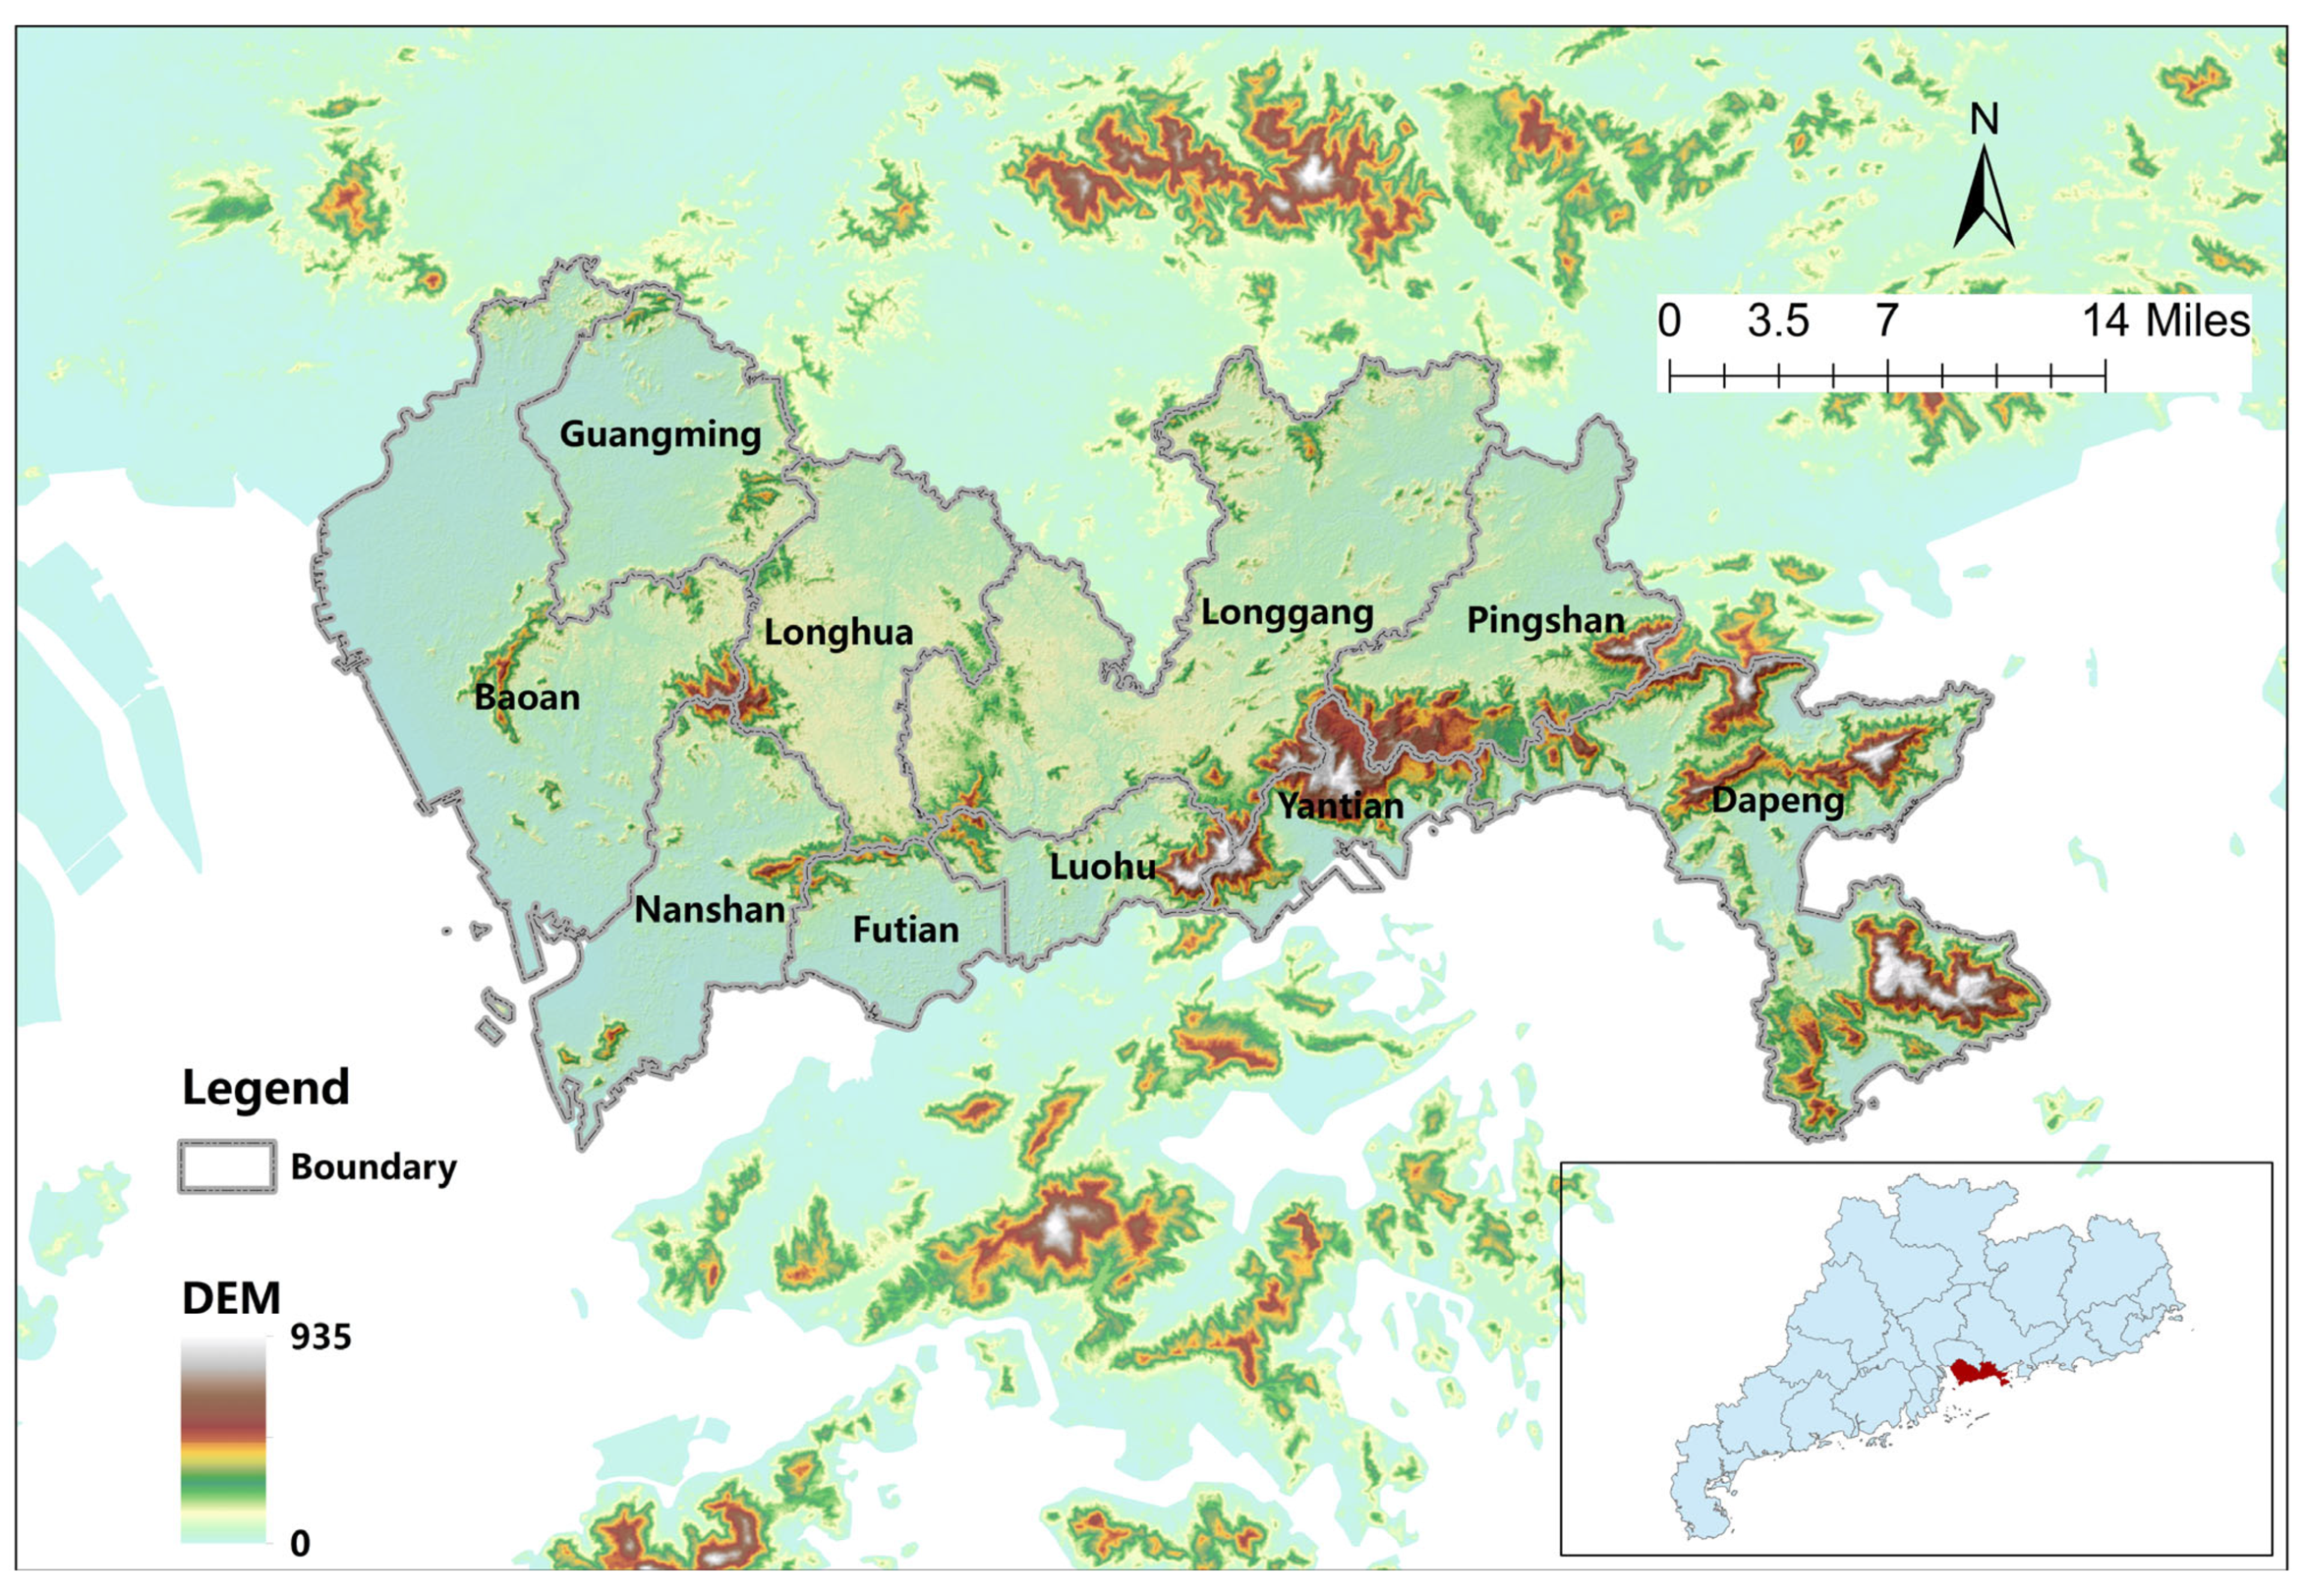
2.1. Study Area

Shenzhen, an important city along China’s southern coast, is in the southern region of the Guangdong Province and on the east coast of the Pearl River Estuary, as shown in Figure 1. As one of the four central cities in the Guangdong-Hong Kong-Macao Greater Bay Area, Shenzhen was the first city in China to undergo reform and open up [36]. The city has a land area of 1997.47 km2 [36], of which 1005.95 km2 is built-up land, and has a year-end resident population of 17,681,600 (as of the end of 2021). In the context of continuous industrial development and transformation, the local soil environment has gradually deteriorated with the influx of population and the continuous reduction of nonecological space land; it has more-serious environmental problems, such as soil hardening and slabbing, soil acidification, soil salinization, and soil pollution [37,38]; and the supply base of ecosystem services has been challenged. Shenzhen is a southern subtropical monsoon climate zone characterized by high temperatures and rainfall in summer and mild winters, with high annual rainfall [39]. An overly fragile surface soil environment can cause serious erosion, surface runoff, and surface source pollution problems when washed by precipitation [40].
Shenzhen, as a demonstration area of China’s economic development, is the first experimental place for many development policies in China. The development strategy adopted by Shenzhen is a reference and learning experience for other cities in China, but many of ecological and environmental problems faced by Shenzhen in the process of development are also possible problems faced by other cities in the process of development. Therefore, this paper takes Shenzhen, a megacity, as a case study, carries out spatial research on soil texture characteristics and pollutant content, and explores the main driving factors of the spatial distribution of nonpoint source pollution reduction services on different land-use types, providing a basis for regional ecosystem management and protection policy formulation for Shenzhen now and for other cities in the future.

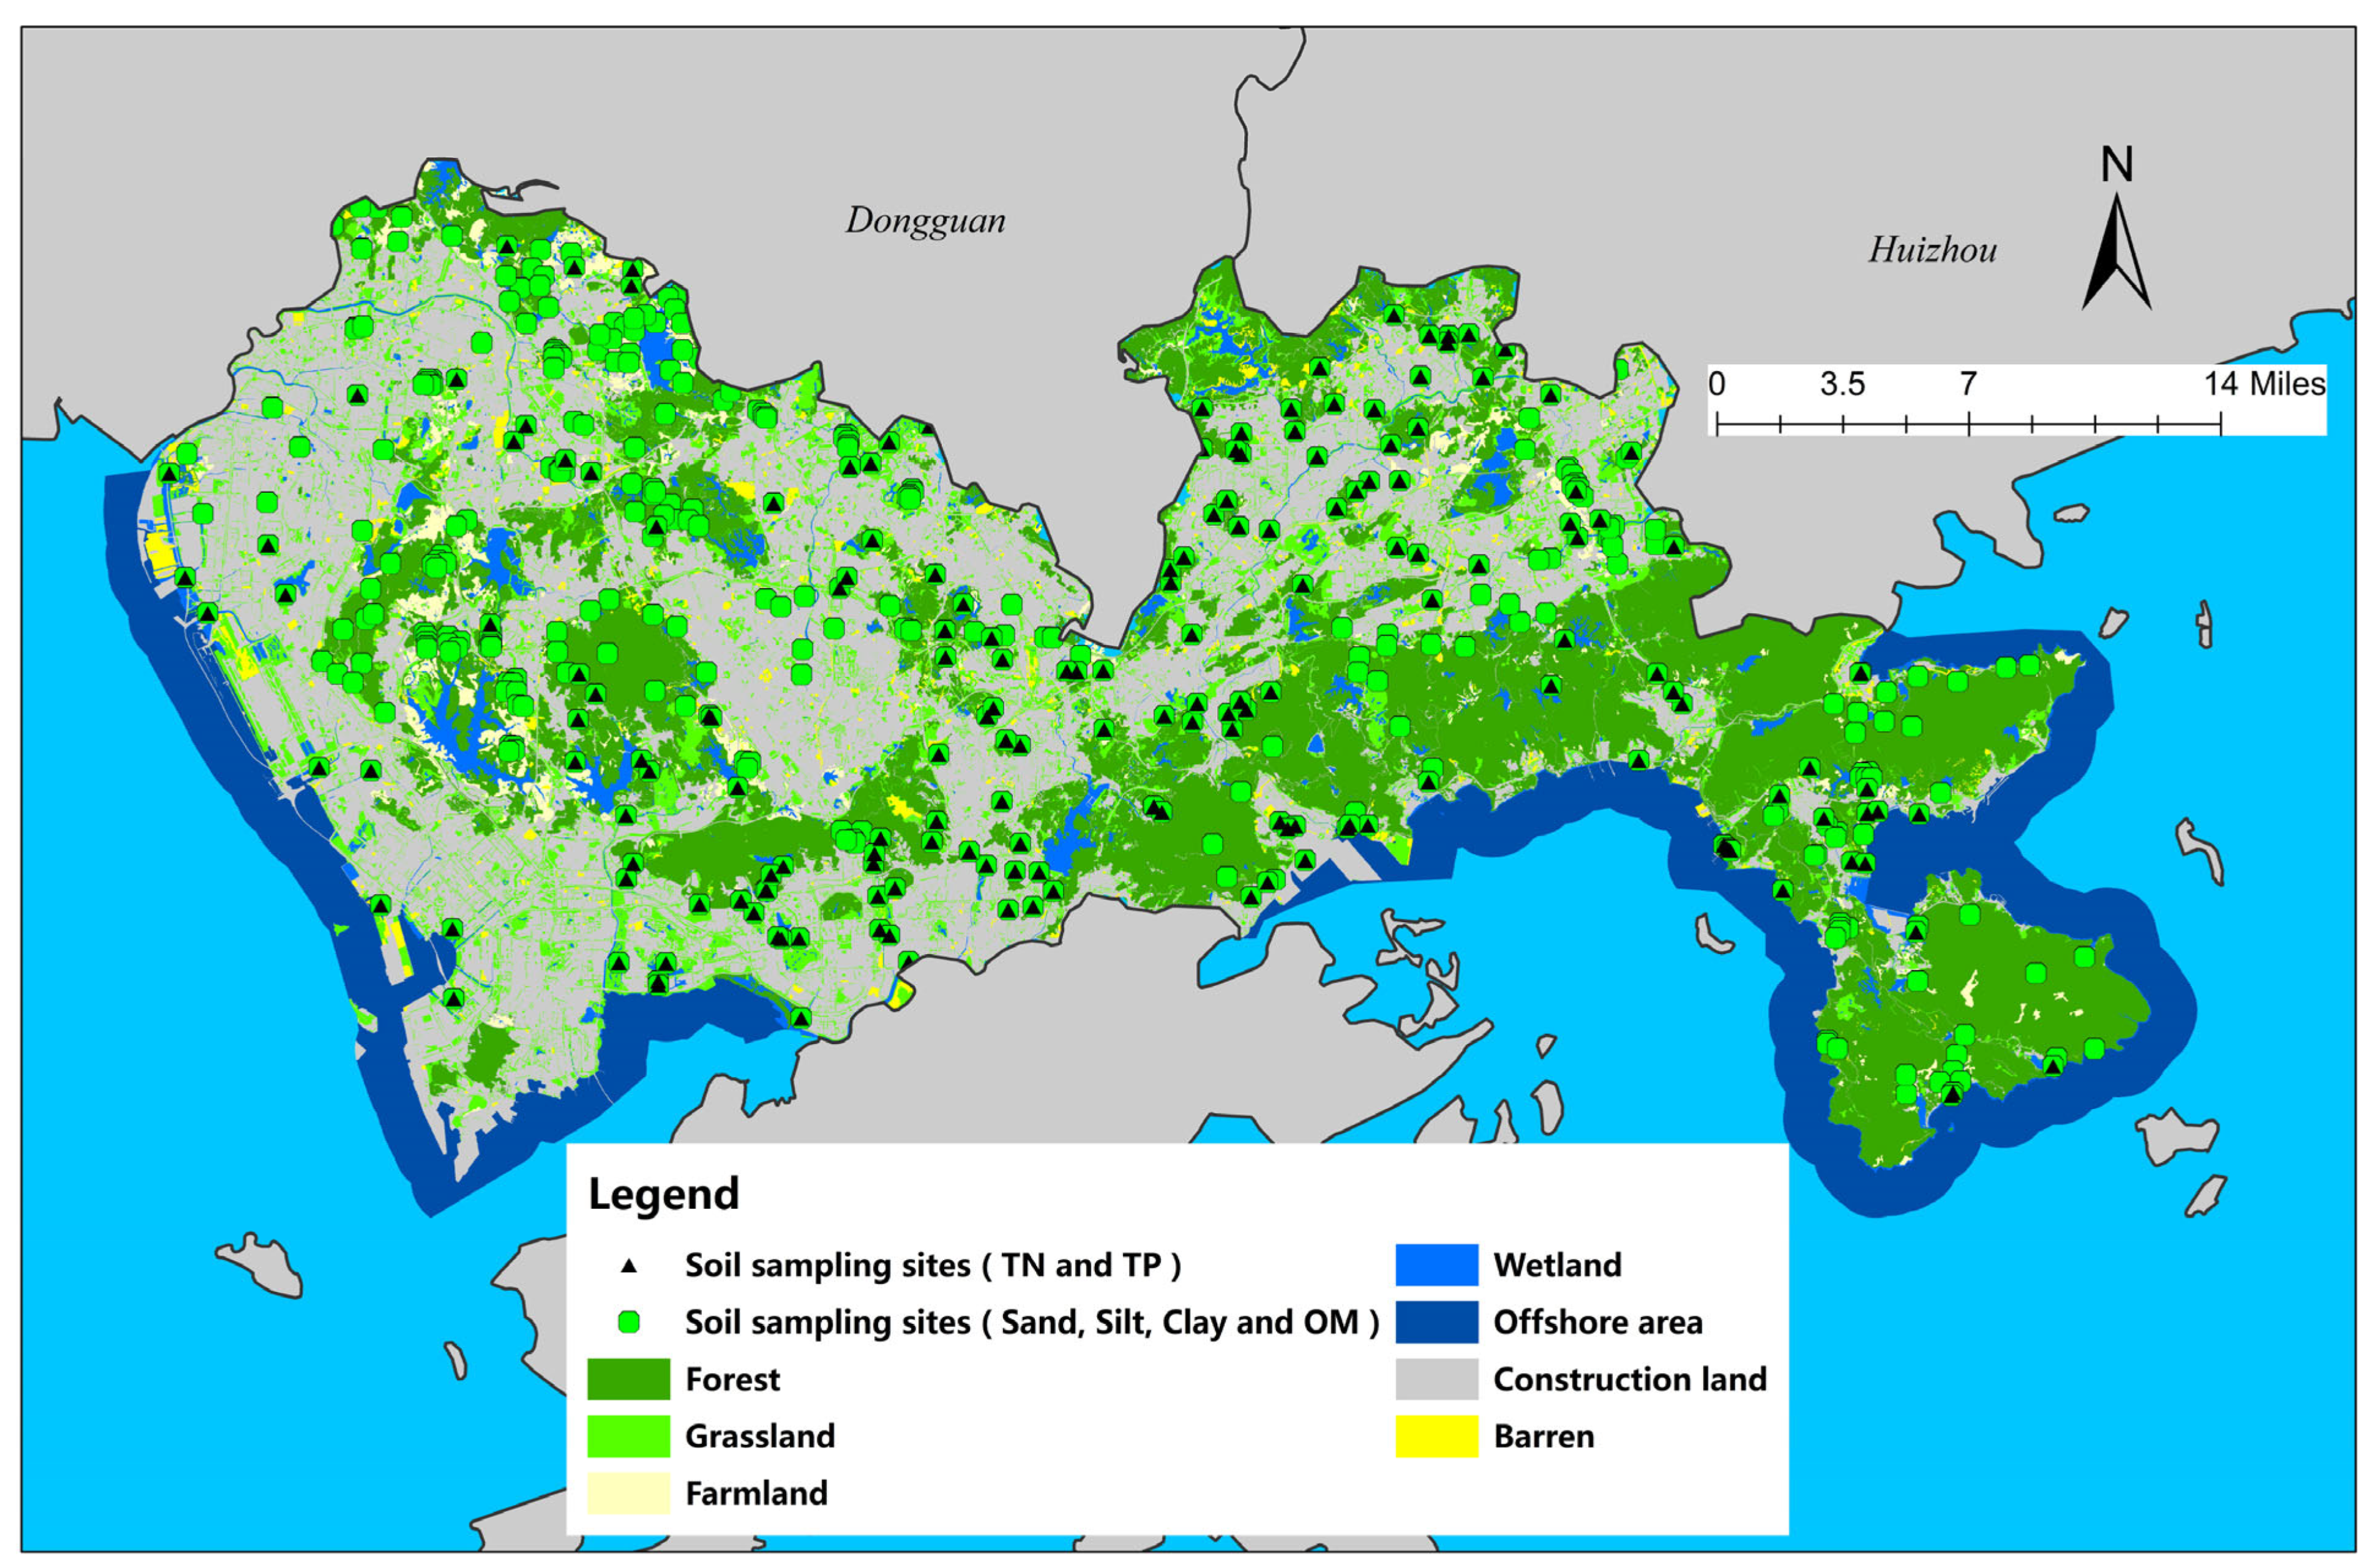
2.2. Collection and Testing Methods of Soil Samples

At the city district scale, ArcGIS (Environmental Systems Research Institute, RedLands, CA, USA) was used to generate random points on different ecosystem types, considering the conditions of vegetation, topography, and climatic characteristics, as shown in Figure 2. Specifically, 451 points were selected for investigating and testing soil clay, silt, sand, and organic matter content, while 185 points were chosen for examining and testing the total soil phosphorus and nitrogen content, which is a significant increase in density compared with the traditional soil sampling point setup. To collect soil samples, the researchers removed topsoil weeds, then scooped up a 20 cm soil sample with a shovel, packaged it immediately, and sent it to the lab the same day for testing.
Soil particle composition/mechanical composition tests are carried out in accordance with the Forestry Industry Standard of the People’s Republic of China for the Determination of Forest Soil Particle Composition (Mechanical Composition) LY/T 1225-1999 [41]. Soil organic matter is tested in accordance with “Soil Testing Part 6: Determination of Soil Organic Matter” NY/T 1121.6-2006 [42]. The determination of the total phosphorus in soils follows the “Determination of total phosphorus in soils: alkali fusion—molybdenum antimony anti-spectrophotometric method” HJ 632-2011 [43]. The detection of total soil nitrogen follows the “Kjeldahl method for the determination of total nitrogen by soil quality” HJ 717-2014 [44].

2.3. Methods for Mapping Soil Properties

Numerous methods exist for spatializing soil texture and contaminants. In this paper, the Kriging method of geostatistical methods in ArcGIS is employed for interpolation. Kriging is the most widely used and typical interpolation method in geostatistics and contains several types given that both ordinary Kriging (OK) and universal Kriging (UK) among them ignore the relationship between soil properties and their environmental components, whereas co-Kriging can combine soil predictor variables with environmental auxiliary variables for unbiased optimal estimation [45,46]. Consequently, this paper utilizes co-Kriging in combination with environmental variables for the interpolation of soil properties. In addition, log-ratio conversion methods, commonly used to address closure effects and the statistical analysis of component data during interpolation, are referenced in this study [47].
Environmental variables can directly or indirectly reflect geochemical cycling processes, such as soil occurrence, surface runoff, leaching, and vegetation distribution. These processes subsequently influence soil texture characteristics and nutrient spatial distribution, so combining auxiliary variables is one of the most important tools to improve the accuracy of interpolation, especially at the urban scale. This study uses both continuous and categorical variables to enhance the rationality of the spatial distribution in the mapping results. Continuous variables include elevation (Ele), slope (Slo), aspect (Asp), general curvature (GC), plan curvature (PLC), profile curvature (PRC), tangential curvature (TC), longitudinal curvature (LC), cross-sectional curvature (CSC), flow line curvature (FLC), LS factor (LSF), flow accumulation (FA), the topographic wetness index (TWI), the wind exposition index (WEI), and the normalized difference vegetation index (NDVI) [48,49,50,51,52]. All the continuous variables were extracted by using SAGA GIS software (Department of Physical Geography, University of Göttingen, Göttingen, Sachsen, Germany) that is based on DEM, and the categorical variables included the type of land use in which the monitoring sites were located.

2.4. Methods for the Assessment of Surface Source Pollution Reduction Services

The modified general soil loss equation proposed by Wischmeier et al. [53] was used to account for city-wide soil retention. Next, the soil retention was multiplied by the content factors of nutrients such as nitrogen and phosphorus in the soil [54] to calculate the physical quantity of surface source reduction services. The equation is shown below. See Equations (1) and (2):
Q d p b i = Q s r × c j
Q s r = i = 1 n R i × K i × L i × S i × 1 C i × A i × 10 2
where Q d p b i is the amount of type i surface source pollution reduced by the ecosystem (t/a); Q s r is the soil retention (t/a); j is the number of nutrient species in the soil; c j is the pure content of nitrogen and phosphorus in the soil (%); A i is the area of ecosystem i (km2); i is the ecosystem type, i = 1, 2, 3, …, n ; n is the number of ecosystems; R i is the rainfall erosivity factor for ecosystem i (MJ·mm·hm−2·h−1·a−1); K i is the soil erodibility factor of ecosystem i (t·hm2·h·hm−2·MJ−1·mm−1); L i is the slope length factor of ecosystem i (dimensionless); S i is the slope factor of ecosystem i (dimensionless); and C i is the vegetation cover factor of ecosystem i (dimensionless).

2.5. Methods for the Study of Drivers for Surface Source Pollution Reduction Services

The GeoDetector (Institute of Geographical Sciences and Natural Resources, Chinese Academy of Sciences, Beijing, China) is a set of statistical methods designed to detect spatial heterogeneity and reveal the driving forces behind it. The core idea is based on the assumption that if an independent variable has a significant effect on a dependent variable, then the spatial distribution of the independent and dependent variables should be similar [55,56]. In this paper, we conducted a study on the drivers of the spatial distribution of surface source reduction services in Shenzhen’s ecological space by using GeoDetector, taking into account five major potential influences: climate, soil properties, topography, habitat quality, and ecosystem type (as shown in Table 1). Because GeoDetector requires categorical variables as inputs during operation, we have converted all the continuous input data into 5-level categorical input data by using the natural breakpoint method, before inputting the data.The GeoDetector consists of four components: (1) divergence and factor detection, (2) interaction detection, (3) risk zone detection, and (4) ecological detection, with detailed formulae taken from Dr. Jinfeng Wang’s research paper [56]. This study uses the “divergence and factor detection” and “interaction detection” sections, as introduced below.
(1)
Divergence and factor detection are used to detect the spatial heterogeneity of the dependent variable and to detect the extent to which an independent variable explains the spatial divergence of the dependent variable.
(2)
Interaction detection is used to assess the degree of influence from different driver factors combined on the dependent variable. There are five types of two-factor interactions. If the two-factor interaction q-value is less than any single-factor q-value, then it is nonlinearly attenuated; if the two-factor interaction q-value is between two single-factor q-values, then it is one-factor nonlinearly attenuated; if the two-factor interaction q-value is greater than any single-factor q-value, then it is two-factor enhanced; if the two-factor interaction q-value is equal to the sum of two single-factor q-values, then it is independent; and if the two-factor interaction q-value is greater than the sum of two single-factor q-values, then it is nonlinearly enhanced.

3. Results

3.1. Spatial Characteristics of Soil Properties

3.1.1. Accuracy Testing

Co-Kriging (CK) interpolation was evaluated by using a cross-validation method. Its valuation accuracy is assessed according to the following criteria: (1) the absolute value of the mean error (ME) is close to 0; (2) the standardized mean error (MSE) is close to 0; (3) the mean standard error (ASE) is closest to the root mean square error (RMSE); and (4) the standardized root mean square error (RMSSE) is closest to 1. As can be seen from Table 2, the relevant data all met the judgment criteria, indicating that all soil property indicators were interpolated well. The interpolation accuracy of this study is also better than that of previous research [57,58,59,60]. For example, Chen Lu et al. [57] obtained an ME of 0.09, an MSE of −0.04, and an RMSSE of 1.19 when interpolating soil particle size in the suburbs of Tianjin, China.

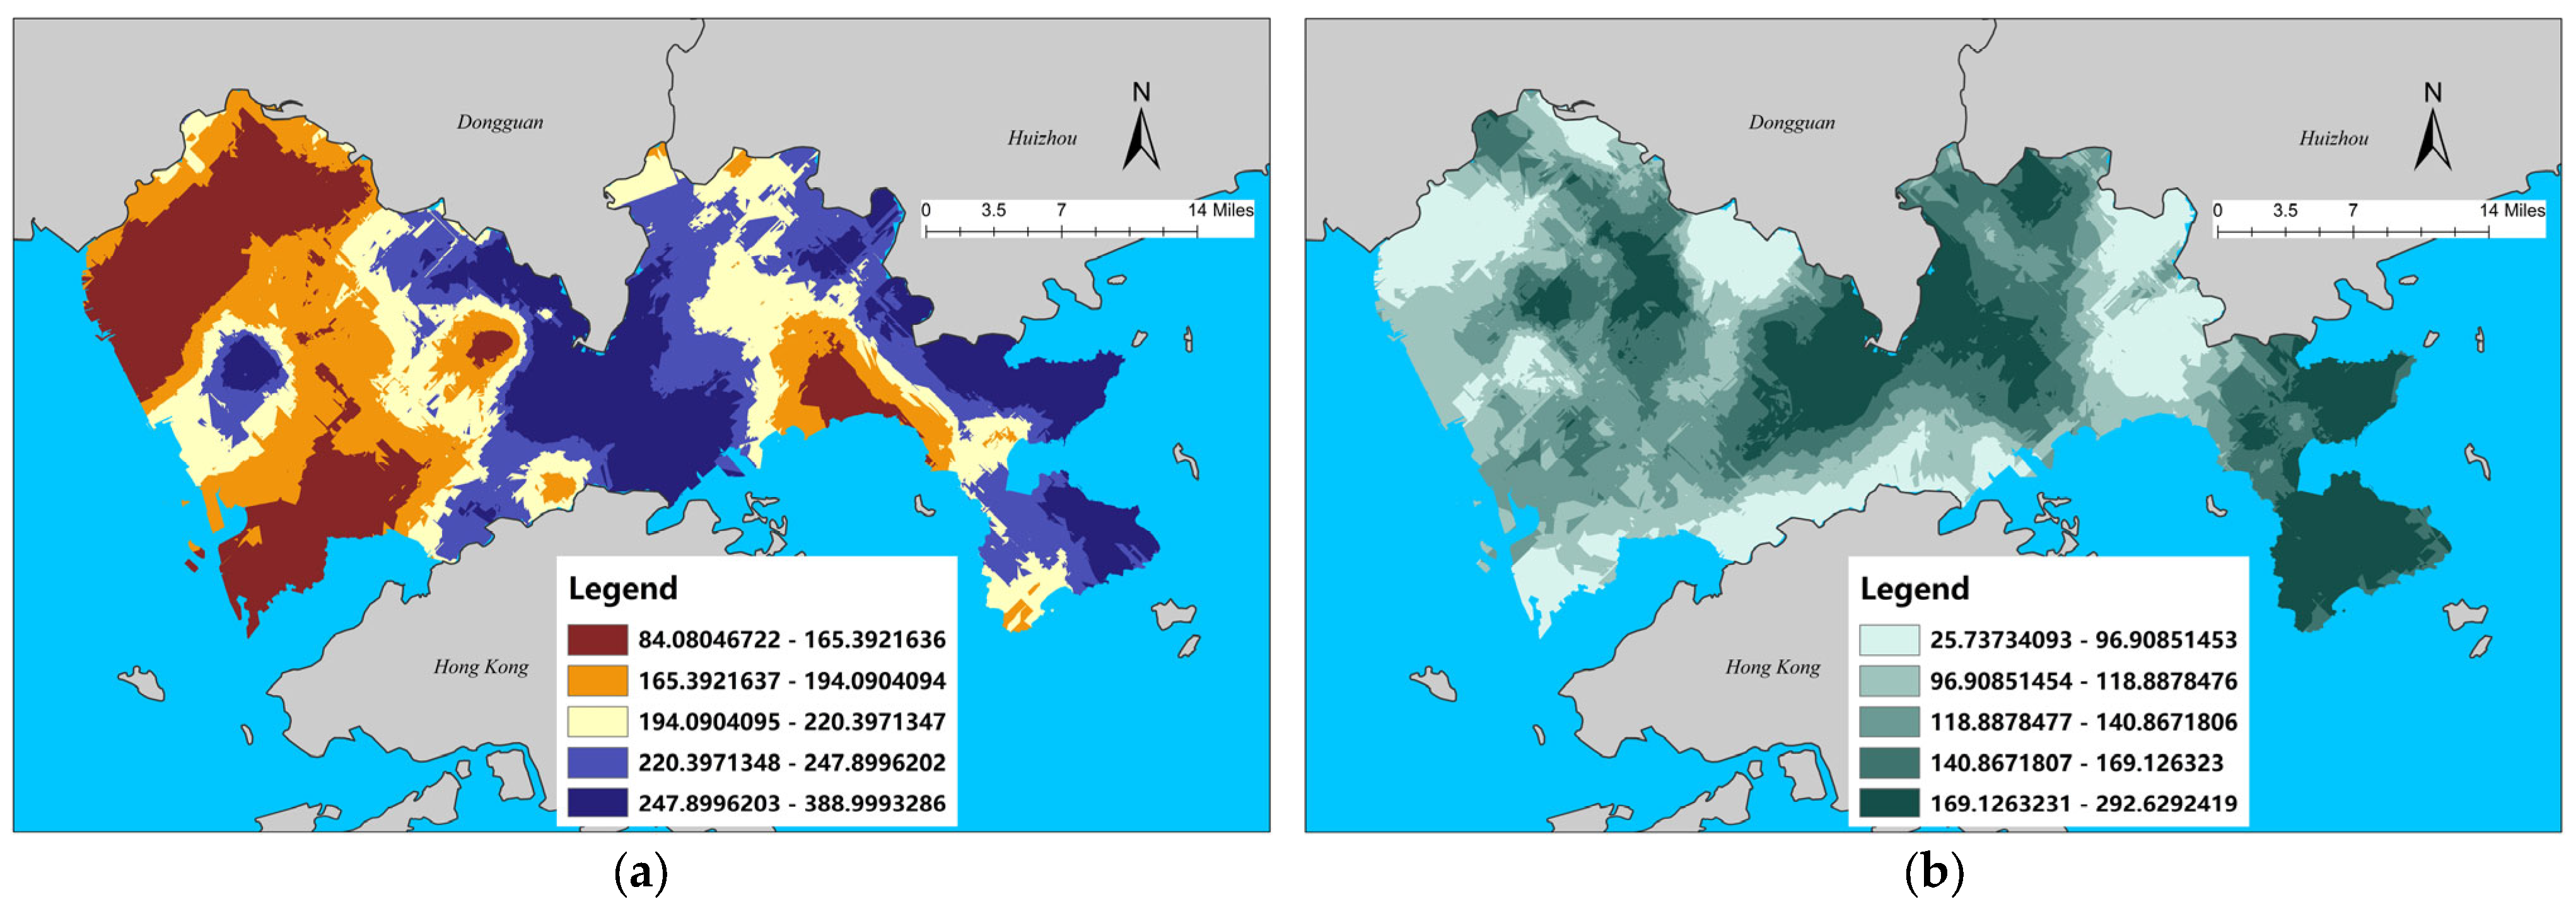
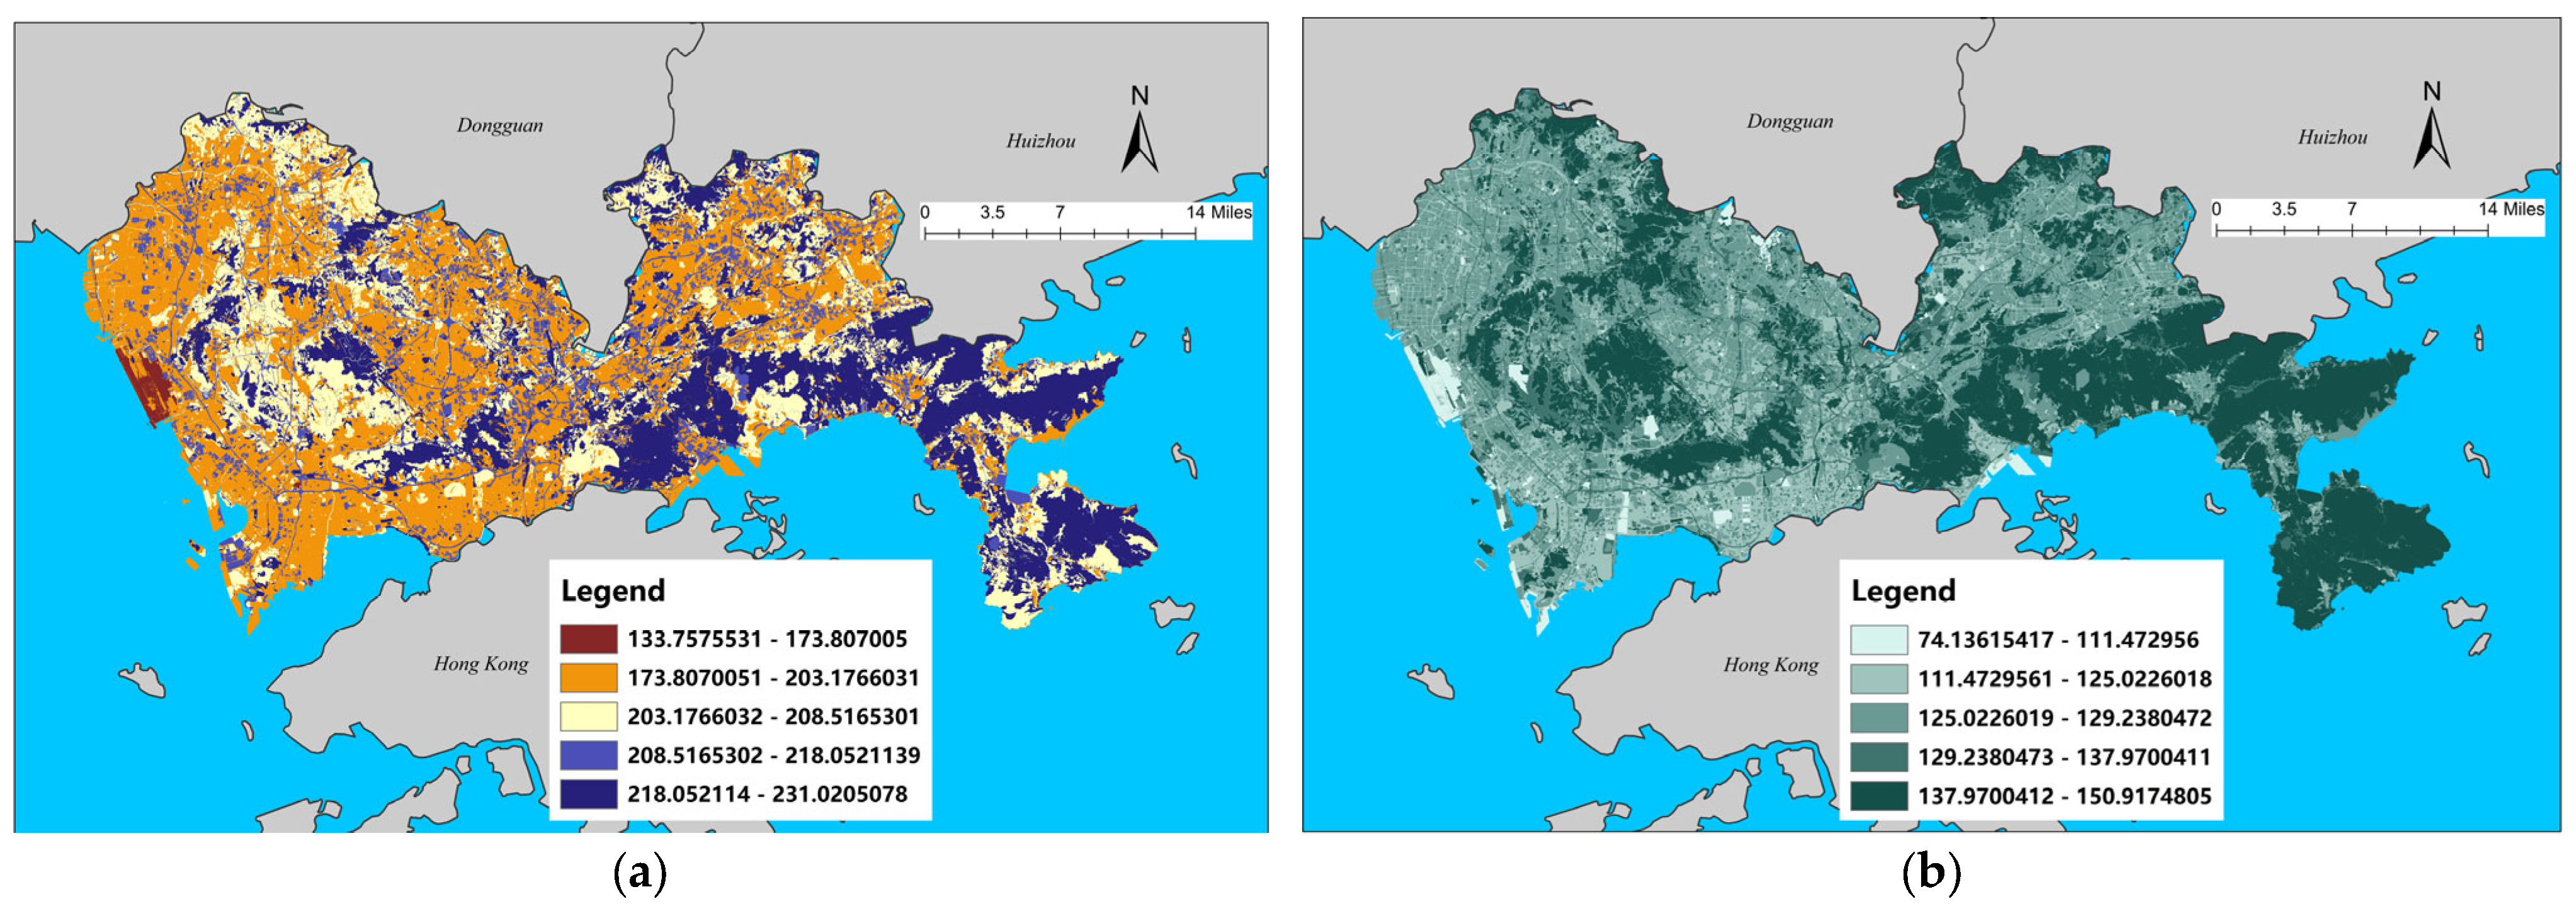
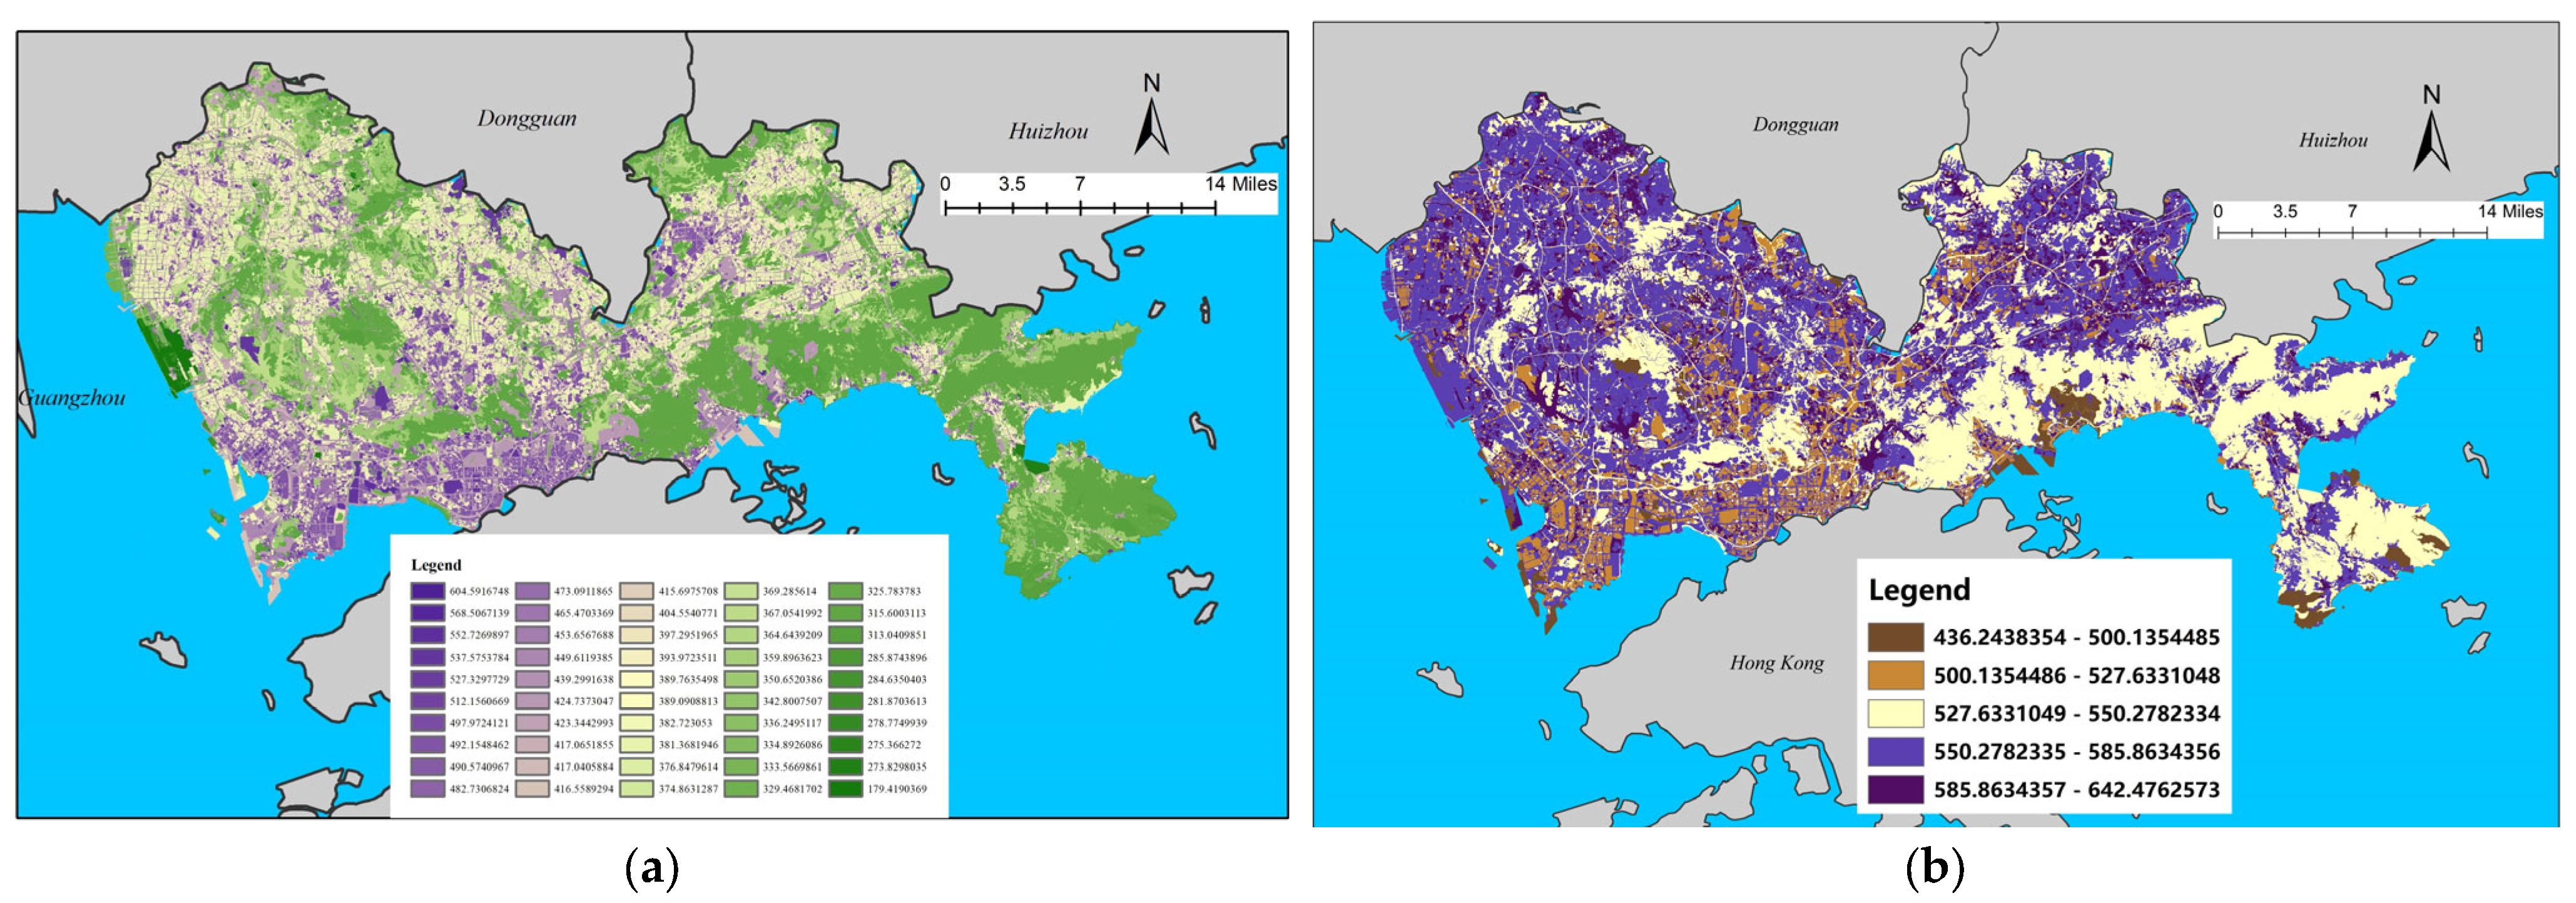
3.1.2. Spatial Distribution Characteristics of Soil Particle Size and Organic Matter

The areas with high silt content in Shenzhen are located in the central and eastern parts of the city, as shown in Figure 3a. The respective areas of high-content areas in Longgang District, Yantian District, Dapeng New District, and Longhua District are relatively large. The mean value of silt particle content was higher in the Yantian, Longgang, and Luohu districts, at 262.04 g/kg, 242.97 g/kg, and 238.15 g/kg, respectively, and lower in the Nanshan and Guangming districts (see Table S1). In terms of land types, the city’s press and publication land, dry land, forested land, and railway land had higher mean values, of 231.02 g/kg, 230.22 g/kg, 226.96 g/kg and 224.72 g/kg, respectively, while pastureland, scenic facilities land, business and financial land, and airport land had lower mean values, as shown in Figure 4a and Table S2.
The areas with high clay content in Shenzhen are in the central and southeastern parts of the city, as shown in Figure 3b. Longgang District, Dapeng New District, and Guangming District each have a relatively large area of high-content areas. The mean values of clay content were higher in the Dapeng and Longgang districts at 169.06 g/kg and 165.02 g/kg, respectively, and lower in the Nanshan and Guangming districts (see Table S1). In terms of land types, the city’s paddy fields, agricultural land for facilities, shrublands, and forested land had higher mean values, of 150.92 g/kg, 150.91 g/kg, 148.59 g/kg, and 147.49 g/kg, respectively. The mean values for pastureland; port and terminal land; cultural, sports, and recreational land; and airport land were lower, as shown in Figure 4b and Table S2.
The areas with high sand content in Shenzhen are located in the west, southwest. and northwest of the city, as shown in Figure 5a. The respective areas of high-content areas in the Baoan, Nanshan, Guangming, and Futian districts are relatively large. The mean values of sand content were higher in Nanshan District and Baoan District, at 714.76 g/kg and 668.84 g/kg, respectively. On the other hand, the values were lower in Longgang District and Dapeng New District (see Supplementary Table S1). In terms of land types, the city’s port and terminal land, natural grazing land, airport land, and business and financial land have higher mean values of sand content, at 722.98 g/kg, 721.28 g/kg, 707.71 g/kg, and 673.04 g/kg, respectively. Agricultural land for facilities, dry land, forested land, and railway land have lower mean values, as shown in Figure 6a and Table S2.
The areas with high soil organic matter content in Shenzhen are in the northwest and southeast of the city, as shown in Figure 5b. Guangming District, Longhua District, Baoan District, Dapeng New District, and Pingshan District each have a relatively large area of high-content areas. The mean organic matter content was higher in Guangming District and Baoan District, at 139.81 g/kg and 122.83 g/kg, respectively. Meanwhile, the content was lower in Luohu District, Nanshan District, Futian District, and Longgang District (see Table S1). In terms of each land type, the city’s artificial grazing land, watered land, paddy fields, and inland mudflats had higher mean values of organic matter, at 153.86 g/kg, 130.91 g/kg, 122.62 g/kg, and 117.53 g/kg, respectively. Port terminal land, airport land, tea plantations, and natural grazing land, however, had lower mean values, as shown in Figure 6b and Table S2.

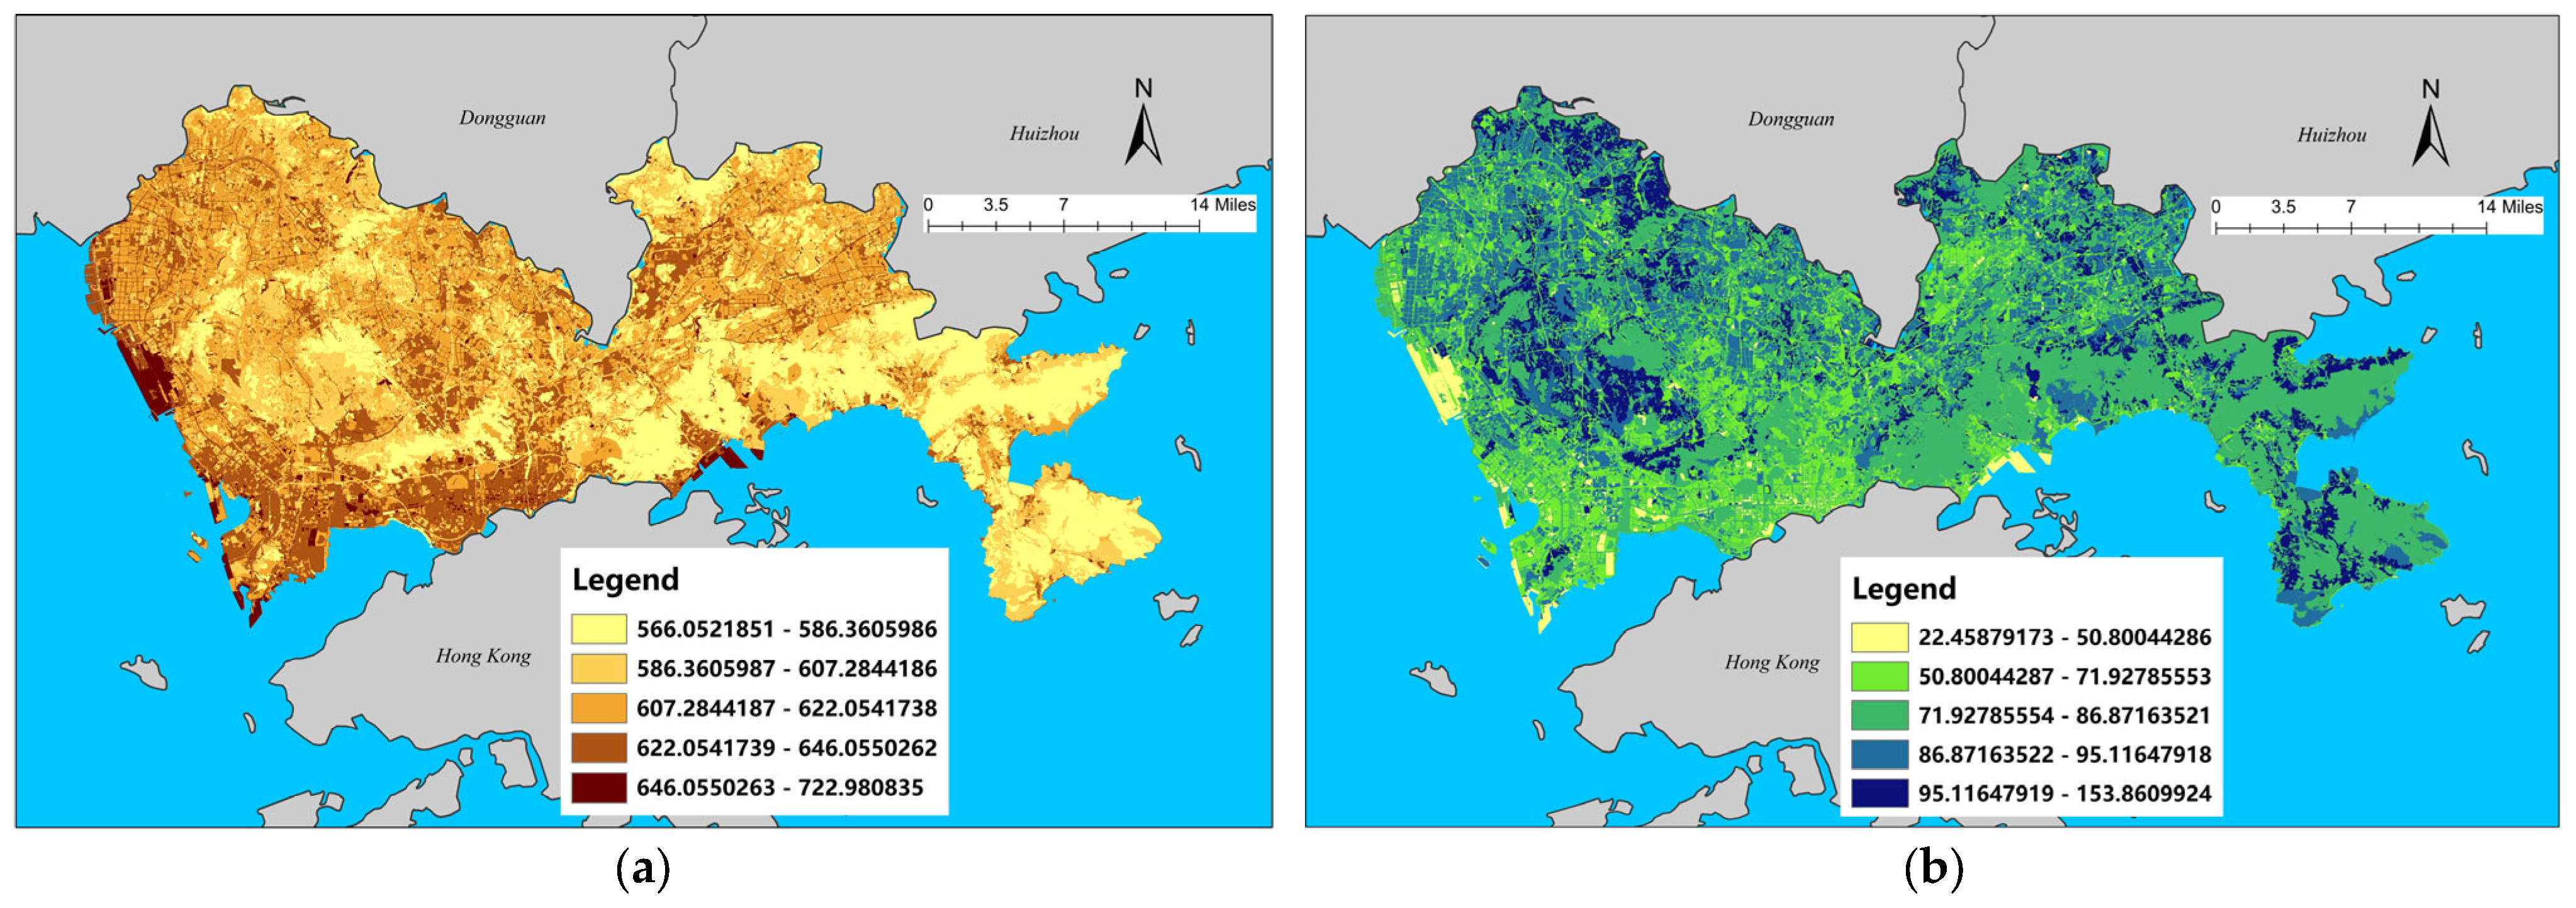
3.1.3. Spatial Distribution Characteristics of Soil Contaminant Content

The areas with high total soil nitrogen content in Shenzhen are in the central and western parts of the city, as shown in Figure 7a. Futian District, Nanshan District, and Longhua District each have a relatively large area of high-content areas. The mean values of total soil nitrogen in Futian District and Longhua District were higher, at 737.90 mg/kg and 613.46 mg/kg, respectively, while Dapeng New District and Baoan District were lower (see Table S1). The mean values of the total soil nitrogen in the city were higher in natural pastureland and at correctional sites and scenic sites, at 604.59 mg/kg, 568.51 mg/kg, and 552.73 mg/kg, respectively. Lower values were found at airport sites and agricultural facilities and in tea gardens and artificial pastureland, as shown in Figure 8a and Table S2.
The areas with high levels of total soil phosphorus in Shenzhen are in the northeast, as shown in Figure 7b. Longgang District and Pingshan District each have a relatively large area of high-content areas. The mean values of total phosphorus in Pingshan District and Longgang District were higher, at 967.57 mg/kg and 602.09 mg/kg, respectively. Lower values were observed in Longhua District, Dapeng New District, and Guangming District (see Table S1). The mean values of total soil phosphorus were higher in rivers, reservoirs, correctional sites, vacant land, and watered land, at 642.48 mg/kg, 635.21 mg/kg, 633.56 mg/kg, 610.28 mg/kg, and 603.78 mg/kg, respectively, while the mean values were lower in tea gardens, artificial pastureland, natural pastureland, and coastal mudflats, as shown in Figure 8b and Table S2.

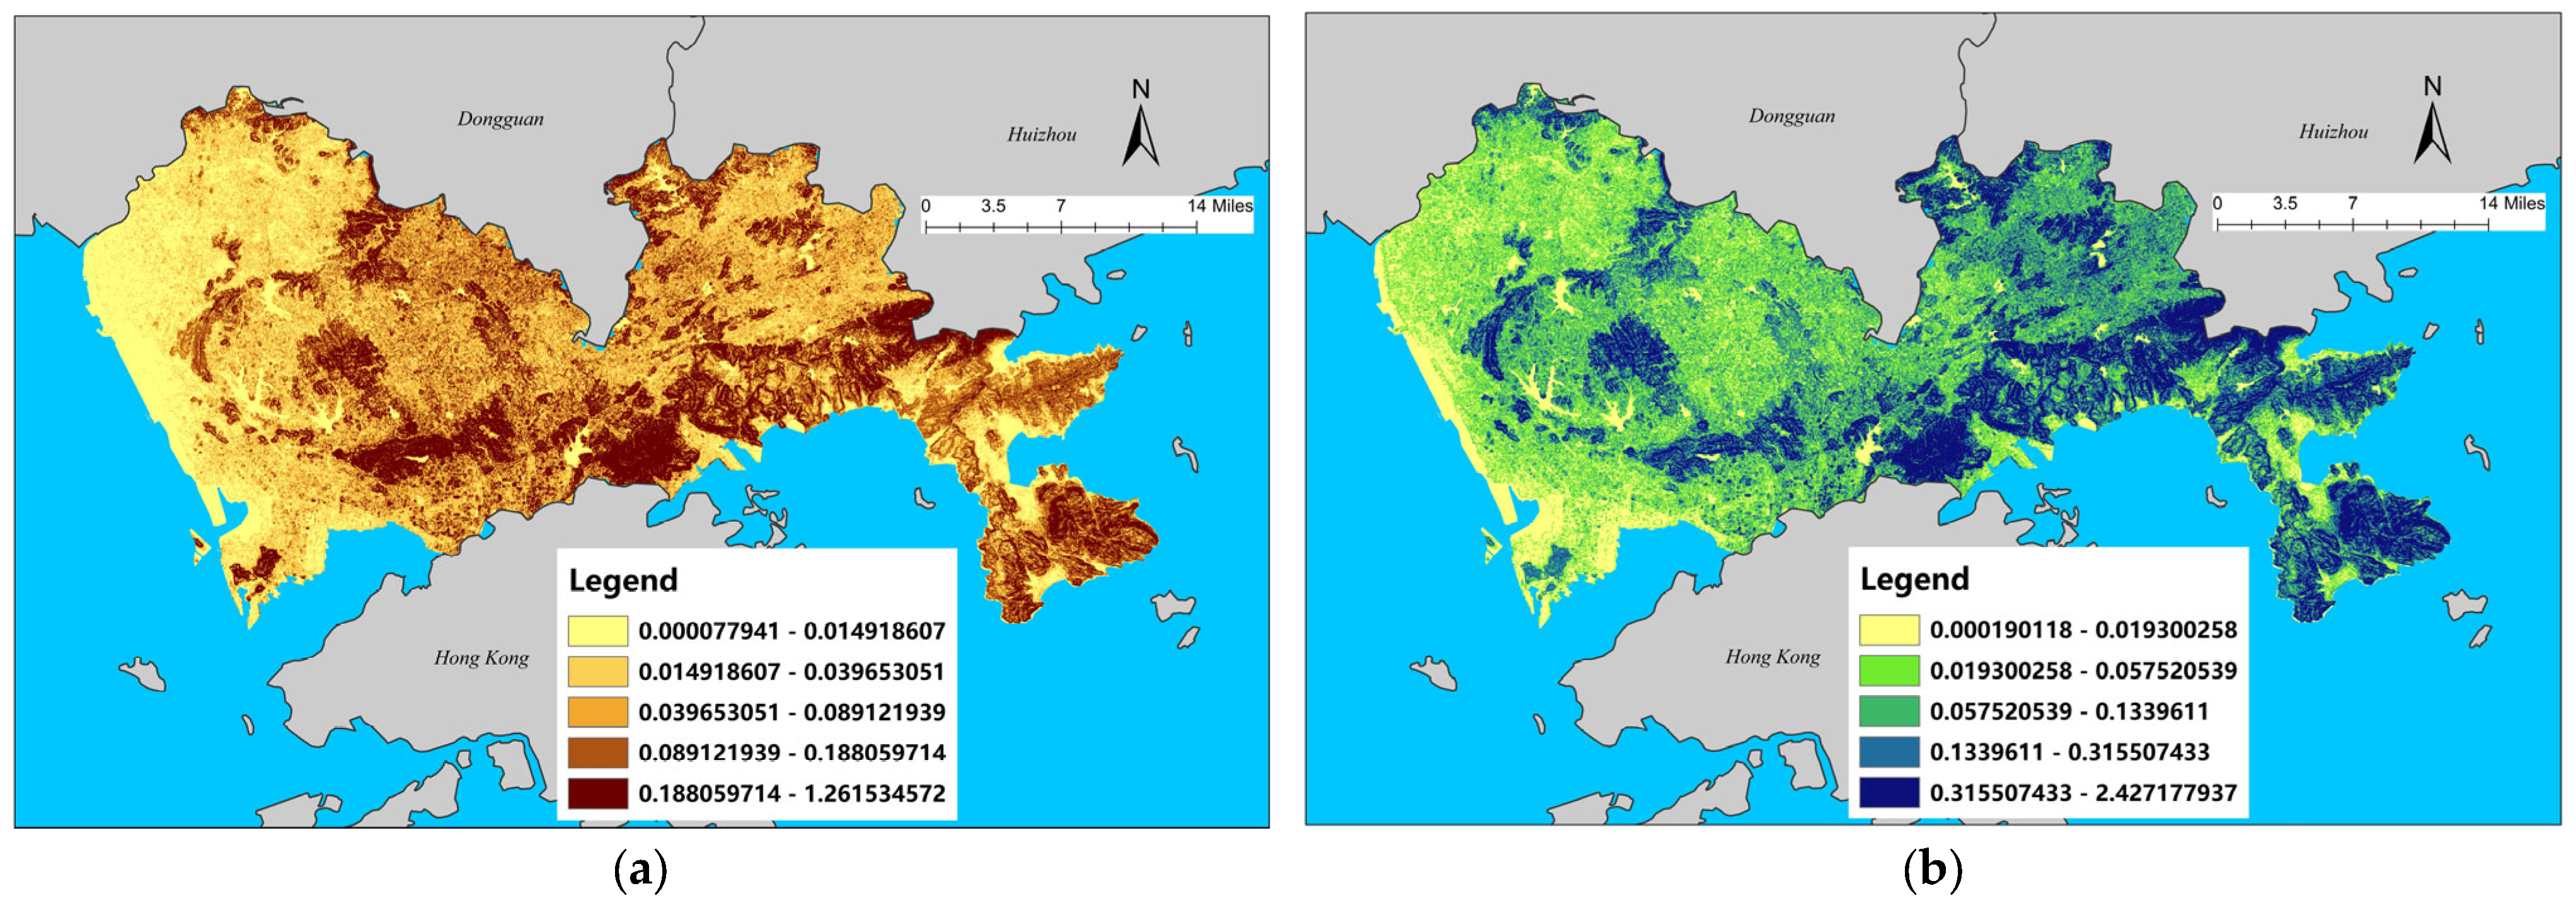
3.2. Results of Surface Source Pollution Reduction Services

The areas with a higher supply of surface source reduction services in Shenzhen are distributed in the contiguous mountains with better vegetation cover conditions, along Dapeng New District–Pingshan District–Yantian District–Luohu District, followed by the Tanglang Mountain, Fenghuang Mountain, and Yangtai Mountain areas in the east (see Figure 9). Longgang District and Dapeng New District had higher physical quantities of TN service and TP service for surface source reduction, reaching 4399.80 t and 3247.69 t and reaching 7043.18 t and 7296.23 t, respectively, while Futian District and Guangming District had lower physical quantities of the two indicators (see Table S3). In terms of supply intensity, the Luohu, Yantian, and Futian districts have higher service averages for TN reduction from surface sources, at 0.26 t/hm2, 0.20 t/hm2, and 0.17 t/hm2, respectively. The Pingshan, Yantian, and Luohu districts have higher service averages for TP reduction from surface sources, at 0.30 t/hm2, 0.28 t/hm2, and 0.28 t/hm2, respectively.

3.3. Analysis of the Factors Influencing Surface Source Pollution Reduction Services

In this study, a driver analysis of surface source reduction services was carried out to determine the city’s main land-use types of forest land, industrial land, and street town residential land (the cumulative land area accounts for 50.26% of the city’s land area). The land-use classification data of Shenzhen City comes from the Shenzhen Land Ecological Survey Project. These data divide the city’s land into 50 types of land use, and all types of land use can be seen in Table S2. The study fully considered five major factors, namely climate, soil properties, topography, habitat quality, and ecosystem type, with 11 potential drivers, and the results are shown in Table S4. The results of the study can provide guidance for environmental-management-oriented service enhancement measures for surface source reduction.

3.3.1. Forest Land

The spatial distribution of surface source TN reduction services on forested land is influenced mainly by the slope factor, vegetation normalization index, and elevation in the region. Table S4 shows that the q-statistics of each driver are ranked in descending order as the slope, vegetation normalization index, elevation, precipitation, net primary productivity, ecosystem type, sand content, organic matter content, sticky grain content, annual mean temperature, and silt content. In addition, some factors, such as precipitation, net primary productivity, ecosystem type, and sand content, also positively influence the formation of spatial variation in TN reduction services, while other factors with small q-values have little explanatory power (q-values below 10%) [61,62,63,64,65].
Similar to surface source TN reduction services, the spatial distribution of surface source TP reduction services on forested land is also influenced mainly by the slope factor, vegetation normalized index, and elevation within the area. As seen in Table S4, the q-statistics of the drivers are, in descending order, the slope, vegetation normalized index, elevation, precipitation, ecosystem type, net primary productivity, sand content, mean annual temperature, clay content, meal content, and organic matter content, and again, the slope factor, vegetation normalized index, and elevation have the greatest influence on the spatial variation of TP reduction services on forested land. Other influencing factors, such as precipitation, ecosystem type, net primary productivity, sand content, and annual mean temperature, also positively affect the formation of spatial differences in TN reduction services. Compared with the TN reduction services, the annual mean temperature also showed a greater influence, and the influence of ecosystem type was stronger than that of net primary productivity. Other factors with small q-values have less explanatory power (q-values below 10%) [61,62,63,64,65].
The results of the two-factor interaction detection of source reduction services (TN and TP) on forested land are shown in Figures S1 and S2, respectively. The interaction between the drivers showed a two-factor enhancement or nonlinear enhancement; i.e., the interaction of any two drivers on the spatial variance of the forested ground source reduction services (TN and TP) was greater than the effect of one driver alone, indicating that the spatial variance of the forested ground source reduction services (TN and TP) was affected by the joint effect of the drivers. There are more nonlinearly enhanced relationships between the factors of the TN reduction services than the TP reduction services, indicating that the joint effect between different factors has a greater impact on the spatial variation of the TN reduction services; the joint effect between the same pair of factors has a different impact on the TN reduction services and the TP reduction services.

3.3.2. Industrial Land

The main drivers of spatial distribution for both TN reduction services and TP reduction services on industrial land are the same: the vegetation normalized index, slope, and data elevation. As shown in Table S4, the q-statistics of the drivers of TN reduction services are ranked in descending order as the vegetation normalized index, slope, data elevation, precipitation, ecosystem type, net primary productivity, sand content, silt content, annual mean temperature, organic matter content, and clay content. Among them, the vegetation normalized index, slope, and data elevation have the greatest influence on the spatial variation of TN reduction services on industrial land. In addition, other influencing factors, such as precipitation, ecosystem type, net primary productivity, and sand content, positively affect the formation of spatial variation in TN reduction services from surface sources, while other factors with small q-values do not have strong explanatory power (q-values below 10%) [61,62,63,64,65].
The order of the q-statistics of the drivers of the TP reduction services is similar to that of the TN reduction services, with only silt content and mean annual temperature changing in order. Similarly, the vegetation normalized index, slope, and data elevation had the greatest influence on the spatial variation of TP reduction services on industrial land. Additionally, other factors, such as precipitation, ecosystem type, net primary productivity, sand content, and mean annual temperature, positively influence the formation of spatial variation in TP reduction services, while other factors with small q-values have little explanatory power [61,62,63,64,65].
The results of the two-factor interaction detection for surface source reduction services (TN and TP) on industrial land are shown in Figures S3 and S4, respectively. The interaction between the drivers also shows a two-factor enhancement or nonlinear enhancement, and the spatial differentiation of surface source reduction services (TN and TP) on industrial land is affected by the combined effect of the drivers. There were more nonlinearly enhanced relationships between the factors for the TP reduction services service than for the TN reduction services, suggesting that the joint effect between different factors had a greater impact on the spatial variance of the TP reduction services. There are differences in the effects of the same pair of factors on the TN reduction services and the TP reduction services.

3.3.3. Street and Town Residential Land

The main drivers of the spatial distribution of TN reduction services and TP reduction services on street and town residential land are the same, both being the vegetation normalized index, slope, and elevation. As can be seen from Table S4, the q-statistics of the drivers of the TN service are, in descending order, the vegetation normalized index, slope, elevation, precipitation, ecosystem type, net primary productivity, sand content, mean annual temperature, organic matter content, silt content, and clay content. Among them, the vegetation normalization index, slope, and elevation have the greatest influence on the spatial variation of TN reduction services on street and town residential land. In addition, other factors, such as precipitation, ecosystem type, net primary productivity, sand content, and annual mean temperature, positively influence the formation of spatial variation in TN reduction services. Other factors with small q-values do not have strong explanatory power (q-values below 10%) [61,62,63,64,65].
Similar to the TN reduction services, the q-statistics of the drivers of the TP reduction services on street and town residential land are, in descending order, the vegetation normalized index, slope, elevation, ecosystem type, precipitation, net primary productivity, sand content, mean annual temperature, silt content, organic matter content, and clay content. Similarly, the vegetation normalized index, slope, and elevation had the greatest influence on the spatial variation of TP reduction services on street and town residential land. In addition, other influencing factors, such as precipitation, ecosystem type, net primary productivity, sand content, and annual mean temperature, positively affect the formation of spatial variation in TP reduction services. Other factors with small q-values do not have strong explanatory power (q-values below 10%) [61,62,63,64,65].
The results of the two-factor interaction detection for the surface source reduction services (TN and TP) on street and town residential land are shown in Figures S5 and S6, respectively. The interaction between the drivers shows a two-factor enhancement or nonlinear enhancement, indicating that the spatial variation of the surface source reduction services (TN and TP) on residential land in streets and lanes is affected by the joint action of the drivers. The nonlinearly enhanced relationship between the factors of the TP reduction services is comparable to the number of TN reduction services. There are also differences in the effects of the joint action between the same pair of factors on TN reduction services and TP reduction services; e.g., the joint action of the X1 and X2 factors is nonlinearly enhanced in relation to the spatial distribution of TN reduction services, while it is bifactorally enhanced in relation to the spatial distribution of TP reduction services.

4. Discussion

4.1. Soil Attribute Mapping Based on Multipoint Monitoring Data Provides Better Data Support for Relevant Research and Management Applications

The traditional accounting of surface source reduction services, which relies on the modified universal soil loss equation, primarily uses public data sets, such as the HWSD global soil data [66,67,68], to determine the physical and chemical properties of soil. However, the public data sets have the disadvantages of low resolution and insufficient localization, making it difficult for them to reflect the actual spatial distribution of soil properties in the study area. In this study, 451 survey and testing points for soil clay, silt, sand, and organic matter content and 185 points for total phosphorus and total nitrogen content were selected across various ecosystem types within each administrative region of the city. This significantly increased density compared with traditional soil sampling points. At the same time, the co-Kriging spatial interpolation method, combined with a series of environmental auxiliary variables, has significantly improved the final spatial interpolation accuracy, and the interpolation results have passed cross-validation and are more accurate than the results of existing studies [57,58,59,60]. The highly localized, refined, and accurate spatial mapping results of soil properties also provide strong data support for relevant research and management application scenarios based on such data, guaranteeing the scientific soundness and rationality of subsequent results and applications.

4.2. The Distribution Characteristics of the Different Properties of the Soil Show Significant Differences across the City

The spatial distribution of soil sand, clay, silt, organic matter, and total phosphorus and nitrogen content in the city is significantly different thanks to the combined influence of soil parent material and external environmental factors. In terms of the overall distribution, the areas with high soil silt content are mainly in the eastern part of the city in the area of Qiniang Mountain and Paiya Mountain, in the central part of the city from Wutong Mountain to Qiushuiding, and in the western part of the city from Fenghuang Mountain to Tie Gang Reservoir. The areas with low soil silt content are mainly in the southern part of Nanshan District, the northwestern part of Bao’an District, the northern part of Guangming District, and the Maluan Mountain area in the western part of the city. Areas with high soil clay content are mainly in the Dapeng Peninsula, from Qiniang Mountain to Paiya Mountain, and from Qiushuiding to Shenxianling Reservoir, while areas with low content are distributed in the southern part of the city, in the northwestern part of Bao’an District, and in the northeastern part of Pingshan District. The areas with high sand content are mainly in the Western International Convention and Exhibition Centre area, the Nanshan Park area, and the Ma Luangshan area, while the lower content areas are in large areas of mountainous woodland on the Dapeng Peninsula and in a large area centered on Qiushui Ding in Longgang District. The areas with high soil organic matter content are mainly in the Paiya Mountain and Paogou Mountain areas on the Dapeng Peninsula, the woodland around the Jiulongkeng Reservoir, and the northeastern part of the Balcony Hill area. The areas with low soil organic matter content are mainly in the Nanshan Park area, a large area of mountain woodland from Tiantoushan to Guanyinshan Park, and a large area in Longgang District. Areas with high total soil phosphorus content are concentrated in the northeastern part of the city, from Shang Che Reservoir to a large area of woodland in Songzi Keng Forest Park, while the rest of the area has low total soil phosphorus content. Areas with high total soil nitrogen content are concentrated in large areas of the surrounding hills and woodlands centered on Tonglang Mountain, while the rest of the area has low total soil nitrogen content.
Soil properties also show a highly differentiated distribution across the different types of land uses. Among the 50 types of land in the city, the mean soil silt content is higher in the areas of press and publication land, dry land, wooded land, and railway land and lower in the areas of pastureland, scenic facilities, business and financial land, and airport land. The mean soil clay content values are higher in the range of paddy fields, agricultural facilities, shrublands, and forested land and lower in the range of pastureland; port and harbor land; cultural, sports, and recreational land; and airport land. The mean soil sand content is higher in the range of port and terminal land, natural grazing land, airport land, and business and financial land and lower in the range of agricultural land, dry land, forested land, and railway land. The mean soil organic matter content is higher in the range of artificial grazing land, watered land, paddy fields, and inland mudflats and lower in the range of port terminal land, airport land, tea plantations, and natural grazing land. The mean value of total soil nitrogen is higher in the range of natural grazing land, correctional sites, and scenic sites and lower in the range of airport sites, agricultural facilities, tea gardens, and artificial grazing land. The mean value of total soil phosphorus is higher at correctional sites and in rivers, reservoirs, vacant land, and watered land and lower in tea gardens, artificial pastures, natural pasture, and coastal mudflats.

4.3. The Distribution Characteristics of Surface Source Pollution Reduction Services Show Significant Differences across the City

The distribution characteristics of the supply capacity of TN reduction services and TP reduction services in Shenzhen’s ecological space are more consistent across the city. The areas with higher supply capacity are distributed mainly in the large mountain woodlands in the eastern part of the Dapeng Peninsula–Pingshan District–Yantian District–Luohu District contiguous area and in the Tanglang Mountain, Yangtai Mountain, and Fenghuang Mountain areas. On the other hand, urban green spaces with smaller slopes and lower-quality vegetation have lower supply capacity.
At the district scale, the mean value of TN reduction services was higher in Luohu District, Yantian District, and Futian District, while the mean value of TP reduction services was higher in Pingshan District, Yantian District, and Luohu District. At the scale of each land type, forested land, tea plantations, shrubland, and other forested land each have a high capacity to supply TN reduction services, while forested land, shrubland, tea plantations, pipeline transport land, and orchards each have a high capacity to supply TP reduction services. Paddy fields, reservoirs, port terminal land, natural grazing land, and airport land have a low capacity to reduce surface source pollution.

4.4. Spatial Distribution Characteristics of Surface Source Pollution Reduction Services Are Driven Mainly by Topography, Habitat Quality, and Ecosystem Type

The results of the GeoDetector show that topographic factors, habitat-quality factors, and the ecosystem type have the greatest influence on the spatial variability of the TN reduction services and the TP reduction services on the three types of sites. Among the climatic factors, precipitation is the only climatic factor that has a significant influence on the spatial variability of the services. Other than the sand content factor, which has a certain degree of influence, soil property factors do not have great influences on the spatial differentiation characteristics of the services. Additionally, the small q-value does not have strong explanatory power (as shown in Table S4).
An analysis from the perspective of the formation and reduction mechanism of surface source pollution found the following: (1) Different ecosystem types differ in their ability to reduce surface source pollutants under the same precipitation conditions owing to differences in their internal tree species composition, horizontal structure, vertical structure, biomass, and other factors. (2) Regions with higher topography and slopes, where precipitation has a stronger ability to scour the surface, form more-severe surface source pollution, increasing the amount of local surface source pollution reduction from the perspective of pollution volume production. Conversely, flat regions, where precipitation has a weaker ability to scour the surface, pose less of a risk for surface source pollution formation and to some extent weaken the amount of local surface source pollution reduction. (3) When other environmental factors remain unchanged, better vegetation conditions in a region imply a multilayered tree structure and high-quality plant growth conditions, which strengthen the surface source pollutant reduction capacity in the region. (4) Lastly, regions with higher precipitation experience more-severe surface soil washing by rainfall, leading to the formation of more surface source pollutants. This phenomenon to some extent strengthens the local capacity to reduce surface source pollution.

4.5. Based on the Results of the Interaction Detection between Different Factors, Service-Enhancement-Oriented Optimization Solutions Can Be Developed

In this study, the driving mechanisms of TN reduction services and TP reduction services were investigated for the city’s major land types (forested land, industrial land, and street and residential land). The results show that the driving mechanisms of the three land types are similar, with elevation, slope, and the vegetation normalization index as the main drivers of the spatial distribution of the surface source reduction services. Net primary productivity, ecosystem type, precipitation, and mean annual temperature also play important roles in the spatial variation of the services. The interaction detection results of the factors on the three types of sites show that the interaction of each driver shows a two-factor enhancement or nonlinear enhancement, meaning that the interaction effect of any two drivers on the spatial variation of the surface source reduction service is greater than that of one driver alone. This finding suggests that the spatial variation of the surface source pollution reduction service is affected by the combined effect of the drivers. However, there are differences in the results of interaction detection between the factors on the three types of sites. On the same type of land, the interaction detection results of the TN reduction services and the TP reduction services are different, and the interaction detection results of the same service on different land types are also different. Therefore, the interaction and synergy between different driving factors should be considered when optimizing the ecosystem and controlling the risk of surface source pollution in the region. Targeted and differentiated treatment modes should be adopted to maximize the enhancement of surface source pollution reduction services and avoid the further reduction of service supply capacity due to unreasonable treatment. For example, in the process of urban old city reconstruction and reserve land development, in order to improve or maximize the ability of local ecosystems to reduce nonpoint source pollution service supply, urban managers can adjust different driving factors on the basis of the results of the geographic detector in this paper; in addition, facing the main nonpoint source pollution problems (total nitrogen pollution or total phosphorus pollution) that occur in different regions, urban managers can also transform the many environmental conditions of local ecosystems into the best combination to achieve the best nonpoint source pollution reduction effect.

4.6. The Innovations and Limitations of This Study

Cities face many ecological and environmental problems in the process of developing into megacities. Vegetation degradation and soil physicochemical property changes have great negative impacts on the ecosystem’s service of reducing nonpoint source pollution. There are few studies on the spatial mapping of the physicochemical properties of soil for megacities with high degree of hardening and also few studies on the influencing factors of the spatial distribution of the service of reducing nonpoint source pollution. The novelty of this paper is reflected in the following aspects: (1) This study comprehensively considered various environmental variables and carried out a high-resolution spatial mapping of the physicochemical properties of soil for highly hardened megacities. (2) This study analyzed the spatial distribution influencing factors of the service of reducing nonpoint source pollution for the main three land-use types in the city, laying a foundation for urban ecological management applications. In addition, the research results of this paper can serve as the basis for future studies. High-quality physical and chemical property grid maps for soil can be used for the assessment and mapping of many ecosystem services (such as water conservation, flood reduction, soil conservation, etc.) in the whole city.
Although this paper has achieved some results in the spatial mapping of the physical and chemical properties of soil and the detection of driving factors for reducing nonpoint source pollution services, it has not quantified the joint driving effects of different environmental factors on reducing nonpoint source pollution services. In future studies, methods such as multiple regression, neural network training, random forest, etc. can be used to carry out such research.

5. Conclusions

Most megacities with high development intensity, fragile soil environments, and high precipitation are facing serious surface source pollution problems. In this study, the spatial distribution of soil particle size, organic matter, total phosphorus, and total nitrogen content was mapped with high accuracy by using a large number of soil field survey data and relevant environmental variables. Additionally, the spatial distribution characteristics of phosphorus and nitrogen pollutants in the city’s soil were clarified. Furthermore, at the scale of each land type, this paper integrated a modified generic soil loss equation and a geographic probe to assess the current status and main drivers of spatial variation in the provision of surface reduction services in the city’s ecosystems. The results of the study can serve as a foundation for decision-making on ecosystem management and soil conservation and restoration, ultimately enhancing surface reduction services in the region.

Supplementary Materials

The following supporting information can be downloaded at https://www.mdpi.com/article/10.3390/atmos14050873/s1, Table S1: Average content of soil properties and contaminants in each district; Table S2: Soil property detection results for various types of land use (mean); Table S3: Physical value of nonpoint source pollution reduction services in each district; Table S4: Drivers of nonpoint source pollution reduction services for major land-use types; Figure S1: Interaction detection results for nonpoint source pollution reduction service TN (forest land); Figure S2: Interaction detection results for nonpoint source pollution reduction service TP (forest land); Figure S3: Interaction detection results for nonpoint source pollution reduction service TN (industrial land); Figure S4: Interaction detection results for nonpoint source pollution reduction service TP (industrial land); Figure S5: Interaction detection results for nonpoint source pollution reduction service TN (street and town residential land); Figure S6: Interaction detection results for nonpoint source pollution reduction service TP (street and town residential land).

Author Contributions

Conceptualization, C.S. and B.H.; methodology, K.D.; software, K.D.; validation, Z.C. and H.W.; formal analysis, C.S.; investigation, K.D.; resources, K.D.; data curation, K.D.; writing—original draft preparation, C.S.; writing—review and editing, C.S.; visualization, C.S.; supervision, Z.O.; project administration, B.H.; funding acquisition, B.H. All authors have read and agreed to the published version of the manuscript.

Funding

This work was funded by the Technologies and Models for Optimizing Urban Ecological Spatial Patterns and Enhancing Functions with Multi-objective Synergy, grant number 2022YFF1301105; this work was also funded by the National Key Research and Development Program of China, grant number 2022YFB3903701.

Institutional Review Board Statement

Not applicable.

Informed Consent Statement

Not applicable.

Data Availability Statement

The data used to support the findings of this study are available from the corresponding author upon request.

Acknowledgments

The authors appreciate the Shenzhen Bureau of Ecology and Environment for providing relevant data and products.

Conflicts of Interest

The authors declare no conflict of interest.

References

  1. Koomen, E.; van Bemmel, M.S.; van Huijstee, J.; Andrée, B.P.J.; Ferdinand, P.A.; van Rijn, F.J.A. An integrated global model of local urban development and population change. Comput. Environ. Urban Syst. 2023, 100, 101935. [Google Scholar] [CrossRef]
  2. UN-Habitat. World Cities Report 2022: Envisaging the Future of Cities; UN-Habitat: Nairobi, Kenya, 2022. [Google Scholar]
  3. Gui, H.; Yang, Q.; Lu, X.; Wang, H.; Gu, Q.; Martín, J.D. Spatial distribution, contamination characteristics and ecological-health risk assessment of toxic heavy metals in soils near a smelting area. Environ. Res. 2023, 222, 115328. [Google Scholar] [CrossRef] [PubMed]
  4. Liu, S.; Yuan, R.; Wang, X.; Yan, Z. Soil tungsten contamination and health risk assessment of an abandoned tungsten mine site. Sci. Total Environ. 2022, 852, 158461. [Google Scholar] [CrossRef] [PubMed]
  5. Perović, V.; Čakmak, D.; Srbinović, O.S.; Mrvić, V.; Simić, S.B.; Matić, M.; Pavlović, D.; Jaramaz, D.; Mitrović, M.; Pavlović, P. A conceptual modelling framework for assessment multiple soil degradation: A case study in the region of Šumadija and Western Serbia. Ecol. Indic. 2023, 148, 110096. [Google Scholar] [CrossRef]
  6. Nascimento, C.M.; Demattê, J.A.M.; Mello, F.A.O.; Rosas, J.T.F.; Tayebi, M.; Bellinaso, H.; Greschuk, L.T.; Albarracín, H.S.R.; Ostovari, Y. Soil degradation detected by temporal satellite image in São Paulo state, Brazil. J. S. Am. Earth Sci. 2022, 120, 104036. [Google Scholar] [CrossRef]
  7. Zucca, C.; Fleiner, R.; Bonaiuti, E.; Kang, U. Land degradation drivers of anthropogenic sand and dust storms. Catena 2022, 219, 106575. [Google Scholar] [CrossRef]
  8. Zucca, C.; Middleton, N.; Kang, U.; Liniger, H. Shrinking water bodies as hotspots of sand and dust storms: The role of land degradation and sustainable soil and water management. Catena 2021, 207, 105669. [Google Scholar] [CrossRef]
  9. Jiang, C.; Zhang, H.; Wang, X.; Feng, Y.; Labzovskii, L. Challenging the land degradation in China’s Loess Plateau: Benefits, limitations, sustainability, and adaptive strategies of soil and water conservation. Ecol. Eng. 2019, 127, 135–150. [Google Scholar] [CrossRef]
  10. Han, Y.; Gu, X. Enrichment, contamination, ecological and health risks of toxic metals in agricultural soils of an industrial city, northwestern China. J. Trace Elem. Miner. 2023, 3, 100043. [Google Scholar] [CrossRef]
  11. Hu, W.; Wang, X.; Wang, X.; Xu, Y.; Li, R.; Zhao, L.; Ren, W.; Teng, Y. Enhancement of nitrogen fixation and diazotrophs by long-term polychlorinated biphenyl contamination in paddy soil. J. Hazard. Mater. 2023, 446, 130697. [Google Scholar] [CrossRef]
  12. Barroso, G.C.; Abril, G.; Machado, W.; Abuchacra, R.C.; Peixoto, R.B.; Bernardes, M.; Marques, G.S.; Sanders, C.J.; Oliveira, G.B.; Oliveira Filho, S.R.; et al. Linking eutrophication to carbon dioxide and methane emissions from exposed mangrove soils along an urban gradient. Sci. Total Environ. 2022, 850, 157988. [Google Scholar] [CrossRef] [PubMed]
  13. Guo, J.; Muhammad, H.; Lv, X.; Wei, T.; Ren, X.; Jia, H.; Atif, S.; Hua, L. Prospects and applications of plant growth promoting rhizobacteria to mitigate soil metal contamination: A review. Chemosphere 2020, 246, 125823. [Google Scholar] [CrossRef] [PubMed]
  14. Brauman, K.A.; Garibaldi, L.A.; Polasky, S.; Aumeeruddy-Thomas, Y.; Brancalion, P.H.S.; DeClerck, F.; Jacob, U.; Mastrangelo, M.E.; Nkongolo, N.V.; Palang, H.; et al. Global trends in nature’s contributions to people. Proc. Natl. Acad. Sci. USA 2020, 117, 32799–32805. [Google Scholar] [CrossRef] [PubMed]
  15. Ouyang, Z.; Wang, X.; Miao, H. A primary study on Chinese terrestrial ecosystem services and their ecological-economic values. Acta Ecol. Sin. 1999, 19, 19–25. [Google Scholar]
  16. Ouyang, Z.; Song, C.; Zheng, H.; Polasky, S.; Xiao, Y.; Bateman, I.J.; Liu, J.; Ruckelshaus, M.; Shi, F.; Xiao, Y.; et al. Using gross ecosystem product (GEP) to value nature in decision making. Proc. Natl. Acad. Sci. USA 2020, 117, 14593–14601. [Google Scholar] [CrossRef] [PubMed]
  17. Ouyang, Z.; Zheng, H.; Xiao, Y.; Polasky, S.; Liu, J.; Xu, W.; Wang, Q.; Zhang, L.; Xiao, Y.; Rao, E.; et al. Improvements in ecosystem services from investments in natural capital. Science 2016, 352, 1455–1459. [Google Scholar] [CrossRef] [PubMed]
  18. Daily, G.C.; Matson, P.A. Ecosystem services: From theory to implementation. Proc. Natl. Acad. Sci. USA 2008, 105, 9455–9456. [Google Scholar] [CrossRef]
  19. Muhammad, S.; Wuyts, K.; Samson, R. Selection of Plant Species for Particulate Matter Removal in Urban Environments by Considering Multiple Ecosystem (Dis)Services and Environmental Suitability. Atmosphere 2022, 13, 1960. [Google Scholar] [CrossRef]
  20. Maragno, D.; Gaglio, M.; Robbi, M.; Appiotti, F.; Fano, E.A.; Gissi, E. Fine-scale analysis of urban flooding reduction from green infrastructure: An ecosystem services approach for the management of water flows. Ecol. Model. 2018, 386, 1–10. [Google Scholar] [CrossRef]
  21. Rizzo, A.; Bresciani, R.; Masi, F.; Boano, F.; Revelli, R.; Ridolfi, L. Flood reduction as an ecosystem service of constructed wetlands for combined sewer overflow. J. Hydrol. 2018, 560, 150–159. [Google Scholar] [CrossRef]
  22. Park, C.Y.; Park, Y.S.; Kim, H.G.; Yun, S.H.; Kim, C.-K. Quantifying and mapping cooling services of multiple ecosystems. Sustain. Cities Soc. 2021, 73, 103123. [Google Scholar] [CrossRef]
  23. Ferreira, C.S.S.; Seifollahi-Aghmiuni, S.; Destouni, G.; Ghajarnia, N.; Kalantari, Z. Soil degradation in the European Mediterranean region: Processes, status and consequences. Sci. Total Environ. 2022, 805, 150106. [Google Scholar] [CrossRef] [PubMed]
  24. Wang, J.; Lu, P.; Valente, D.; Petrosillo, I.; Babu, S.; Xu, S.; Li, C.; Huang, D.; Liu, M. Analysis of soil erosion characteristics in small watershed of the loess tableland Plateau of China. Ecol. Indic. 2022, 137, 108765. [Google Scholar] [CrossRef]
  25. Luo, D.; Wang, M.; Xu, Y. Research on the impact of soil pollution on plant growth. J. Green Sci. Technol. 2017, 12, 120–122. [Google Scholar]
  26. Guerin, T.F. The effect of interactions between soil compaction and phenol contamination on plant growth characteristics: Implications for scaling bioremediation at industrial sites. J. Environ. Manag. 2022, 302, 114017. [Google Scholar] [CrossRef]
  27. Wang, S.; Roland, B.; Adhikari, K.; Zhuang, Q.; Jin, X.; Han, C.; Qian, F. Spatial-temporal variations and driving factors of soil organic carbon in forest ecosystems of Northeast China. For. Ecosyst. 2023, 10, 100101. [Google Scholar] [CrossRef]
  28. Hoeffner, K.; Santonja, M.; Monard, C.; Barbe, L.; Moing, M.L.E.; Cluzeau, D. Soil properties, grassland management, and landscape diversity drive the assembly of earthworm communities in temperate grasslands. Pedosphere 2021, 31, 375–383. [Google Scholar] [CrossRef]
  29. Zeng, S.; Ma, J.; Yang, Y.; Zhang, S.; Liu, G.-J.; Chen, F. Spatial assessment of farmland soil pollution and its potential human health risks in China. Sci. Total Environ. 2019, 687, 642–653. [Google Scholar] [CrossRef]
  30. Wang, W.; Wang, H.; Huang, J.; Yang, H.; Li, J.; Liu, Q.; Wang, Z. Causality and dynamic spillover effects of megacities on regional industrial pollution reduction. Heliyon 2023, 9, e14047. [Google Scholar] [CrossRef]
  31. Li, H.; Huang, W.; Qian, Y.; Klemeš, J.J. Air pollution risk assessment related to fossil fuel-driven vehicles in megacities in China by employing the Bayesian network coupled with the Fault Tree method. J. Clean. Prod. 2023, 383, 135458. [Google Scholar] [CrossRef]
  32. Huang, J.; Wu, Y.; Sun, J.; Li, X.; Geng, X.; Zhao, M.; Sun, T.; Fan, Z. Health risk assessment of heavy metal(loid)s in park soils of the largest megacity in China by using Monte Carlo simulation coupled with positive matrix factorization model. J. Hazard. Mater. 2021, 415, 125629. [Google Scholar] [CrossRef] [PubMed]
  33. Xie, T.; Hou, Y.; Chen, W.P.; Wang, M.E.; Lv, S.T.; Li, X.Z. Impact of urbanization on the soil ecological environment: A review. Acta Ecol. Sin. 2019, 39, 1154–1164. [Google Scholar]
  34. Chen, Q.; Su, Y.; Wang, S.; Zhao, L. Research and practice on the degradation and prevention technology of urban green space soil—Taking Tianjin Cultural Center as an example. Tianjin Agric. Sci. 2016, 22, 124–128. [Google Scholar]
  35. Othman, A.; El-Saoud, W.A.; Habeebullah, T.; Shaaban, F.; Abotalib, A.Z. Risk assessment of flash flood and soil erosion impacts on electrical infrastructures in overcrowded mountainous urban areas under climate change. Reliab. Eng. Syst. Saf. 2023, 236, 109302. [Google Scholar] [CrossRef]
  36. Xu, D.; Ouyang, Z.; Wu, T.; Han, B. Dynamic Trends of Urban Flooding Mitigation Services in Shenzhen, China. Sustainability 2020, 12, 4799. [Google Scholar] [CrossRef]
  37. Yu, T. A brief analysis of the development of soil safety in Shenzhen since the 13th Five-Year Plan. Guangdong Chem. Ind. 2022, 49, 112–113, 126. [Google Scholar]
  38. Sun, X.; Jia, L. Migration Characteristics of Heavy Metals in Rock-Soil-Plant System in Yangmeikeng Area, Shenzhen. South China Geol. 2020, 36, 270–279. [Google Scholar]
  39. Shu, C.; Cai, W.; Du, K.; Jinag, N.; Lin, L.; Li, X. Study on the flora and risk distribution of dominant invasive plants in Shenzhen. Acta Ecol. Sin. 2023, 43, 1113–1125. [Google Scholar]
  40. Zhang, X.; Chen, P.; Dai, S.; Han, Y. Analysis of non-point source nitrogen pollution in watersheds based on SWAT model. Ecol. Indic. 2022, 138, 108881. [Google Scholar] [CrossRef]
  41. National Forestry and Grassland Administration of the People’s Republic of China. Measurement of Forest Soil Particle Composition (Mechanical Composition) in the Forestry Industry Standard of the People’s Republic of China; National Forestry and Grassland Administration of the People’s Republic of China: Beijing, China, 1999.
  42. Ministry of Agriculture and Rural Affairs of the People’s Republic of China. Soil Testing Part 6: Determination of Soil Organic Matter; Ministry of Agriculture and Rural Affairs of the People’s Republic of China: Beijing, China, 2006.
  43. Ministry of Ecology and Environment of the People’s Republic of China. Determination of Total Phosphorus in Soil by Alkali Fusion-Molybdenum Antimony Anti-Spectrophotometry; Ministry of Ecology and Environment of the People’s Republic of China: Beijing, China, 2011.
  44. Ministry of Ecology and Environment of the People’s Republic of China. Determination of Total Nitrogen in Soil Quality by Kjeldahl Method; Ministry of Ecology and Environment of the People’s Republic of China: Beijing, China, 2014.
  45. Agyeman, P.C.; Kingsley, J.; Kebonye, N.M.; Khosravi, V.; Borůvka, L.; Vašát, R. Prediction of the concentration of antimony in agricultural soil using data fusion, terrain attributes combined with regression Kriging. Environ. Pollut. 2023, 316, 120697. [Google Scholar] [CrossRef]
  46. Chen, B.; Yang, X.; Xu, J. Spatio-Temporal Variation and Influencing Factors of Ozone Pollution in Beijing. Atmosphere 2022, 13, 359. [Google Scholar] [CrossRef]
  47. Li, C.; Luo, Y.; Bao, A.; Zhang, Y.; Yang, C.; Cui, L. Study on Spatial Interpolation of Compositional Data Based on Log-Ratio Transformation. Sci. Agric. Sin. 2012, 45, 648–655. [Google Scholar]
  48. Shen, Z. Spatial Prediction of Topsoil Texture and Analysis of the Causes in Loess Region of Southern Ningxia at Different Scales; Chinese Academy of Agricultural Sciences: Beijing, China, 2020. [Google Scholar]
  49. Desmet, P.; Govers, G. A GIS procedure for automatically calculating the USLE LS factor on topographically complex landscape units. J. Soil Water Conserv. 1996, 51, 427–433. [Google Scholar]
  50. Kirkby, M.J.; Beven, K.J. A physically based, variable contributing area model of basin hydrology. Hydrol. Sci. J. 1979, 24, 43–69. [Google Scholar]
  51. Qin, C.-Z.; Zhu, A.X.; Pei, T.; Li, B.-L.; Scholten, T.; Behrens, T.; Zhou, C.-H. An approach to computing topographic wetness index based on maximum downslope gradient. Precis. Agric. 2011, 12, 32–43. [Google Scholar] [CrossRef]
  52. Zevenbergen, L.W.; Thorne, C.R. Quantitative analysis of land surface topography. Earth Surf. Process. Landf. 1987, 12, 47–56. [Google Scholar] [CrossRef]
  53. Wischmeier, W.H.; Smith, D.D. Predicting Rainfall Erosion Losses: A Guide to Conservation Planning; Department of Agriculture, Science and Education Administration: Washington, DC, USA, 1978. [Google Scholar]
  54. Shu, C.; Meng, H.; Han, B.; Yang, H.; Pan, X.; Lin, L.; Ouyang, Z. Impact of precipitation factors on gross ecosystem product. Acta Ecol. Sin. 2023, 43, 1054–1063. [Google Scholar]
  55. Wang, J.-F.; Li, X.-H.; Christakos, G.; Liao, Y.-L.; Zhang, T.; Gu, X.; Zheng, X.-Y. Geographical Detectors-Based Health Risk Assessment and its Application in the Neural Tube Defects Study of the Heshun Region, China. Int. J. Geogr. Inf. Sci. 2010, 24, 107–127. [Google Scholar] [CrossRef]
  56. Wang, J.; Xu, C. Geodetector: Principle and prospective. Acta Geogr. Sin. 2017, 72, 116–134. [Google Scholar]
  57. Chen, L.; Chen, L.; Shi, M. Spatial Distribution and Variability of Soil Fine Diameter in Suburbs of Tianjin. Environ. Sci. Technol. 2013, 36, 29–34, 63. [Google Scholar]
  58. Wan, H.; Qin, H.; Shang, S. Ordinary Kriging Interpolation and Smoothing Effect Correction for Soil Texture Mapping in Hetao Irrigation District. Trans. Chin. Soc. Agric. Mach. 2023, 54, 339–350. [Google Scholar]
  59. Zhang, H.; Zhu, G.; Wu, J.; Wu, X. Simulation of spatial distribution simulation of soil organic matter based on BP neural network and Kriging interpolation—Taking Hua’an County, Fujian Province as an example. Subtrop. Agric. Res. 2021, 17, 40–47. [Google Scholar]
  60. Tang, J.; Wang, C.; Li, Q.; Li, B.; YI, Y. Spatial variability of organic matter and total nitrogen in tobacco growing soil in the north part of Sichuan province. Acta Table Sin. 2014, 20, 66–72. [Google Scholar]
  61. Wang, Y.; Yang, X.; Hao, L. Spatio-Temporal Pattern and Influencing Factors of Vegetation NDVI in Western Sichuanplateau from 2001 to 2021; Remote Sensing for Natural Resources: Beijing, China, 2023; pp. 1–9. [Google Scholar]
  62. Chen, K.; Ding, Y.; Zhang, X. Analysis of Spatio-Temporal Dynamics and Driving Forces of Vegetation Cover in the Fuyang River Basin Based on the Geographic Detector. Front. Earth Sci. 2022, 1–15. [Google Scholar]
  63. Hang, L.; Chen, Q.; Feng, J.; Liu, R. Spatial-Temporal Characteristics and Driving Mechanisms Analysis of Habitat Quality in Shenfu Mining Area Based on Geodetector. J. Xi’an Univ. Technol. 2023, 1–14. [Google Scholar]
  64. Xue, L.; Li, H.; Shen, W.; Zhao, X.; Liu, Z.; Zheng, Z.; Hu, J.; Meng, S. Applying GeoDetector to disentangle the contributions of the 4-As evaluation indicators to the spatial differentiation of coal resource security. Energy Policy 2023, 173, 113418. [Google Scholar] [CrossRef]
  65. Qiao, Y.; Wang, X.; Han, Z.; Tian, M.; Wang, Q.; Wu, H.; Liu, F. GeoDetector based identification of influencing factors on spatial distribution patterns of heavy metals in soil: A case in the upper reaches of the Yangtze River, China. Appl. Geochem. 2022, 146, 105459. [Google Scholar] [CrossRef]
  66. Hao, Z.; Wu, D. Data Preprocessing of Soil Attributes for Ecohydrological Applications Using SWAT Model at Xin’anjiang Upstream Watershed, China. Ecohydrol. Hydrobiol. 2023, 23, 198–210. [Google Scholar] [CrossRef]
  67. Bouslihim, Y.; Rochdi, A.; El Amrani Paaza, N.; Liuzzo, L. Understanding the effects of soil data quality on SWAT model performance and hydrological processes in Tamedroust watershed (Morocco). J. Afr. Earth Sci. 2019, 160, 103616. [Google Scholar] [CrossRef]
  68. Deng, X.; Chen, X.; Ma, W.; Ren, Z.; Zhang, M.; Grieneisen, M.L.; Long, W.; Ni, Z.; Zhan, Y.; Lv, X. Baseline map of organic carbon stock in farmland topsoil in East China. Agric. Ecosyst. Environ. 2018, 254, 213–223. [Google Scholar] [CrossRef]
Figure 1. Location map of Shenzhen.
Atmosphere 14 00873 g001
Figure 2. Ecosystem classification map and distribution of soil sampling sites in Shenzhen.
Atmosphere 14 00873 g002
Figure 3. (a) Spatial distribution characteristics of the content of silt; (b) spatial distribution characteristics of the content of clay.
Atmosphere 14 00873 g003
Figure 4. (a) Spatial distribution characteristics of the mean silt content of each land type (g/kg); (b) spatial distribution characteristics of the mean clay content of each land type (g/kg).
Atmosphere 14 00873 g004
Figure 5. (a) Spatial distribution characteristics of the content of sand; (b) spatial distribution characteristics of the content of organic matter.
Atmosphere 14 00873 g005
Figure 6. (a) Spatial distribution characteristics of the mean sand content of each land type (g/kg); (b) spatial distribution characteristics of the mean organic matter content of each land type (g/kg).
Atmosphere 14 00873 g006
Figure 7. (a) Spatial distribution characteristics of the content of TN; (b) spatial distribution characteristics of the content of TP.
Atmosphere 14 00873 g007
Figure 8. (a) Spatial distribution characteristics of the mean TN content of each land type (mg/kg); (b) spatial distribution characteristics of the mean TP content of each land type (mg/kg).
Atmosphere 14 00873 g008
Figure 9. (a) Spatial distribution characteristics of total nitrogen for city-wide surface source reduction services (t/hm2); (b) spatial distribution characteristics of total phosphorus for city-wide surface source reduction services (t/hm2).
Atmosphere 14 00873 g009
Table 1. Indicator system for potential drivers.
First-Level IndicatorsSecond-Level IndicatorsGeneral Information
ClimateX1: Annual precipitationmm
X2: Average annual temperature°C
Soil propertiesX3: Content of sand particlesg/kg
X4: Content of clay particlesg/kg
X5: Content of silt particlesg/kg
X6: Content of organic matterg/kg
TopographyX7: Elevationm
X8: SlopeDegree
Habitat qualityX9: Normalized difference vegetation index, NDVIDimensionless
X10: Net primary productivity, NPPt/hm2
Ecosystem typeX11: Ecosystem typeForests, grasslands, wetlands, impervious surfaces, farmlands, barren
Table 2. Results of cross-validation.
Soil PropertiesMEMSEASERMSERMSSE
Silt particles0.0150.01211.06011.0711.001
Clay particles0.0110.00911.10011.0801.003
Sand particles0.0010.00111.12011.1101.012
Organic matter0.0160.01311.09011.0801.011
Total nitrogen0.0120.01011.07011.0821.016
Total phosphorus0.0030.00211.11311.1021.108
Disclaimer/Publisher’s Note: The statements, opinions and data contained in all publications are solely those of the individual author(s) and contributor(s) and not of MDPI and/or the editor(s). MDPI and/or the editor(s) disclaim responsibility for any injury to people or property resulting from any ideas, methods, instructions or products referred to in the content.

