1. Introduction
The natural cycle of the environment faces severe disturbances owing to climate change, resulting in changing weather patterns and a rise in climate variables such as temperature, sea levels, glacier melts, and sea ice, etc. [
1,
2]. Due to the changing climate, the occurrence of global natural catastrophes and their intensity have increased in the last decade in comparison to the average over the previous three decades, thereby significantly affecting many aspects of life [
3,
4]. Floods can damage buildings and infrastructure, creating health risks, disrupting transportation and logistics, and causing power outages. The effects of flooding are enormous and can be seen in various facets of human society [
5,
6,
7]. When it comes to efficient flood management, having a solid understanding of the multifaceted nature of flood losses is essential [
8]. In the event of flooding, there are predominantly two kinds of losses: direct and indirect [
9]. Direct damages occur as a result of the flood water coming into contact with people, their property, or their belongings [
10]. The scope of indirect damages is quite broad. It might include the disruption of traffic, which can result in business production issues and monetary losses. In urban areas, indirect losses from floods are widespread compared to rural areas [
11,
12]. The high-rise buildings and other places of refuge can reduce people’s direct contact with floodwaters. On the other hand, roads, water and gas pipelines, subway stations, and parking lots in low-lying areas are flooded, which causes indirect damages [
13,
14,
15].
Numerous studies have been conducted on various aspects of floods. The majority of researchers focused on examining the consequences post-flash flood through the application of hydrological modeling and inundation mapping, typically for a small area [
16]. However, by applying floodplain mapping, remote sensing, GISs, hazard analysis, socio-economic analysis, infrastructure assessment, and community participation and engagement, it is possible to conduct large-scale assessments to determine the extent of the damage and necessary response efforts [
17]. While large-scale assessments and explorations are mainly used in America, most countries still rely on traditional methods. Large-scale assessments are critical for ensuring that response efforts are targeted and effective. They may use specialized tools and modeling techniques to simulate flood scenarios and assess potential impacts [
18]. By conducting these assessments, communities can better understand the scale of the problem and develop effective strategies for addressing the effects of floods on social systems and critical infrastructure. Floods often need large-scale response efforts to address their consequences. It is important for communities to be prepared for these events and to have plans in place to mitigate the effects of flooding and respond effectively to emergencies [
17].
China lies in a flood-prone region due to seven major rivers: the Yellow River, the Huaihe River, the Yangtze River, the Hai River, the Shanghai River, the Liao River, and the Pearl River [
19]. China has faced multiple flood hazards, costing thousands of lives and billions of dollars and badly affecting the infrastructure and economy [
20]. It is recognized that very intensive runoff, river sediment, dam failures, and natural terrain cause frequent and regular floods [
21]. Therefore, flood protection and mitigation are the premier agendas of new China. The country has made outstanding progress in construction, building flood protection dykes, embankments, and reservoirs, in addition to flood storage and detention basins on both the Huaihe River and the Yangtze River [
22,
23]. The primary focus was to protect 637 cities from flooding, with protection for 490 already completed. The middle and lower sections of the major rivers accommodate a total population of 600 million people and have recorded a collective GDP of CNY 26 trillion [
24,
25]. As per the statistics, China has faced flood disasters every 2–3 years. National flood disasters have resulted in direct economic losses of CNY 77.94 billion in 1991, CNY 179.65 billion in 1994, and CNY 228.04 billion in 1996, and twenty-nine provinces, cities, and autonomous regions, including Jiangxi, Hunan, Hubei, and Heilongjiang, were hit by the largest-scale flood in a century in the summer of 1998 [
26]. Millions of people were affected, over 20 million hectares of agricultural land were flooded, and flood losses of CNY 255.09 billion were recorded [
24,
25].
Floodplain modeling covers several areas, including structural and non-structural measures, for protection from dangerous floods [
27]. Huaihe River has a complex stream flow due to extensive changes in topography; several dams have been constructed to prevent different regions from floods [
18,
25]. Flood risk, climate change, water pollution, deforestation, and urbanization in the Huaihe River are still higher compared to other rivers in China [
28]. Consequently, the Chinese government prioritizes the Huaihe River. In recent decades, many flood control structures have been built, including 38 large reservoirs, 21 flood storage areas, 1716 km of embankments, diversion through the Huaihongxinhe canal and Ruhaishuidao canal (freely flowing to the main river), and the construction of the large Hongze Lake. More than one hundred reservoirs have been constructed, and twenty hydraulic gates have been installed for flood control and irrigation [
24,
29]. Non-structural measures, such as remote monitoring systems, communication systems for flood control works, hydrological forecasting systems, remote consultation systems, and flood control systems, have also been made functional. These effective control measures play a vital role in protection against floods in the Huaihe River basin.
This study proposes a one dimensional (1D) model that describes the flow in the main channel of the Huaihe River and is based on the Saint-Venant equations, while the flow outside the river levees is described by a 2D model [
30]. A coupling method suitable for the large-scale hydrodynamic model is proposed. A similar approach has been applied to the coupled simulation of rivers and lakes in the middle reaches of the Yangtze River [
6]. A method for water level prediction correction by 1D and 2D coupling is proposed, which has the advantage of the relatively independent calculation of 1D and 2D models [
31]. Most of the proposed 1D and 2D models are connected and formulated employing a lateral weir equation, and the same approach has been applied to solve a levee break [
32]. The overlapping calculation area method and the boundary iteration method have been applied to the coupling of the upstream and downstream models of the river, which meet the conditions of equal flow and a steady water level [
33]. Therefore, the most complex part of coupling 1D and 2D models lies in the hydraulic transfer relationship at the coupling, while for the actual flow movement, the flood breakage flow state is very similar to the lateral weir flow movement [
30,
34]. The most widely used method for the connection mode of the 1D and 2D coupling of a breakage flood is the weir flow formula method [
20]. Many approaches and commercial software packages are used for this purpose, such as SOBEK, MIKE FLOOD MIKE-11, and XP-SWMM [
35]. The study is presented on MIKE, a comprehensive package used to simulate a 1D unsteady flow for rivers, lakes, water channels, and other tributaries. It is a tool developed for assessing complex and simple water bodies for designing, managing, and effectively operating systems [
36].
The DHI MIKE software demonstrates a good connection for flood modeling, and many studies have employed it to analyze flood risks and their impact [
37]. It is known for its user-friendly interface and ability to integrate with other software packages, such as GIS and CAD. However, several open-source solutions for flood modeling can provide comparable or even superior capabilities, such as HEC RAS, Flood Modeller, and TUFLOW. In contrast, HEC RAS is a software package that concentrates on river and stream hydraulics modeling. It has gained popularity in the United States for floodplain mapping and flood insurance studies. Flood Modeller is another software that provides diverse capabilities for flood modeling, such as 1D and 2D modeling, flood risk evaluation, and the optimization of flood mitigation measures [
38]. TUFLOW specializes in 2D flood modeling and simulating complex river and coastal systems. Overall, all these software packages have their strengths and weaknesses; however, the choice between DHI MIKE and HEC RAS largely depends on the specific needs of the user and the project requirements, such as the size and complexity of the area being modeled, the level of accuracy required, and the resources, such as data availability [
39].
This study explores flood risk analysis in a particular region of the Huaihe River, specifically from Lutaiz to Huainan, by employing DHI 1D for flood risk and 2D modeling techniques for a flood protection area. The primary goal is to protect the city areas of Bo Zhou City, Xin County, Fengtai County, Punji County, Huaihe Yuan County, and Lixin County, in addition to the left and right dam embankments. Additionally, the flow path changes, water level, velocity, inundation area, and flooding duration in flood-prone areas under the designed flood conditions are studied to compare the effects of breaches of different widths. The total area covered by the proposed protection measures is 1816.0 km2. The flood impact is divided into three phases. The first phase involves analyzing the effects of floods on the population, agricultural land, GDP, and highways by using socio-economic data and ArcGIS software. The second phase involves quantifying the flood losses, such as inundated areas, using established disaster statistics and the ArcGIS platform. The third phase involves the calculation of flood impact and loss assessments, using different parametric calculation schemes for the comparison of results. The proposed approach is useful and simple for assessing flood risk analysis. The findings indicated in the outcomes of this study represent significant damages caused by the flood in the target regions. Consequently, the results offer valuable technical support for flood risk analysis and loss evaluation within the flood protection zone, serving as a crucial reference point for regional flood control, disaster reduction decision making, and constructive planning.
3. Hydrological Modeling
The calculation of the one-dimensional model (DHI MIKE 11) is based on the Saint-Venant equation [
18].
According to the continuity equation:
Moreover, the momentum equation is:
where
represents the discharge, m
3/s; q represents the lateral inflow;
A represents the water passage area;
h represents the water level;
R represents the hydraulic radius;
α represents the momentum correction coefficient.
MIKE 21 can simulate two-dimensional models for free surfaces through flexible mesh systems; these are solved by using Saint-Venant equations based on an average depth calculation [
41,
42].
The spatial dispersion of the calculated region adopts the finite volume method, and the sub-unit can be a triangle or a quadrilateral. The general form of shallow-water equations can be written in the following format:
where
U is a physical conservation vector,
F is a flux vector, and
S is a source item. In the Cartesian coordinate system, two-dimensional shallow-water equations can be written as:
In the above equation, S is the water level and U and V are the Cartesian velocity components.
One- and two-dimensional models are coupled with the help of the following equation:
where
is the discharge through the weir,
b is the width of the weir top,
μ is the flow coefficient,
h1 and
h2 are the upstream and downstream water levels, respectively, and
Zc is the top weir elevation.
5. Results
5.1. MIKE 1D Model Calibration and Validation
The Huaihe River was modeled in the current study using MIKE 11 (1D), and the flood protection area was modeled using MIKE 21 (2D). The 1D and 2D models were coupled with MIKE FLOOD to stimulate the region’s flood inundation extent and depth. The connection of the 1D and 2D models was significantly improved, for instance, by applying the dry and wet boundary theory and an unstructured mesh sectional in the study area. The stability of the model is confirmed by taking structural measures, such as roads and bridges. The model calibration and validation were based on comparing the simulated and measured water levels. A geographic information system (GIS) software technique was used to map the land cover. The dependence of Manning’s n coefficient on the surface roughness of the channel and its function as a measure of the resistance of a channel or watercourse to flow were considered. The model’s accuracy in the study area was made possible by assigning the appropriate Manning’s n coefficient to each land cover type according to the standard value. The Manning equation is commonly used in hydrology to compute water flow in an open channel to calculate the friction losses in a river [
44]. The Manning’s roughness coefficient values used in this study are presented in
Table 1. The river roughness value is the main parameter that greatly influences the accuracy of the model. The model calibration shows that the roughness coefficient of the main channel of the Huaihe River in this section is 0.026, and the roughness coefficient at the beach is 0.036.
The 1D flood model was calibrated at the Xiashankou hydrological station using the 2003 flood event, and it was validated using the 2007 and 2017 flood events of the Huaihe River. The Lutaiz hydrological station was selected as the inflow boundary condition, while the Huainan hydrologic station was taken for reference for the lower boundary conditions. The Lutaiz hydrological station in Fengtai County measured a water level of 26.10 m. The typical annual measured flow processes of Lutaiz in 2003 and 2007 are shown in
Figure 2. the maximum flow in 2003 occurred on 5 July, reaching 7800 m
3/s, while the maximum flow in 2007 occurred on 12 July, reaching 7690 m
3/s. The annual measured water levels at Huainan station in 2003 and 2007 are shown in
Figure 2. The highest water level in 2003 occurred on 6 July, reaching 24.24 m. The highest water level in 2007 was 23.52 m on 19 July. The Xiaxankou water level station is located in Fengtai County and has a guaranteed water level of 25.65 m. The typical annual measured water levels in Xiaxankou in 2003 and 2007 are shown in
Figure 2. The highest water level in 2003 occurred on 12 July, reaching 25.61 m. The highest water level in 2007 was 24.95 m on 19 July. Frequent rainfall events in southern China caused the 2017 flood, which resulted in catastrophic floods in the Huaihe River, the middle and lower reaches of the Yangtze River, southwestern and southern China, and the southeastern coastal regions. Between October and November, there were four events of heavy precipitation in the middle and lower portions of the Yangtze River. On average, 339.9 mm of rain falls on the Huaihe River. Hundreds of people have been directly impacted by the flood since 28 October in 20 provinces, including Jiangxi, Anhui, and Hubei. Since October 2017, 536 rivers across the country have flooded beyond the warning level. The water level in 259 rivers rose above the measured water level, and the water in 78 rivers exceeded the historical record. Dangerous flood conditions emerged in the upper reaches of the Yangtze River, the Yellow River, and the Huaihe River. On 15 October, the peak flood water level of 23.11 m appeared at the Xiaxankou water station, exceeding the formerly measured water level by 0.05 m, the sixth-highest water level in history. The highest water level at the station was 23.52 m in 2007.
The Courant–Friedrichs–Lewy condition (CFL) condition is required to stabilize unstable numerical systems that simulate convection or wave events. The CFL condition states that any information traveling within the mesh throughout the time step duration must travel faster than the distance between mesh elements. The step length of a one-dimensional model is calculated based on factors such as the model stability, satisfying CFL conditions, and computational efficiency. The MIKE-View post-processor tool for MIKE-11 assists in viewing and analyzing the outcomes through graphical and animated user interfaces. After ensuring packages and inputting all the required information in the fill editor, the simulation was initiated for the graphical view of the initial result. During the simulation, the file identified any errors with the establishing condition during the initial processing. Afterward, serval computational time steps greater than 1 min in conjunction with a fixed special step Δx of 500 m, which is normally spiced in the network file, were attempted. It was realized that the model was unstable as it kept crashing.
Finally, the model became stable at a time step Δt equal to 1 min and at a Δx equal to 500 m. Thus, the model’s optimal Δx and Δt were 500 m and 1 min, respectively. The one-dimensional graphical interface results of the three faces are shown in
Figure 3. The blue and green lines represent the right and left banks of the levee, while the red line indicates the water stage in the river.
Figure 3a shows the current flow level, which is the normal routine water stage or flow level in the river and is represented by the bold red line.
Figure 3b shows the rising water level during a flood at the simulation time of 8 h and 30 min, which is nearly crossing the right side of the riverbank.
Figure 3c shows the maximum flood water level, when water touches the natural ground surface and creates high inundation. It is evident from
Figure 3c at 15 h and 30 min that water crosses the left and right levees of the riverbank. At the initial stage, the overflow was low. After some time, the water flow significantly increased, and the volume of water rapidly flowed into the river.
Moreover, it was also noticed that the flood level continuously rose from 8 h and 30 min to 15 h and 30 min. After 7 h, the flow level continuously decreased, and the water level reduced below the flood level. However, due to its unique location, heavy floods generally occur in the Huaihe River between May and October. In 2003, the total annual precipitation was 1024 mm, and floods hit parts of the Huaihe River in July and August. During the flood period in July 2003, water levels in the upper sections of the Huaihe River exceeded the flood warning level five times, with Bengbu Station recording a high stream flow of 6120 m
3/s. However, the measured water levels at the Huainan station in 2003 and 2007 were as usual. The daily measured water levels of the Huainan station in 2003 and 2007 are shown in
Figure 2. The highest water level in 2003 occurred on 9 July, reaching 25.54 m. The highest water level in 2007 was 25.10 m on 7 July. The River profile shows several breakages at points A, B, C, and D. The high-level breakpoint is at A, as shown in
Figure 3c. Differences in the stream of the observed station values occurred at Lutaiz station on 21 July. The peak flow recorded in 2003 was 7800 m
3/s. It can also be seen that on 11 July 2007, the peak flow was 7690 m
3/s. The storage of reservoirs in Qiujiahu, Shang, Xialiudifang, Nanrunduan, Jiangtanghu, and Shiyaoduan City is approximately 0.66 billion m
3. During the flood period, the simulated water storage was larger than that observed (approximately 0.31 billion m
3) upstream of Bengbu station (0.1475 billion m
3, from flood ranges). Due to the lack of reservoir data in 2007, their effects could not be enumerated. Through the validation results of the typical annual flow, the water level errors are all less than 0.2 m, which meets the requirements for flood risk map compilation accuracy. The model results were compared with several other research articles based on location, trend, and variance of individual damage and time. The river 1D model is comparatively similar to the other 1D models, but a very small variation was identified due to the input influencing parameters in the final output of the models [
20].
5.2. MIKE 2D Flood Model and Inundation Maps
The flood risk analysis of the 2D model was simulated in the given boundary conditions, including submerged water depth, flow velocity, and arrival time. The model setup and data processing were taken from the instructions of the DHI MIKE 21 manuals. The model was initially run for two sensitive factors to select an appropriate simulation time step and to make a small parameter modification during calibration. The MIKE 21 hydrodynamic model was employed to compute discharge, and inputting model parameters, such as upstream and downstream flow rates from the one-dimensional river channel model, is necessary to ensure the model runs smoothly. As a result, the MIKE 21 model was calibrated to explore the best parameter configuration for a good match between the simulated and observed data.
The parameters of the diversion structure at the boundary and the side weir of the breach were coupled to calculate the diversion flood’s evolution from the breach connected to the protection zone. The total area of flood protection was 1816.0 km2, and unstructured triangular mesh was used for the total area of flood protection. The grid section’s left side of Cinan Feizuo reduced the mesh size for better accuracy, fully reflecting the actual terrain. The grid size of the river boundary and the structure features above the ground were appropriately reduced. The minimum mesh area was 2000 m2, and the maximum mesh area was 10,000 m2. Due to the absence of measured roughness data, the topographic conditions of the region were considered according to the other similar regional models. The roughness coefficient value of the Cinan Feizuo flood protection area was determined to be 0.031. The dry roughness value was taken to be 0.06 m to improve the calculation accuracy and efficiency of the model, the wet roughness value was set at 0.1 m, and the calculation time step was set to 60 s under the condition that the critical CFL value of 1 was satisfied. The protected area should reflect the actual situation as far as possible, and the key features to be considered should not be ignored. The results show no initial water accumulation in the reserve; the initial depth was 0 m. The upstream boundary condition was kept by the Lutaiz hydrologic station, and the Huainan Hydrologic station took the lower boundary condition for 20-, 50-, and 100-year floods.
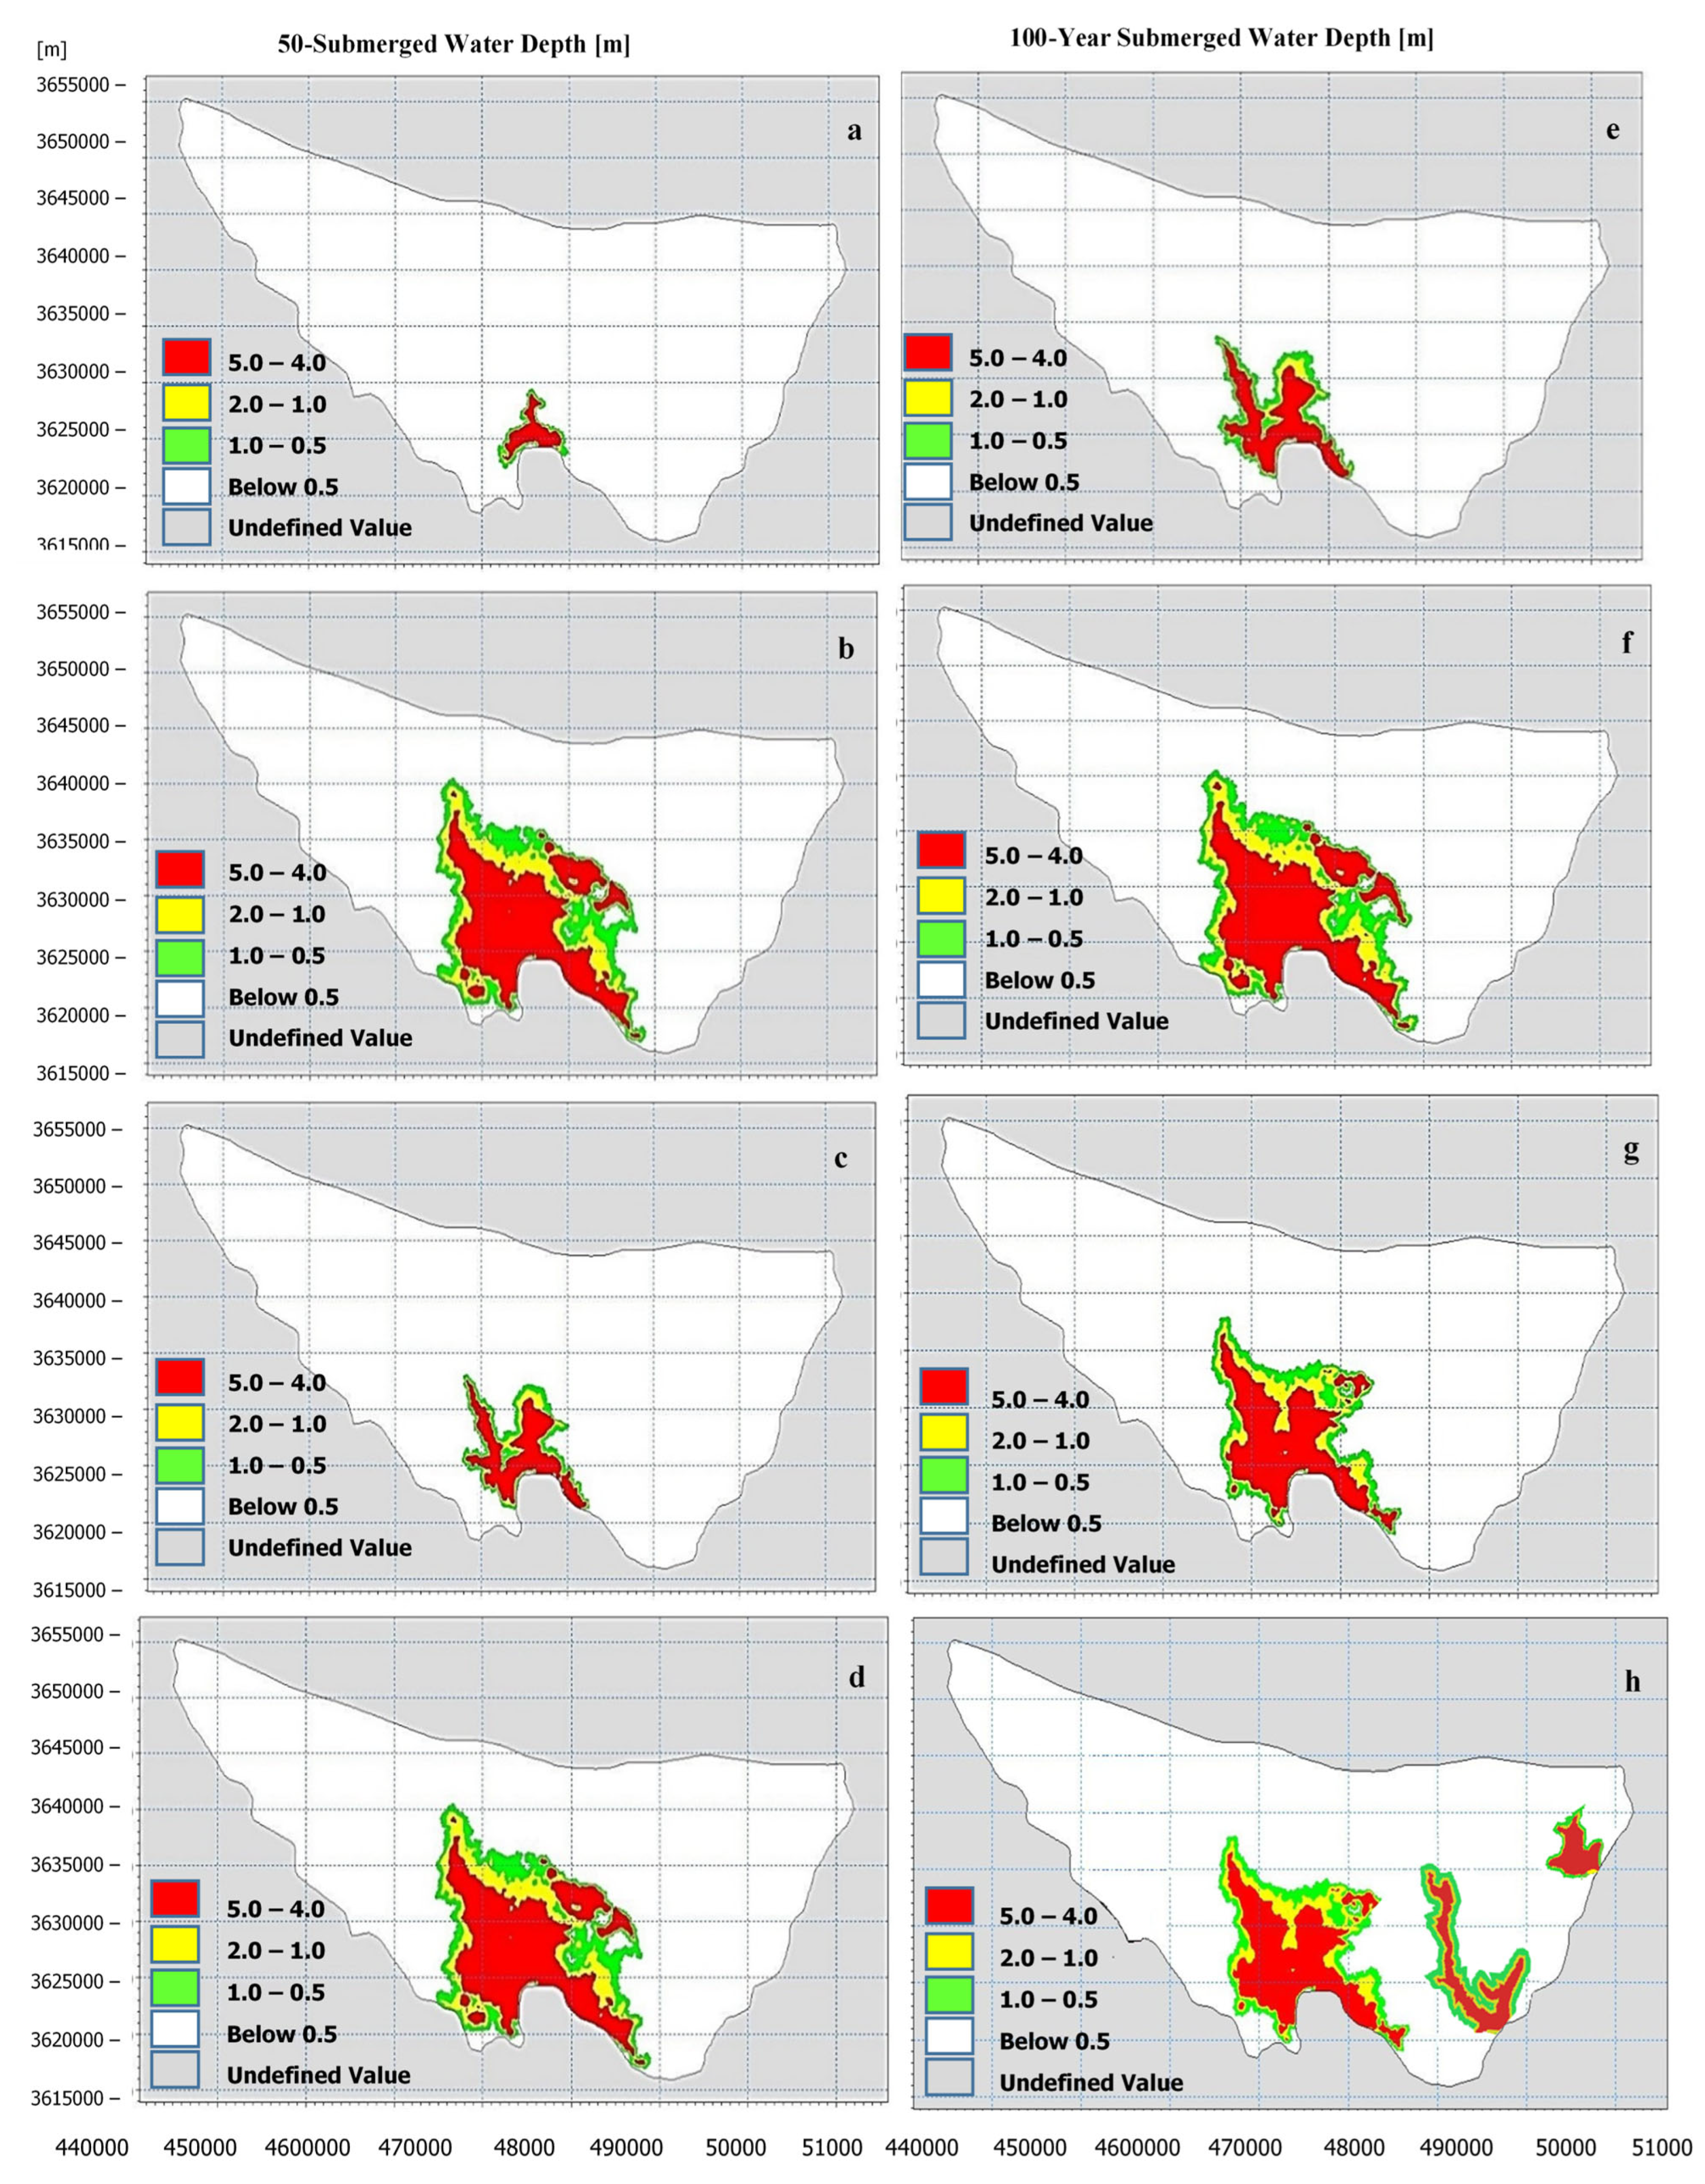
According to the inundation graphs, water moved quickly to the flood protection area outside the river. Based on the velocity and volume, the 50-year flood inundation graphs were divided into four figures, as shown in
Figure 4. According to the first half of the generated result, water crossed the levee in 327 time steps. Water continuously moved in the Cinan Feizuo area with changing time increments, as can be seen in the rest of
Figure 4. The surface elevation clearly shows no changes in the dikes breaking, according to the outcomes of the water level at the Kantian gate in 2007. Based on the 50-year flood simulation results, it can be seen that the dam breaks at 327 time steps, and the flow gradually increases over time, as shown in the inundation maps. It can be seen from the inundation maps that once the dam broke at the 333 time step and erosion began, the water flowed more quickly and entered the flood protection area, eventually reaching the 354 time step. It is also considered that after 345 time steps, the water flow progressively decreased. The water level in the dam break area reached between 4 and 5 m and then slowly declined, as is shown in
Figure 4 of the 50-year flood return period.
Similarly, it was noted that in the 100-year flood inundation, the water flow entered the flood protection area at a comparatively higher rate than the 50-year flood with a lower time step. The inundation in the flood protection area of the Huaihe level increased due to the water level exceeding the existing river dike or water overflowing the flooded area. This situation resulted in inundation in the Cinan Feizuo flood protection area, which was flooded at low time steps. It is important for communities to understand the flood risk and protective measures in residential, business, and agricultural areas that are vulnerable to a river flood.
5.3. Discharge, Submerged Water Depth, and Velocity
The area covered by the medium inundation water depth is the danger zone of the flood protection area. According to the model requirements, the area was divided into zones, namely, Chenbei, Qiji, and Luji. The submerged area was combined with the Huaihe River to find the velocity, and the submerged water depth was taken into consideration to investigate the relative depth and flow rate. It is important to estimate the discharge carrying capacity of any channel, accurately predicting velocity profiles and calculating the depth-averaged velocity. The maximum simulated discharge in a 50-year flood was 4893.32 m3/s, while for a 100-year flood it was 5038.52 m3/s.
Similarly, the velocity and submerged water depth were also higher in the 100-year flood than in the 50-year flood. The maximum submerged water depth was 7.632 m in the 100-year flood, which also had the shortest arrival time (<3 h). The velocity profiles and submerged water depths at different cities in a 50-year flood are shown in
Figure 5. It was observed that the maximum velocity was 0.37 m/s in Chenbei District, 0.15 m/s in Qiji Town, and 0.025 m/s in Luji Town. The Chenbei District’s flow rate was greater than other towns. Another important observation is that the flow velocity peak appears earlier in a 100-year flood.
Similar behavior was observed for the rest of the river cross-sections in a 100-year flood. The 2007 highest flood water level at Chenbei stream was recorded as lower than the measured water level, 25.46 m. The flood peak at the Chenbei stream was selected as the initial boundary condition. The highest velocity and submerged water depth of the Chenbei district are shown in
Figure 6. The 100-year flood water level at Chenbei Lake was 25.70 m, greater than the measured water level of 25.46 m. When the highest flood water level crossed the levee of the Chenbei steam, the model calculated the time steps for the flooding area. The simulation results showed the flood water crossing the embankment of Chenbei, Qiji, and Luji with different time steps. Based on the simulation, a high flood risk level was indicated for Chenbei City in 50 and 100 years. The water level exceeded a high level, inundating the maximum area in the minimum time. Moreover, the frequency of 100-year floods increased, breaking the dike and entering another city, Jiogou. It can be inferred from
Figure 5 and
Figure 6 that the 100-year flood velocity, submerged water depth, and discharge frequency are higher than those of a 50-year flood.
5.4. Flood Impact Analysis
The study on flood impact is composed of three parts. After integrating the socio-economic data, the first phase is to analyze how a flood will affect the population, agricultural land, GDP, highways, and other factors. ArcGIS software captures properties and land uses and links them to spatial geographic data. Secondly, the number of flood losses, such as inundated areas and social and economic losses, are calculated according to the established disaster statistics database, using the ArcGIS platform. Similarly, other assessments include a spatial statistical analysis function, a superimposed analysis of the submerged information, and a distribution layer of socio-economic indicators to obtain the flooded area contained in the village, cultivated land, roads, and affected GDP, among others. Finally, flood impact and loss assessment are calculated for different parameter calculation schemes corresponding to the flood impact results and are analyzed and compared.
5.5. Flood Impact & Loss Assessment
The socio-economic indicators affected by the floods and a summary of the flood losses in the Cinan Feizuo area are summarized in
Table 2,
Table 3 and
Table 4.
6. Discussion
For a long time, the Huaihe River was affected by the Yellow River and complicated by natural, economic, and social conditions. Large floods, high flood peaks, and long durations characterized the floods. The flood disasters in the basin remained a very serious problem [
45]. A numerical simulation of flood evolution can intuitively grasp the flood evolution conditions of different working conditions and flood risk factors, such as submerged water depth and inundation range. A flood assessment based on a numerical simulation of flood evolution can provide technical support for the flood control department’s disaster prevention and mitigation decision making and can formulate a scientific flood control scheduling program and flood emergency plan.
A numerical simulation model was developed to simulate the flood evolution process of the Huaihe River, from Lutaiz to Huainan and the Cinan Feizuo flood protection area, by coupling 1D and 2D simulations. This study simulated the Huaihe River using MIKE 11 (1D), whereas the flood protection area was modeled using MIKE 21 (2D). The two models were combined with 1D-2D MIKE Flood. The integration of the 1D and 2D models significantly improved the implementation of the dry and wet boundary theory, the examination of the study area with an unstructured mesh, and the confirmation of the model’s stability using structural features such as roads and bridges. The simulated water levels were compared to the measured water levels through calibration and validation to ensure the accuracy of the 1D model. Simulated and measured water levels from different flood events were compared. Calibration was carried out using data from the 2003 flood event at the Xiashankou water station, while validation was performed using data from the 2007 and 2017 flood events at the same station. The inflow boundary condition was established at the Lutaiz hydrological station, while the lower boundary conditions were established at the Huainan hydrologic station. Manning’s coefficient was determined using GIS software and an interpolation method. To ensure the model’s accuracy, the appropriate Manning’s n coefficient was assigned to each land cover based on standard values. According to the findings, the one-dimensional model of the Huaihe River channel was considered appropriate for the flood boundary condition in the study area. However, several measures were implemented to optimize the 2D flood evolution for the flood protection area. These measures included the implementation of the dry and wet water depth method to enhance the calculation precision of the model’s dynamic boundary and the use of the unstructured grid to subdivide the flood protection area into linear objects. The generalization was transformed into a dike, and the actual width was taken from the bridge span to account for evaluating the impact of the water.
The flood risk analysis and numerical simulation of flood inundation were conducted for the Cinan Feizuo flood protection area, considering the 50-year and 100-year design flood conditions of the Huaihe River mainstream. The study compared and analyzed the flood evolution and submerged depth under different working conditions and examined flood risk factors such as flooding range and flood losses. Using GIS, flooding areas and submerged water depth were analyzed with high flood levels, flood damages, and socio-economic indicators. The study sorted out the affected villages, cultivated land, roads, and GDP information after the 50-year and 100-year floods, with the flooded areas being 794.29 km2 and 635.43 km2, respectively. The study also classified and statistically analyzed the flood influence results corresponding to different calculation schemes and compared the results. The findings of this study can offer valuable technical assistance for evaluating flood risk and estimating damages in a flood-prone area. These results are highly relevant and can be used as a reference for decision making with respect to regional flood control, disaster reduction, and infrastructure planning.
8. Conclusions
Flood modeling assists in identifying areas that are especially vulnerable to flooding and improving the resiliency of mitigation plans. Therefore, flood modeling is crucial for managing flood risks and analyzing their impact to ensure future development. This research aims to incorporate the evaluation of flood risks and analyze their impact using DHI Mike software for 1D and 2D flood modeling techniques. The 1D model was limited to the Huaihe River, while the 2D model was used for flood protection. The 1D flood model was calibrated at the Xiashankou hydrological station, using data from the 2003 flood event, and was subsequently validated using data from the 2007 and 2017 flood events of the Huaihe River. The simulation results from the 1D model in 2003 and 2007 were similar, while in 2017, values were slightly higher than the measured values. Overall, the model results are deemed acceptable within the given limits. The major cause of the 2007 and 2017 flood events was the breaching of dikes, which resulted in water levels above the river levee at the breached dikes.
The 2D modeling was carried out for the Cinan Feizuo flood protection area, considering 50-year and 100-year flood events. The primary goal was protecting several cities and the left and right sides of the river embankment. Based on the modeling requirements, the area was divided into three zones: Chenbei, Qiji, and Luji. The maximum simulated discharge for a 50-year flood was 4893.32 m3/s, while for a 100-year flood, it was 5038.52 m3/s. Similarly, the velocity and submerged water depth were greater for the 100-year flood than the 50-year flood. The maximum submerged water depth was 7.632 m in a 100-year flood, which also demonstrated the shortest arrival time (<3 h). The average maximum velocity and submerged water depths at different cities for the 50-year flood were 0.37 m/s in Chenbei District, 0.15 m/s in Qiji town, and 0.025 m/s in Luji town. The flood inundation maps indicate that water overtopped the embankments of Chenbei, Qiji, and Luji less than 333 time intervals. Based on the simulations, Chenbei city showed a high flood risk level for the 50- and 100-year scenarios. The water level exceeded a critical threshold, rapidly inundating the maximum area in the shortest possible time.
Finally, possible damages were computed for the 50- and 100-year flood events in Cinan Feizuo, damaging people, land, and agriculture. The impact and losses caused by the flood were evaluated using statistical analysis techniques. Flood analysis data, such as the submerged range and water depth, are combined with basic geographic information and the social and economic situation of the submerged area using GIS software and flood loss rate for analysis and calculation. The resulting statistical data are valuable for decision making and planning for disaster preparedness and flood management at the local level.


 ,
, 


