Article

Correlating Air Pollution Concentrations and Vehicular Emissions in an Italian Roadway Tunnel by Means of Low Cost Sensors

1
ENEA Italian National Agency for New Technologies, Energy and Sustainable Economic Development, Centro Ricerche Portici, 80055 Portici, Italy
2
ANAS Azienda Nazionale Autonoma delle Strade Statali S.p.A., 00185 Roma, Italy
*
Author to whom correspondence should be addressed.
Atmosphere 2023, 14(4), 679; https://doi.org/10.3390/atmos14040679
Submission received: 15 February 2023 / Revised: 24 March 2023 / Accepted: 28 March 2023 / Published: 4 April 2023
(This article belongs to the Special Issue Air Quality Prediction and Modeling)

Abstract

:
There is an increasing scientific interest in studying vehicular traffic pollution in road tunnels. This is due both to the interest in evaluating the effect that the different polluting gases can have on the driving style of motorists and also to the hypothesis that tunnels could be considered as closed systems in which the vehicular traffic–pollution correlation is easier to study because it is more easily separated from other effects. In this work, a system of low-cost IoT sensor nodes for the detection of carbon monoxide (CO), nitrogen dioxide (NO2), ozone (O3), particulate matters (PM1, PM2.5, PM10), relative humidity (RH) and temperature (T) has been installed in an Italian tunnel, where vehicular traffic has been measured and classified for type of vehicles. The results of the measurement campaign, which lasted 3 months, from April to June 2022, allowed us to state that road tunnels actually behave like closed and isolated systems in which pollution may be directly correlated to the traffic volume and type. Furthermore, data show that quite high values of the major pollutants are observable in the tunnel in comparison to the external environment. As such, IoT sensor nodes may contribute to a distributed measuring approach on the road tunnel system mechanics assessment including, as an example, the operational impacts of forced ventilation.

1. Introduction

There is a twofold interest in studying the pollution levels detectable in road tunnels. The first is connected to the observation that, in these structures, pollutant concentrations are much higher than those observable outdoors are normally detected [1]; the second is an intrinsic interest in studying the correlation between vehicular traffic and pollution levels since it has been observed that road tunnels behave as relatively closed systems in which the main source of pollution is vehicular traffic and, therefore, the study of pollution levels in a road tunnel allows for the ability to obtain unique information on the correlation between traffic flow and air pollution [2].
The growing interest in all industrialized countries with respect to the problem of monitoring and controlling air pollution levels stems from a now well-established scientific literature, which has made possible to unequivocally correlate the presence of pollutants in the air we breathe with the occurrence of various human pathologies. For example, fine dust particles, in particular PM2.5, are considered a possible contributing factor in the onset of brain pathologies [3]; for NO2, PM2.5 and PM10, SO2, anomalous levels have been instead correlated to respiratory pathologies [4,5,6], while cardiovascular diseases can be correlated with altered levels of CO, NO2, O3 and PM10 [7,8]. Still more recently, the presence of fine particles has been connected to both the onset of cerebral system problems and to possible diseases of the male reproductive system [9,10].
Road vehicular traffic competes with several other sources such as domestic heating or energy production to determine the levels of air pollution observed in the air we breathe [11]. There is therefore a specific interest in studying how much of this problem is related to traffic and other possible contributing causes, so as to be able to implement more precise mitigation policies for the problem. In this respect, for the reasons above explained, road tunnels can be a particularly useful study system.
There is also a specific interest connected to the higher levels of pollution which, as mentioned above, are observed in road tunnels. It has been observed that air pollution also has effects on attention, and, in the case of drivers, this can lead to significant increases in reaction times, which can lead to road accidents. Indeed, a higher occurrence of accidents has been observed in road tunnels with respect to those observed in open-air roads, an issue that could be therefore correlated with the higher concentrations of pollutants detected in the tunnels [12,13].
The problem of studying pollutants in road tunnels has been the subject of various studies, in addition to the above-cited review by Marinello and co-workers [1]. In [14], the authors conducted a monitoring campaign deploying two devices for the sampling of the air gas concentration at the beginning and at the end of a tunnel. They considered no forced ventilation and only airflow induced by cars’ movement. The measurement campaign lasted for seven consecutive days. The results are focused on the study of emission factors, and for the analyzed case, the authors emphasize the relevance of the contribution of non-exhaust vehicular emissions together with vehicles’ speed and age on air quality. In [15], the authors collected samples for seven days not consecutive, between 1 p.m. and 2 p.m., which corresponds to the hours when children exit from schools in the city of Guanajuato (Mexico). The measurement campaign revealed that in the tunnel, PM concentration exceeds safe limits. In [16], the authors investigated the concentrations of pollutants immediately out of the tunnels that connect Europe and Asia in Istanbul. They deployed two measuring devices at the exit of the tunnel to evaluate the impact of the gas that comes from the tunnel on the air quality in proximity of the tunnel, taking also into account the speed of the wind, temperature, humidity and traffic volumes. They concluded that the tunnel operation has no adverse effect on the air quality in the city of Istanbul. In [17] also the dependence of PM10 and PM2.5 from vehicle speed has been investigated and the authors concluded that there is a certain dependence from vehicle speed only for PM10. Additionally, in this case, the measurement stations were placed at the entrance and at the exit of the tunnel. In [18,19,20], the authors deal with Emission Factors (EF) of different species in a complex urban environment. In particular, in [18], EF and profile concentrations of CO2, PM and PAH have been investigated within an urban tunnel in Naples, Italy. The obtained results showed that EF for CO2 was within the range of expected values, while for PM, EF was about four times higher than expected.
In this work, we present, for the first time, a study that allows for the correlation of vehicular traffic to pollution levels in an Italian road tunnel. An IoT system of pollution detectors of the MONICATM type has been installed in the “Galleria San Demetrio,” a motorway tunnel in Sicily (Italy), to evaluate this correlation [21]. The results obtained in terms of concentration levels of NO2, CO, PM2.5, PM10 and O3 have been correlated to the vehicular traffic data recorded, in the same period, on the arterial road involved in the experimentation. The results show a good correlation between the observed pollution levels and vehicular traffic, light and heavy, and confirm that, inside the tunnel, the pollutants concentrations are greater than those observable outside, in agreement with what was reported by Marinello and co-authors [1].
The work is organized in four sections. In Section 2, the measurement system and the installation site are briefly described, referring to [21] for a more detailed description; Section 3 shows both the observed pollution data (Section 3.1) and the vehicular traffic data (Section 3.2), recorded in the same periods, Section 4 is dedicated to the discussion of the results, while finally, in Section 5, the conclusions of the work will be presented.

2. Materials and Methods

2.1. IoT Pollution Measuring System

The continuous monitoring of a roadway tunnel requires a well-fitted measurement system. The challenges posed by the internal tunnel environment and by the specifications of a long sampling campaign alongside the need for minimal or no maintenance are tough. Tunnels are often used to connect two points with minimal distance, diverting the heavy traffic from sensitive roads. They pass through mountains or are artificially covered. At some point inside the tunnel, some parameters are unpredictable as they can vary quickly. Humidity, temperature, particulate concentration, water leakages from the top of the tunnel and small animals’ population during a long period of time are the main, but not only, concerns of the preliminary design of a device that needs operate unattended for a long time, delivering the correct result of its measurement at proper times. Also, frequent access of specialized personnel to the tunnel needs to be avoided to leave the traffic flow unaffected. All these considerations led to the design of the Measuring Station shown in Figure 1.
The first specification with which the Measuring Station needs to comply is the robustness of the external case that acts as protection for the electronic parts. The case is waterproof because drops of water can fall from the top of the tunnel, and the Measuring Station may also be operating in open air, in which case protection from the rain is needed. At the same time, the case must allow the air to flow inside the case so that it can reach the sensors inside. For this purpose, two round apertures have been made on the bottom side of the case, and a metallic net has been posed in front of the apertures to prevent small animals or insect to enter inside the case and damage cables or electronics. The case needs to be connected to the power supply by means of its power cable. Power converters transform the voltage value to the values required for the electronics. All communications with the external world are operated wirelessly using the Bluetooth protocol or the cellular network.
Inside the case, an ENEA MONICA™ device is embedded. This is a multi-sensor device aimed to fulfill air quality monitoring tasks in both fixed and mobile scenarios. In this work, it has been customized for estimating the concentrations of CO, NO2, O3, PM1, PM2.5 and PM10 measurements using an array of electrochemical sensors from Alphasense (X-AH version) and a Plantower PMS7003 Optical Particle Counter. The gas sensor array is controlled by a commercial Analog Front End board (AFE) from Alphasense and is connected to the ADC pins of an STm32 Nucleo board for microcontroller-based operation.
A C language-based firmware provides for electronic circuits control, sensors polling and local data processing features, while finally transmitting through a BLE transponder the captured and processed JSON-formatted data to all wirelessly connected hardware systems. In this work, a Raspberry Pi 4 has been used to capture MONICA™ data and send it, through RESTful APIs, to a MongoDB-based backend in ENEA C.R. Portici facilities (360 packets/day). Raspberry Pi operations are controlled through a Python Script and PM2 scheduling software. The latter was particularly useful for guaranteeing reliability, checking for connectivity and operativity features and rebooting them when needed while alerting through emails the intended remote operator.
As widely recognized, low-cost sensors used in this work suffer from non-target gas and environmental interference. As such, the MONICA device is also equipped with T and RH sensors whose assessments are used for correcting for the latter source of interference. When field-calibrated [22], the device has shown capable of relatively accurate readings in short-term deployments with MAE and R2 figures ranging in a few µg/m3 for gas concentration estimate (e.g., MAE < 10 µg/m3 and R2 > 0.85 for NO2, see [23]) as well as fractioned PM concentrations (e.g., MAE ca. 7.5 µg/m3 and R2 ca. 0.6 for PM2.5, see [24]). However, while for gas sensors, it has been shown that, under suitable assumptions, in-field calibration can be reliably transferred in other operating scenarios, the same is not true for low-cost PM sensors, at least those of the Plantower family [25]. Therefore, for this work, CO, NO2 and O3 concentrations were estimated using the MONICA in field calibration, while for PM1, PM2.5 and PM10, factory calibration was used [26]. It is well-known that field calibration is hampered by concept drift, and long-term sensors’ performances themselves could be affected by ageing and poisoning; however, when properly recognized, these conditions may be mitigated with appropriate recalibration actions [27].
The MONICA device is architecturally and sensor-wide like several recent commercial devices (e.g., those from AQMesh, Aeroqual, EarthSense, etc. [28,29,30]), but its modularity and open architecture allow for different embodiment which can be customized for both fixed and mobile applications. With respect to reference analyzers, low-cost devices are extremely savvy with cost ranging from 1k Euros (MONICA Device) to a few tens of thousands Euros, compared to a few hundred thousand Euros of a fully equipped reference station. Size-wise, they rarely exceed that of a backpack (bare MONICA unit has volume of about cm2) and this allows for pervasive and harsh environment deployments.
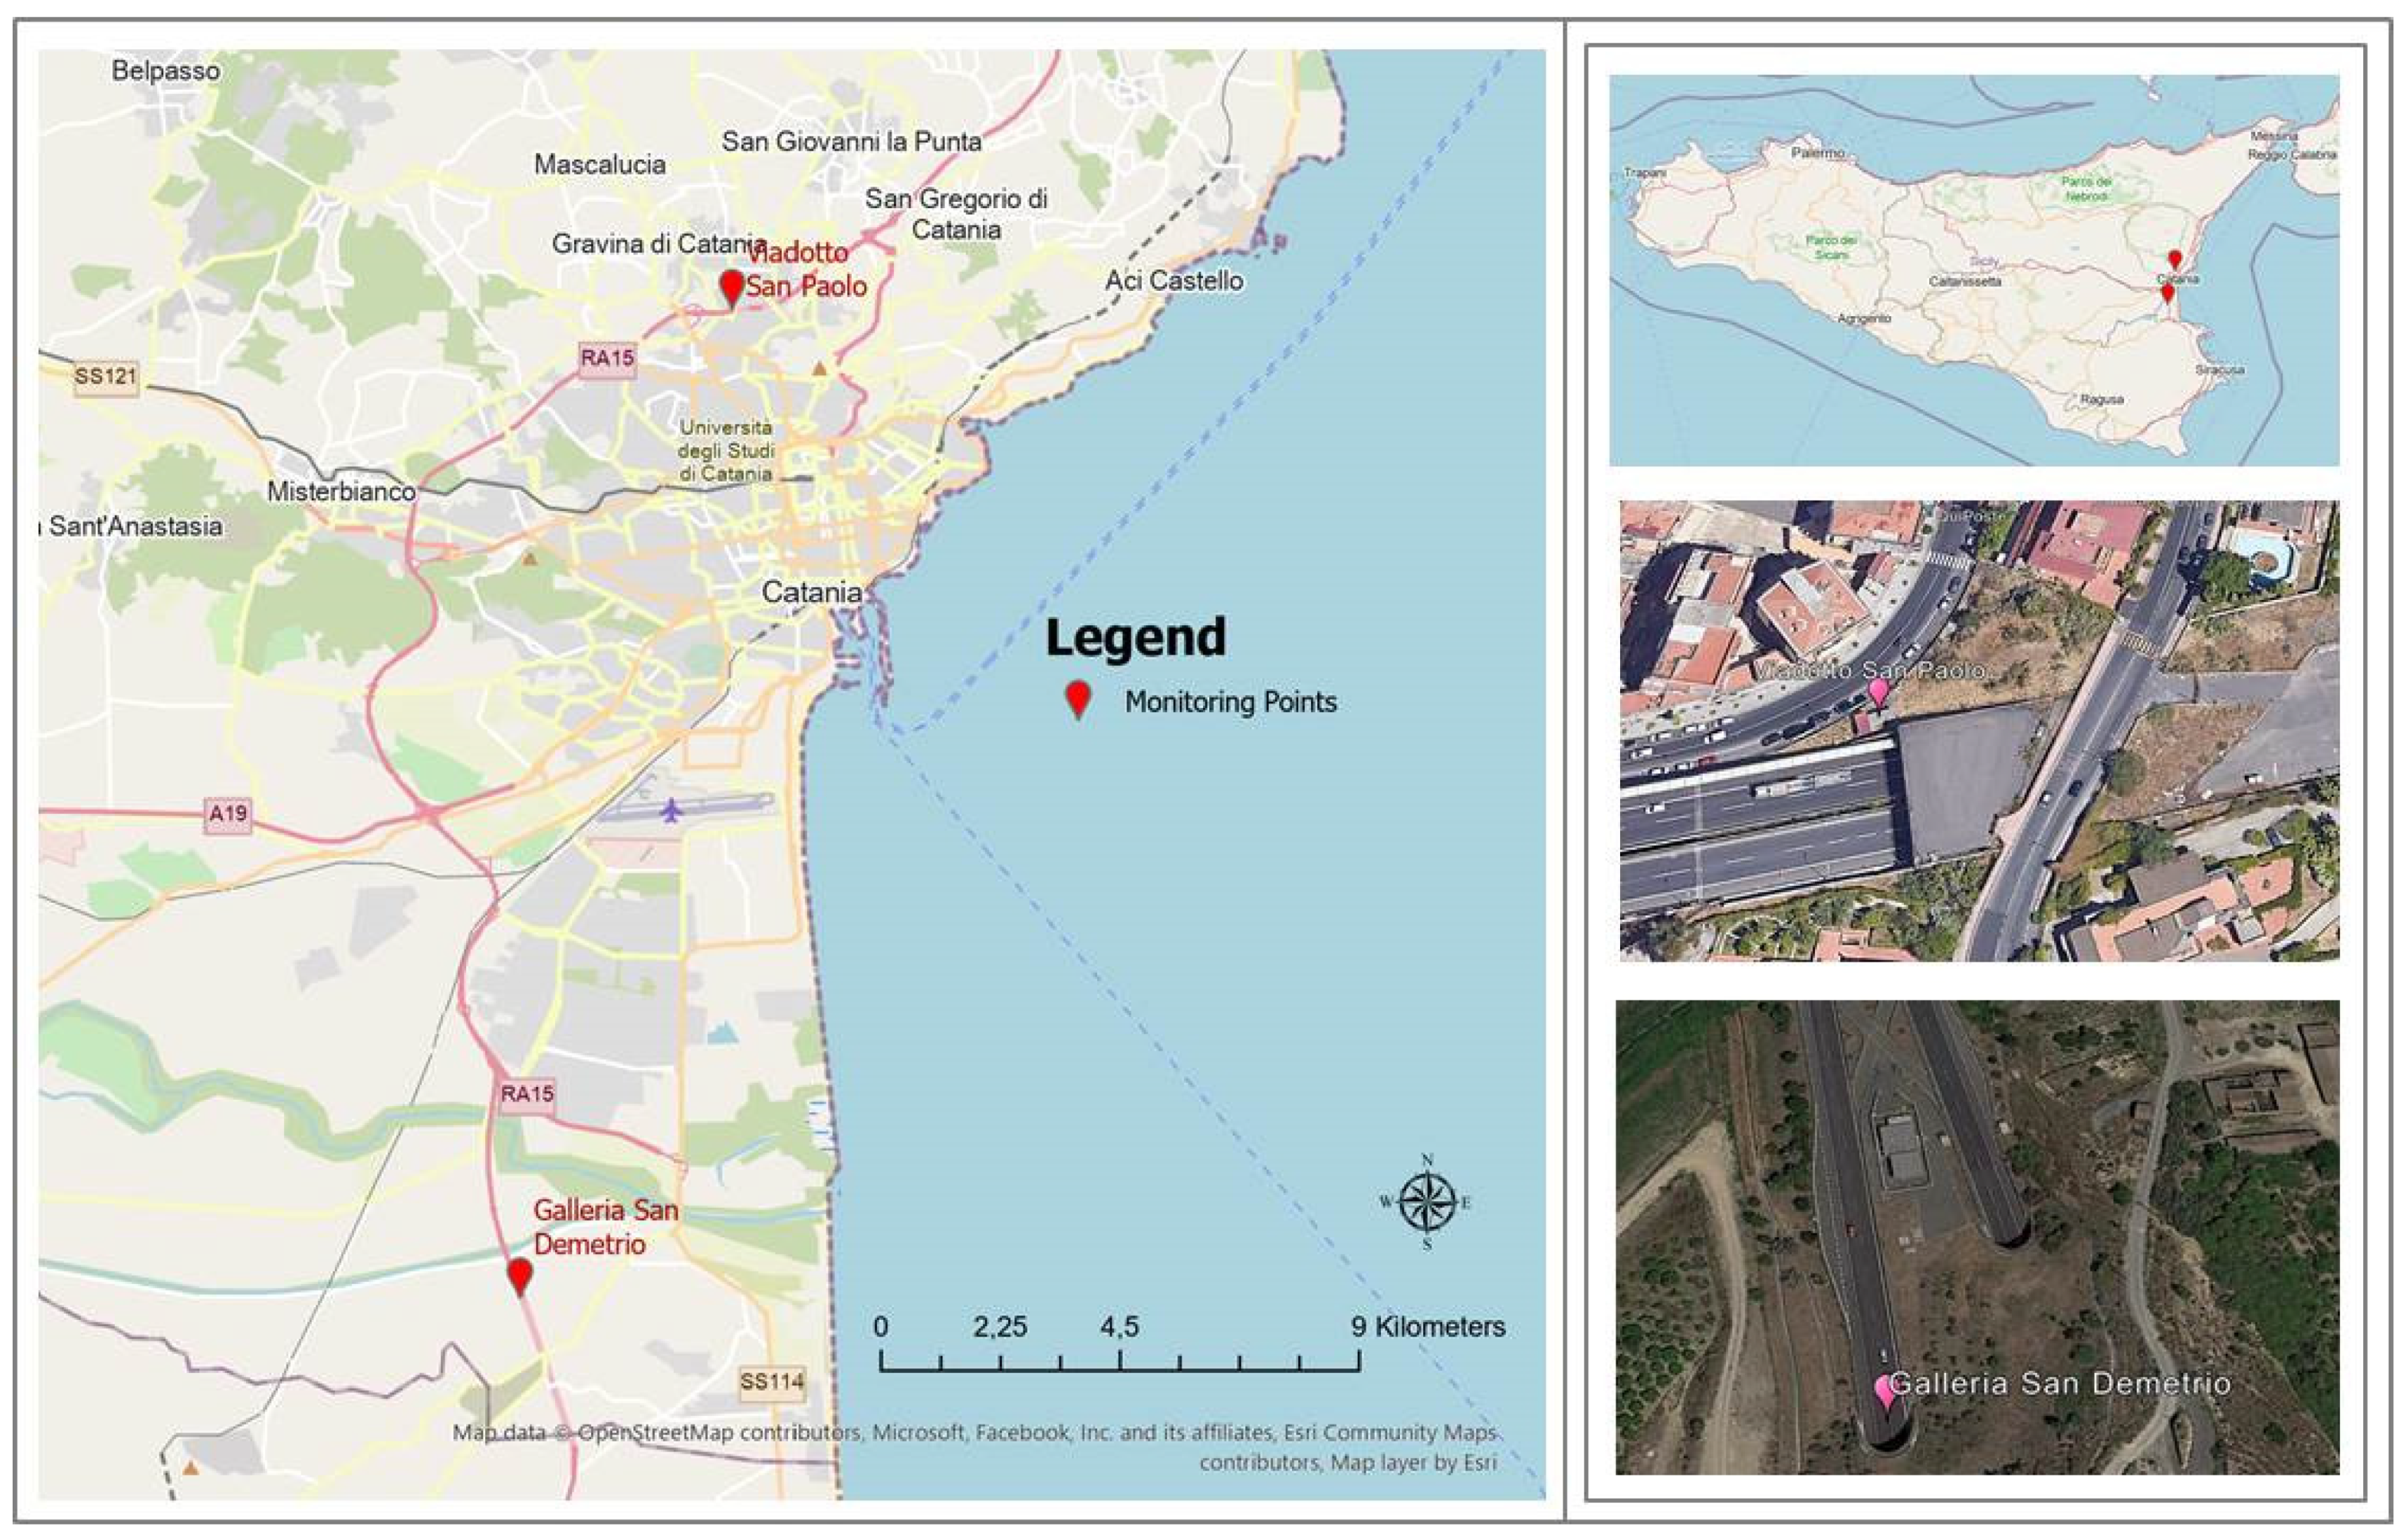
In Figure 2, a map of the Catania-Siracusa RA15 highway is shown on the right, where the position of the measuring stations on the viaduct (viadotto San Paolo) and in the tunnel (Galleria San Demetrio) are shown. On the bottom left, a photo of a Google air map of the tunnel San Demetrio (latitude: 37.36084, longitude: 15.0474463) and of the viadotto San Paolo (latitude: 37.36084, longitude: 15.0474463), both in the Siracusa direction, are shown. On the top-left is a view of the highway position in Sicily.
The installation consists of a MONICA sensor node, identified by ID number AFE357, placed within the tunnel, in an emergency area that has been exploited to allow the safe position of the monitor. An additional IoT measurement station, identified as AFE336, has been installed at the San Paolo Viaduct, which is another outdoor emergency area located 20 km outside the tunnel, in order to compare the data recorded inside the tunnel with those recorded outdoors.
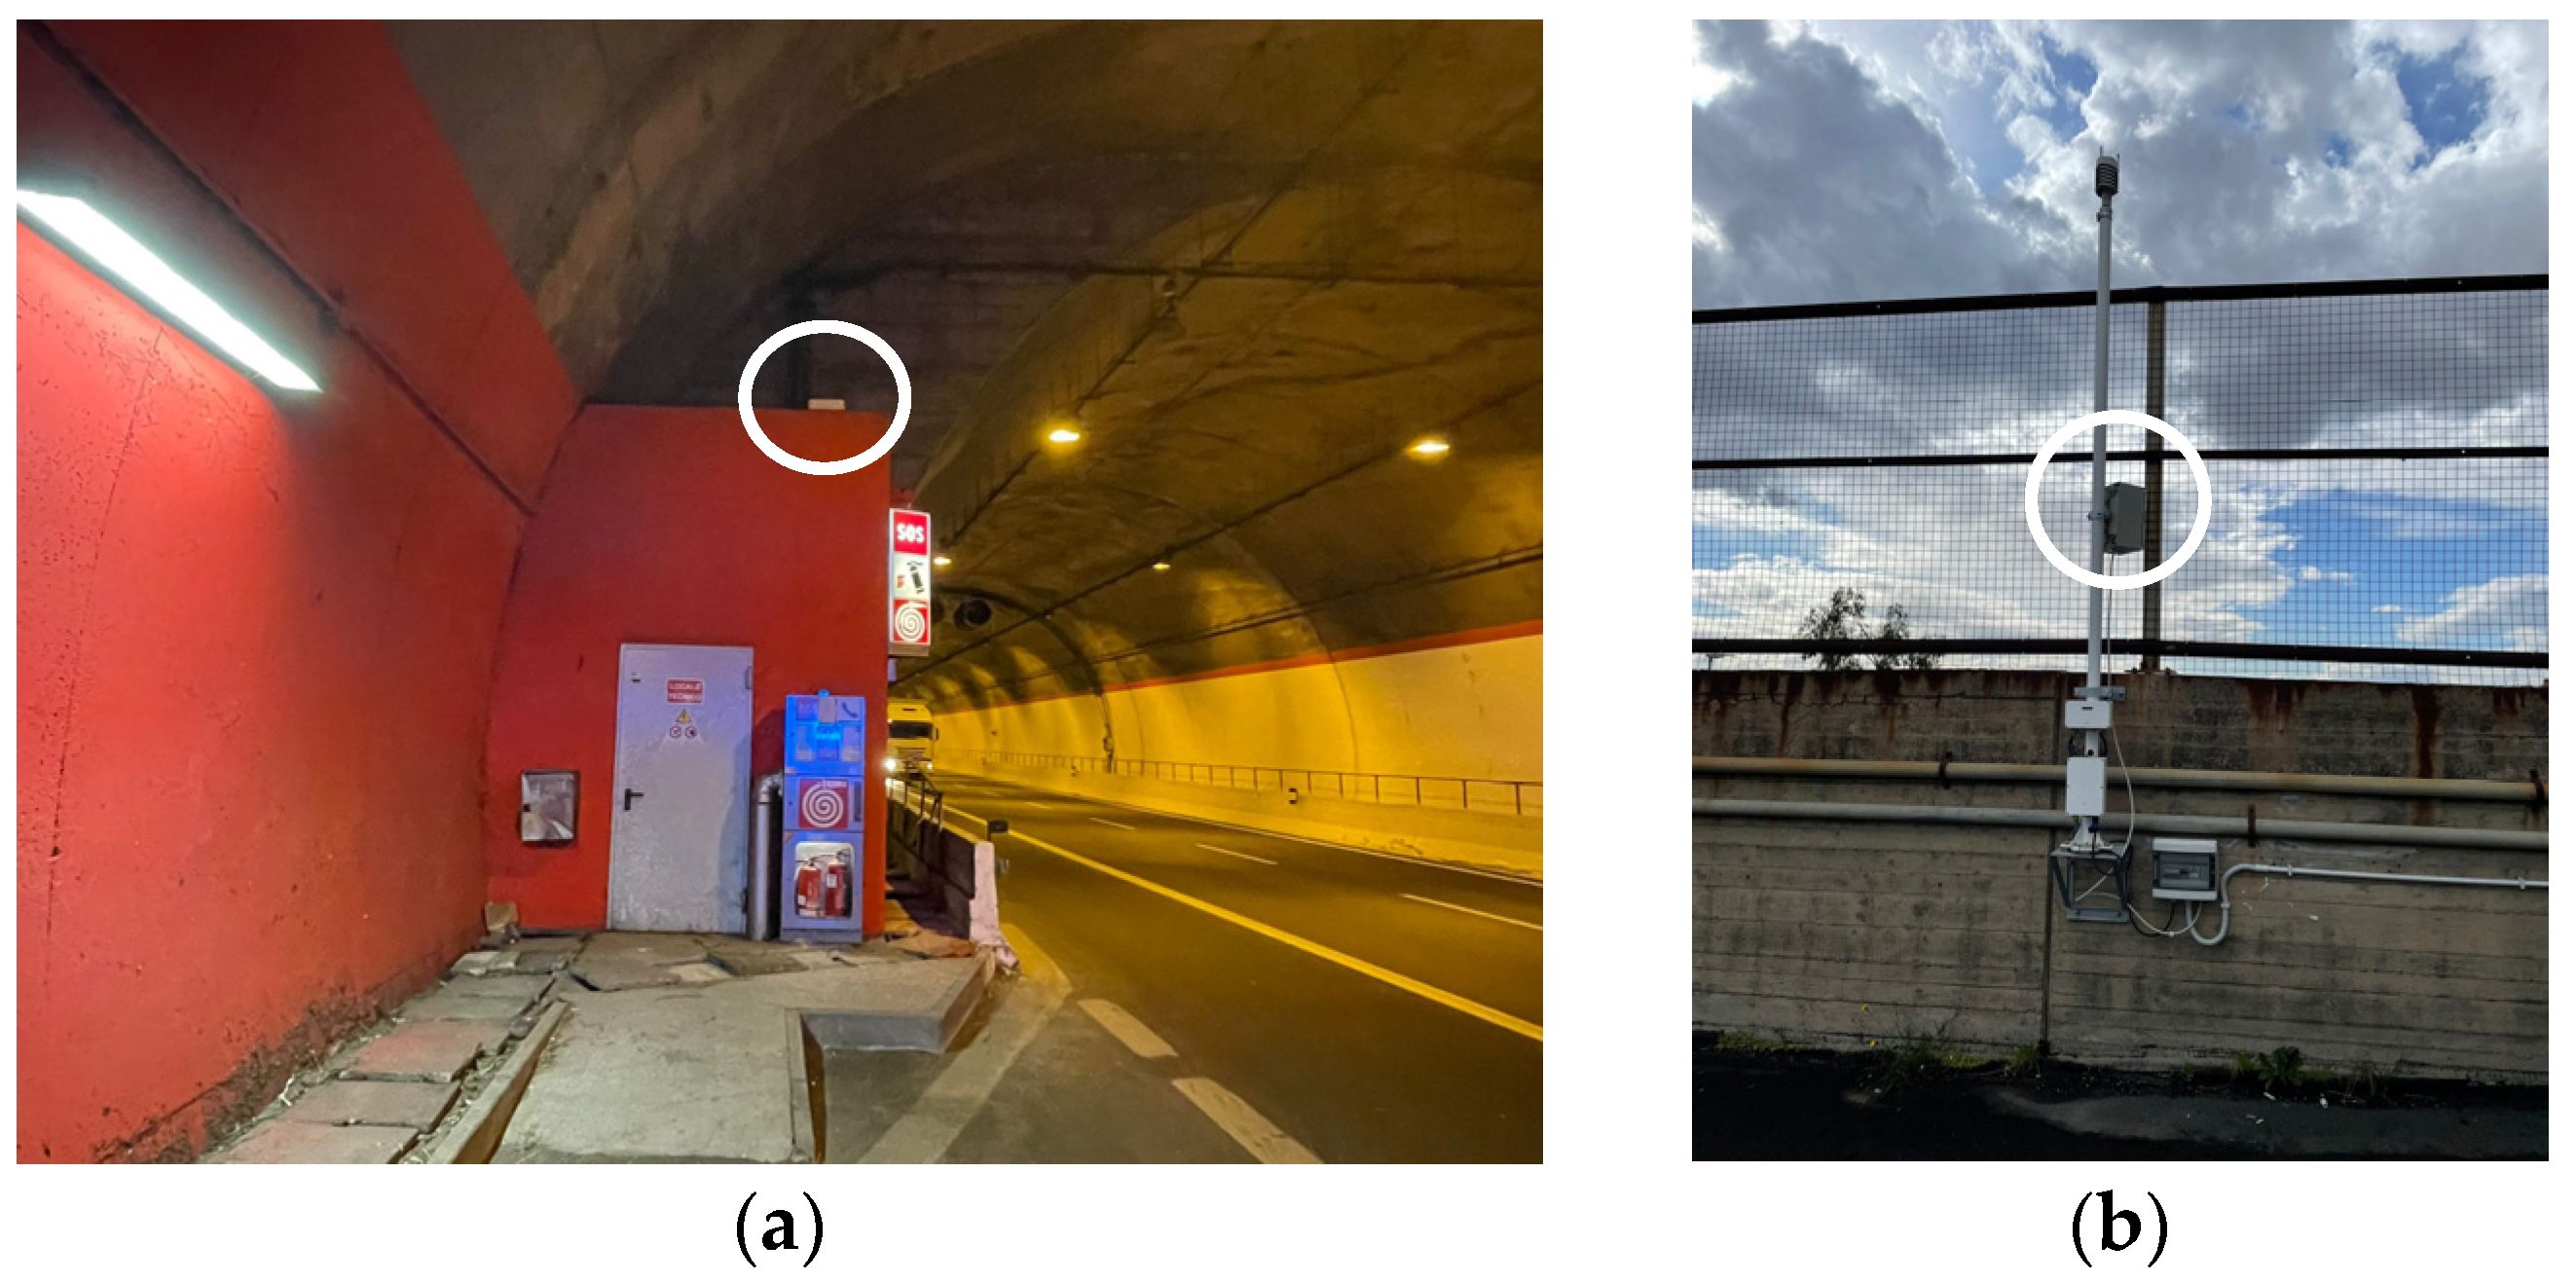
In Figure 3, a photo of the MONICA installed in the emergency area within the gallery (a) and on the viaduct (b) is shown.

2.2. Vehicular Traffic Data

Vehicular traffic data have been provided by ANAS, the Italian Highways Office [31] and Encompass traffic information related to hourly averaged count of vehicles for both driving directions of the Catania-Siracusa highway. In our study, we analysed only the descending traffic direction (from Catania to Siracusa), corresponding to the side of the San Demetrio gallery and of the viaduct where the IoT measuring systems have been deployed. Data related to vehicular traffic are the result of the surveys at the motorway entrance tollbooth.

3. Measurement

The MONICA devices have been installed in different periods, starting from February 2022. Here, below data mainly refer to the period April–June 2022. The processed dataset consists of 4-min averaged data samples for all the recorded pollutants together with relative environmental parameters, T and RH [21]. Unless differently specified, data below reported are hourly averaged; specifically, data are shown in terms of a mean average value (Mean) as resulting from the whole three-month-long campaign with an uncertainty given by its normal standard deviation (std) and the range of values (min-max) observed for each monitored parameter. For sake of completeness, in Table S1, standard error is reported.

3.1. Temperature and Relative Humidity

In Table 1, T and RH values are reported for the two MONICA monitors installed in the gallery and on the viaduct. For comparison, the temperature and relative humidity recorded in the nearest ARPA (Agenzia Regionale per la Protezione Ambientale) reference station in Misterbianco (Catania) just 5 km away from the Viaduct San Paolo, are also reported [32].

3.2. CO, NO2 and O3 Concentrations

In Table 2, pollutants concentrations estimations measured in the tunnel during the three months under investigation are reported. For the sake of clarity, it is worth noting that all MONICA devices, outdoor and in tunnel, are equipped for ozone monitoring. However, MONICA monitors installed inside the tunnel show values of O3 that appear within the experimental error. This implies that no ozone is detected inside the tunnel.

3.3. PM Concentrations

As far as PM are concerned, the sensors installed within the MONICA monitors were not previously “in-field calibrated”. In Table 3, the PM values estimated in the gallery and outside by the MONICA monitors are reported together with the data recorded by the reference ARPA station in Misterbianco.

3.4. Vehicular Traffic Data

Traffic data are provided in terms of hourly vehicles count for the whole three months under investigation. In Table 4, the number of vehicles per hour, n°/day counted in each day of the trimester further classified in terms of weekday, pre-holiday (Saturdays and all days before Italian public holidays) and holiday, is reported. Data are shown in terms of mean average value (Mean) as resulting from the whole three-months-long campaign, its normal standard deviation (std) and the range of values (min-max) observed.
In Table 5, the total number of vehicles counted on each day of the trimester is reported and further classified in terms of heavy-duty or light-duty vehicles, for both the San Demetrio tunnel and for Viaduct San Paolo.

4. Results and Discussion

4.1. Comparing Weather and Air Quality Data Outside the Tunnel

As it is shown in Table 1, the mean temperature value measured by MONICA on the viaduct is T = 29.00 °C, 40% higher than the temperature recorded by the regulatory ARPA station in Misterbianco. MONICA measures the temperature inside the two protective chambers designed to protect operation in the harsh gallery environment, a case design where air recirculation and the refreshing effect of the winds are very limited. The higher temperature recorded with respect to open air is therefore coherent with this physical scenario. Moreover, since RH is measured by the MONICA monitor by means of a sensor that is within the box, close to the temperature sensor, the higher temperature in the box explains the lower RH value, 31%, recorded, that is about half the value observed in open air.
Data reported in Table 2 show that CO and NO2 mean concentrations measured by the MONICA monitor on the viaduct are 0.38 mg/m3 and 33 µg/m3, respectively, much higher than the values measured by the regulatory monitoring station. This, too, seems consistent due to the position of the MONICA in an area where strong car emissions are expected. Finally, as far as O3, 51 µg/m3 is considered, the values recorded on the viaduct and the ARPA values recorded in Misterbianco can be considered as equal, taking into account the experimental error.
Finally, Table 3 shows that for both PM2.5 and PM10, the concentrations measured by the MONICA on the viaduct are lower than the values measured by the regulatory station. Such underestimation is well-known in the scientific literature (see [25,33,34]) and mainly attributed to two specific issues: either to a fluid-dynamic limitation of the LCS used or to the need for developing specific in-field calibration to cope with the limitations of the fab calibration used. Actually, for MONICA monitors, when such specific site-dependent calibration algorithms have been developed and applied, such as in the case of the Air Heritage project [35], PM2.5 and PM10, Root Mean Square Error (RMSE) as low as only a few percentages with respect to the values obtained by a reference station nearby, can be obtained. Unfortunately, for the case under investigation, up to now the PM low-cost sensor implemented in MONICA could not be on-site calibrated and care has to be therefore used in handling both the gallery and the viaduct PM estimations. Despite this, data reported in Table 3 shows that, also for both PM10 and PM2.5, as it is found for CO and NO2, average values in the gallery are higher than those recorded on the viaduct, but no further consideration can be developed as far as the absolute values are concerned. For the following discussion, correction factors of 1.5 and 4, as from [33], have been used for PM2.5 and PM10, respectively. As far as the data on the viaduct, PM concentrations of 18 µg/m3 and 56 µg/m3 can be then estimated for PM2.5 and PM10 (in italic in Table 3).

4.2. Comparing MONICA Weather and Air Quality Data Inside the Tunnel and on the Viaduct

The variation of the temperature inside the tunnel is much limited with respect to what is observed outdoors: the mean temperature is around 26.5 °C, compared to the 29 °C recorded by MONICA on the viaduct. In terms of range of variation, temperature never overcomes 37 °C against the 48 °C observed in the same period outdoors and never decreases below about 15 °C against the about 11 °C observed on the viaduct. For RH, the difference is still more limited: inside the gallery, RH ranges between 19% and 62% compared to 9% up to 62% observed outside. The average value in the gallery is, however, sensibly higher than the corresponding value recorded outdoors: 41% and 30%, respectively, which is again still consistent with the lower temperature recorded by MONICA inside the gallery.
CO and NO2 mean concentrations measured by the MONICA monitor inside the tunnel and are 0.52 mg/m3 and 89 µg/m3, respectively, which is much higher than the corresponding values, 0.38 mg/m3 and 33 µg/m3, measured by the MONICA on the Viaduct. As above recalled, for ozone, no comparison can be performed.
As far as for PM2.5 and PM10, correcting the measured concentrations by using the calibration factors 1.5 and 4, respectively, results in estimated concentrations measured by MONICA of 18 µg/m3 and 56 µg/m3, respectively.

4.3. Vehicular Traffic Data

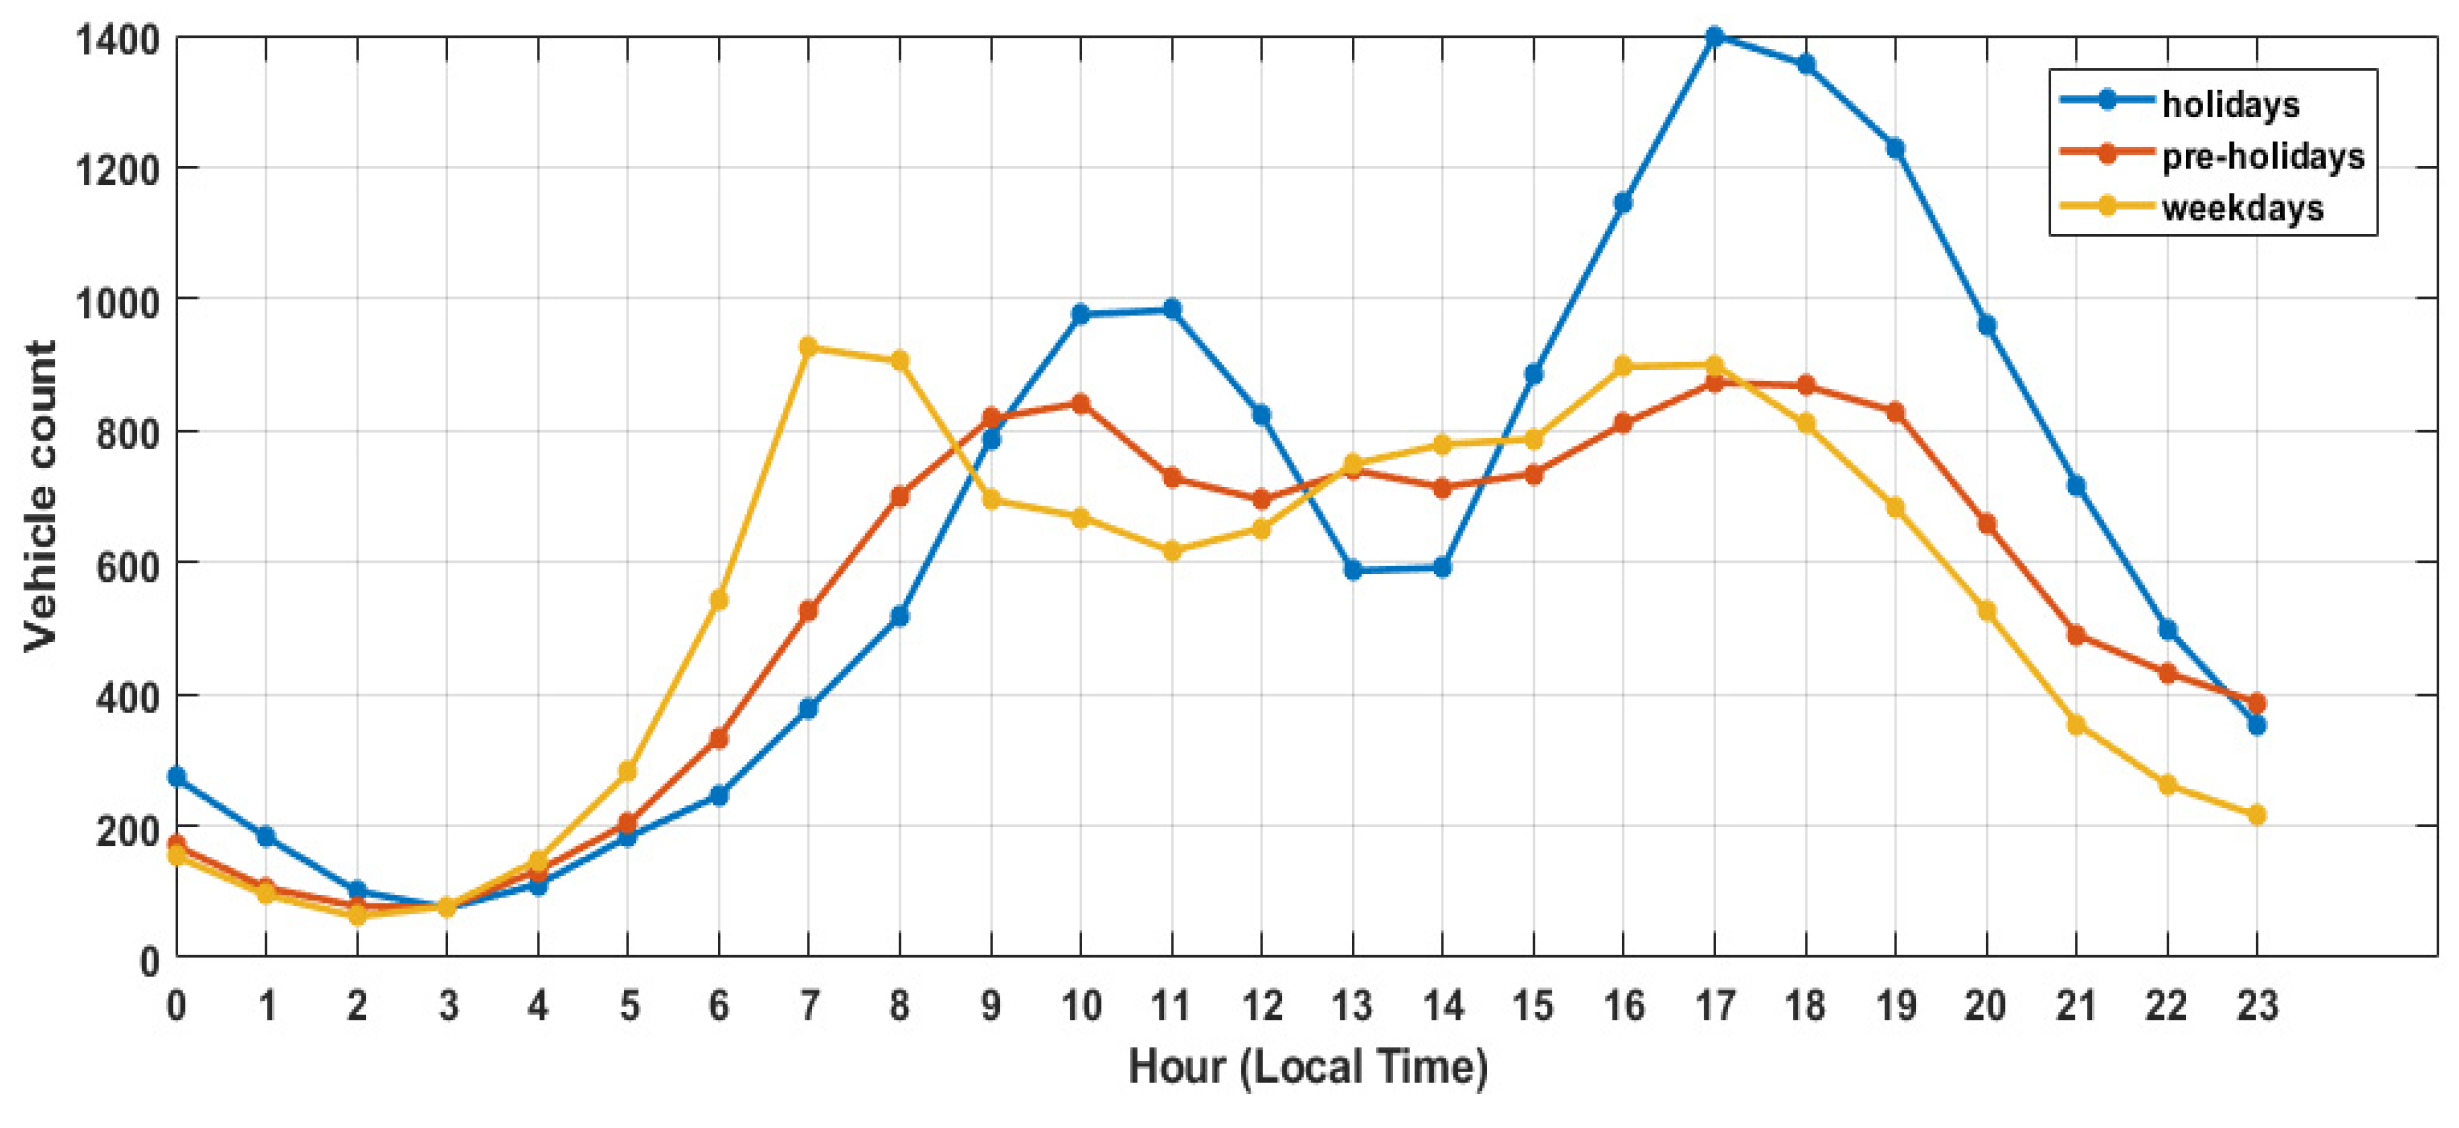
As far as vehicular data are concerned, data in Table 4 shows that the number of vehicles passing through the Catania-Siracusa highway is quite similar during pre-holidays, holidays and weekdays. On the Viaduct San Paolo, placed at the immediate entrance of the highway, whatever day is considered, a traffic flow that is threefold higher than the traffic flows observed in the gallery, placed almost at the end of highway exit, is observed. In the gallery, a slight increase (less than 20%) in the average traffic flow is observed on pre-holidays and holidays, contrary to what occurs on the viaduct. In Table 5, we report the total number of vehicles that have passed through the highway in the period of interest for this investigation, further classified in terms of typology (heavy or light duty). On the viaduct it is shown that, while on weekdays this number is roughly around 77,000+/−1900 vehicles per quarter, it slightly decreases during pre-holidays and holidays to 66,000 and 59,000, respectively. Moreover, while on the weekdays there is a 6% of heavy-duty vehicles transiting on normal weekdays, this percentage falls to 4.2% on pre-holidays and to just less than 2% on holidays. Within the gallery, on weekdays the total number of vehicles counted is roughly around 27,500+/−900 vehicles per quarter and it remains more or less unchanged during pre-holidays (slightly less than 27,000 vehicles per quarter) then sensibly rises on holidays up to values larger than 30,000 vehicles per quarter. There is however a change in the typology of the traffic involved since while on the weekdays there is an 8–9% of heavy-duty vehicles transiting every day, similarly to what observed on the viaduct, this percentage falls to 6.7% on pre-holidays and to just less than 2% on holidays. Data show that the highway under investigation is a multi-purpose highway, characterized by commuting to work on weekdays and holiday transfers during the weekends, especially in the area where the Galleria San Demetrio is placed. This is better shown in Figure 4, where the daily vehicular flow into the gallery San Demetrio is reported by hourly average over the three months of the investigation, differentiating among weekdays, pre-holidays and holidays.
On weekdays, the vehicle number remains quite high, over 500 counts/h, starting at 6 a.m. and up to 8 p.m. The vehicle count remains moreover relatively flat all over the daytime, at a value around 800 vehicles/h. During pre-holidays and, still more evidently during holidays, the characteristic double-peaked curve typical of any kind of human commuting becomes more evident with a simultaneous shift of the 500 vehicles threshold from 6 a.m. to 7 a.m., on pre-holidays and up to 8 a.m. on holidays.

4.4. Correlating Traffic Flow and Air Quality

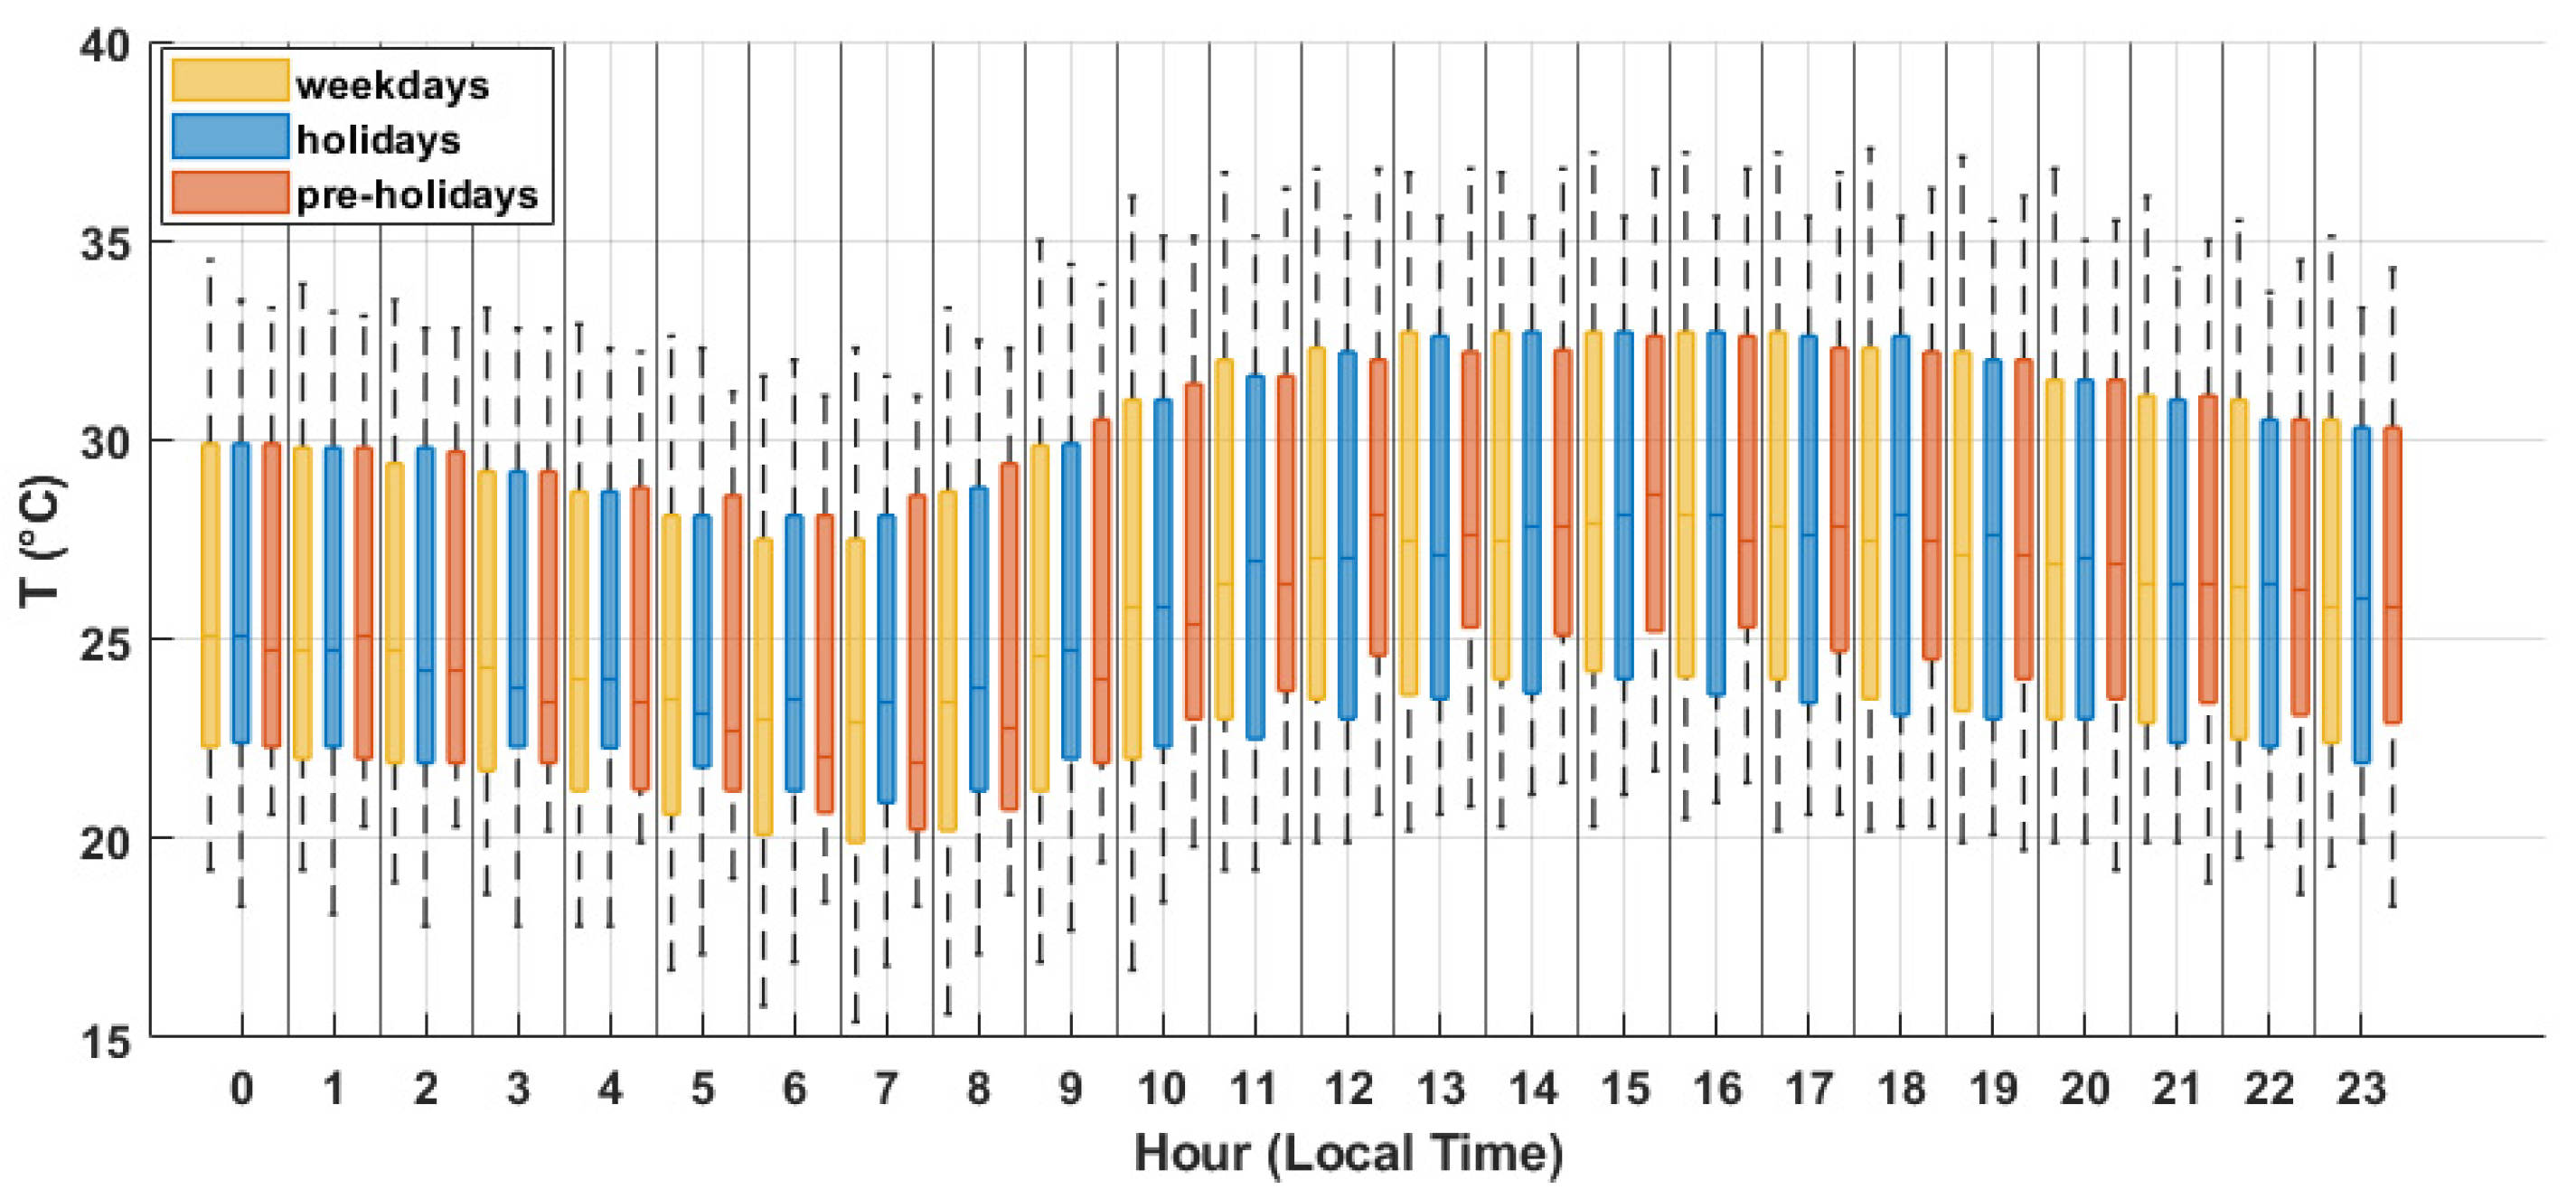
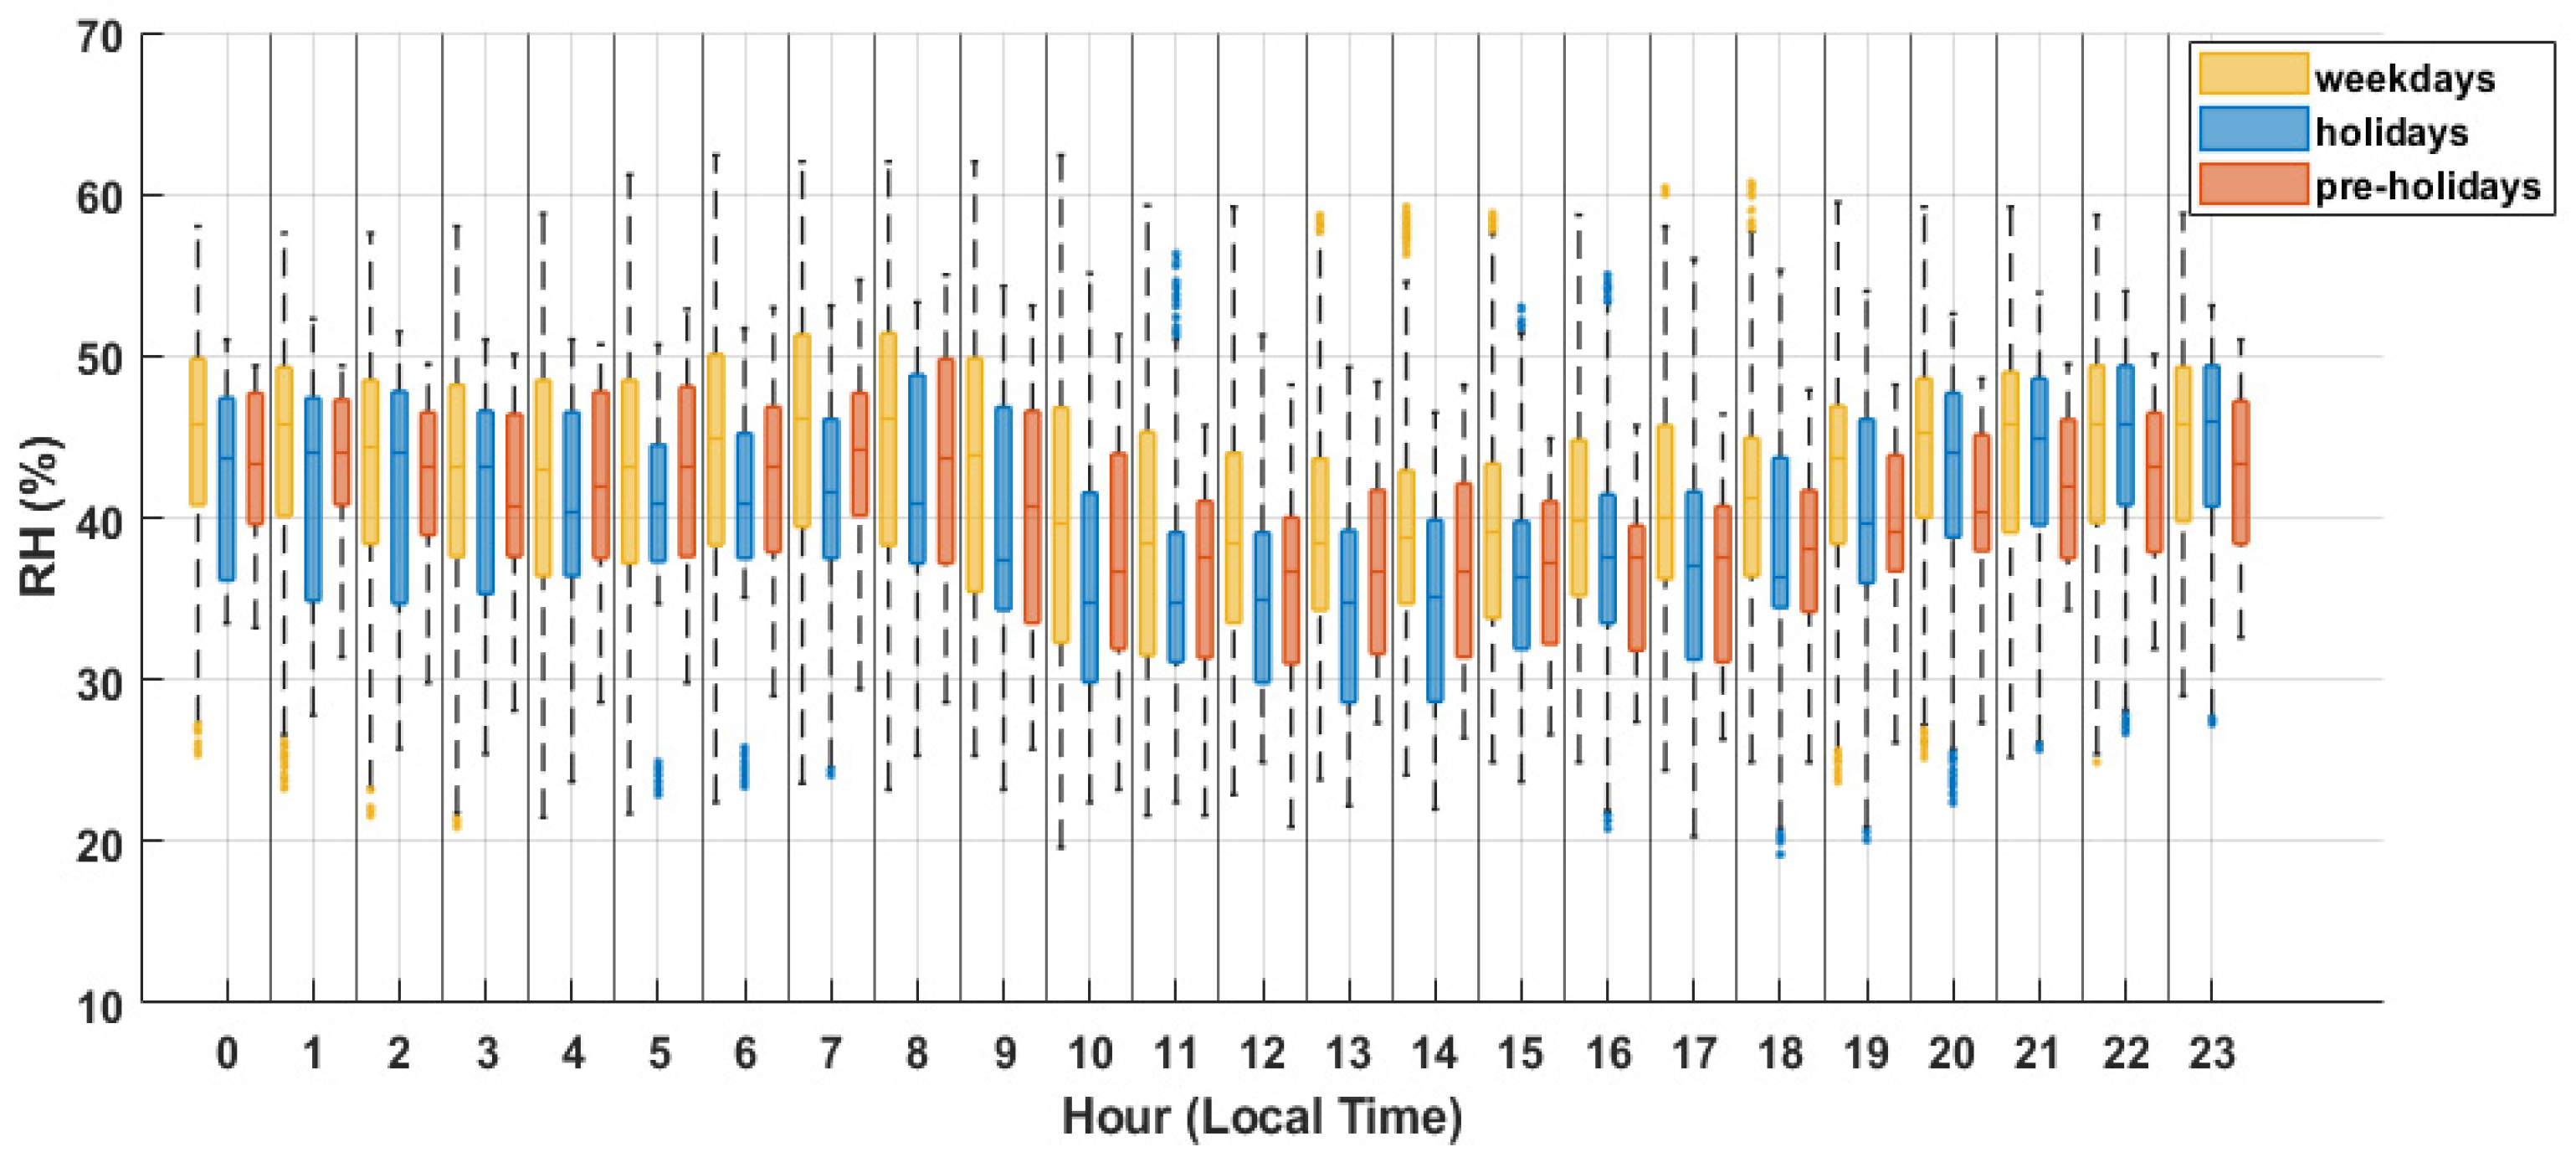
In Figure 5 and Figure 6, temperature and RH behaviours within the gallery are reported, according to weekdays, pre-holidays and holidays.
As expected, also considering the experimental error, T and RH do not substantially depend on the specific day of the week. Temperature within the gallery shows mean values that are only 10% different from the corresponding values measured by MONICA outside and as expected, it is lower and it is characterized by a more limited range of variation, suggesting a weaker correlation to the external meteorological changes. As far as RH is concerned, the situation is somehow different: the mean value recorded in the gallery, although still sensibly lower than the ARPA value, is in fact more than 30% higher than the corresponding value measured by MONICA outdoors. Such an increase can be explained either by the lower mean temperature recorded in the gallery and/or by the fact that car engines emit about 200 g water per km, an amount that in a closed system, such as the gallery can be considered, may result in the increase in RH observed.
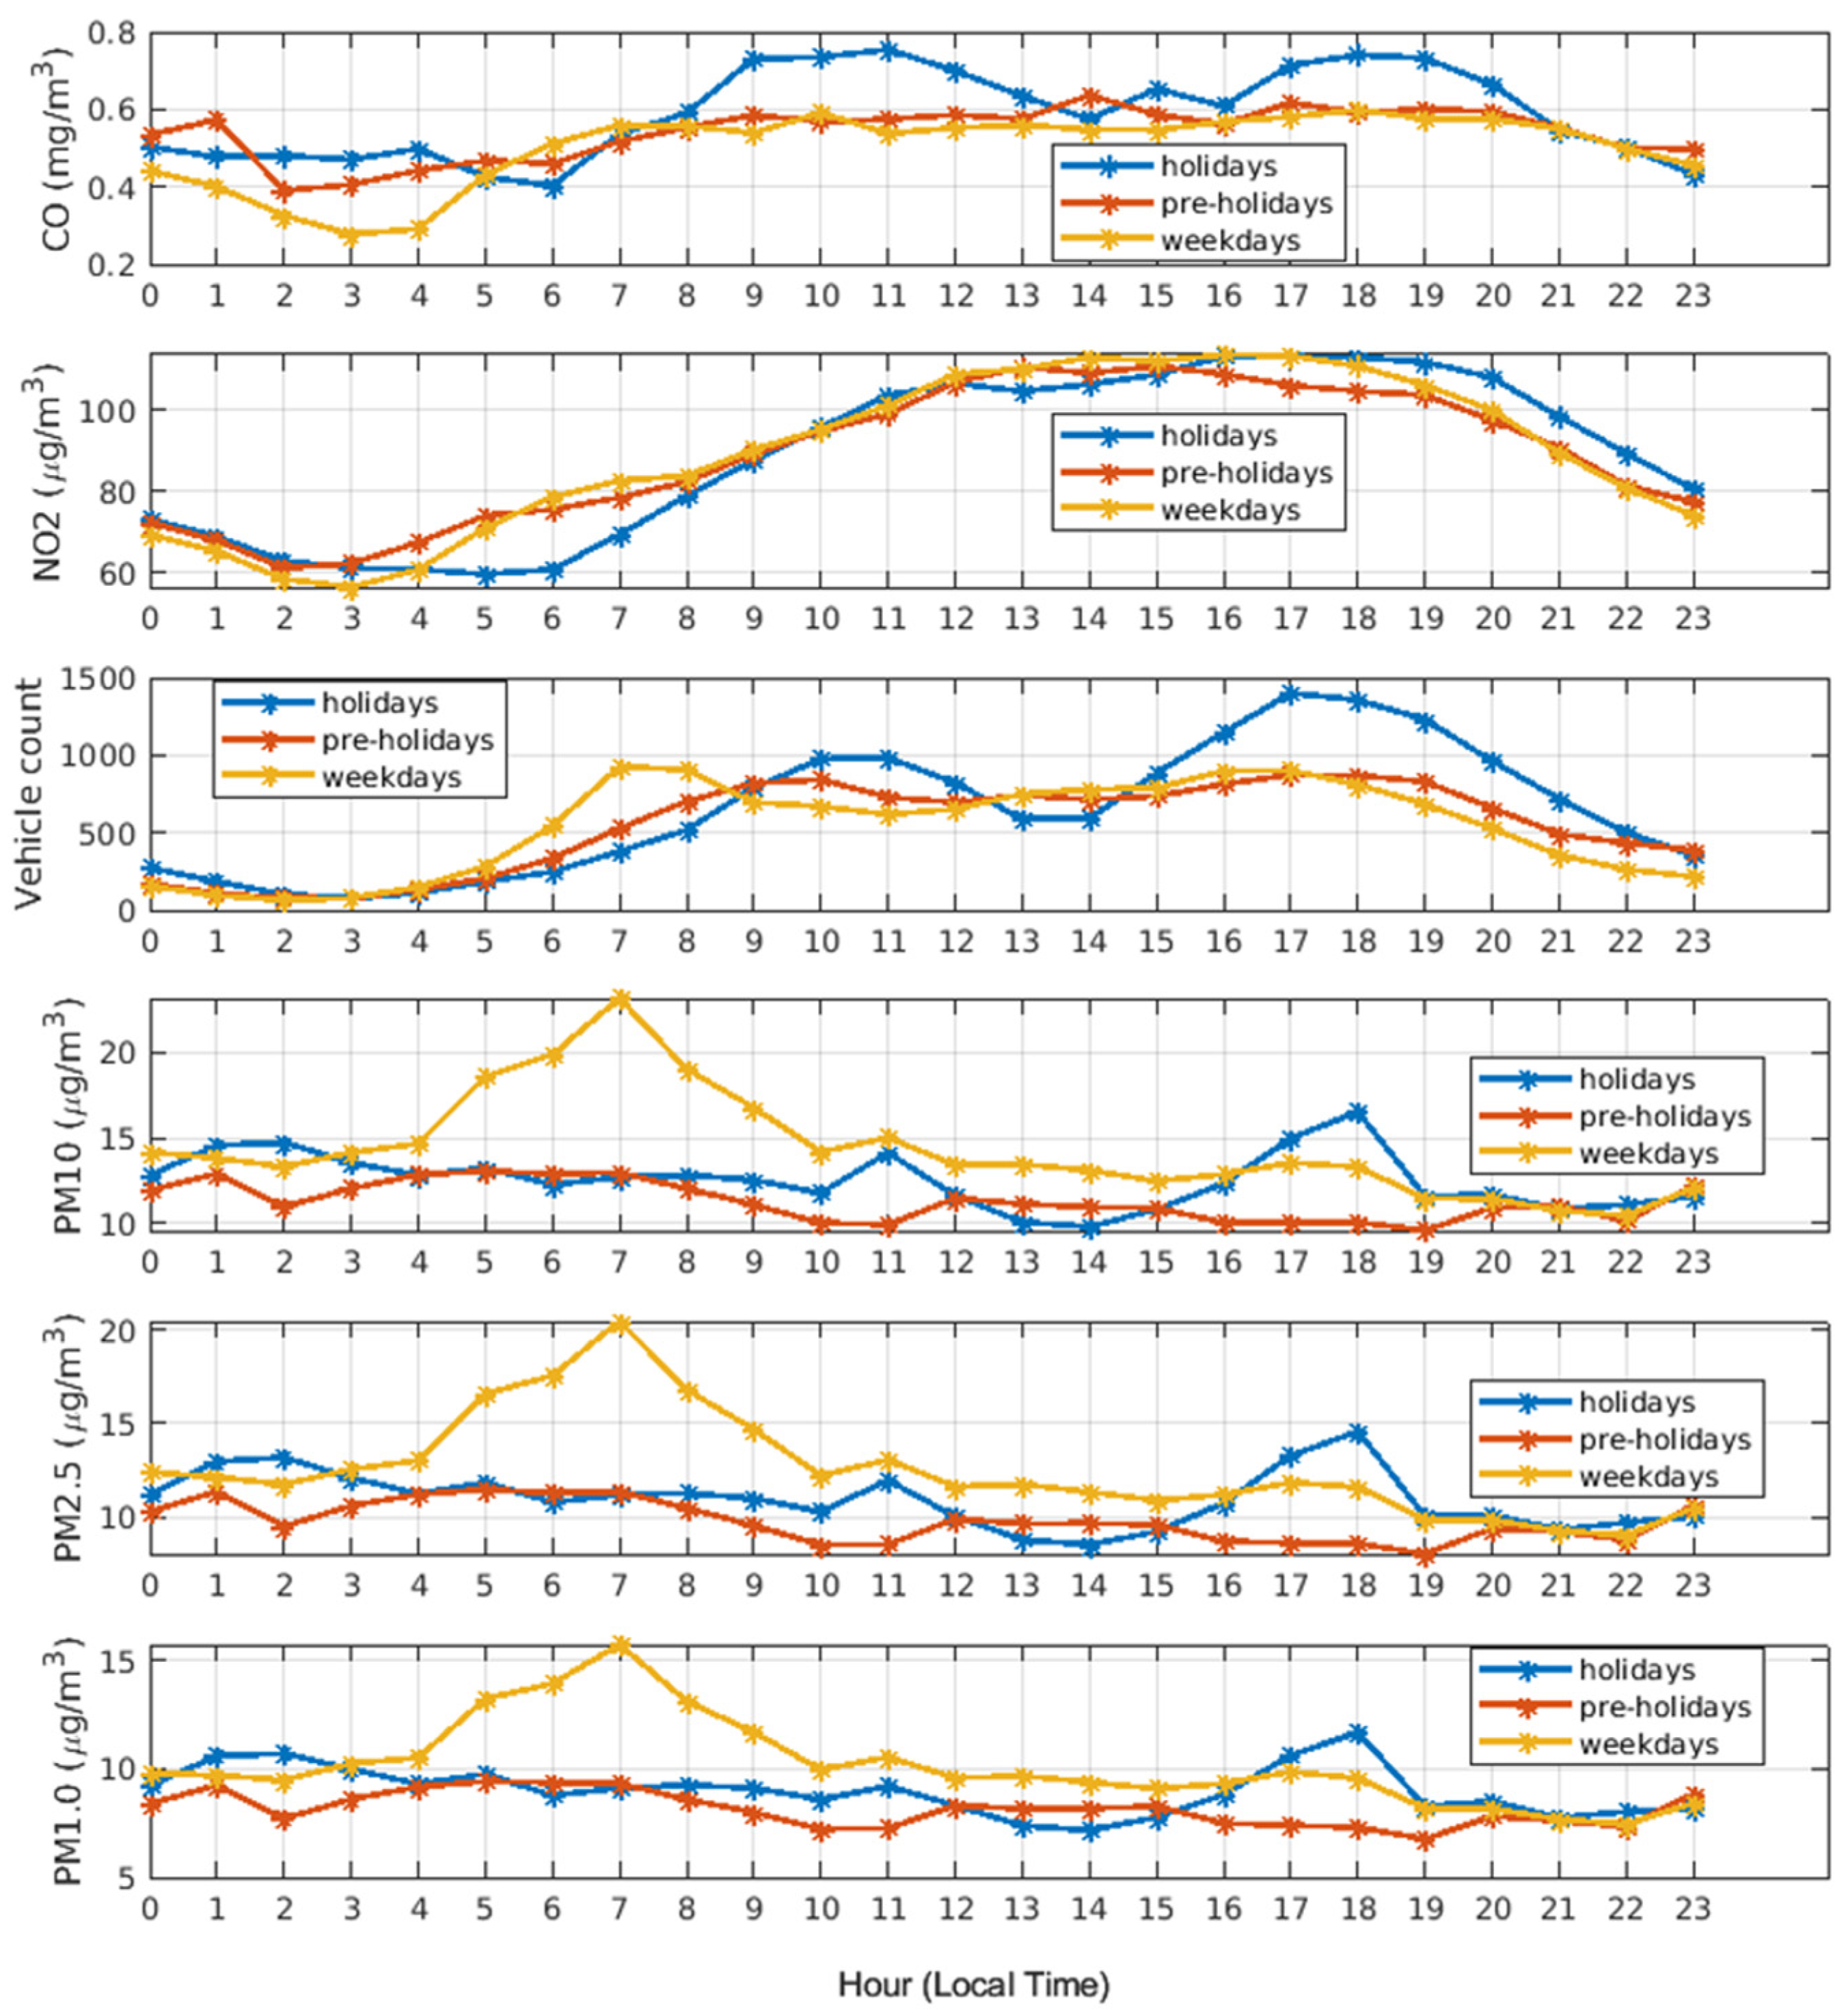
In Figure 7, CO, NO2, PM1, PM2.5 and PM10 concentrations within the gallery are reported as hourly average in the same period and compared with the vehicle flow pattern recorded.
With regard to pollutant concentrations, comparing data in Table 1 and Table 2, it is observed that, according to [1], pollutant concentrations inside the tunnel are higher than outdoors. This is highlighted in CO concentration behaviour that, inside the tunnel, can reach values as high as almost 14 mg/m3 (see Figure S1), while its value outside, although on the same highway, is not higher than about 1.81 mg/m3, with an average value that is 50% lower than observed inside the gallery. That is even more relevant recalling that the traffic flow on the viaduct is, on average, threefold higher than in the gallery. In the gallery, NO2 can reach values as high as 291 µg/m3, more than two times the highest value recorded outdoors, with an average value inside the tunnel that is about three times the higher value observed outdoors; moreover, inside the tunnel, the NO2 concentration never decreases below 27 µg/m3 while outdoor values near the experimental error can be even observed.
Traffic data analysis for Italy shows that the largest contribution to CO emissions is given by gasoline vehicles, while nitrogen oxides (NOx) emissions are mainly attributed to diesel vehicles. Particulate matter emissions mainly originate from diesel vehicles, both car and commercial vehicles. Cars, which are 70% of the Italian car fleet, produce the largest amount of carbon monoxide (51%), particulate matter (43% and 41% of total PM10 and PM2.5 respectively) and carbon dioxide (60%). Motorcycles, which represent 8.5% of the fleet, produce 51.5% of non-methane volatile organic compound emissions. Heavy commercial vehicles, which account for 1.9% of the total number, make the largest contribution to nitrogen oxide emissions (41%). Motorbikes (12% of the fleet) emit mainly carbon monoxide (27%) of the total emitted and non-methane volatile organic compounds (12% of the total emitted). Light commercial vehicles (7.3% of the fleet) are mainly responsible for particulate emissions (23.5% and 24% of total PM10 and PM2.5 emitted respectively), carbon dioxide (15% of total emitted) and nitrogen oxides (14.0% of the total). Finally, buses (0.2% of the total fleet) are responsible for 6% of total nitrogen oxides [36]. Figure 7 clearly shows for CO a marked double peaked curve following, as above recalled, the non-commercial typology of traffic observed on pre-holidays and, still more evidently, on holidays in the gallery while CO emission remains relatively flat during the weekdays. As far as NO2 is concerned, its concentration is generally higher during the weekdays with respect to pre-holidays and holidays, confirming the main role that heavy-duty vehicles have for this kind of emission.
As far as PM is concerned, in Figure 7, PM1, PM2.5 and PM10 concentrations are reported as hourly average over the three months of observation. PM emissions are mainly due to heavy-duty vehicles and diesel cars. Indeed, during the weekdays PM emissions are observed to increase from the night hours to reach a maximum at around 7 a.m., strictly following the vehicle flow pattern that, during weekdays, shows a maximum at about 7 a.m. However, PM concentrations decrease to almost constant values for the whole day, independently from the day type. Both PM10 and PM2.5 show, however, average concentrations that are at least 20% higher than the value observed by the MONICA monitor placed on the viaduct. Considering the calibration factors above used, as far as PM2.5, inside the tunnel, concentrations as high as 18 µg/m3 are detected and, similarly, PM10 concentrations within the tunnel can reach values as high as 48 µg/m3. In order to observe PM concentrations behaviour in the tunnel, including the events occurring during the experimental campaign period, we report the boxplots in Figures S2–S4.

5. Conclusions

This work has demonstrated that low-cost sensors can indeed be used to monitor air quality in road tunnels, providing insights about qualitative temporal behaviour within this peculiar scenario. In the case here investigated, the air quality, in terms of concentrations of CO, NO2 and PM as well as environmental parameters recorded in a motorway tunnel of a southern Italian region, was found to be directly correlated to vehicular traffic in the tunnel. Measured pollutants concentrations were higher than those measured at a nearby point outside the tunnel, located on the same motorway arterial, despite being characterized by a sensibly higher vehicular traffic than that recorded in the tunnel. This suggests the capability of capturing accumulation phenomena outcomes.
The levels of pollutants in the tunnel are moreover much higher than those established by law. One of the observed major problems relates to the difficulty of calibrating low-cost sensors in the investigated site, particularly for the size fractioned PM part. This raises the need to further, in future developments, the approach to calibration transfer, which becomes particularly relevant for these cases, in which in situ calibration is objectively complex and overly costly.

Supplementary Materials

The following supporting information can be downloaded at: https://www.mdpi.com/article/10.3390/atmos14040679/s1, Figure S1: CO concentration estimation (4-min sampling period) in the tunnel, during the trimester under investigation. Table S1: Standard error in averaged concentrations computation for gas, PM and environmental parameters monitored by MONICA, inside the tunnel and on the Viaduct, in the trimester April–June. Figure S2: Boxplot of PM1 concentration estimation in the tunnel during the trimester April–June under investigation. Figure S3: Boxplot of PM2.5 concentration estimation in the tunnel during the trimester April–June under investigation. Figure S4: Boxplot of PM10 concentration estimation in the tunnel during the trimester April–June under investigation.

Author Contributions

Conceptualization, G.D.F., G.F., S.D.V. and A.D.G.; methodology, G.D.F. and E.E.; validation, E.M. and F.F.; formal analysis, E.E.; resources, A.D.G., F.F., G.L., G.F. and G.D.; data curation, E.E., S.F., P.B. and F.C.; writing—original draft preparation, G.D.F.; writing—review and editing, E.E., S.D.V. and G.D.F.; funding acquisition, G.F. All authors have read and agreed to the published version of the manuscript.

Funding

This research was funded by RAFAEL-System for Risk Analysis and Forecast for Critical Infrastructure in the Apennines Dorsal Region (2019–2021): UE co-funded project-FESR/FSE, PON Research and Innovation 2014–2020. Grant no. PT5ABI.

Data Availability Statement

Data are available on request from the corresponding author.

Conflicts of Interest

The authors declare no conflict of interest.

References

  1. Samuele, M.; Lolli, F.; Gamberini, R. Roadway tunnels: A critical review of air pollutant concentrations and vehicular emissions. Transp. Res. Part D Transp. Environ. 2020, 86, 102478. [Google Scholar]
  2. Ho, K.F.; Ho, S.S.H.; Lee, S.C.; Cheng, Y.; Chow, J.C.; Watson, J.G.; Louie, P.K.K.; Tian, L. Emissions of gas-and particle-phase polycyclic aromatic hydrocarbons (PAHs) in the Shing Mun Tunnel, Hong Kong. Atmos. Environ. 2009, 43, 6343–6351. [Google Scholar] [CrossRef]
  3. Maciejczyk, P.; Chen, L.-C.; Thurston, G. The Role of Fossil Fuel Combustion Metals in PM2.5 Air Pollution Health Associations. Atmosphere 2021, 12, 1086. [Google Scholar] [CrossRef]
  4. de la Flor, S.D.-S.; Andrés, P.F.; Rodrigo, E.P. Partículas en suspensión PM10, NO2 y agudizaciones de enfermedad respiratoria crónica/Particulate matter PM10, NO2 and exacerbations of chronic respiratory diseases. Medicina de Familia. SEMERGEN 2022, 48, 101819. [Google Scholar] [CrossRef] [PubMed]
  5. Soares, A.R.; Silva, C. Review of Ground-Level Ozone Impact in Respiratory Health Deterioration for the Past Two Decades. Atmosphere 2022, 13, 434. [Google Scholar] [CrossRef]
  6. Orellano, P.; Reynoso, J.; Quaranta, N. Short-term exposure to sulphur dioxide (SO2) and all-cause and respiratory mortality: A systematic review and meta-analysis. Environ. Int. 2021, 150, 106434. [Google Scholar] [CrossRef]
  7. Konduracka, E.; Rostoff, P. Links between chronic exposure to outdoor air pollution and cardiovascular diseases: A review. Environ. Chem. Lett. 2022, 20, 2971–2988. [Google Scholar] [CrossRef]
  8. Aronow, W.S. Effect of carbon monoxide on cardiovascular disease. Prev. Med. 1979, 8, 271–278. [Google Scholar] [CrossRef] [PubMed]
  9. Jurewicz, J.; Dziewirska, E.; Radwan, M.; Hanke, W. Air pollution from natural and anthropic sources and male fertility. Reprod. Biol. Endocrinol. 2018, 16, 109. [Google Scholar] [CrossRef] [Green Version]
  10. Andersen, Z.J.; Zhang, J.; Jørgensen, J.T.; Samoli, E.; Liu, S.; Chen, J.; Strak, M.; Wolf, K.; Weinmayr, G.; Rodopolou, S.; et al. Long-term exposure to air pollution and mortality from dementia, psychiatric disorders, and suicide in a large pooled European cohort: ELAPSE study. Environ. Int. 2022, 170, 107581. [Google Scholar] [CrossRef]
  11. AEA. Air quality in Europe—2017 Report. pp. 24–25. Available online: https://www.eea.europa.eu/publications/air-quality-in-europe-2017 (accessed on 27 March 2023).
  12. Wan, Y.; Li, Y.; Liu, C.; Li, Z. Is traffic accident related to air pollution? A case report from an island of Taihu Lake, China. Atmos. Pollut. Res. 2020, 11, 1028–1033. [Google Scholar] [CrossRef]
  13. Caliendo, C.; De Guglielmo, M.L. Accident rates in road tunnels and social cost evaluation. Procedia Soc. Behav. Sci. 2012, 53, 166–177. [Google Scholar] [CrossRef] [Green Version]
  14. Raparthi, N.; Debbarma, S.; Phuleria, H.C. Development of real-world emission factors for on-road vehicles from motorway tunnel measurements. Atmos. Environ. 2021, 10, 100113. [Google Scholar] [CrossRef]
  15. Zamorategui-Molina, A.; Gutiérrez-Ortega, N.L.; Baltazar-Vera, J.C.; Del Ángel-Soto, J.; Tirado-Torres, D. Carbon Monoxide and Particulate Matter Concentrations inside the Road Tunnels of Guanajuato City, Mexico. Aerosol Air Qual. Res. 2021, 21, 210039. [Google Scholar] [CrossRef]
  16. Gokce, H.B.; Arıoğlu, E.; Copty, N.K.; Onay, T.T.; Gun, B. Exterior air quality monitoring for the Eurasia Tunnel in Istanbul, Turkey. Sci. Total Environ. 2020, 699, 134312. [Google Scholar] [CrossRef]
  17. Gillies, J.A.; Gertler, A.W.; Sagebiel, J.C.; Dippel, W.A. On-Road Particulate Matter (PM2.5 and PM10) Emissions in the Sepulveda Tunnel, Los Angeles, California. Environ. Sci. Technol. 2001, 35, 1054–1063. [Google Scholar] [CrossRef] [PubMed]
  18. Riccio, A.; Chianese, E.; Monaco, D.; Costagliola, M.A.; Perretta, G.; Prati, M.V.; Agrillo, G.; Esposito, A.; Gasbarra, D.; Shindler, L.; et al. Real-world automotive particulate matter and PAH emission factors and profile concentrations: Results from an urban tunnel experiment in Naples, Italy. Atmos. Environ. 2016, 141, 379–387. [Google Scholar] [CrossRef]
  19. Ning, Z.; Polidori, A.; Schauer, J.J.; Sioutas, C. Emission factors of PM species based on freeway measurements and comparison with tunnel and dynamometer studies. Atmos. Environ. 2008, 42, 3099–3114. [Google Scholar] [CrossRef]
  20. Baldauf, R.W.; Heist, D.; Isakov, V.; Perry, S.; Hagler, G.S.; Kimbrough, S.; Shores, R.; Black, K.; Brixey, L. Air quality variability near a highway in a complex urban environment. Atmos. Environ. 2013, 64, 169–178. [Google Scholar] [CrossRef]
  21. De Vito, S.; Del Giudice, A.; D’Elia, G.; Esposito, E.; Fattoruso, G.; Ferlito, S.; Formisano, F.; Loffredo, G.; Massera, E.; Di Francia, G. Continuous Measurement of Air Pollutant Concentrations in a Roadway Tunnel in Southern Italy. EAI SMARTGOV 2022, in press. [Google Scholar]
  22. Spinelle, L.; Gerboles, M.; Villani, M.G.; Aleixandre, M.; Bonavitacola, F. Field calibration of a cluster of low-cost commercially available sensors for air quality monitoring. Part B: NO, CO and CO2. Sens. Actuators B Chem. 2017, 238, 706–715. [Google Scholar] [CrossRef]
  23. De Vito, S.; Esposito, E.; Massera, E.; Formisano, F.; Fattoruso, G.; Ferlito, S.; Del Giudice, A.; D’Elia, G.; Salvato, M.; Polichetti, T.; et al. Crowdsensing IoT architecture for pervasive air quality and exposome monitoring: Design, development, calibration, and long-term validation. Sensors 2021, 21, 5219. [Google Scholar] [CrossRef]
  24. De Vito, S.; D’Elia, G.; Di Francia, G. Global Calibration Models Match Ad-Hoc Calibrations Field Performances in Low Cost Particulate Matter Sensors. In Proceedings of the 2022 IEEE International Symposium on Olfaction and Electronic Nose (ISOEN), Aveiro, Portugal, 29 May–1 June 2022; pp. 1–4. [Google Scholar] [CrossRef]
  25. De Souza, P.; Kahn, R.; Stockman, T.; Obermann, W.; Crawford, B.; Wang, A.; Crooks, J.; Li, J.; Kinney, P. Calibrating networks of low-cost air quality sensors. Atmos. Meas. Tech. 2022, 15, 6309–6328. [Google Scholar] [CrossRef]
  26. Available online: https://www.espruino.com/datasheets/PMS7003.pdf (accessed on 15 December 2022).
  27. D’Elia, G.; Ferro, M.; Sommella, P.; De Vito, S.; Ferlito, S.; D’Auria, P.; Di Francia, G. Influence of Concept Drift on Metrological Performance of Low-Cost NO2 Sensors. IEEE Trans. Instrum. Meas. 2022, 71, 1–11. [Google Scholar] [CrossRef]
  28. Available online: https://www.aqmesh.com/ (accessed on 13 March 2023).
  29. Available online: https://www.aeroqual.com/ (accessed on 16 March 2023).
  30. Available online: https://www.earthsense.co.uk/ (accessed on 10 March 2023).
  31. Available online: https://www.stradeanas.it/en (accessed on 28 December 2022).
  32. Available online: https://www.arpa.sicilia.it/temi-ambientali/aria/ (accessed on 28 September 2022).
  33. Mahajan, S.; Kumar, P. Evaluation of low-cost sensors for quantitative personal exposure monitoring. Sustain. Cities Soc. 2020, 57, 102076. [Google Scholar] [CrossRef]
  34. Kaur, K.; Kelly, K.E. Performance evaluation of the Alphasense OPC-N3 and Plantower PMS5003 sensor in measuring dust events in the Salt Lake Valley, Utah. Atmos. Meas. Tech. Discuss. 2022, 1–27, in review. [Google Scholar] [CrossRef]
  35. Available online: https://uiaairheritage-portici.it/ (accessed on 23 January 2023).
  36. Available online: www.isprambiente.gov.it/contentfiles/00007500/7510-trasporto-strada-concopertina-xweb.pdf/ (accessed on 28 December 2022).
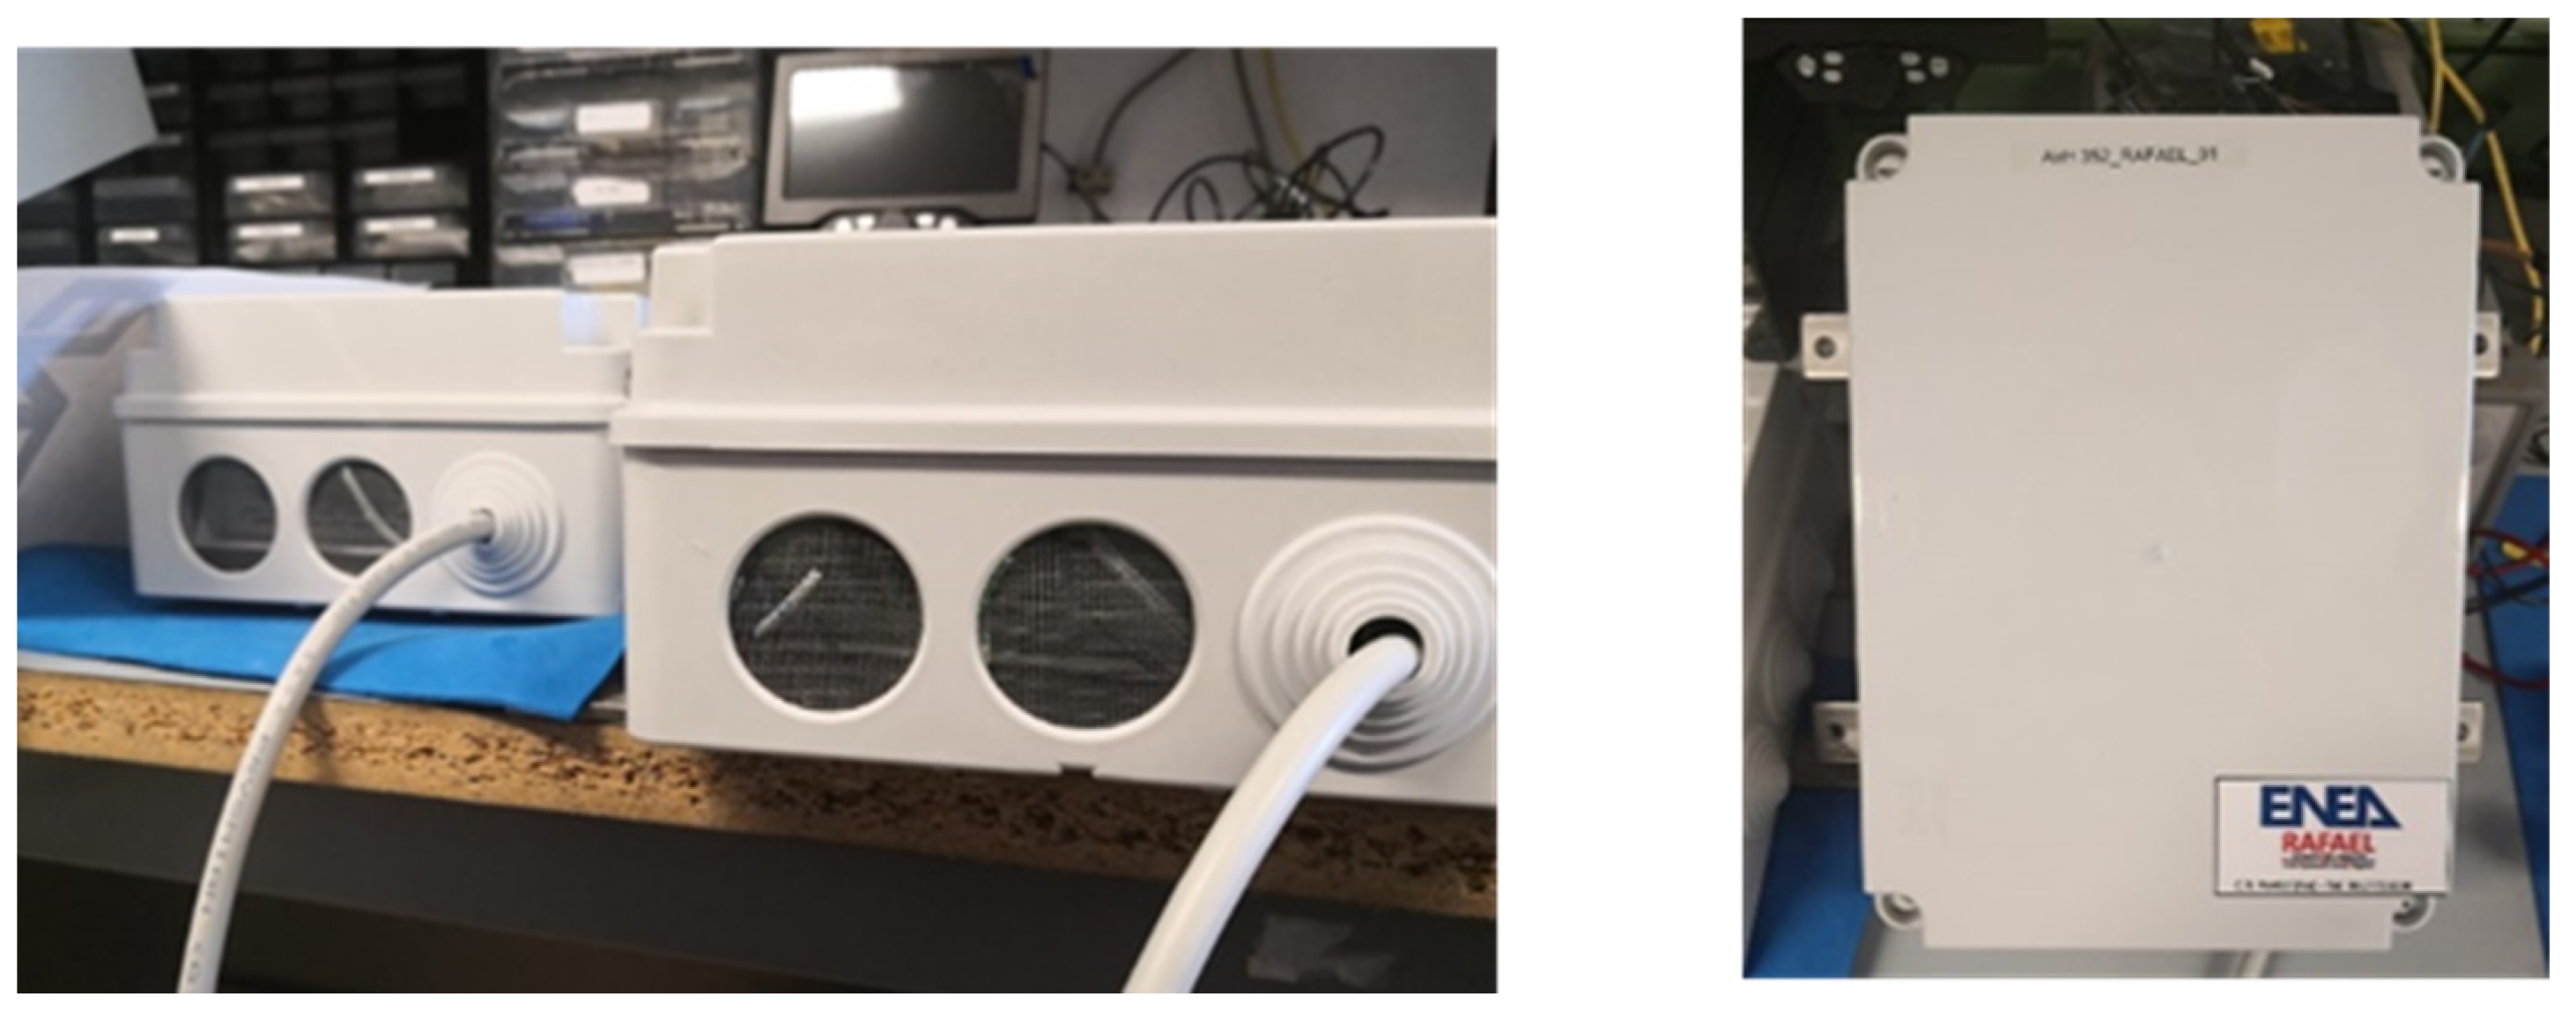
Figure 1. The Measuring Station. The IoT ENEA Monica™ monitor is enclosed, for this experiment, within a box, whose only connection with the surrounding environment is through two 5 cm2 holes covered by fine metallic grids to avoid possible penetration of small animals.
Atmosphere 14 00679 g001
Figure 2. Map of the Catania-Siracusa RA15 highway (right), where the measuring stations on the viaduct (viadotto San Paolo) and in the tunnel (Galleria San Demetrio) are shown. On the bottom left, an air map Google photo of the tunnel San Demetrio (latitude: 37.36084, longitude: 15.0474463) and of the viadotto San Paolo (latitude: 37.36084, longitude: 15.0474463), both in the Siracusa direction, are shown. (Last accessed 27 December 2022).
Atmosphere 14 00679 g002
Figure 3. (a) The emergency area of the Galleria San Demetrio where the MONICA IoT sensor node has been installed (in the white circle); (b) the MONICA installed in an emergency area on the viaduct (in the white circle).
Atmosphere 14 00679 g003
Figure 4. San Demetrio gallery: daily vehicular flow as hourly average over the three months April–June, differentiating among weekdays (orange), pre-holidays (red) and holidays (blue).
Atmosphere 14 00679 g004
Figure 5. Temperature distribution boxplot in the three months April–June, differentiating among weekdays (orange), pre-holidays (red) and holidays (blue).
Atmosphere 14 00679 g005
Figure 6. RH distribution boxplot in the three months April–June, differentiating among weekdays (orange), pre-holidays (red) and holidays (blue).
Atmosphere 14 00679 g006
Figure 7. Gases and PM concentrations behaviour and vehicles count averaged over the three months April–June, differentiating among weekdays (orange), pre-holidays (red) and holidays (blue).
Atmosphere 14 00679 g007
Table 1. Temperature and RH for MONICA monitors installed inside the tunnel, on the Viaduct San Paolo and by the ARPA reference station in the trimester April–June.
MONICA TunnelMONICA OutsideARPA Reference Station
ParameterRangeMean (std)RangeMean (std)Mean (std)
T (°C)(15–37)26 ± 5(11–48)29 ± 818 ± 3
RH (%)(19–62)42 ± 8(9–62)31 ± 1169 ± 9
Table 2. CO, NO2 and O3 concentrations estimations for MONICA monitors installed inside the tunnel, on the Viaduct San Paolo and by the ARPA reference station in the trimester April–June.
MONICA TunnelMONICA OutsideARPA Reference Station
ParameterRangeMean (std)RangeMean (std)Mean (std)
CO
(mg/m3)
(0–14)0.50 ± 0.35(0–1.8)0.38 ± 0.120.28 ± 0.1
NO2
(µg/m3)
(27–291)89 ± 23(0–125)33 ± 1823 ± 18
O3
(µg/m3)
--(0–166)51 ± 2873 ± 25
Table 3. PM concentrations estimations for MONICA monitors installed inside the tunnel, on the Viaduct San Paolo and by the regulatory station in the trimester April–June. Correction factors of 1.5 and 4, as from [33], have been used for PM2.5 and PM10, respectively (in italic).
MONICA TunnelMONICA OutsideARPA Reference Station
ParameterRangeMean (std)RangeMean (std)Mean (std)
PM1
(µg/m3)
(0–200)10 ± 8(0–130)8 ± 5-
PM2.5
(µg/m3)
(0–312)12 ± 12
(18)
(0–185)10 ± 6
(15)
12.5 ± 5
PM10
(µg/m3)
(0–351)14 ± 13
(56)
(0–198)11 ± 7
(44)
26 ± 17
Table 4. Average number of vehicles counted in each day of the trimester for road tunnel and for Viaduct San Paolo in the trimester April–June.
Vehicles Count (n°/Day)RangeMean (std)
Road Tunnel
San Demetrio
weekday(62–926)500 ± 300
pre-holiday(76–873)550 ± 280
holiday(75–1400)650 ± 400
Viaduct
San Paolo
weekday(135–3253)1700 ±1100
pre-holiday(179–2737)1400 ± 900
holiday(170–2595)1300 ± 800
Table 5. Total number of vehicles for the three months under investigation and further classified in terms of heavy-duty or light-duty vehicles, for road tunnel and for Viaduct San Paolo in the trimester April–June 2022.
Day of Week Heavy-Duty VehiclesLight-Duty VehiclesTotal Vehicles
Road Tunnel
San Demetrio
Monday249725,36127,858
Tuesday283823,53026,368
Wednesday295924,10627,065
Thursday265924,70527,364
Friday277225,98728,759
Saturday167625,19726,873
Sunday60830,00930,617
Viaduct
San Paolo
Monday433569,96574,300
Tuesday494872,00076,948
Wednesday505072,32877,378
Thursday463572,24676,881
Friday488874,89079,778
Saturday278863,43366,221
Sunday105658,17259,228
Disclaimer/Publisher’s Note: The statements, opinions and data contained in all publications are solely those of the individual author(s) and contributor(s) and not of MDPI and/or the editor(s). MDPI and/or the editor(s) disclaim responsibility for any injury to people or property resulting from any ideas, methods, instructions or products referred to in the content.