Abstract
Thawing permafrost has affected the structural integrity of buried warm pipelines in cold regions and poses an ongoing threat in the context of climate change. Therefore, characterizing variation in the engineering properties of pipeline foundation permafrost and its effect on the mechanical behavior of pipeline is important. In this paper, the ground temperature distributions around a buried warm pipeline and mechanical response of the pipeline to differential thaw settlement of foundation permafrost are investigated using thermal–mechanical sequential coupling simulation, based on the observational data collected from a selected monitoring site along the China-Russia crude oil pipelines in northeastern China. The results indicate that the thaw-induced settlement of pipeline foundation permafrost develops quickly with the formation and expansion of the thaw bulb in the first 10 years, and then increases slowly when the thaw bulb extends to the weathered granite. Differential thaw settlement will cause a significant change in the deformation and stress of the pipeline near the interface of strong and weak thaw settlement zones. When the length ratio of strong and weak thaw settlement zones is 1, the maximum stress of the pipeline with a thickness of 16 mm is approximately 45% of the allowable stress of X65 steel, and the pipeline remains safe for 30 years. However, the potential failure of the pipeline should be considered due to the continued ground thawing and warming and pipe material aging. Forthcoming research on this topic is needed to evaluate more carefully the structural integrity of buried pipelines in cold regions.
1. Introduction
Long-distance transportation pipelines inevitably pass through geotechnically problematic areas and thus are under the threat of various geological disasters, such as fault displacement [1,2], landslide [3], debris flows [4], ground movement induced by engineering activities of tunneling, overloading, and underground mining [5,6,7,8] and variations in engineering proprieties of special soils, such as collapsible loess, expansive soil, and frozen soil [9,10,11]. In permafrost regions, the differential frost heave and/or thaw settlement of foundation permafrost will cause the deformation or even failure of the pipeline [12,13,14]. Due to the strong temperature dependence of the hydraulic and mechanical properties of frozen soils, characterizing the thermal regime of pipeline foundation soils is critical for quantifying the frost heaving and thawing settlement and evaluating the mechanical behavior of the buried pipeline. Thus far, extensive studies have focused on the heat transfer process between the buried pipeline and the surrounding soils. For example, quasi-static solutions for thawing or freezing around a buried pipeline were derived [15]. Lachenbruch [16] pointed out some potential effects of a buried pipeline with a temperature of 80 °C on the surrounding permafrost environment. In many subsequent numerical studies conducted by Mu et al. [17], Chen et al. [18], and Wang et al. [19], more reasonable and accurate models were used to further evaluate the permafrost disturbances caused by the construction and operation of buried pipelines. Moreover, the thermal interaction between the pipeline and the surrounding soils was performed through model tests and site measurements [20,21]. For the China-Russia crude oil pipeline, an in situ monitoring system was established, and over 10 years (2011–2021) of ground temperature observations on and off the pipeline right-of-way were made [22].
To study pipeline performance during frost heaving of surrounding soils, several field tests, such as the Calgary, Canada chilled pipeline experiment [23], the Caen, France chilled pipeline experiment [24], and the Fairbanks, Alaska large-diameter chilled pipeline experiment [20] were conducted and various types of analytical and numerical models [25,26,27] were developed in the past four decades. The complex interaction problem of pipeline and permafrost was usually treated as two independent processes: the development of frost heave of surrounding soils, and the process of the mechanical soil-pipeline interaction [28], which was idealized with a beam-spring model or with a more extensive model that considers features such as nonlinear mechanical behavior of soil and pipeline, geometrical nonlinearity in the pipeline, and the contact characteristics of pipe-soil interface. However, there are limited studies on the interaction between buried pipelines and permafrost foundation thawing [28,29]. Wen et al. [30] adopted a thermal elastoplastic computation to investigate the stresses and strains of a buried pipeline under thaw settlement. Zhou et al. [31] used a thermo-mechanical coupled model to analyze the interaction between a buried pipeline and permafrost thawing and showed that the thaw-consolidation characteristic of soils has a more significant effect on the peak strain of the pipeline. Xie and Zhang [32] analyzed the deformation of the pipeline in the thaw settlement zone from the perspective of strain design. Wei et al. [33] developed a three-dimensional thermo-hydro-mechanical coupling numerical model to investigate the potential failure of the pipeline crossing active tectonic fault in permafrost. More importantly, the practical operation of the buried warm-oil pipelines (e.g., Eastern Siberia–Pacific Ocean oil pipeline in Russia, the China–Russia crude oil pipeline in China, and the Trans-Alaska pipeline in the U.S.) indicates that permafrost thawing (mainly caused by strong thermal disturbances of construction and operation of pipelines on the right-of-way) and related soil mass movements pose a serious threat to the safety of pipelines, moreover, the threat is picking up under the influence of global climate change and pipe material aging [18,19,34]. For example, significant ground subsidence on the pipeline right-of-way and pipe settlement were observed in warm and ice-rich permafrost zones along the China–Russia crude oil pipeline. Additionally, the Inuvik experimental warm-oil pipeline (with a temperature of 71 °C) on ice-rich permafrost had settled about 1 m within 40 days of operation [35]. To mitigate the thaw settlement of permafrost surrounding the buried pipeline, vertical support beams equipped with thermosyphons and insulation materials were applied in the Trans-Alaska pipeline, and free-standing vertical thermosyphons were installed around the China–Russia crude oil pipeline [36]. Hence, the thaw settlement of permafrost foundation is the major issue for the buried warm oil pipeline in permafrost regions and the mechanical response of buried pipelines to permafrost thawing requires in-depth research.
In this paper, the applicability and accuracy of the sequential thermal–mechanical coupling method used to predict the thaw consolidation of degrading permafrost were made according to the results of the one-dimensional thaw consolidation test reported by Huang [37]. Then, a three-dimensional thermo-mechanical coupling model of pipeline–soil interaction was developed to simulate the mechanical response of a buried pipeline subjected to differential thaw settlement of foundation permafrost, based on the observational data collected from a selected monitoring site along the China–Russia crude oil pipelines in northeastern China. The proposed model and relevant results can be used for the assessment of existing buried pipelines embedded in permafrost regions.
2. Governing Equations and Numerical Implementation
The total thaw settlement of permafrost originates from ice-water phase change and settlement of the thawed soils under self-weight and/or applied loads [38]. This complex thermo-hydro-mechanical process is usually modeled by coupling heat transfer with consolidation theory. A large-strain consolidation theory described by the updated Lagrangian (U.L) is used to simulate the thaw consolidation behavior of permafrost in the current study, where the transient heat conduction equation considering ice-water phase change is employed to describe the thermal state as follows [39]:
where T is the soil temperature, t is the time, C is the volumetric heat capacity, and λ is the thermal conductivity. C and λ are temperature dependent. Latent heat effects are considered by using the apparent heat capacity method and details can be found in Mu et al. [17].
Large-strain consolidation of thawing saturated soils can be described by the following equations. We assumed that consolidation takes place in the thawed region and frozen soil is incompressible and impermeable.
Equilibrium equation
where is the coordinates of the material point, is the displacement, is the second Piofa-Kirchhoff stress, is Kronecker symbol, and is the volume load.
Geometric equation
where is the increment of the Green strain tensor.
Constitutive equation
where is the effective stress corresponding with , and is the constitutive tensor.
Effective stress principle
where is the pore water pressure.
Continuous equation
where is volumetric strain and is the permeability coefficient.
The large-strain thaw consolidation model is obtained by coupling Equations (1)–(6). We use the sequential thermo-mechanical coupling method to calculate the thaw settlement of frozen soils, as shown by Ming et al. [40]. For this method, the calculation process can be divided into two stages. The first stage is to perform the thermal calculation of the whole model. In the second stage, the consolidation calculation is implemented in the post-thawed region, in which the resulting temperatures obtained during the first stage are read into the mechanical analysis.
To validate this modeling method, a one-dimensional consolidation test with a periodical thermal boundary on silty clay is conducted. The specimen of 101 mm in diameter and 100 mm in height (with a dry density of 1.6 g/cm3) is at an initial uniform temperature of −1.5 °C and thawing-freezing is initiated by adjusting the temperature at the top of the specimen to . Meanwhile, a constant load of 100 kPa is applied at the top of the specimen and the vertical deformation is recorded automatically every minute by a DT80 datalogger. The temperature at the bottom of the specimen is kept at −1 °C during the whole test process. The details of the thaw consolidation test are presented by Huang [37]. According to the test conditions, a simplified axial symmetry model was set up, and the same temperature and mechanical boundary conditions are adopted (Figure 1). The soil parameters are obtained from previous test results [41,42] and listed in Table 1. The f and u represent frozen and unfrozen states, respectively. L is the latent heat per unit volume. E is Young’s modulus and μ is Poisson’s ratio. k is the permeability coefficient of thawed soil.
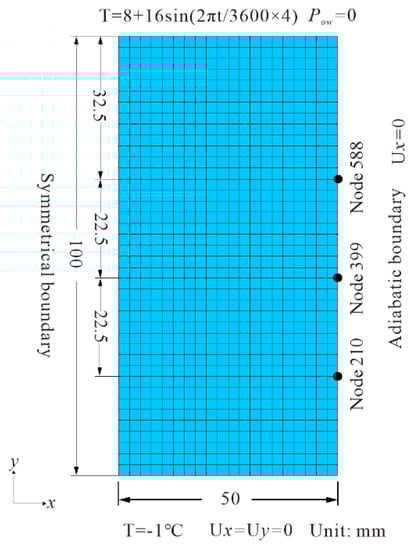
Figure 1.
The computational model for one-dimensional thaw consolidation of silty clay and boundary conditions.

Table 1.
Parameters used in the simulation of one-dimensional thaw consolidation of silty clay.
The results of the one-dimensional thaw consolidation test for silty clay are presented in terms of temperature and deformation in Figure 2. The changing trend of simulated temperatures at different depths (Nodes 588, 399, and 210 in Figure 1) was consistent with that of the measured data. However, there was a discrepancy in the amplitude and phase between simulated and measured values in Figure 2a, which might have resulted from the simplification of the latent heat effects, i.e., the latent heat is assumed to be released over a small range of temperatures. The vertical deformation of the specimen increased with time in a stepwise manner under the periodic boundary conditions, as shown in Figure 2b. A similar trend was also seen in simulation results. These above results suggest that the prediction of the thaw settlement of frozen soils through the sequential thermo-mechanical coupling method is feasible.
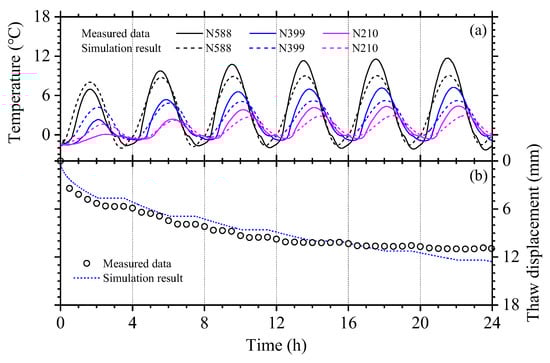
Figure 2.
Measured and simulated results of temperature (a) and vertical deformation (b) of the soil specimen.
3. Numerical Results and Analyses
3.1. Computational Domain
According to the permafrost engineering geological data at a monitoring section of the China-Russia crude oil pipeline in warm and ice-rich permafrost regions and detailed engineering design information (e.g., pipe material, buried depth, diameter, and wall thickness), a buried pipeline–soil model was established, as shown in Figure 3. The model is equally divided into three parts along the z-axis (a total length of 120 m), with a large settlement in the middle part and a small settlement at both ends. The steel pipeline is embedded 1.6 m under the ground surface and is modeled using four-node reduced-integration shell elements. Eight-node reduced-integration elements are used for modeling surrounding soils. The computational domain extends 30 m from the ground surface (Figure 4), including the silt clay, gravel soil, and weathered granite layers (simplifying from the actual stratum), and 30 m laterally from the pipeline centerline to minimize the boundary effect.
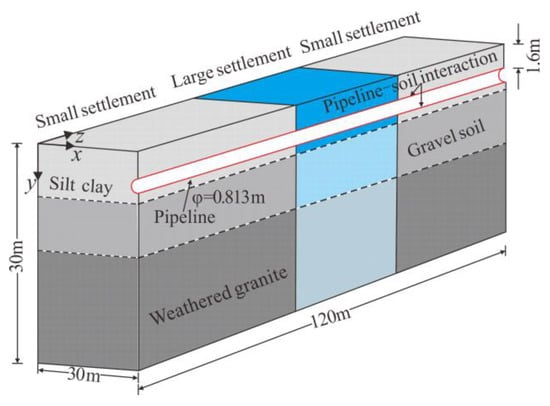
Figure 3.
Model description of the buried pipeline-soil interaction.
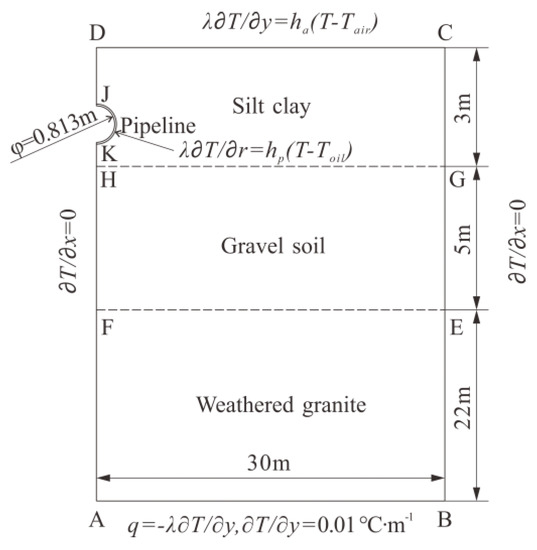
Figure 4.
Diagram of thermal boundary conditions of the model in cross-section.
3.2. Boundary Conditions and Parameters
3.2.1. Boundary Condition
Figure 4 shows the thermal boundary conditions of the model in cross-section. The lateral boundaries are assumed to be adiabatic, and a geothermal heat flux of 0.01 °C/m is employed at the bottom of the computational domain [21]. A heat convection boundary is directly applied to the upper boundary to simplify the complex heat transfer at the ground surface. The atmospheric heat transfer coefficient is set to 17.4 W/(m2·°C) [43]. According to the long-term observed data at the Jagdaqi weather station, Tair is simplified as a sinusoidal function of time (t) and the influence of climate change on Tair is considered (increases by 2.4 °C in the next 50 years based on the observations at the Jagdaqi weather station over 1971–2004 period [19]); thus, it is expressed as Equation (7).
Between the oil flowing and pipe wall, a heat convection boundary is adopted, and the convection coefficient is set to 400 W/(m2·°C) [43]. The temperature of oil flowing (Toil), which is monitored at the Jagdaqi pump station (0.6 km away from the monitoring site), varies as shown in Equation (8). The initial temperature fields of the soil/rock layers are calculated using a long-term transient solution with the upper boundary condition at the natural ground surface without considering climate warming.
where is the initial phase. As for mechanical boundary conditions, the top boundary of the model is allowed to displace freely and the pore pressure is set to zero (i.e., free drainage is allowed). The nodes on the bottom boundary plane are fixed and the displacements on all four sides are confined in a direction perpendicular to the surface.
3.2.2. Material Parameters
Thermal physical parameters of soils are obtained based on field measurement and laboratory test results [21,41] and are given in Table 2. Mechanical behaviors of frozen soil are described by Mohr-Coulomb constitutive model (characterized by elastic modulus E, Poisson’s ratio μ, cohesion c, and friction angle φ), which has been proved to be appropriate for the simulation of pipeline–soil interaction [44]. The temperature of pipeline foundation permafrost is greater than −0.8 °C, therefore, mechanical parameters for foundation soils in the frozen state are assumed to be constant. The parameters used in this model are cited from previous publications and listed in Table 3 [30,44,45,46]. The frozen soil is assumed to be impermeable and permeability coefficients for thawed soils are given in Table 3.
Table 2.
Thermal physical parameters of soils and pipeline used for the proposed model.
Table 3.
Mechanical parameters of soils used for the proposed model.
The elastoplastic behavior of the X65 steel pipeline is described by Ramberg-Osgood constitutive model. The stress–strain relationship is expressed as:
where E is Young’s modulus (207 GPa); 𝜎s is yield strength (450 MPa); n and α are material constants (15, 0.53).
3.3. Ground Temperature Distributions around the Pipeline
The maximum depth of seasonal thaw at the natural ground generally occurs in mid-October every year. Temperature distributions around the pipeline in the strong thaw-settlement section in October of the initial, second, fifth, tenth, twentieth, and thirtieth years under the predicted climate warming of 0.48 °C per decade are shown in Figure 5. It can be seen that the isotherms were flat before construction of the pipeline (Figure 5a), whereas they were distributed in a sunken shape under thermal disturbances of the pipeline (Figure 5b–f). The closer to the pipeline, the higher the temperature of the foundation soil. The temperature gradient around the pipeline was high at the early stage of pipeline operation (Figure 5b), but it decreased with time and thus the temperature field became more uniform. Moreover, as shown in Figure 5, the coldest contour in summer was −0.8 °C before pipeline construction, it increased up to −0.2 °C within 30 years of operation, indicating the whole region was warmed by the heat loss from the buried pipeline.
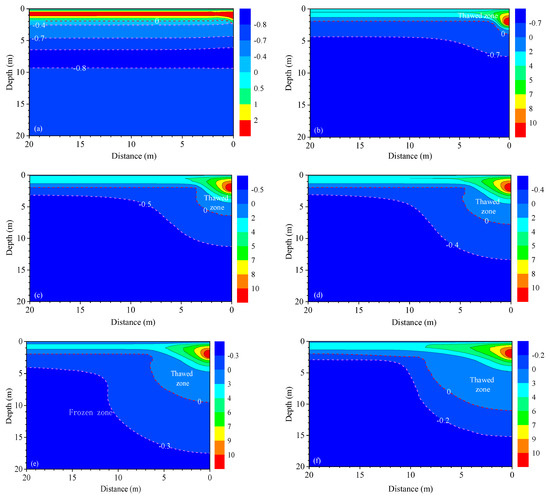
Figure 5.
Geo-temperature distributions around the buried pipeline on October 15th at the 0 (a), 2nd (b), 5th (c), 10th (d), 20th (e) and 30th (f) year of operation. (Units: °C).
Permafrost surrounding the pipeline continued to be thawing with the pipeline operational time increasing, correspondingly, thawed zone (determined by the position of 0 °C isotherm) expanded in lateral and vertical directions (Figure 5b–f). Comparison of temperature distributions around the pipeline in the warm (Figure 5c) and cold seasons (Figure 6) suggested that pipeline foundation soils would not experience a significant bottom-up re-freezing during the following winter and the depth of seasonal frost penetration above the pipeline (approximately 1m) was less than that in the adjacent natural site, due to continuous heat loss from the warm pipeline. Therefore, a thaw bulb (i.e., a residual thawed layer between the permafrost table and the bottom of seasonal frost) formed and expanded with time.
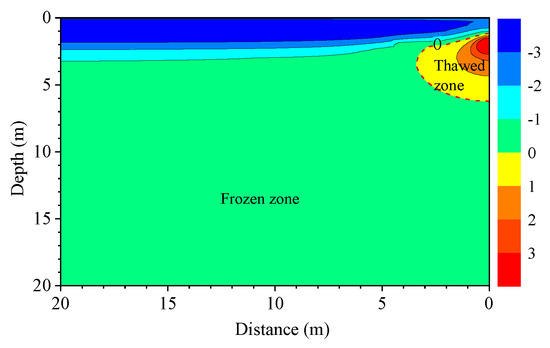
Figure 6.
Geo-temperature distributions around the buried pipeline on January 15 in the 6th year. (Units: °C).
The depth of the permafrost table beneath the pipeline centerline was collected and presented in Figure 7. Following the construction of the pipeline, permafrost table depth continued to increase and reached approximately 11 m over the simulation period (30 years). The rate of increase in permafrost table was up to 0.9 m/a in the first 5 years, and henceforth gradually slowed down. In the 10–15 years after pipeline construction, the maximum thaw depth had extended to the weathered granite layer (8 m below ground surface, as shown in Figure 4) characterized by a weak thaw settlement. The variation in the permafrost table with time in this study can be described by a simple power function (Figure 7).
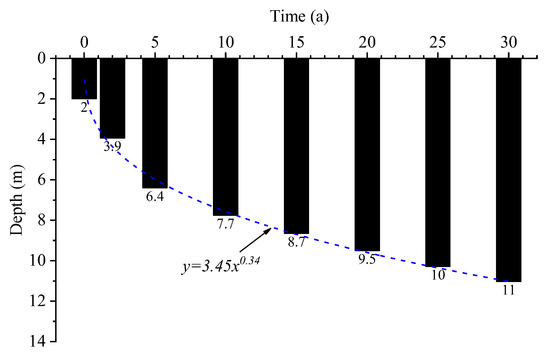
Figure 7.
Permafrost table beneath the pipeline centerline over 30 years.
3.4. Mechanical Behavior of the Pipeline
Figure 8 shows the variation curves of the vertical settlement of the pipeline in the middle of the strong thaw settlement zone with time. The movement of the pipeline developed quickly in the first 10 years, and it tended to be stable in the following 20 years, varying between 33 and 36 cm (away from its original position), because the thawing front had penetrated the granite layer with low ice contents (Figure 7) and the bearing capacity of thawed granite had remained comparatively high. Thus, the stress of the pipeline over the first 10 years after pipeline construction was analyzed later. The above results also demonstrated that thaw consolidation properties of foundation soils have an obvious effect on ground subsidence and pipeline settlement. Thus, detailed surveys and analyses of the permafrost conditions along the pipeline route should be conducted before construction.
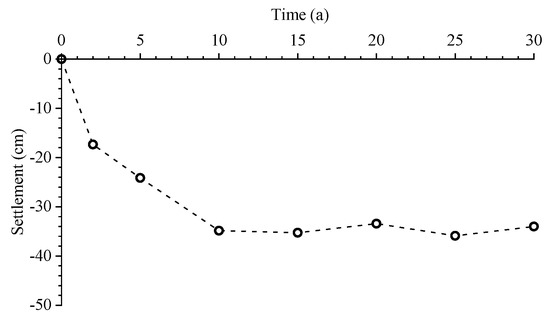
Figure 8.
Development of vertical settlement of the pipeline over the simulation period.
The vertical stress distribution of the pipeline at different times after pipeline completion is shown in Figure 9. Oval-shaped high-stress areas were created on the top and bottom of the pipeline near the interface of strong and weak thaw settlement zones due to significant differential thaw settlement of pipeline foundation permafrost. With the increasing ground settlement due to the thaw settlement and consolidation of degrading permafrost, the high-stress areas expanded. The maximum tensile stress was 36, 79, and 145 MPa, and the maximum compressive stress was 35, 73, and 133 MPa in the second, fifth, and tenth years after pipeline construction, respectively. They were less than the allowable stress of the X65 steel pipeline of 324 MPa (yield strength, 450 MPa; safety factor, 0.72).
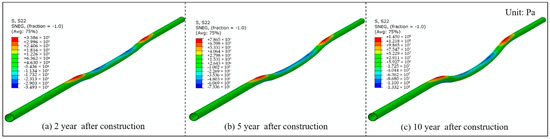
Figure 9.
Vertical stress distribution of the buried pipeline in the 2nd (a), 5th (b), and 10th (c) years.
Figure 10 illustrates the stresses on the top and bottom of the pipeline in the 10th year after construction. The stresses of the pipeline on both sides of the interface were the biggest. The risk of pipeline failure at these two locations was high. Under the conditions of the simulation in the current study, the maximum stress of the pipeline with a thickness of 16 mm was approximately 45% of the allowable stress of X65 steel, and the pipeline remained safe within 30 years.
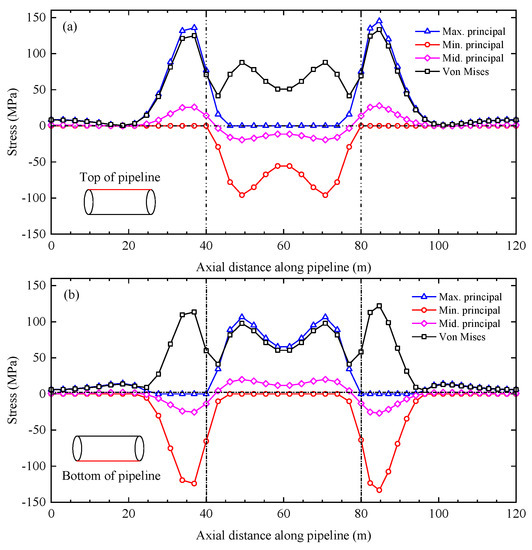
Figure 10.
The stresses on the top (a) and bottom (b) of the pipeline in the 10th year after pipeline construction.
4. Discussion
Some useful results were found using the simulation analysis; however, there are also two major limitations. Firstly, due to the thermal erosion of water ponding and the downward movement of the pipeline not being considered in the modeling, the simulation results presented herein underestimated the long-term permafrost thawing and subsequent soil mass movement. Secondly, the heat transfer process and thaw settlement simulations in the modeling were decoupled. If the impact of thaw consolidation of frozen soil on the heat transfer process was considered, a larger thaw bulb might have resulted. The above-mentioned limitations of the model would result in an underestimated stress on the buried pipeline. If the welding joints were in the two dangerous locations mentioned above, i.e., near the interface of strong and weak thaw settlement zones, the pipeline might be damaged with the prolongation of aging time. Thus, some countermeasures, such as thermosyphon and insulation layer, were adopted in several regions with poor permafrost geological conditions along the China-Russia crude oil pipeline to mitigate pipeline foundation permafrost thawing and thaw bulb development during operation. However, the applicability and effectiveness of these measures have been demonstrated merely from the perspective of controlling ground temperature. To evaluate more carefully the integrity of buried pipelines with or without strengthening measures in permafrost regions, further investigations should remain focused on the structural response of the pipeline to foundation permafrost thawing. The next research plan is to establish a more comprehensive model of interaction between pipeline and permafrost thawing considering the thermo-hydro-mechanical processes of frozen soil and the interface characteristics of pipeline and thawing soil. Additionally, parametric analysis for pipeline-soil interaction under permafrost thawing should be performed to afford the reference for other similar pipeline projects in cold regions.
5. Conclusions
The stability of warm-oil pipelines embedded in permafrost regions will be reduced due to the non-uniform settlement caused by the warming and thaw of foundation permafrost. The accuracy verification of the sequential thermal–mechanical coupling method for thaw consolidation of thawing soils is present first and then a model of pipeline-permafrost thawing interaction is adopted to analyze the mechanical behavior of the buried pipeline. The following conclusions can be drawn:
- (1)
- Through the comparison between the simulation results (temperatures and vertical deformation of soil specimen) and that of the experiments for one-dimensional thaw consolidation of silty clay, the sequential thermo-mechanical coupling method is proved to be reliable for the prediction of the thaw settlement and consolidation of degrading permafrost under the periodic boundary condition.
- (2)
- The buried pipeline would cause significant disturbance to the temperature field around it, characterized by isotherm shape changing, permafrost table deepening, seasonal frost penetration decreasing, and resultant thaw bulb expanding. In the 10–15 years after pipeline construction, the thawing front beneath the pipeline extended to the weathered granite layer, which had a small deformation after thaw and warming. The permafrost table depth beneath the center of the pipeline increased in the form of a power function as the operation time of the pipeline increased.
- (3)
- Pipeline settlement increased with the thawing of foundation permafrost and then kept almost unchanged when the thawing front entered into the weathered granite. Differential settlement of degrading permafrost would cause oval-shaped high-stress areas on the buried pipeline near the interface of strong and weak thaw settlement zones. When the length ratio of strong and weak thaw settlement zones is 1, the maximum stress of the pipeline with a thickness of 16 mm was approximately 45% of its allowable stress, and the pipeline remained safe for 30 years. We expect that the stress exerted on the pipeline will increase larger than previously estimated, owing mainly to the underestimated permafrost degradation and permafrost-thaw-related movement of soil mass. A fully coupled numerical model of interaction between the pipeline and permafrost thawing needs to be established to evaluate more carefully the structural integrity of the warm pipeline buried in frozen soils.
Author Contributions
F.W.: Methodology, Investigation, Writing-original draft, Writing-review & editing, Funding acquisition; G.W.: Software, Validation, Data curation; D.C.: Methodology, Writing—Review & editing, Funding acquisition; G.L.: Conceptualization, Supervision, Writing—Review & editing; Y.Q.: Validation, Data curation; F.X.: Software; L.W.: Software. All authors have read and agreed to the published version of the manuscript.
Funding
This work was financially supported by the National Natural Science Foundation of China (Grant No. 42101121), the Research Projects of the State Key Laboratory of Frozen Soil Engineering (Grant Nos. SKLFSE202010, SKLFSE-ZY-20, and SKLFSE-ZT-202203), the Educational Commis-sion of Jiangsu Province of China (21KJB580001).
Institutional Review Board Statement
Not applicable.
Informed Consent Statement
Not applicable.
Data Availability Statement
Not applicable.
Acknowledgments
We would like to thank the editor and four anonymous reviewers for their constructive comments.
Conflicts of Interest
The authors declare no conflict of interest.
References
- Karamitros, D.K.; Bouckovalas, G.D.; Kouretzis, G.P. Stress analysis of buried steel pipelines at strike-slip fault crossings. Soil Dyn. Earthq. Eng. 2007, 27, 200–211. [Google Scholar] [CrossRef]
- Karamitros, D.K.; Bouckovalas, G.D.; Kouretzis, G.P.; Gkesouli, V. An analytical method for strength verification of buried steel pipelines at normal fault crossings. Soil Dyn. Earthq. Eng. 2011, 31, 1452–1464. [Google Scholar] [CrossRef]
- Geertsema, M.; Schwab, J.W.; Blais-Stevens, A.; Sakals, M.E. Landslides impacting linear infrastructure in west central British Columbia. Nat. Hazards 2009, 48, 59–72. [Google Scholar] [CrossRef]
- Yuan, F.; Wang, L.Z.; Guo, Z.; Xie, Y.G. A refined analytical model for landslide or debris flow impact on pipelines–Part II: Embedded pipelines. Appl. Ocean Res. 2012, 35, 105–114. [Google Scholar] [CrossRef]
- Wang, Y.; Shi, J.W.; Ng, C.W.W. Numerical modeling of tunneling effect on buried pipelines. Can. Geotech. J. 2011, 48, 1125–1137. [Google Scholar] [CrossRef]
- Kouretzis, G.P.; Karamitros, D.K.; Sloan, S.W. Analysis of buried pipelines subjected to ground surface settlement and heave. Can. Geotech. J. 2014, 52, 1058–1071. [Google Scholar] [CrossRef]
- Zhang, J.; Liang, Z.; Zhao, G. Mechanical behaviour analysis of a buried steel pipeline under ground overload. Eng. Fail. Anal. 2016, 63, 131–145. [Google Scholar] [CrossRef]
- Yu, C.; Han, C.J.; Xie, R.; Wang, L. Mechanical behavior analysis of buried pipeline under stratum settlement caused by underground mining. Int. J. Pres. Ves. Pip. 2020, 188, 104212. [Google Scholar] [CrossRef]
- Razaqpur, A.G.; Wang, D. Frost-induced deformations and stresses in pipelines. Int. J. Pres. Ves. Pip. 1996, 69, 105–118. [Google Scholar] [CrossRef]
- Rajeev, P.; Kodikara, J. Numerical analysis of an experimental pipe buried in swelling soil. Comput. Geotech. 2011, 38, 897–904. [Google Scholar] [CrossRef]
- Xu, G.Q.; Luo, Y.; Yao, B.; Jiang, W.C. Stresses measurement and failure prevention of on-line natural gas transmission pipelines for compressor station on collapsible loess area in northwest China. Eng. Fail. Anal. 2021, 126, 105467. [Google Scholar] [CrossRef]
- Carlson, L.E.; Ellwood, J.R.; Nixon, J.F.; Slusarch, W.A. Field test results of operating a chilled, buried pipeline in unfrozen ground. In Proceedings of the 4th Canadian Permafrost Conference, Calgary, AB, Canada, 2–6 March 1982; pp. 475–480. [Google Scholar]
- Nixon, J.F.; Burgess, M. Norman Wells pipeline settlement and uplift movements. Can. Geotech. J. 1999, 36, 119–135. [Google Scholar] [CrossRef]
- Smith, S.L.; Burgess, M.M.; Riseborough, D.W. Ground temperature and thaw settlement in frozen peatlands along the Norman Wells pipeline corridor, NWT Canada: 22 years of monitoring. In Proceedings of the 9th International Conference on Permafrost, Fairbanks, AK, USA, 29 June–3 July 2008; pp. 1665–1670. [Google Scholar]
- Hwang, C.T. On quasi-static solutions for buried pipes in permafrost. Can. Geotech. J. 1977, 14, 180–192. [Google Scholar] [CrossRef]
- Lachenbruch, A.H. Some Estimates of the Thermal Effects of A Heated Pipeline in Permafrost; US Geological Survey: Reston, VA, USA, 1970. [Google Scholar]
- Mu, Y.H.; Li, G.Y.; Ma, W.; Song, Z.M.; Zhou, Z.W.; Wang, F. Rapid permafrost thaw induced by heat loss from a buried warm-oil pipeline and a new mitigation measure combining seasonal air-cooled embankment and pipe insulation. Energy 2020, 203, 117919. [Google Scholar]
- Chen, L.; Yu, W.B.; Lu, Y.; Wu, P.; Han, F.L. Characteristics of heat fluxes of an oil pipeline armed with thermosyphons in permafrost regions. Appl. Therm. Eng. 2021, 190, 116694. [Google Scholar] [CrossRef]
- Wang, F.; Li, G.Y.; Ma, W.; Chen, D.; Wu, G.; Cao, Y.P.; Mu, Y.H.; Mao, Y.C.; Zhang, J.; Gao, K.; et al. Assessment of permafrost disturbances caused by two parallel buried warm-oil pipelines: A case study at a high-latitude wetland site in Northeast China. Cold Reg. Sci. Technol. 2023, 206, 103753. [Google Scholar] [CrossRef]
- Huang, S.L.; Bray, M.T.; Akagawa, S.; Fukada, M. Field investigation of soil heave by a large diameter chilled gas pipeline experiment, Fairbanks, Alaska. J. Cold Reg. Eng. 2004, 18, 2–34. [Google Scholar] [CrossRef]
- Wang, F.; Li, G.Y.; Ma, W.; Wu, Q.B.; Serban, M.; Vera, S.; Fedorov, A.; Jiang, N.S.; Wang, B. Pipeline–permafrost interaction monitoring system along the China–Russia crude oil pipeline. Eng. Geol. 2019, 254, 113–125. [Google Scholar] [CrossRef]
- Li, G.Y.; Ma, W.; Wang, F.; Jin, H.J.; Fedorov, A.; Chen, D.; Wu, G.; Cao, Y.P.; Zhou, Y.; Mu, Y.H.; et al. A newly integrated ground temperature dataset of permafrost along the China–Russia crude oil pipeline route in Northeast China. Earth Syst. Sci. Data 2022, 14, 5093–5110. [Google Scholar] [CrossRef]
- Carlson, L.E.; Nixon, J.F. Subsoil investigation of ice lensing at the Calgary, Canada, frost heave test facility. Can. Geotech. J. 1988, 25, 307–319. [Google Scholar] [CrossRef]
- Rajani, B.; Morgenstern, N. Comparison of predicted and observed responses of pipeline to differential frost heave. Can. Geotech. J. 1994, 31, 803–816. [Google Scholar] [CrossRef]
- Konrad, J.M.; Morgenstern, N.R. Frost heave prediction of chilled pipelines buried in unfrozen soils. Can. Geotech. J. 1984, 21, 100–115. [Google Scholar] [CrossRef]
- Selvadurai, A.P.S.; Hu, J.; Konuk, I. Computational modelling of frost heave induced soil–pipeline interaction: II. Modelling of experiments at the Caen test facility. Cold Reg. Sci. Technol. 1999, 29, 229–257. [Google Scholar] [CrossRef]
- Kim, K.; Zhou, W.; Huang, S.L. Frost heave predictions of buried chilled gas pipelines with the effect of permafrost. Cold Reg. Sci. Technol. 2008, 53, 382–396. [Google Scholar] [CrossRef]
- Li, H.W.; Lai, Y.M.; Wang, L.Z.; Yang, X.S.; Jiang, N.S.; Li, L.; Wang, C.; Yang, B.C. Review of the state of the art: Interactions between a buried pipeline and frozen soil. Cold Reg. Sci. Technol. 2019, 157, 171–186. [Google Scholar] [CrossRef]
- Wang, F.; Li, G.Y.; Ma, W. Progress in the research on the thermo-mechanical interaction between oil pipeline and permafrost in cold regions. J. Glaciol. Geocryol. 2022, 44, 217–228. [Google Scholar]
- Wen, Z.; Sheng, Y.; Jin, H.J.; Li, S.Y.; Li, G.Y.; Niu, Y.H. Thermal elasto-plastic computation model for a buried oil pipeline in frozen ground. Cold Reg. Sci. Technol. 2010, 64, 248–255. [Google Scholar] [CrossRef]
- Zhou, J.W.; Liang, Z.; Zhang, L.; Zheng, T.; Zheng, J.Y. Thermal and mechanical analysis of the China–Russia Crude Oil Pipeline suffering settlement disaster in permafrost regions. Int. J. Pres. Ves. Pip. 2022, 199, 104729. [Google Scholar] [CrossRef]
- Xie, R.; Zhang, J. Mechanical behavior of buried pipeline crossing thaw settlement zone. J. Pres. Ves. Tech. 2022, 144, 041902. [Google Scholar] [CrossRef]
- Wei, X.C.; Niu, Z.Y.; Li, Q.; Ma, J.L. Potential failure analysis of thawing-pipeline interaction at fault crossing in permafrost. Soil Dyn. Earthq. Eng. 2018, 106, 31–40. [Google Scholar] [CrossRef]
- Streletskiy, D.; Anisimov, O.; Vasiliev, A. Permafrost degradation. In Snow and Ice-Related Hazards, Risks and Disasters; Elsevier: Amsterdam, The Netherlands, 2005; pp. 303–344. [Google Scholar]
- Watson, G.H.; Rowley, R.K.; Slusarchuk, W.A. Performance of a warm oil pipeline buried in permafrost. In Proceedings of the 2nd International Conference on Permafrost, Yakutsk, Soviet Union, 13–28 July 1973; pp. 759–766. [Google Scholar]
- Wang, F.; Li, G.Y.; Alexander, F.; Ma, W.; Chen, D.; Wu, G.; Mu, Y.H.; Wang, X.B.; Jing, H.Y.; Zhang, Z.R. Applicability analysis of thermosyphon for thermally stabilizing pipeline foundation permafrost and its layout optimization. Cold Reg. Sci. Technol. 2023, 208, 103769. [Google Scholar] [CrossRef]
- Huang, Y.T. Laboratory Research on Consolidation Deformation Mechanism and Pore Water Pressure Dissipation within Thawing Soil. Ph.D. Thesis, University of Chinese Academy of Sciences, Beijing, China, 2021. [Google Scholar]
- Ma, W.; Wang, D.Y. Frozen Soil Mechanics; Science Press: Beijing, China, 2014. [Google Scholar]
- Chen, L.; Yu, W.B.; Zhang, T.Q.; Yi, X. Asymmetric talik formation beneath the embankment of Qinghai-Tibet Highway triggered by the sunny-shady effect. Energy 2023, 266, 126472. [Google Scholar] [CrossRef]
- Ming, F.; Yu, Q.H.; Li, D.Q. Investigation of embankment deformation mechanisms in permafrost regions. Transp. Geotech. 2018, 16, 21–28. [Google Scholar] [CrossRef]
- Xu, X.Z.; Wang, J.C.; Zhang, L.X. Physics of Frozen Soil; Science Press: Beijing, China, 2001. [Google Scholar]
- Yao, X.L.; Qi, J.L.; Wu, W. Three dimensional analysis of large strain thaw consolidation in permafrost. Acta Geotech. 2012, 7, 193–202. [Google Scholar] [CrossRef]
- Li, C.J.; Jiang, M.Z.; Ji, G.F. Thermal-stress computation of the buried heated-oil pipeline in permafrost regions. J. Southwest Petrol. Inst. 2000, 22, 77–79. [Google Scholar]
- Li, S.Y.; Lai, Y.M.; Zhang, M.Y.; Dong, Y.H. Study on long-term stability of Qinghai–Tibet Railway embankment. Cold Reg. Sci. Technol. 2009, 57, 139–147. [Google Scholar] [CrossRef]
- Han, F.L.; Yu, W.B.; Ma, L.X.; Yi, X.; Zhang, X.F. Heat transfer and cold energy capacity properties of crushed-rock layer in cold sandy regions. Int. J. Therm. Sci. 2023, 189, 108286. [Google Scholar] [CrossRef]
- Pei, W.S.; Zhang, M.Y.; Li, S.Y.; Lai, Y.M.; Jin, L. Thermo-mechanical stability analysis of cooling embankment with crushed-rock interlayer on a sloping ground in permafrost regions. Appl. Therm. Eng. 2017, 125, 1200–1208. [Google Scholar] [CrossRef]


Disclaimer/Publisher’s Note: The statements, opinions and data contained in all publications are solely those of the individual author(s) and contributor(s) and not of MDPI and/or the editor(s). MDPI and/or the editor(s) disclaim responsibility for any injury to people or property resulting from any ideas, methods, instructions or products referred to in the content. |
© 2023 by the authors. Licensee MDPI, Basel, Switzerland. This article is an open access article distributed under the terms and conditions of the Creative Commons Attribution (CC BY) license (https://creativecommons.org/licenses/by/4.0/).