Article

Assessment of Rural Vulnerability to Sand and Dust Storms in Iran

1
Department of Remote Sensing and GIS, Faculty of Geography, University of Tehran, Tehran 14178-53933, Iran
2
Department of GIS and SDI, National Cartographic Center (NCC), Tehran 13878-35861, Iran
3
Department of Environmental Engineering, Graduate Faculty of Environmental, University of Tehran, Tehran 14178-53111, Iran
4
Institute of Methodologies for Environmental Analysis, Italian National Research Council, 85050 Potenza, Italy
*
Authors to whom correspondence should be addressed.
Atmosphere 2023, 14(2), 281; https://doi.org/10.3390/atmos14020281
Submission received: 31 December 2022 / Revised: 20 January 2023 / Accepted: 27 January 2023 / Published: 31 January 2023
(This article belongs to the Special Issue Sand and Dust Storms: Impact and Mitigation Methods)

Abstract

:
Climate-related hazards such as sand and dust storms (SDS) have various impacts on human health, socio-economy, environment, and agroecosystems. Iran has been severely affected by domestic and external SDS during the last two decades. Considering the fragile economy of Iran’s rural areas and the strong dependence of livelihood on agroecosystems, SDS cause serious damage to human communities. Therefore, there is an urgent need to conduct a vulnerability assessment for developing SDS risk mitigation plans. In this study, various components of SDS vulnerability were formulated through a geographic information system (GIS)-based integrated assessment approach using composite indicators. By implementing a GIS multiple-criteria decision analysis (GIS-MCDA) model using socioeconomic and remote sensing data, a map of rural vulnerability to SDS was produced. Our results show that about 37% of Iran’s rural areas have experienced high and very high levels of vulnerability to SDS. Rural areas in the southeast and south of Iran, especially Sistan and Baluchestan and Hormozgan provinces are more vulnerable to SDS. The findings of this study provide a basis for developing SDS disaster risk-reduction plans and enabling the authorities to prioritize SDS mitigation policies at the provincial administrative scale in Iran.

1. Introduction

Sand and dust storms (SDS), as a global environmental hazard, occur under a wide range of climatic conditions. This phenomenon originates from the interaction of natural drivers, such as drought, and anthropogenic factors, such as mismanagement of water, soil, and plant resources [1]. Due to the ability to transport fine-grained sand and dust particles over long distances [2], they can have significant impacts on human health [3,4,5,6], and plant species [7], even in places far from their emission sources [8].
As one of the vast and densely populated countries of the Middle East, Iran is located in the so-called global dust belt, which starts from northwest Africa and ends in northeast China [9,10]. Due to factors such as latitude, hydro-climatic characteristics, and topographic features, very large areas of the country have dry and semi-dry climates, which makes SDS activities a long-term, natural, and intrinsic feature of many plains across central Iran [11]. In addition to overexploitation and improper management of surface and groundwater resources, unsustainable agricultural activities have resulted in the occurrence of land degradation and desertification phenomena [12,13], which have led to the formation of SDS sources across Iran over the last few decades [14,15,16]. In general, SDS events affecting Iran come from both domestic and external sources [17]. The external SDS often originates from emission sources in Iran’s western border, i.e., Iraq, Syria, and Saudi Arabia [1,15,18]. In recent years, the frequency and intensity of SDS in Iran have increased significantly [19]. Mainly the rural areas located in the southwest, south, and southeast of the country in Ilam, Khuzestan, Bushehr, Hormozgan, and Sistan and Baluchestan provinces are more affected by SDS.
The geographical extent of Iran along different latitudes has led to climatic variability [20]. Accordingly, water and land resources are available to expand agriculture, but only in limited areas across the country. Approximately 70% of Iran has an annual rainfall of less than 250 mm., while only 3% (i.e., 4.7 million ha) has an annual rainfall more than 500 mm. The spatial distribution of the rural population mainly corresponds to agricultural lands in Iran. With a predominantly arid climate, Iran has been facing an unprecedented water crisis in recent decades due to climate change, periodic droughts, and anthropogenic activities. These have adversely, and in some cases irreversibly, affected the ecosystem, economy, and other aspects of livelihoods in many parts of the country, including rural areas [21,22].
Iran’s rural economy mostly depends on agricultural activities (crop farming, orchard raising, and animal husbandry) [23]. About 50% of the active rural population is engaged in the agriculture sector as their main source of income [24]. According to the general population and housing census in 2016, about 26% of the country’s population is in rural areas [25]. Today, rural communities in Iran are facing various challenges, including the weakening of the rural economy, food insecurity, severe poverty and unemployment, and a high migration rate [26]. The effects of these problems reverberate far beyond the rural areas and afflict other sectors of the country with serious challenges. These include the effect of high migration rates on the destination urban areas, the threat of food insecurity due to declining agricultural production, and ecological imbalance resulting from the excessive exploitation of natural resources [26].
Like other developing countries, Iran is highly vulnerable to climate change. Today, both its urban and rural areas are facing the consequences and risks of climate change, such as drought and SDS, through complex feedback mechanisms that affect infrastructural, economic, social, and political systems [27]. What requires special attention is the severity of the damage to the agricultural sector and its related businesses, as one of the most SDS-affected economic sectors. SDS can have different effects on the agricultural sector, including the quantitative and qualitative reduction of crop production and orchard yields, the reduction of livestock products [28], and the spread of plant pests and diseases [29,30]. Low human development, poor infrastructure, heavy dependence on natural resources, and limited government attention, have made rural areas more vulnerable to SDS, which can seriously threaten the income and well-being of households. Considering the increase in the severity and frequency of SDS events affecting Iran in recent years, this phenomenon is considered a serious threat to sustainable rural development.
Given the key role of rural communities in sustainable development, one effective and necessary action is risk mitigation and adaptation planning to tackle the adverse effects of SDS. Combating SDS, developing capacity, and increasing the resilience of human communities are costly issues that require careful planning. According to [31,32,33], assessing vulnerability to climate change-derived hazards could effectively contribute to mitigating their adverse effects. Even though vulnerability assessment is the first necessary step in planning adaptation strategies and disaster risk reduction to combat SDS, the literature shows that the vulnerability of Iran’s rural areas to SDS has not yet been investigated comprehensively and remains largely unclear. Meanwhile, the few existing studies have not focused much on SDS and mainly deal with villages and households [34]. Therefore, they cannot provide a comprehensive understanding of the spatial patterns of rural vulnerability to SDS in Iran.
Vulnerability is a multidimensional [35], complex, dynamic [36], and context-specific [37] phenomenon that changes in space and time and is rooted in past conditions [36]. Many approaches have so far been developed by researchers and institutions for the conceptualization of vulnerability to different hazards, emphasizing different aspects of vulnerability, includes biophysical and socio-economy [38]. Meanwhile, approaches such as integrated assessment consider relatively all aspects of vulnerability and can provide a better understanding of this phenomenon [39]. Vulnerability as a subjective concept is difficult to measure. Therefore, it is better to make this concept operational instead of measuring it [40]. Vulnerability can be operationalized by mapping it to an observable concept, which is called “vulnerability assessment” [40,41]. There are various definitions and interpretations for vulnerability due to their wide application in different fields [42]. The lack of consensus on the definitions of vulnerability has led to the development of different quantitative and qualitative approaches to assessing it [43]. Efforts to operationalize vulnerability and its related concepts have gradually built the foundation of index-based approaches for vulnerability assessment [44]. These approaches generally involve indicators that are operational representations of a system’s feature or quality [40,41]. The composite index-based approaches have been more widely used since they use different indicators and can examine various aspects/components of a vulnerable system [35,43,45].
There are various tools and techniques for vulnerability mapping of natural hazards based on the composite index approach. Geographic information systems (GIS) is one commonly used tool for vulnerability mapping [46]. Accordingly, many studies have emphasized the efficiency of GIS in combination with multi-criteria decision analysis (MCDA) approaches for vulnerability mapping of hazardous phenomena, such as drought [47], flood [48], landslide [49], and SDS [50].
This study is the first attempt to use GIS-MCDA to integrate an assessment of the vulnerability of Iran’s rural areas to SDS on the national scale. Hence, it focuses on the analysis of spatial distribution of multi-level vulnerability mapping of Iran’s rural areas to SDS through a composite index approach.

2. Materials and Methods
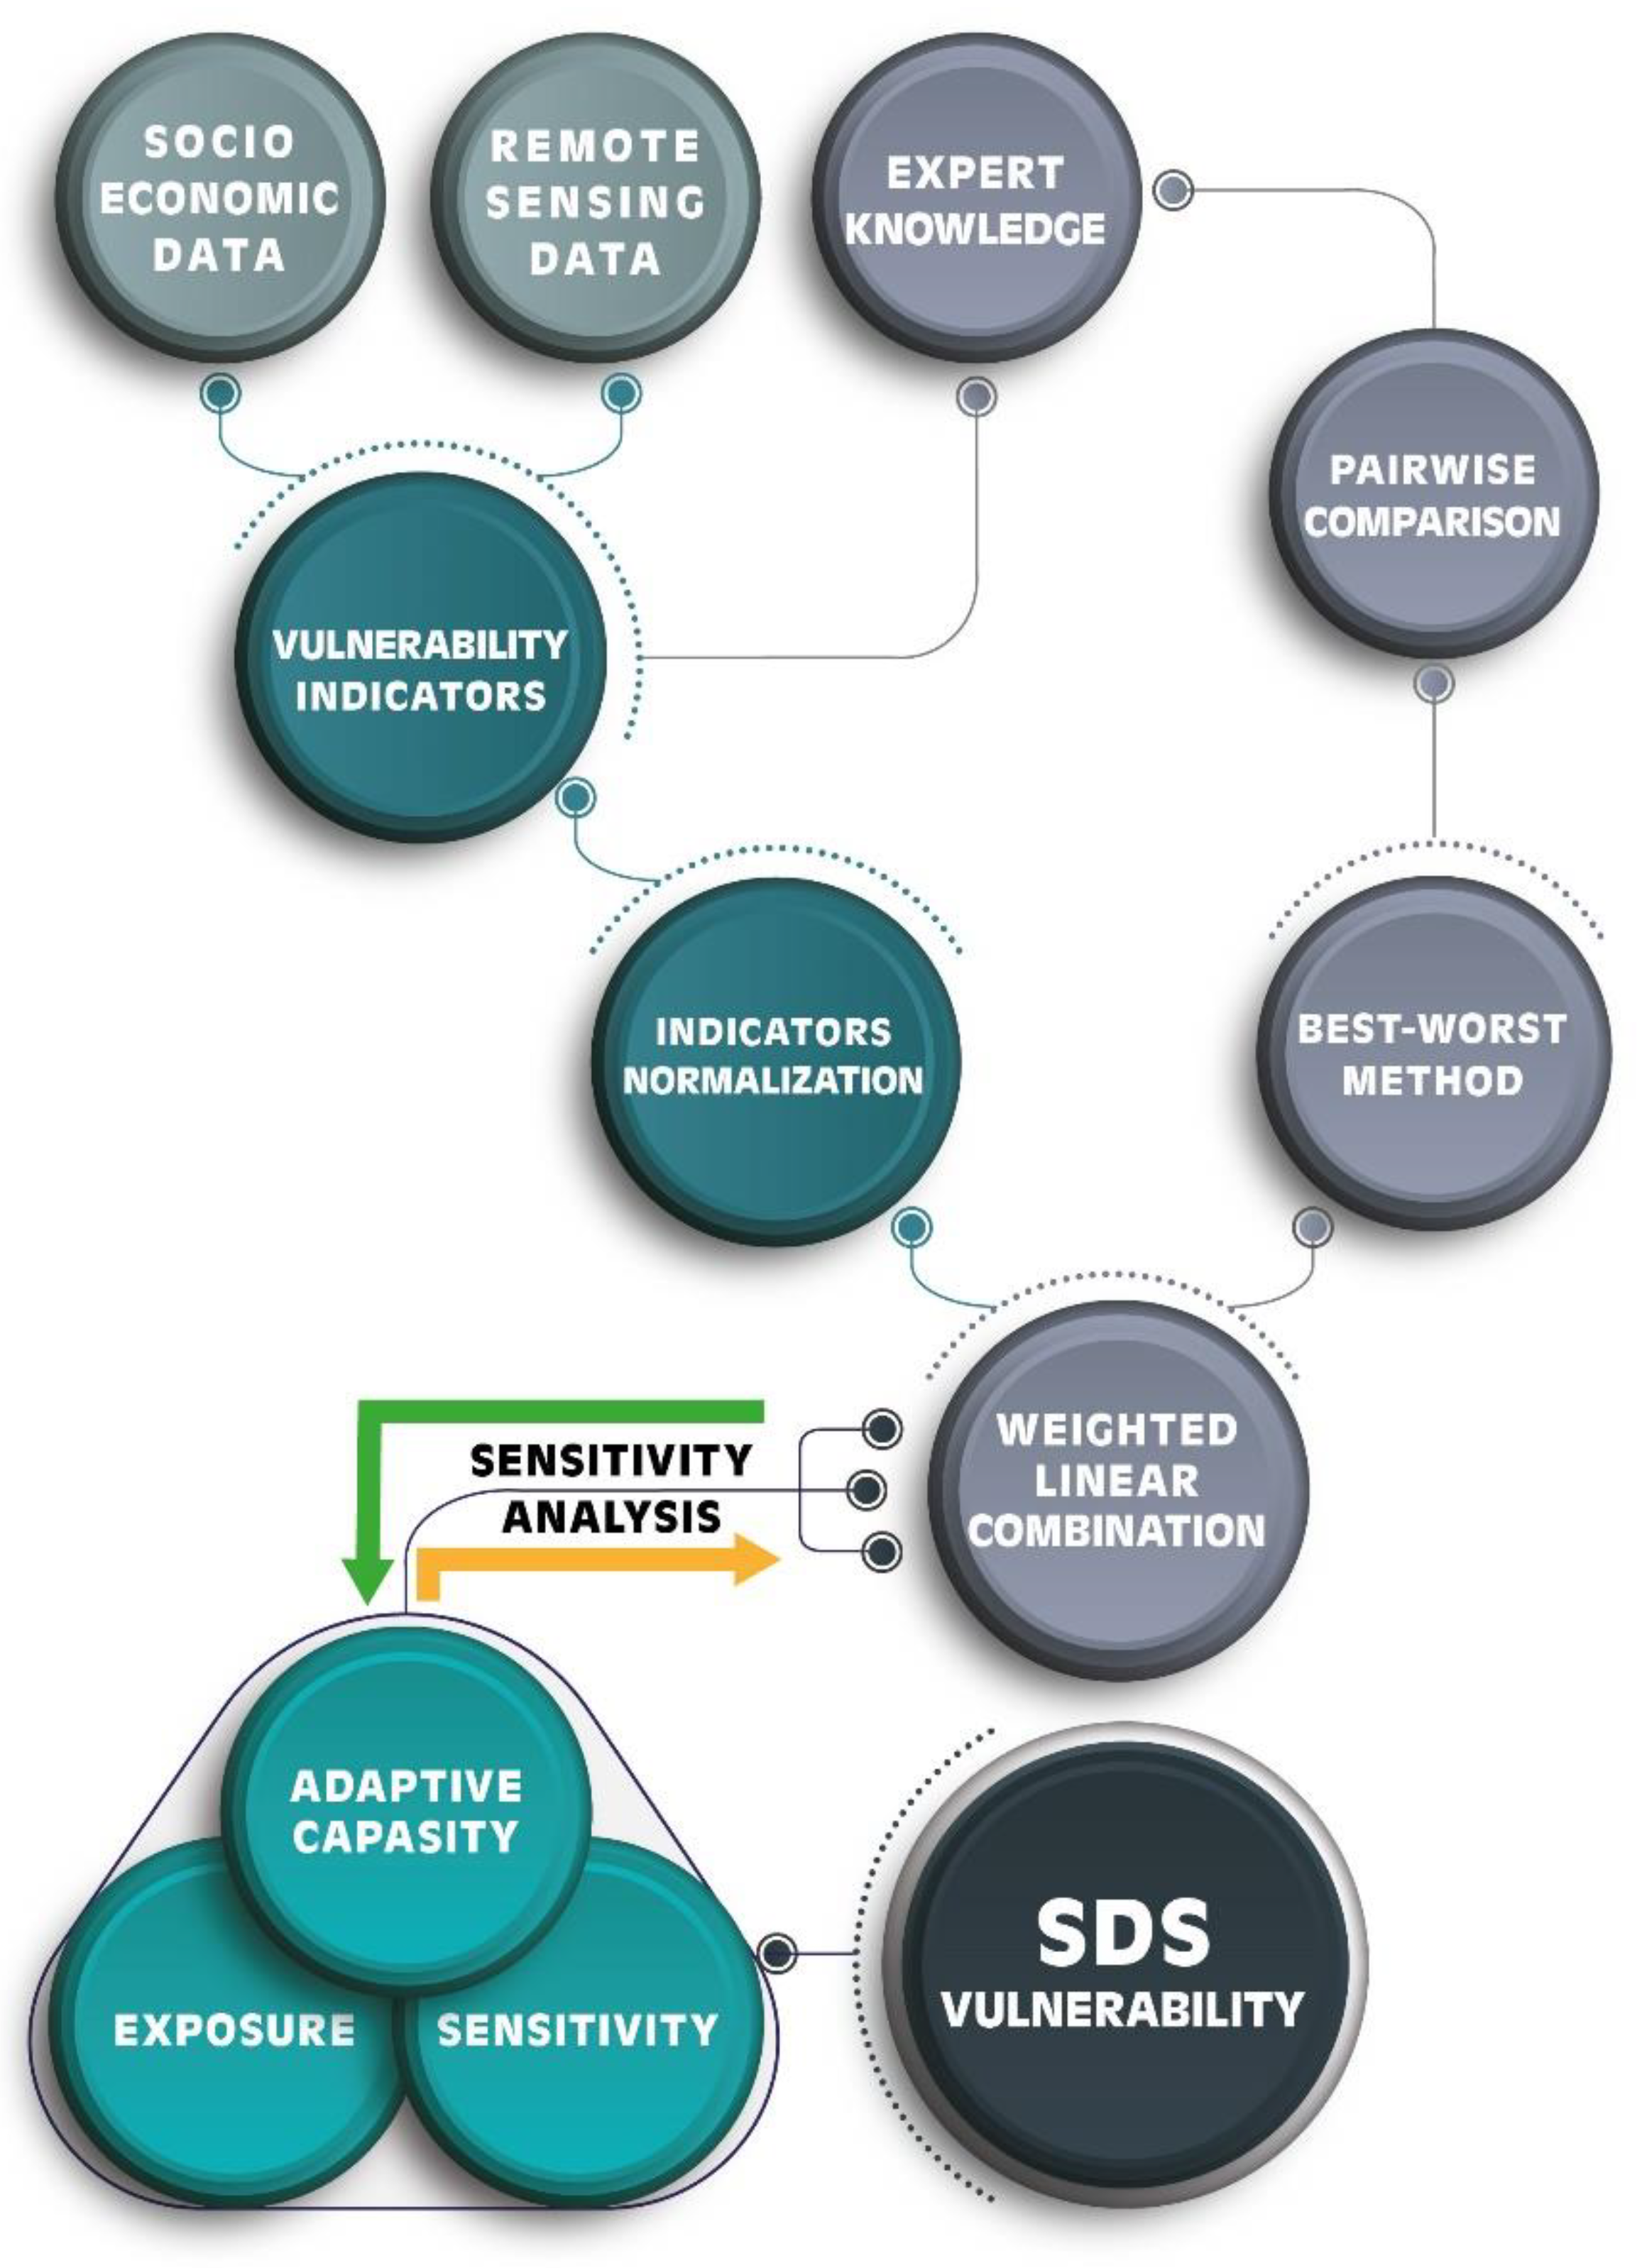
2.1. Methodology

The integrated assessment approach presented in the vulnerability framework of IPCC’s Fourth Assessment Report (AR4) [51] is adapted here for vulnerability mapping of Iran’s rural areas to SDS. Accordingly, vulnerability is generally defined as a function of three interrelated components, including (i) exposure (E), which refers to the physical effects of a hazard as well as the nature and degree to which elements of a system are exposed to the risk of that hazard; (ii) sensitivity (S), which generally refers to a system’s degree of susceptibility or the degree of variability and is open to the effects of hazard drivers; and (iii) adaptive capacity (AC), which quantifies the ability of the system to cope with, manage, recover from, and adapt to the possible adverse effects of hazardous phenomena [44,50]. In general, the vulnerability of a system has a positive relationship with E and S components and a negative relationship with AC [52]. Considering the type of relationship between E and S components, the addition (+) [52] and multiplication (×) [50] arithmetic operators can be used for modeling. The effects of E and S components on vulnerability is converse to that of AC. Accordingly, the geometric mean of E and S components is computed and subtracted from AC through Equation (1):
Vulnerability = E × S 1 2 AC
To map and assess vulnerability based on the composite index approach, the present study uses various indicators to formulate different components of vulnerability. As shown in Figure 1, the procedure includes five steps:
(1)
Defining indicators as GIS layers to formulate vulnerability components;
(2)
Normalizing indicators based on their type of relationship (direct or inverse) with corresponding component;
(3)
Weighting indicators based on expert knowledge to involve their relative importance in GIS-MCDA modeling;
(4)
Creating a vulnerability map by combining components; and
(5)
Analyzing the sensitivity of the spatial pattern of the vulnerability levels to changes in the component’s weights.

2.1.1. Vulnerability Indicators

In general, two approaches are used to define an indicator; one is based on the theoretical understanding of relations, and the other is based on statistical relations. The first approach is deductive and the second is inductive [53]. Based on the theoretical understanding of the SDS phenomenon, literature review, expert knowledge, and data availability, this study developed indicators using socioeconomic and remote sensing data to formulate vulnerability components, i.e., E, S, and AC (Table 1).
Vulnerability can be assessed at different scales, such as the household, local, national, regional, and global [53]. Issues concerning scale are essentially related to how data are collected and displayed [39]. Considering that data for calculating S and AC indicators were available at the county scale, we adapted our modeling at this spatial scale. Hence, the indicators were defined based on the data for the rural areas of the counties in Iran. The county is between the village and the province scales in Iran’s political–administrative divisions. Therefore, the county scale (Figure 2) is expected to provide satisfactory details about the SDS vulnerability pattern in rural areas of Iran.
Table 1. Components and corresponding indicators for assessing vulnerability of rural areas to SDS.
ComponentIndicatorDescriptionTime ScaleRelationshipBWM WeightData SourceReference
ExposurePrecipitation
(Pr)
Average annual cumulative precipitation2000–2021-0.331TerraClimate[54,55]
Air temperature (AT)Average annual air temperature2000–2021+0.169FLDAS
Aerosol optical depth (AOD)Average AOD as a measure of the columnar atmospheric aerosol concentration2000–2021+0.331MODIS-Terra/Aqua[16,56]
Visibility
(Vis)
It is the measure of the distance at which an object can be clearly observed by unaided eye2000–2021-0.169Meteorological stations[57]
SensitivityOccupancy
(Occ)
Ratio of people per dwelling2016+0.252Population and Housing Censuses[58,59,60]
Female-headed households (FHH)Ratio of Female-headed households to total female population2016+0.224Population and Housing Censuses[43,54,60]
Elderly (El)Ratio of >65 years old to total population2016+0.125Population and Housing Censuses[55]
Children (Ch)Ratio of 0–4 age group to total population2016+0.399Population and Housing Censuses
Adaptive
Capacity
Literacy (Lit)Ratio of literate people to rural population >6 years old2016+0.050Population and Housing Censuses[54,60,61]
Active population (AP)Ratio of 15–64 age group to total population2016+0.150Population and Housing Censuses[62]
Labor force participation rate (LFPR)Ratio of labor force to active population2016+0.088Population and Housing Censuses[63]
Bank (Ba)Ratio of banks to 10,000 people2016+0.032Statistical yearbook of Iran[58,60]
Women’s rural funds (WRF)Ratio of women’s rural funds
to 10,000 people
2019+0.040Agricultural Research Education and Extension Organization (AREEO)-
Membership in cooperative companies (MCC)Ratio of rural cooperative companies to 10,000 people2016+0.040Statistical yearbook of Iran[64]
Road (Ro)Ratio of rural asphalt roads to total rural roads2016+0.105Statistical yearbook of Iran[54,61,64]
Agricultural machinery (AM)Ratio of number of combine harvester + tractor to agricultural land to county area2016+0.095Statistical yearbook of Iran-
Agricultural yield (AY)Ratio of agricultural production to cultivated area2018+0.075AREEO-
Livestock per capita (LPC)Ratio of livestock to population2016+0.092Statistical yearbook of Iran[60]
Irrigated cropland area (ICA)Ratio of irrigated lands to croplands to county area2018+0.033AREEO[61]
Rural health centers (RHC)Number of rural health centers per 10,000 population2016+0.067Statistical yearbook of Iran[54,60]
Rural health houses (RHH)Number of health houses per 1000 population2016+0.133Statistical yearbook of Iran

2.1.2. GIS-MCDA Weighting

Indicators have relatively different importance for producing the component maps of SDS vulnerability. Therefore, it is essential to determine the weight of each indicator, which is a key step in vulnerability assessment [65]. Various subjective and objective weighting methods have been developed in the literature. The former approaches have been used in many fields; however, they are dependent on expert knowledge and suffer from subjectivity. Although the latter methods do not have a subjectivity problem, they are highly dependent on objective data [66].
This study employed the best-worst method (BWM) [67], which is a subjective weighting method relying on pair-wise comparisons of indicators. BWM is similar to analytic hierarchy process (AHP) [68], except that it has fewer pair-wise comparisons and provides more consistent and, ultimately, more reliable results. To implement BWM, the best (i.e., most important/desirable) and the worst (i.e., least important/desirable) indicators are identified vis-à-vis each of the SDS vulnerability components. Then, through the best-to-others and others-to-worst vectors, the priority of the best indicator compared to other indicators and the priority of other indicators compared to the worst indicator are determined, respectively. This procedure uses pair-wise comparisons and a numerical scale between 1 and 9. The final weights of the indicators are determined by formulating and solving a maximization problem [69].
Here, a questionnaire was designed in accordance with the purpose of the work, in which the list of indicators, their definition, and their relationship with the corresponding SDS vulnerability component were described. Then, 25 questionnaires were filled out by experts in the fields of environmental sciences, natural resources management, agriculture, and geography. Finally, after calculating the optimal weights, to involve the opinions of all experts, the arithmetic mean of weights for each indicator was obtained [70].

2.1.3. Indicator Normalization

To assess vulnerability, it is necessary to convert different indicators into the same unit to make them comparable [71]. The SDS vulnerability indicators were normalized based on their functional relationship with the corresponding components. The minus and plus signs in Table 1 show the functional relationship of each indicator to the corresponding component. There is a direct relationship (+) when the value of a component increases by increasing the value of its corresponding indicators, whereas an inverse relationship (−) is in the opposite case [72]. Accordingly, maximum (Equation (2)) and minimum (Equation (3)) methods were used to normalize indicators with direct and inverse relationships, respectively.
v m a x i j = X i j X i m i n X j m a x X j m i n
v m i n i j = X j m a x X i j X j m a x X j m i n
where, v m a x i j and v m i n i j , respectively, express the normalized maximized and minimized values of the i th pixel in the jth indicator, X i j is the original value of the ith pixel in the jth indicator, and X i m i n and X j m a x , respectively, are the maximum and minimum values in the jth indicator [73,74].

2.1.4. GIS-Based SDS Vulnerability Mapping

First, the GIS layers corresponding to the defined indicators (Table 1) were spatially resampled to 1 km pixel size using the nearest neighbor algorithm. Then, using the weighted linear combination (WLC) method based on GIS-MCDA, the obtained weights and normalized indicators were combined, where the decision maker assigns relative weights to each indicator map. Accordingly, the maps of the components are produced through the weighted sum of the indicators using Equation (4) [75].
C i = j = 1 n a i j W j
where, C i represents the final value of the i th pixel in each component, a i j is the normalized value of the i th pixel of the j th indicator, and W j is the weight of the j th indicator. By using the maps of E, S, and AC components in Equation (1), the SDS vulnerability map of rural areas was produced. Finally, to investigate the spatial distribution of SDS vulnerability in different rural areas of Iran, the obtained map was categorized into five levels/categories, including very low, low, medium, high, and very high.

2.1.5. Sensitivity Analysis

The subjectivity of experts’ opinions causes the calculated weights for the indicators to be accompanied by uncertainty, which may affect the results of the decision-making issue [66]. Sensitivity analysis was performed to investigate the impact of the uncertainty caused by changes in the weights of indicators obtained using BWM on the spatial distribution of SDS vulnerability levels. In this way, changes in the area of SDS vulnerability levels can be interpreted as the result of changes in the weights of indicators. For this purpose, the sensitivity of the overall score of vulnerability levels to changes in the weight of the indicators was determined in a range from −10% to +10%, with a 1% change interval [69]. Since the sum of the weights of indicators for each component must be equal to 1, in each repetition, by changing the weight of each indicator, the weight of other indicators was changed to compensate for the weight change according to their proportion. Along with the changes in the weights of the indicators, corresponding component and vulnerability maps were reproduced. In all repetitions, the SDS vulnerability maps reproduced using different weights were categorized into five levels (from very low to very high) and their areas were measured. Finally, for each component, the average changes in the area of very high level of vulnerability were analyzed relative to the changes in the weight of the corresponding indicators.

3. Results and Discussion

3.1. Vulnerability Indicator

The SDS vulnerability indicators at the county scale were produced based on the expert knowledge and data availability. Hence, the various aspects of SDS, including climatic characteristics, SDS events, the affected population and human resources, socio-economic characteristics, infrastructures, and health services, were formulated in the form of vulnerability indicators (Table 1). GIS layers produced for indicators of E, S, and AC components are presented in Figure 3. The normalization process of the indicators was performed based on their relationship with the corresponding component. As presented in Table 1, the indicators related to the AC component all have a positive functional relationship with it. According to Equation (1), increasing AC reduces the vulnerability of rural areas to SDS. Therefore, in AC indicators, the higher values indicate a better condition of rural areas against SDS. Contrary to the AC, the AT and AOD indicators of E and all indicators of S components have a positive relationship with SDS vulnerability. The two indicators, Pr and Vis, have an inverse relationship with the E component and SDS vulnerability, which was considered in the normalization process. Hence, the increase of E and S components has increased the vulnerability of rural areas to SDS.

3.2. Best-Worst Method

By taking the advantages of expert knowledge through questionnaires, the weights of indicators were calculated using BWM. The results revealed that Pr and AOD, Ch, and AP and RHH indicators of E, S, and AC components have received the highest weights, respectively. While the AT, El, and Ba indicators of E, S, and AC components have received the lowest weights, respectively (Table 1). It is worth noting that the indicators with the highest and lowest weights will correspondingly have the highest and lowest impacts on the related component maps and, subsequently, on the final vulnerability map.

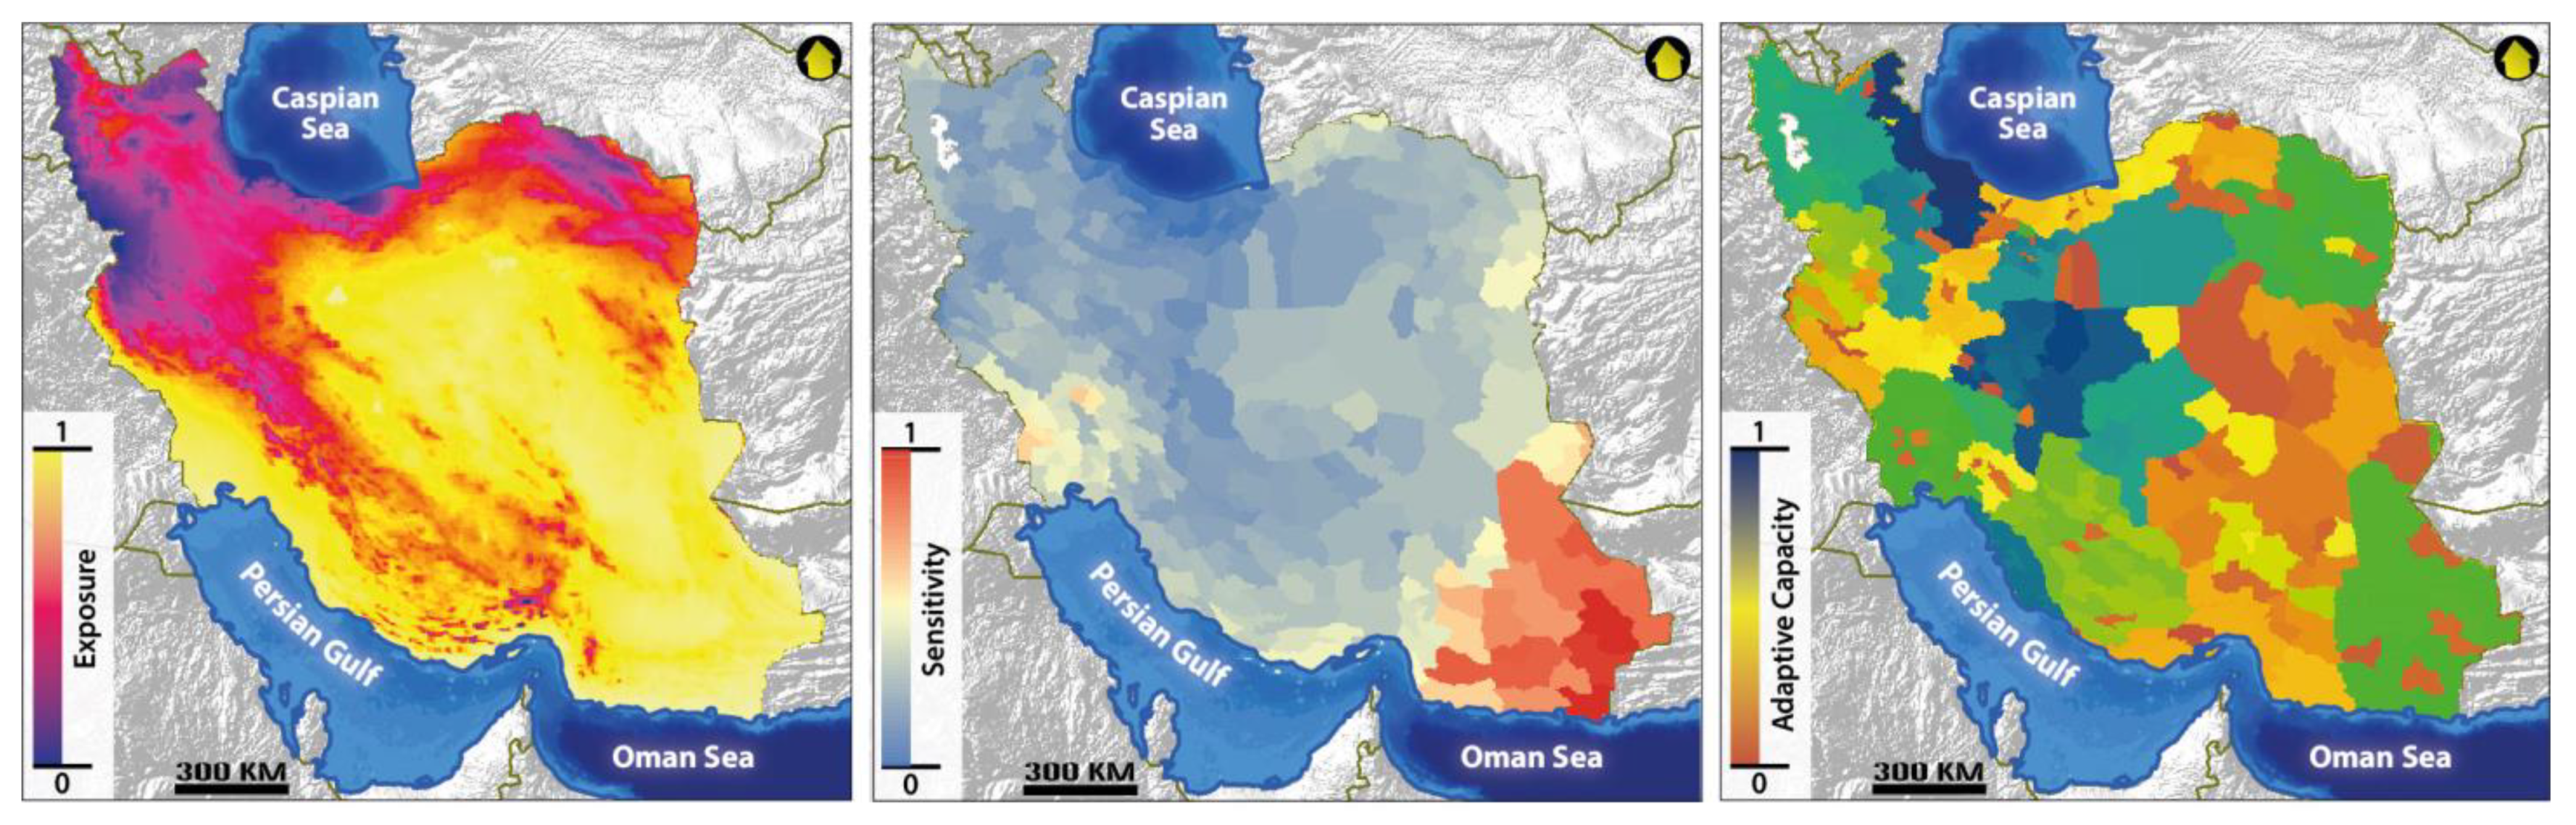
3.3. Vulnerability Components

Using Equation (4) and applying the weights obtained for the indicators (Table 1), maps of E, S, and AC components were produced (Figure 4). The central, southwestern, southern, and southeastern regions of Iran experienced the highest SDS exposure in the period from 2000 to 2021 (Figure 4). As [15,16] have also acknowledged, in addition to domestic SDS sources, the SDS emitted from external sources located in Syria, Iraq, and Saudi Arabia also contribute to affecting these areas (especially in spring and summer). Regarding the SDS-affected areas in central Iran, despite the high SDS exposure, since these areas have a very small and scattered population, they are less important than the other exposed areas. As Figure 4 shows, the southeast of the country (especially Sistan and Baluchistan province) has the highest SDS sensitivity. Since socio-demographics indicators were used to calculate the S component (see Table 1), the results are in agreement with the findings of [76], which showed that Sistan and Baluchistan province has the lowest human development index (HDI) in Iran. The AC component is obtained from various socio-economic indicators. As can be seen in the map of this component (Figure 4), the northwestern and central parts of the country have better conditions, while the east and southeast regions of Iran are suffering from lower adaptive capacities.

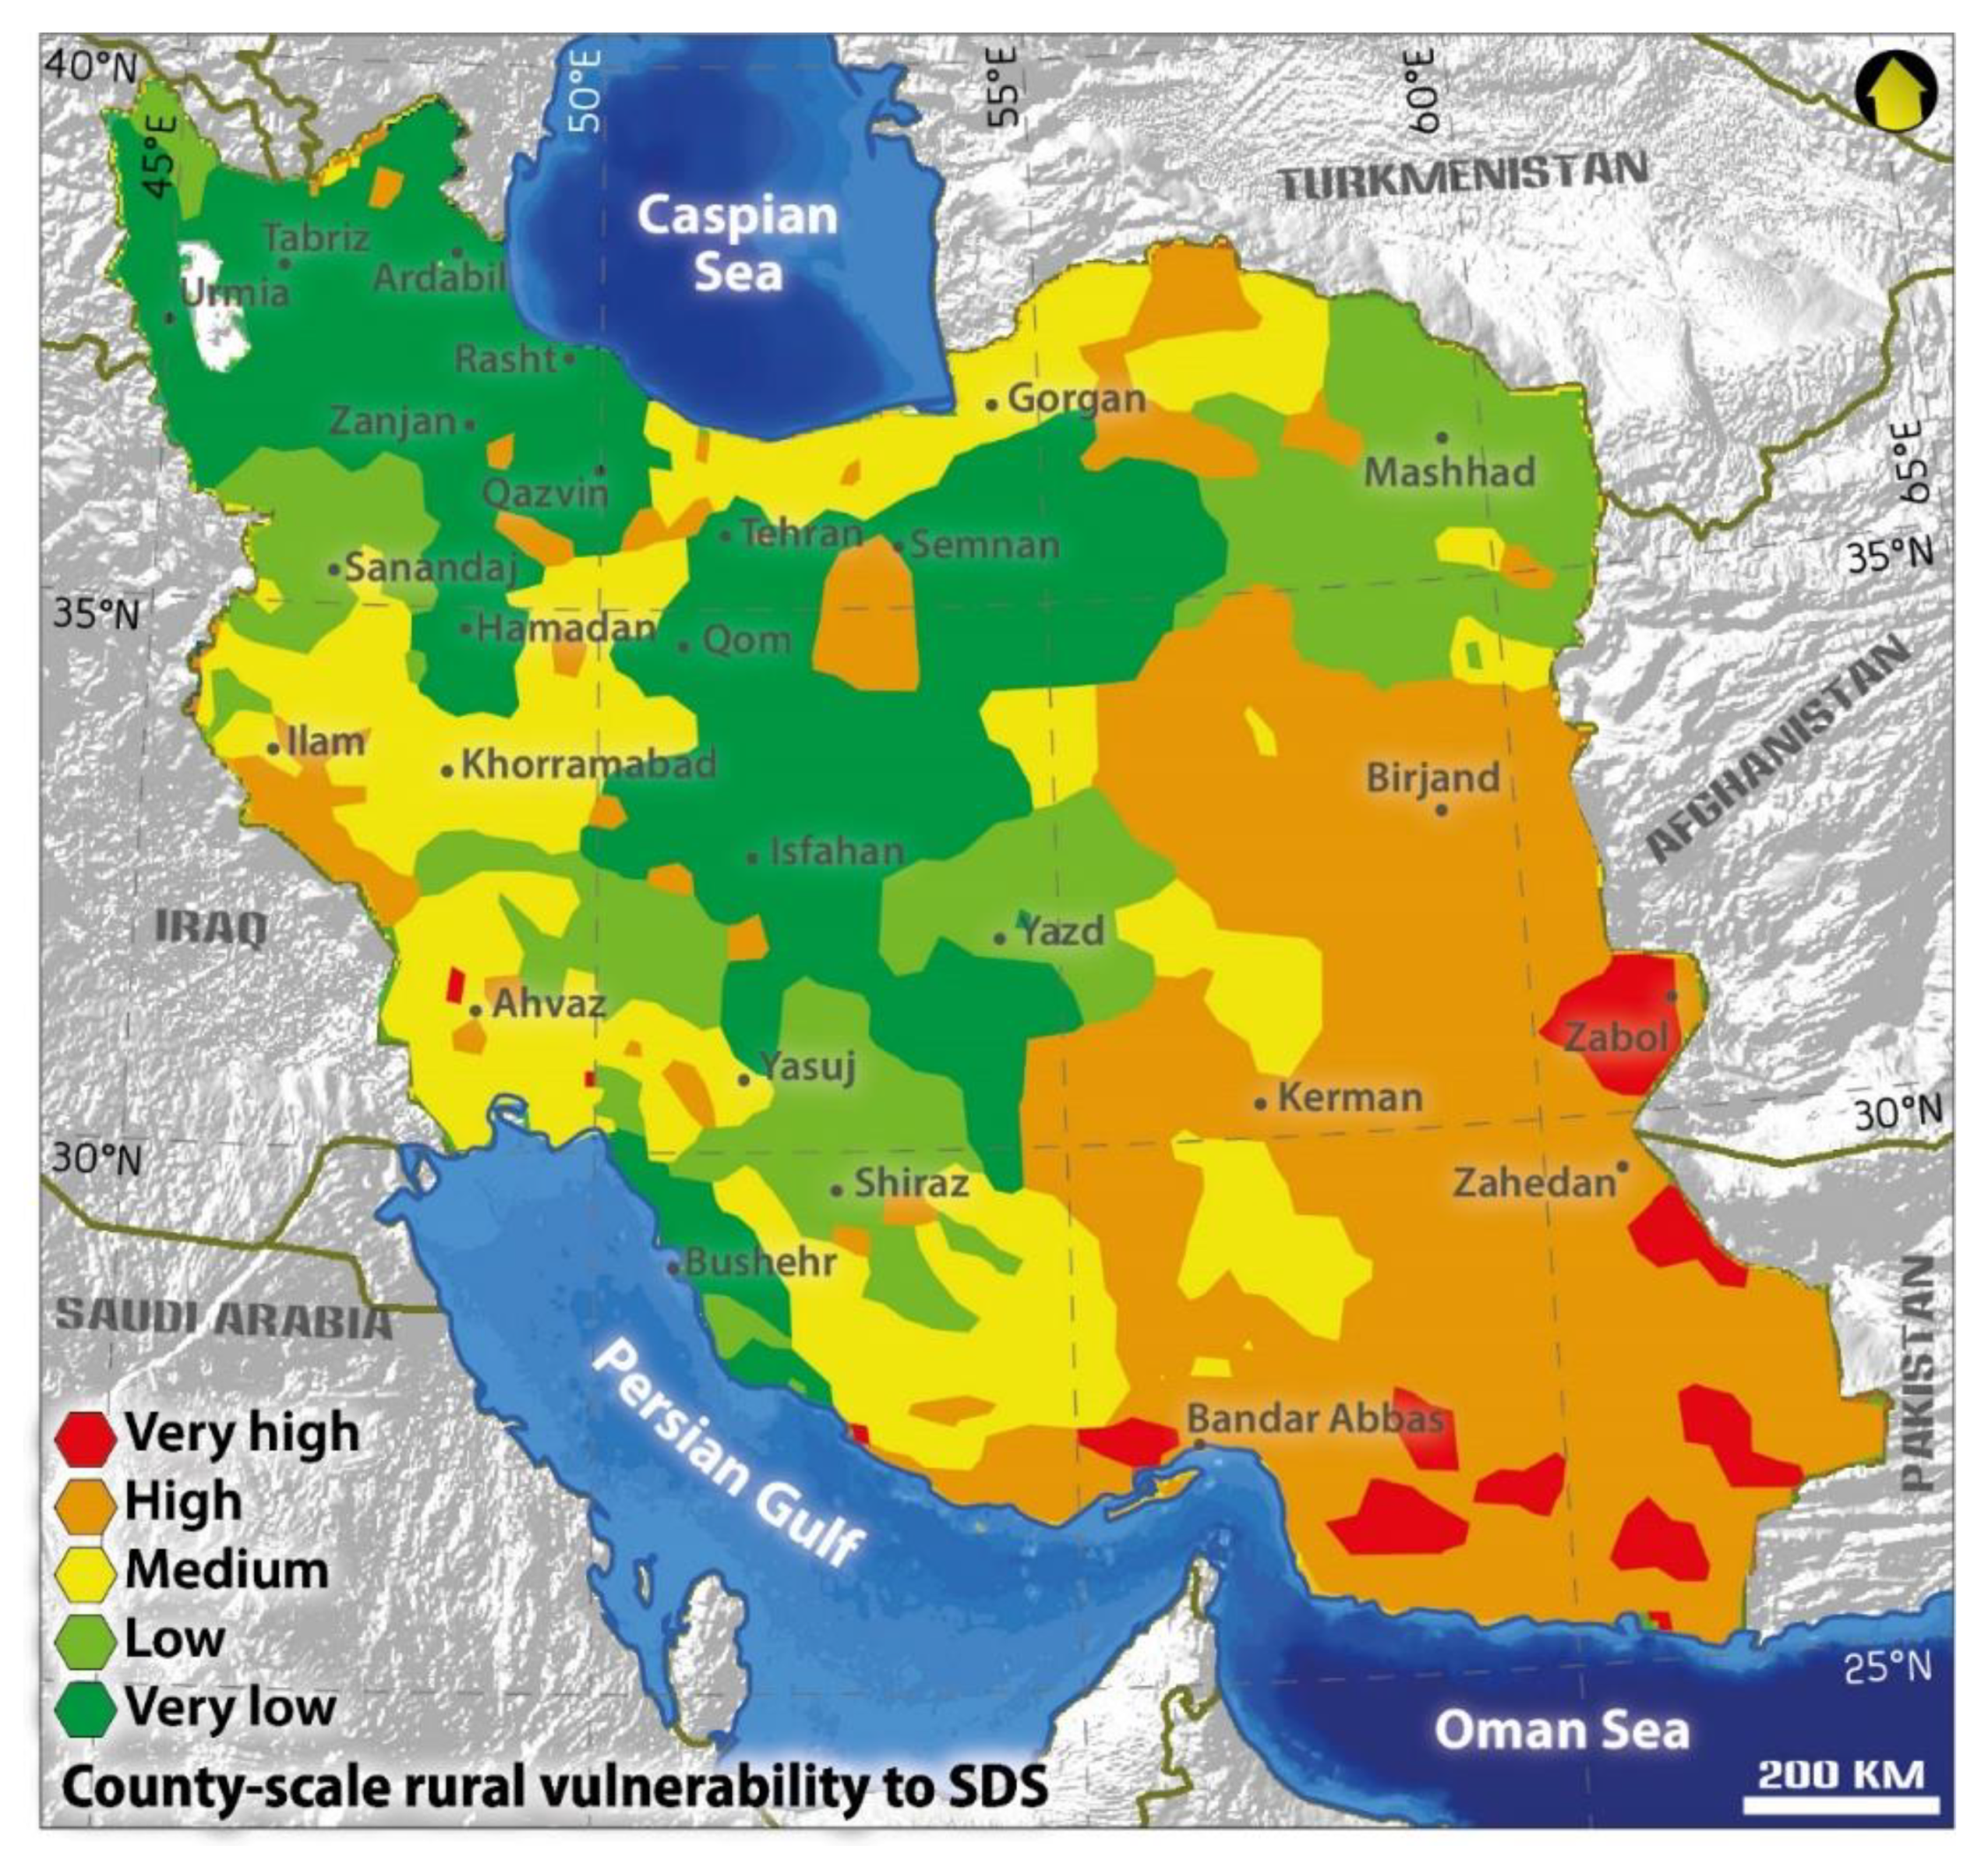
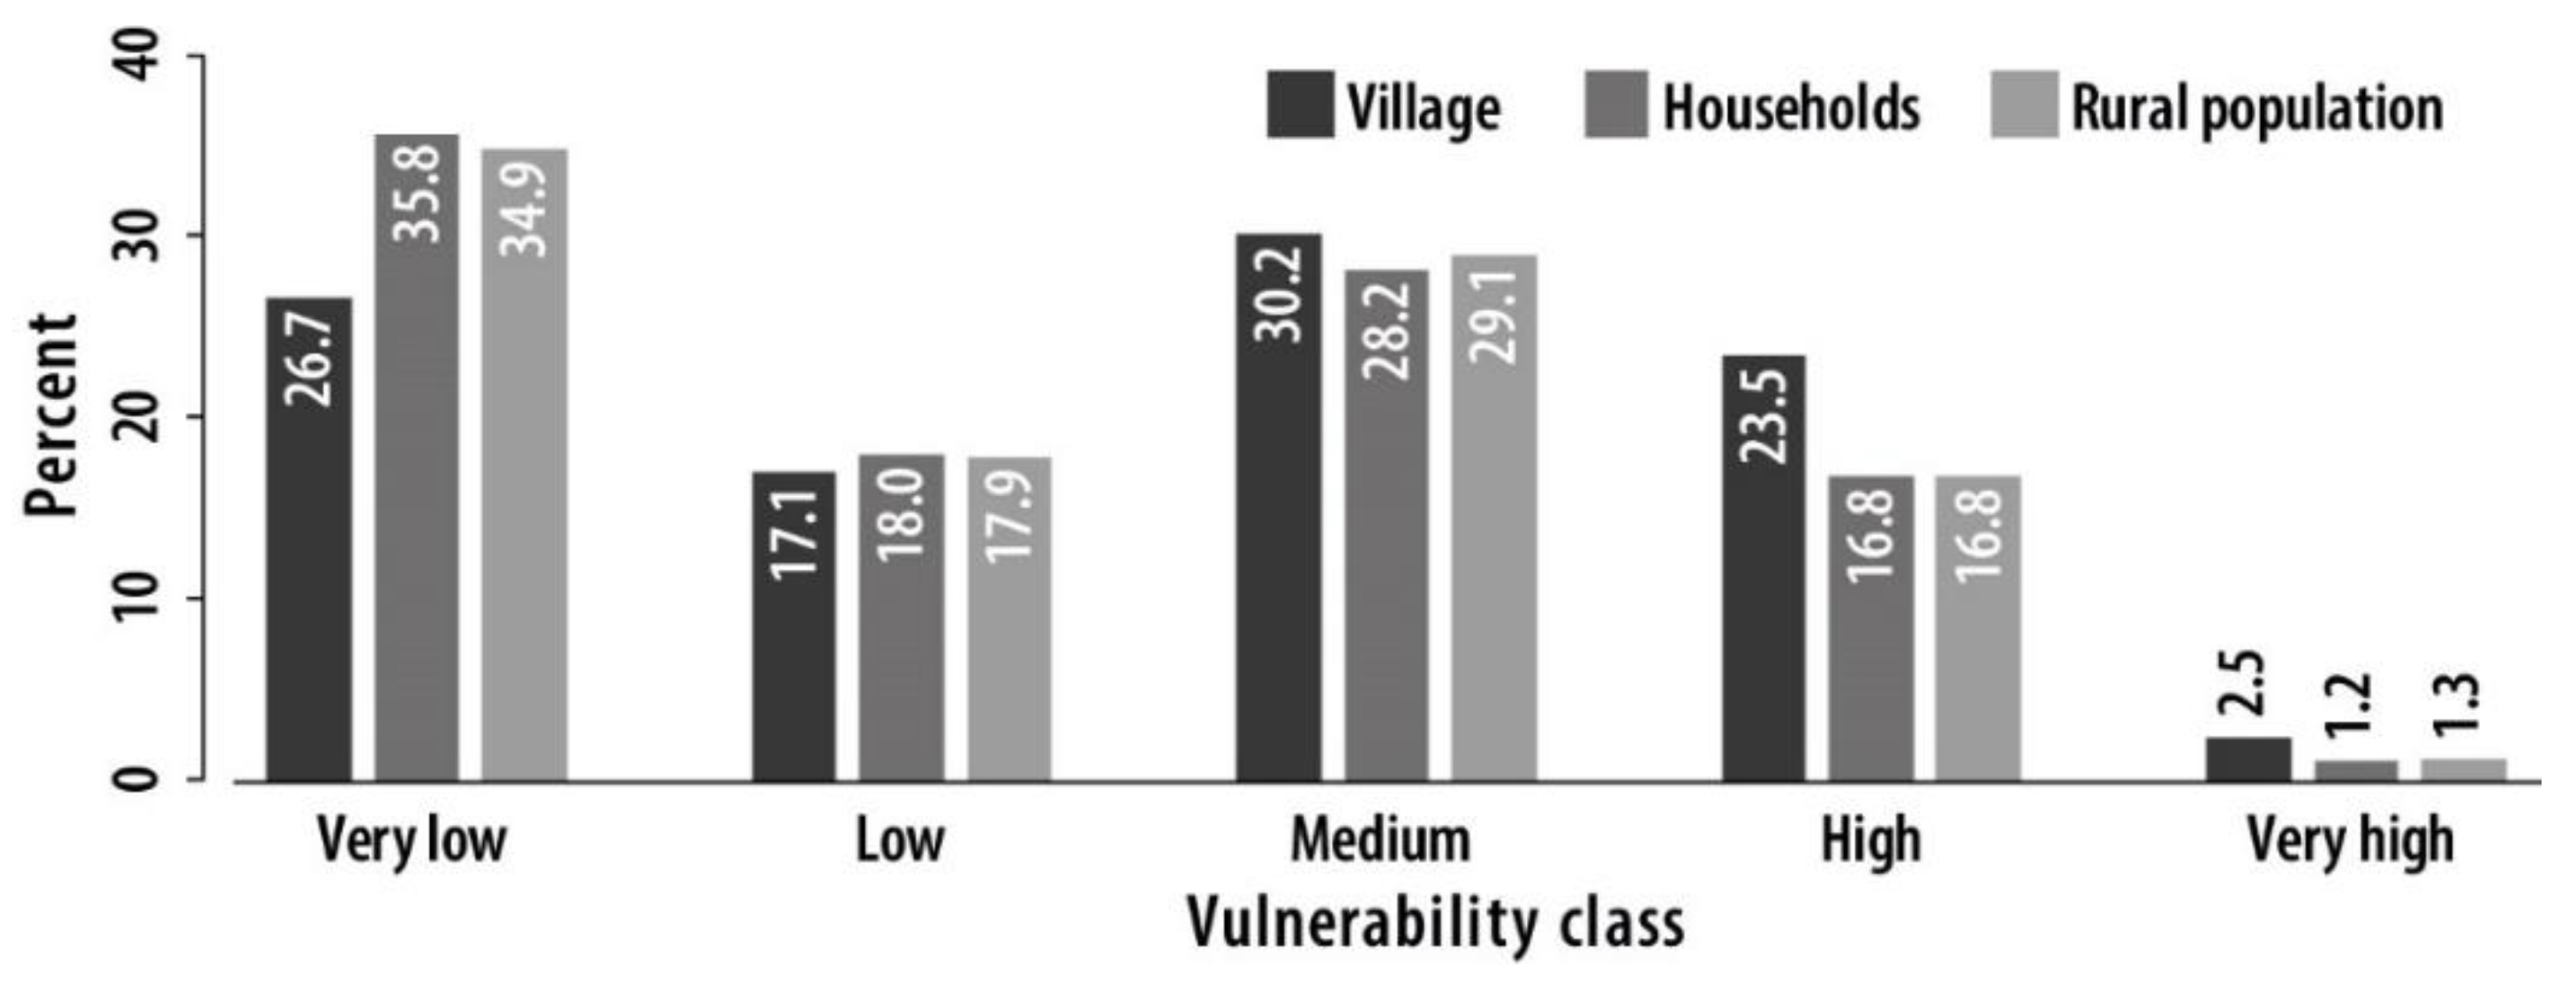
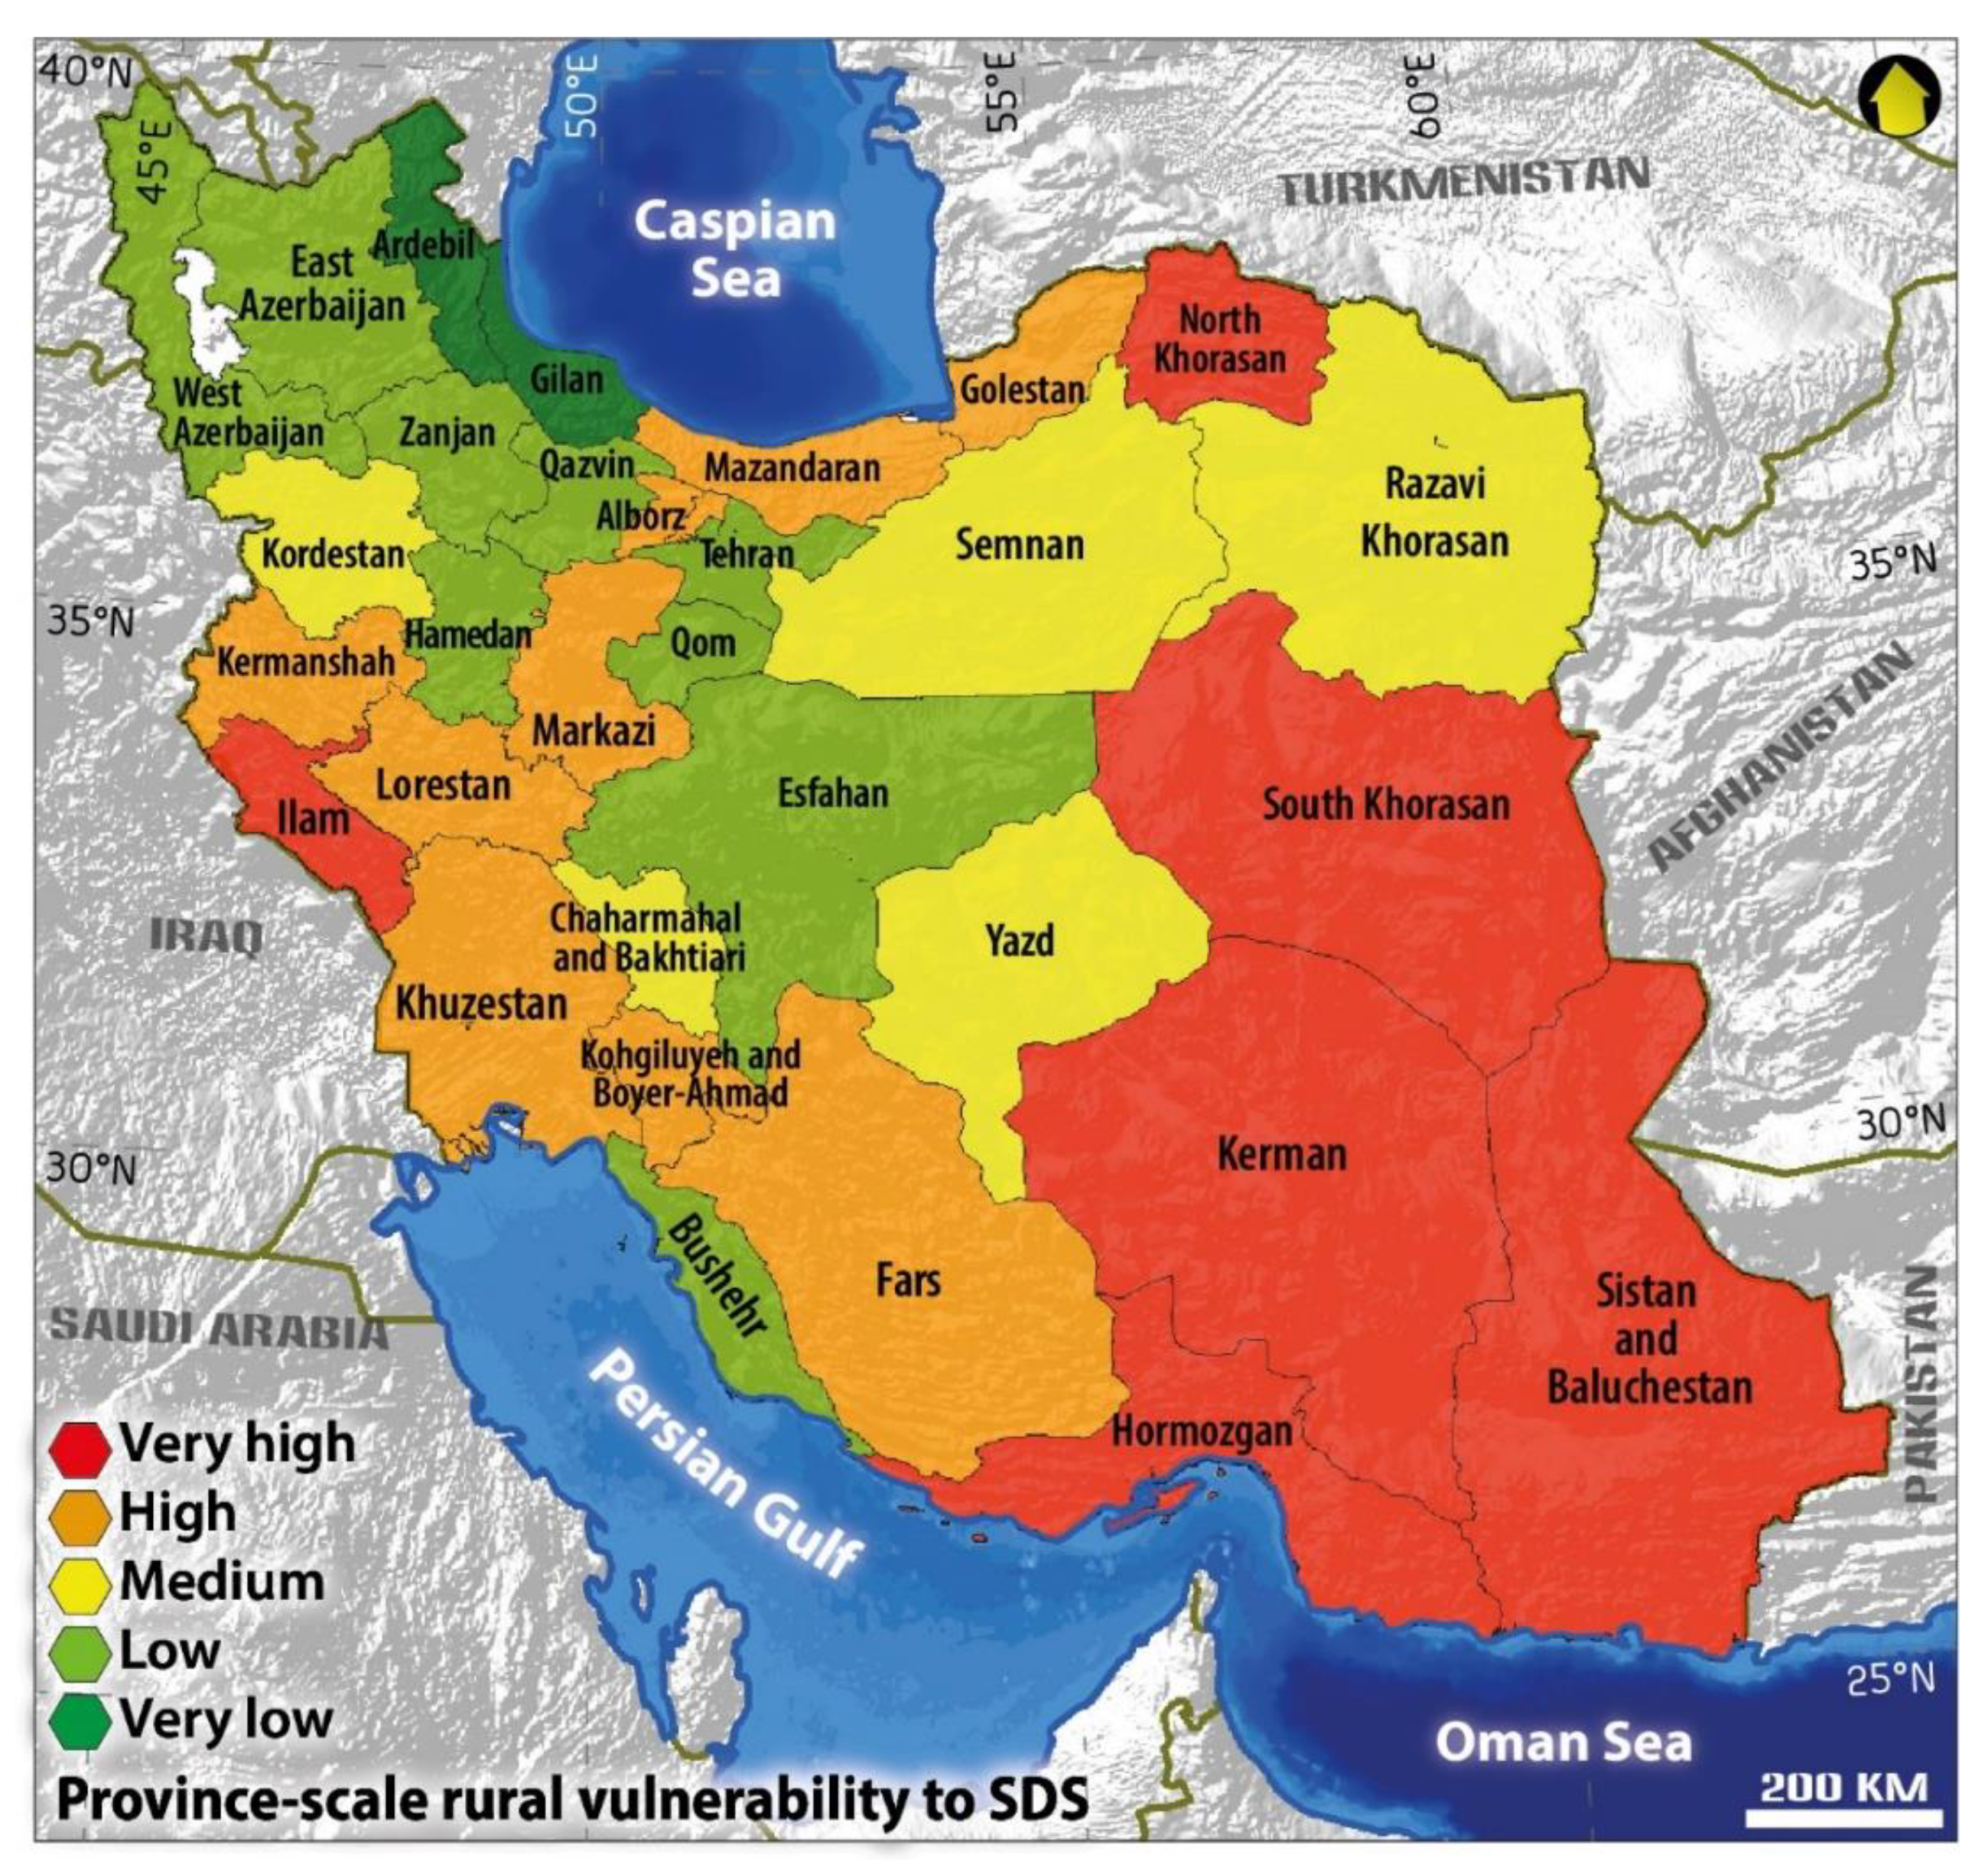
3.4. Iran’s Rural Vulnerability to SDS

The SDS vulnerability map was produced using Equation (1). The map was categorized into five levels, from very low to very high [77], through the Natural Breaks method (Figure 5), which is performed by minimizing the average deviation of each category and maximizing the deviation between them. In this method, the breaks determine categories with values which satisfy the minimum and maximum intra-class and inter-class variance, respectively [78]. As shown in Figure 5, the counties located in the southeast and south of Iran have experienced the highest level of vulnerability to SDS.
It is noteworthy that high SDS exposure (i.e., high frequency and intensity) in an area does not necessarily mean high vulnerability, because S and AC components also play a role. For instance, Khuzestan province has been considered as one of the most SDS-affected areas in Iran [50,79], which resulted in the high value of the E component. However, since the amount of S and AC components in this province are relatively low and high respectively, Khuzestan is placed in the medium vulnerability level (except for Hamidiyeh, Bavi, and Karun counties). As another example, the E and S components were relatively high and low, respectively, and the AC component was very low in South Khorasan province, which caused most of the province to be placed in the high vulnerability level.
To create a general view of the rural vulnerability to SDS in Iran, the percentages of villages, households, and population in different SDS vulnerability levels were extracted. As shown in Figure 6, the highest and lowest percentage of villages, households and population are placed in very low and very high SDS vulnerability levels, respectively.
As shown in Figure 5, the provincial administrative borders impose an obvious spatial distribution to the SDS vulnerability levels, which is somehow independent of the situation of villages and counties to SDS exposure. This reveals the key role of provincial management policies on rural vulnerability to SDS. For instance, Ilam and Khuzestan provinces in the southwest of Iran have almost the same situation in terms of climatic characteristics and SDS, but they are placed in different SDS vulnerability categories. This can be attributed to the different levels of economic, social, and administrative development of the provinces.
Considering the provincial administrative borders of SDS vulnerability, the average vulnerability values at the county level were used to obtain the provincial SDS vulnerability map (Figure 7). Results suggest that the rural areas of Sistan and Baluchestan, Hormozgan, Kerman, South Khorasan, North Khorasan, and Ilam provinces have experienced the highest SDS vulnerability. In contrast, Gilan and Ardabil provinces have the lowest SDS vulnerability.
In different countries of the world, various mitigation measures have been taken to combat SDS by considering the type and origin of the emission sources [80], including stabilizing the soil surface by biological/chemical mulching, planting climate-adapted shrubs and trees, setting up windbreaks, and creating mechanical and biological barriers (e.g., dead vegetation) [81]. The SDS mitigation measures have been implemented to control the internal SDS sources in Iran. Additionally, many areas of the country are highly affected by external SDS sources, especially the sources downstream of the Tigris and Euphrates River basins [82]. Due to the large extent of SDS emission sources, these activities usually face many obstacles. Hence, to reduce the vulnerability of SDS-affected rural areas of Iran, one of the most effective solutions is the improvement of AC indicators, which may lead to increasing rural resilience against SDS. This highlights the importance of SDS vulnerability assessment as a basis for planning procedures and budget allocation to improve AC by authorities based on the provincial prioritization of the SDS vulnerability map presented in this study (Figure 7).

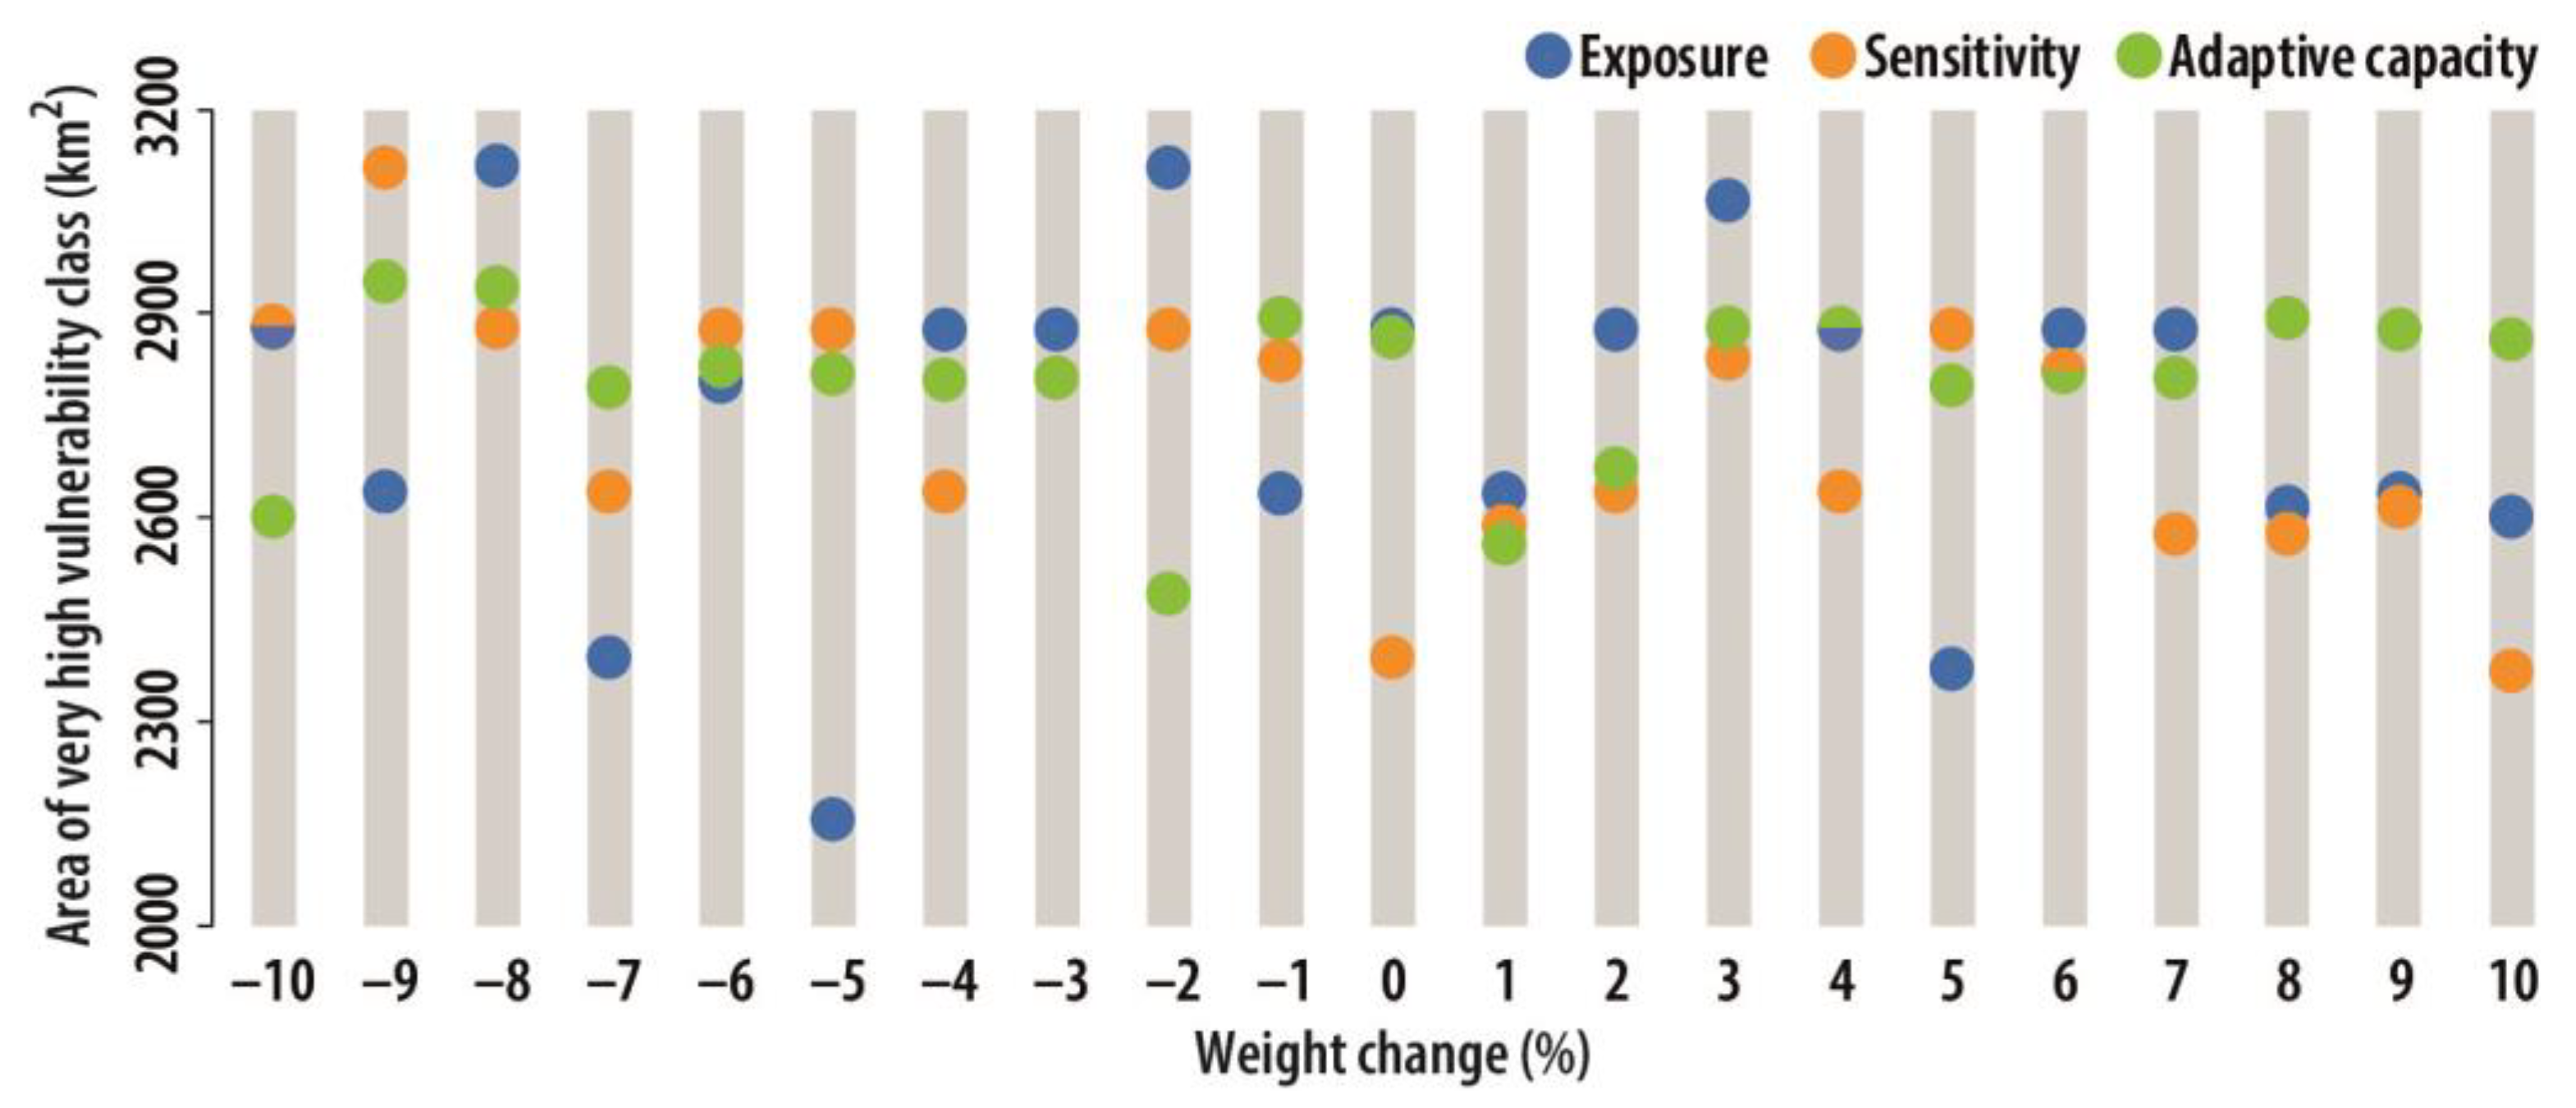
3.5. Sensitivity Analysis

As shown in Figure 8, the most changes in the area of the very high vulnerability level relative to changes in the weights of the corresponding indicators were obtained for the exposure component. Meanwhile, the other components show relatively less area changes. Here, more area changes are interpreted as more sensitivity of the component to changes in the weight of the corresponding indicators. In general, the area of the very high vulnerability level has significantly changed in negative weights for all components.

4. Conclusions

Today, the effects of sand and dust storms (SDS) on human societies are in the spotlight of environmental investigations. Rural communities deserve more attention due to their livelihood depending on natural resources, including agricultural activities. In this study, a vulnerability assessment of rural areas was carried out as the first necessary step to mitigate the risk of SDS in Iran. For this purpose, a geographic information system-multiple criteria decision analysis (GIS-MCDA) spatial–temporal modeling procedure was developed based on socioeconomic and remote sensing data. Hence, the vulnerability was formulated through the development of measurable indicators. The proposed methodology discovered the key SDS rural vulnerability indicators and could be generalized to other countries, as well as in different scales from local to national.
The produced SDS vulnerability map shows that about 37% of Iran’s rural areas are subjected to high and very high vulnerability levels. Our results revealed that a provincial administrative pattern is evident in the SDS vulnerability map. This highlights the significant impact of provincial management policies on SDS vulnerability in rural areas. The results of this work can be employed as a basis for developing insurance and an SDS damage compensation index for rural areas of Iran. In addition, the findings can be used as a guidance for policy making and budget allocation in line with SDS mitigation and adaptation programmes in rural areas.
It is planned to implement the proposed methodology using freely available data to map the global rural vulnerability to SDS.

Author Contributions

Conceptualization, A.D.B., M.S., N.N.S., M.B. and M.Q.; data curation, M.S., M.B., R.P. and S.M.; formal analysis, A.D.B., M.S. and M.B.; investigation, A.D.B., M.S. and M.B.; methodology, A.D.B., M.S., N.N.S., M.B., M.Q., R.P. and S.M.; project administration, A.D.B.; resources, A.D.B.; software, M.S., M.B. and M.Q.; supervision, A.D.B. and N.N.S.; visualization, M.S. and R.P.; writing—original draft, M.S. and M.Q.; writing—review and editing, A.D.B., M.S., N.N.S. and M.B. All authors have read and agreed to the published version of the manuscript.

Funding

This research received no external funding.

Institutional Review Board Statement

Not applicable.

Informed Consent Statement

Not applicable.

Data Availability Statement

The data presented in this study are available on request from the corresponding author.

Conflicts of Interest

The authors declare no conflict of interest.

References

  1. Darvishi Boloorani, A.; Papi, R.; Soleimani, M.; Karami, L.; Amiri, F.; Neysani Samany, N. Water bodies changes in Tigris and Euphrates basin has impacted dust storms phenomena. Aeolian Res. 2021, 50, 100698. [Google Scholar] [CrossRef]
  2. Darvishi Boloorani, A.; Neysani Samany, N.; Papi, R.; Soleimani, M. Dust source susceptibility mapping in Tigris and Euphrates basin using remotely sensed imagery. Catena 2021, 209, 105795. [Google Scholar] [CrossRef]
  3. Al-Hemoud, A.; Al-Dousari, A.; Al-Shatti, A.; Al-Khayat, A.; Behbehani, W.; Malak, M. Health Impact Assessment Associated with Exposure to PM10 and Dust Storms in Kuwait. Atmosphere 2018, 9, 6. [Google Scholar] [CrossRef] [Green Version]
  4. Soleimani, Z.; Darvishi Boloorani, A.; Khalifeh, R.; Griffin, W.D.; Mesdaghinia, A. Short-term effects of ambient air pollution and cardiovascular events in Shiraz, Iran, 2009 to 2015. Environ. Sci. Pollut. Res. 2019, 26, 6359–6367. [Google Scholar] [CrossRef]
  5. Soleimani, Z.; Teymouri, P.; Darvishi Boloorani, A.; Mesdaghinia, A.; Middleton, N.; Griffin, D.W. An overview of bioaerosol load and health impacts associated with dust storms: A focus on the Middle East. Atmos. Environ. 2019, 223, 117187. [Google Scholar] [CrossRef]
  6. Zhang, X.; Zhao, L.; Tong, D.Q.; Wu, G.; Dan, M.; Teng, B. A Systematic Review of Global Desert Dust and Associated Human Health Effects. Atmosphere. 2016, 7, 158. [Google Scholar] [CrossRef] [Green Version]
  7. Darvishi Boloorani, A.; Ranjbareslamloo, S.; Mirzaie, S.; Bahrami, H.A.; Mirzapour, F.; Tehrani, N.A. Spectral behavior of Persian oak under compound stress of water deficit and dust storm. Int. J. Appl. Earth Obs. Geoinf. 2020, 88, 102082. [Google Scholar] [CrossRef]
  8. Middleton, N.J. Desert dust hazards: A global review. Aeolian Res. 2017, 24, 53–63. [Google Scholar] [CrossRef]
  9. Kalderon-Asael, B.; Erel, Y.; Sandler, A.; Dayan, U. Mineralogical and chemical characterization of suspended atmospheric particles over the east Mediterranean based on synoptic-scale circulation patterns. Atmospheric Environ. 2009, 43, 3963–3970. [Google Scholar] [CrossRef]
  10. Prospero, J.M.; Ginoux, P.; Torres, O.; Nicholson, S.E.; Gill, T.E. Environmental characterization of global sources of atmospheric soil dust identified with the Nimbus 7 Total Ozone Mapping Spectrometer (TOMS) absorbing aerosol product. Rev. Geophys. 2002, 40, 2-1–2-31. [Google Scholar] [CrossRef]
  11. Melville, C. Meteorological hazards and disasters in Iran: A preliminary survey to 1950. Iran 1984, 22, 113–150. Available online: https://www.tandfonline.com/doi/citedby/10.1080/05786967.1984.11834302?scroll=top&needAccess=true (accessed on 15 April 2022). [CrossRef]
  12. Mesgaran, M.B.; Madani, K.; Hashemi, H.; Azadi, P. Iran’s land suitability for agriculture. Sci. Rep. 2017, 7, 1–12. [Google Scholar] [CrossRef] [Green Version]
  13. Dameneh, H.E.; Gholami, H.; Telfer, M.W.; Comino, J.R.; Collins, A.L.; Jansen, J.D. Desertification of Iran in the early twenty-first century: Assessment using climate and vegetation indices. Sci. Rep. 2021, 11, 1–18. [Google Scholar]
  14. Darvishi Boloorani, A.; Najafi, M.S.; Soleimani, M.; Papi, R.; Torabi, O. Influence of Hamoun Lakes’ dry conditions on dust emission and radiative forcing over Sistan plain, Iran. Atmos. Res. 2022, 272, 106152. [Google Scholar] [CrossRef]
  15. Rashki, A.; Middleton, N.J.; Goudie, A.S. Dust storms in Iran–Distribution, causes, frequencies and impacts. Aeolian Res. 2021, 48, 100655. [Google Scholar] [CrossRef]
  16. Papi, R.; Kakroodi, A.; Soleimani, M.; Karami, L.; Amiri, F.; Alavipanah, S.K. Identifying sand and dust storm sources using spatial-temporal analysis of remote sensing data in Central Iran. Ecol. Inform. 2022, 70, 101724. [Google Scholar] [CrossRef]
  17. Hamzeh, N.H.; Kaskaoutis, D.G.; Rashki, A.; Mohammadpour, K. Long-Term Variability of Dust Events in Southwestern Iran and Its Relationship with the Drought. Atmosphere 2021, 12, 1350. [Google Scholar] [CrossRef]
  18. Al-Dousari, A.; Omar, A.; Al-Hemoud, A.; Aba, A.; Alrashedi, M.; Alrawi, M.; Rashki, A.; Petrov, P.; Ahmed, M.; Al-Dousari, N.; et al. A Success Story in Controlling Sand and Dust Storms Hotspots in the Middle East. Atmosphere 2022, 13, 1335. [Google Scholar] [CrossRef]
  19. Cao, H.; Liu, J.; Wang, G.; Yang, G.; Luo, L. Identification of sand and dust storm source areas in Iran. J. Arid. Land. 2015, 7, 567–578. [Google Scholar] [CrossRef]
  20. Alijani, B. Iran’s Weather; Payame Noor University Publishers: Tehran, Persian, 1997. [Google Scholar]
  21. Vaghefi, S.A.; Keykhai, M.; Jahanbakhshi, F.; Sheikholeslami, J.; Ahmadi, A.; Yang, H.; Abbaspour, K.C. The future of extreme climate in Iran. Sci. Rep. 2019, 9, 1–11. [Google Scholar] [CrossRef] [Green Version]
  22. Madani, K.; AghaKouchak, A.; Mirchi, A. Iran’s Socio-economic Drought: Challenges of a Water-Bankrupt Nation. Iran. Stud. 2016, 49, 997–1016. [Google Scholar] [CrossRef]
  23. Nazari, B.; Liaghat, A.; Akbari, M.R.; Keshavarz, M. Irrigation water management in Iran: Implications for water use efficiency improvement. Agric. Water Manag. 2018, 208, 7–18. [Google Scholar] [CrossRef]
  24. Mostafavi-Dehzooei, M.H.; Asadi, G. The effects of precipitation shocks on rural labor markets and migration. Agric. Appl. Econ. 2019. [Google Scholar] [CrossRef]
  25. Statistical Centre of Iran. 2016. Available online: www.amar.org.ir/english (accessed on 8 March 2022).
  26. Bigdeli Rad, V.; Maleki, S. Identification of Effective Criteria on Social and Economic Sustainability in Rural Areas of Iran. Hum. Geogr. Res. 2020, 52, 147–163. [Google Scholar]
  27. Kc, B.; Shepherd, J.M.; Gaither, C.J. Climate change vulnerability assessment in Georgia. Appl. Geogr. 2015, 62, 62–74. [Google Scholar] [CrossRef]
  28. Shi, Z.; Shao, L.; Jones, T.P.; Lu, S. Microscopy and mineralogy of airborne particles collected during severe dust storm episodes in Beijing, China. J. Geophys. Res. Atmos. 2005, 110. [Google Scholar] [CrossRef] [Green Version]
  29. Khaledi, K. Estimating the Economic Losses of Dust Storms on Agriculture Sector in the Western Provinces of the Iran. Agric. Econ. Dev. 2017, 24, 151–183. Available online: http://aead.agri-peri.ac.ir/article_59057.html (accessed on 20 March 2022).
  30. Maleki, T.; Sahraie, M.; Sasani, F.; Shahmoradi, M. Impact of Dust Storm on Agricultural Production in Iran. Int. J. Agric. Sci. Res. Technol. Ext. Educ. Syst. 2017, 7, 19–26. [Google Scholar]
  31. Birkmann, J.; Welle, T. The WorldRiskIndex 2016: Reveals the Necessity for Regional Cooperation in Vulnerability Reduction. J. Extreme Events 2016, 3, 1650005. [Google Scholar] [CrossRef] [Green Version]
  32. Jamshed, A.; Rana, I.A.; Birkmann, J.; Nadeem, O. Changes in Vulnerability and Response Capacities of Rural Communities After Extreme Events: Case of Major Floods of 2010 and 2014 in Pakistan. J. Extreme Events 2017, 4, 1750013. [Google Scholar] [CrossRef]
  33. Xu, X.; Wang, L.; Sun, M.; Fu, C.; Bai, Y.; Li, C.; Zhang, L. Climate change vulnerability assessment for smallholder farmers in China: An extended framework. J. Environ. Manag. 2020, 276, 111315. [Google Scholar] [CrossRef]
  34. Jamshidi, O.; Asadi, A.; Kalantari, K.; Azadi, H.; Scheffran, J. Vulnerability to climate change of smallholder farmers in the Hamadan province, Iran. Clim. Risk Manag. 2018, 23, 146–159. [Google Scholar] [CrossRef]
  35. Murthy, C.S.; Laxman, B.; Sai, M.V.R.S. Geospatial analysis of agricultural drought vulnerability using a composite index based on exposure, sensitivity and adaptive capacity. Int. J. Disaster Risk Reduct. 2015, 12, 163–171. [Google Scholar] [CrossRef]
  36. Cutter, S.L.; Finch, C. Temporal and spatial changes in social vulnerability to natural hazards. Proc. Natl. Acad. Sci. USA 2008, 105, 2301–2306. [Google Scholar] [CrossRef]
  37. Crane, T.A.; Delaney, A.; Tamás, P.A.; Chesterman, S.; Ericksen, P. A systematic review of local vulnerability to climate change in developing country agriculture. WIREs Clim. Chang. 2017, 8. [Google Scholar] [CrossRef]
  38. Gupta, A.K.; Negi, M.; Nandy, S.; Alatalo, J.M.; Singh, V.; Pandey, R. Assessing the vulnerability of socio-environmental systems to climate change along an altitude gradient in the Indian Himalayas. Ecol. Indic. 2019, 106. [Google Scholar] [CrossRef]
  39. Soares, M.B.; Gagnon, A.S.; Doherty, R.M. Conceptual elements of climate change vulnerability assessments: A review. Int. J. Clim. Chang. Strat. Manag. 2012, 4, 6–35. [Google Scholar] [CrossRef]
  40. Hinkel, J. Indicators of vulnerability and adaptive capacity’: Towards a clarification of the science–policy interface. Glob. Environ. Chang. 2011, 21, 198–208. [Google Scholar] [CrossRef]
  41. Rød, J.K.; Berthling, I.; Lein, H.; Lujala, P.; Vatne, G.; Bye, L.M. Integrated vulnerability mapping for wards in Mid-Norway. Local Environ. 2012, 17, 695–716. [Google Scholar] [CrossRef]
  42. Reed, M.S.; Podestá, G.; Fazey, I.; Geeson, N.; Hessel, R.; Hubacek, K.; Letson, D.; Nainggolan, D.; Prell, C.; Rickenbach, M.G.; et al. Combining analytical frameworks to assess livelihood vulnerability to climate change and analyse adaptation options. Ecol. Econ. 2013, 94, 66–77. [Google Scholar] [CrossRef] [Green Version]
  43. Wiréhn, L.; Danielsson, Å.; Neset, T.-S.S. Assessment of composite index methods for agricultural vulnerability to climate change. J. Environ. Manag. 2015, 156, 70–80. [Google Scholar] [CrossRef]
  44. Smith, E.F.; Keys, N.; Lieske, S.N.; Smith, T.F. Assessing Socio-Economic Vulnerability to Climate Change Impacts and Environmental Hazards in New South Wales and Queensland, Australia. Geogr. Res. 2015, 53, 451–465. [Google Scholar] [CrossRef] [Green Version]
  45. Edmonds, H.; Lovell, J.; Lovell, C. A new composite climate change vulnerability index. Ecol. Indic. 2020, 117, 106529. [Google Scholar] [CrossRef]
  46. Atampugre, G.; Nursey-Bray, M.; Adade, R. Using geospatial techniques to assess climate risks in savannah agroecological systems. Remote. Sens. Appl. Soc. Environ. 2019, 14, 100–107. [Google Scholar] [CrossRef]
  47. Sivakumar, V.L.; Krishnappa, R.R.; Nallanathel, M. Drought vulnerability assessment and mapping using Multi-Criteria decision making (MCDM) and application of Analytic Hierarchy process (AHP) for Namakkal District, Tamilnadu, India. Mater. Today Proc. 2020, 43, 1592–1599. [Google Scholar] [CrossRef]
  48. Rincón, D.; Khan, U.T.; Armenakis, C. Flood Risk Mapping Using GIS and Multi-Criteria Analysis: A Greater Toronto Area Case Study. Geosciences 2018, 8, 275. [Google Scholar] [CrossRef] [Green Version]
  49. Michael, E.A.; Samanta, S. Landslide vulnerability mapping (LVM) using weighted linear combination (WLC) model through remote sensing and GIS techniques. Model. Earth Syst. Environ. 2016, 2, 88. [Google Scholar] [CrossRef] [Green Version]
  50. Darvishi Boloorani, A.; Nadizadeh Shorabeh, S.; Neysani Samany, N.; Mousivand, A.; Kazemi, Y.; Jaafarzadeh, N.; Zahedi, A.; Rabiei, J. Vulnerability mapping and risk analysis of sand and dust storms in Ahvaz, IRAN. Environ. Pollut. 2021, 279, 116859. [Google Scholar] [CrossRef]
  51. Pachauri, R.K.; Reisinger, A. IPCC Fourth Assessment Report; IPCC: Geneva, Switzerland, 2007. [Google Scholar]
  52. Antwi-Agyei, P.; Fraser, E.D.G.; Dougill, A.J.; Stringer, L.C.; Simelton, E. Mapping the vulnerability of crop production to drought in Ghana using rainfall, yield and socioeconomic data. Appl. Geogr. 2012, 32, 324–334. [Google Scholar] [CrossRef]
  53. Adger, W.N.; Agnew, M. New Indicators of Vulnerability and Adaptive Capacity; Technical Report; Tyndall Centre for Climate Change Research: Norwich, UK, 2004; Volume 122. [Google Scholar]
  54. Ahumada-Cervantes, R.; Velázquez-Angulo, G.; Rodríguez-Gallegos, H.B.; Flores-Tavizón, E.; Félix-Gastélum, R.; Romero-González, J.; Granados-Olivas, A. An indicator tool for assessing local vulnerability to climate change in the Mexican agricultural sector. Mitig. Adapt. Strat. Glob. Chang. 2015, 22, 137–152. [Google Scholar] [CrossRef]
  55. El-Zein, A.; Tonmoy, F.N. Assessment of vulnerability to climate change using a multi-criteria outranking approach with application to heat stress in Sydney. Ecol. Indic. 2015, 48, 207–217. [Google Scholar] [CrossRef] [Green Version]
  56. Soleimani, M.; Argany, M.; Papi, R.; Amiri, F. Satellite aerosol optical depth prediction using data mining of climate parameters. Phys Geog Res. 2021, 53, 319–333. [Google Scholar] [CrossRef]
  57. Eshghizadeh, M. Determining the critical geographical directions of sand and dust storms in urban areas by remote sensing. Remote. Sens. Appl. Soc. Environ. 2021, 23, 100561. [Google Scholar] [CrossRef]
  58. Ghosh, M.; Ghosal, S. Climate change vulnerability of rural households in flood-prone areas of Himalayan foothills, West Bengal, India. Environ. Dev. Sustain. 2021, 23, 2570–2595. [Google Scholar] [CrossRef]
  59. Baum, S.; Horton, S.; Choy, D.L. Local urban communities and extreme weather events: Mapping social vulnerability to flood,” Australas. J. Reg. Stud. 2008, 14, 251–273. [Google Scholar]
  60. Maiti, S.; Jha, S.K.; Garai, S.; Nag, A.; Chakravarty, R.; Kadian, K.S.; Chandel, B.; Datta, K.K.; Upadhyay, R.C. Assessment of social vulnerability to climate change in the eastern coast of India. Clim. Chang. 2015, 131, 287–306. [Google Scholar] [CrossRef]
  61. Shukla, R.; Sachdeva, K.; Joshi, P. Inherent vulnerability of agricultural communities in Himalaya: A village-level hotspot analysis in the Uttarakhand state of India. Appl. Geogr. 2016, 74, 182–198. [Google Scholar] [CrossRef]
  62. Reardon, T.; Stamoulis, K.; Pingali, P. Rural nonfarm employment in developing countries in an era of globalization. Agric. Econ. 2007, 37, 173–183. [Google Scholar] [CrossRef]
  63. Arthurson, K.; Baum, S. Making space for social inclusion in conceptualising climate change vulnerability. Local Environ. 2013, 20, 1–17. [Google Scholar] [CrossRef]
  64. Choden, K.; Keenan, R.J.; Nitschke, C.R. An approach for assessing adaptive capacity to climate change in resource dependent communities in the Nikachu watershed, Bhutan. Ecol. Indic. 2020, 114, 106293. [Google Scholar] [CrossRef]
  65. Stafford, S.; Abramowitz, J. An analysis of methods for identifying social vulnerability to climate change and sea level rise: A case study of Hampton Roads, Virginia. Nat. Hazards 2016, 85, 1089–1117. [Google Scholar] [CrossRef]
  66. Peng, J.; Zhang, J. Urban flooding risk assessment based on GIS- game theory combination weight: A case study of Zhengzhou City. Int. J. Disaster Risk Reduct. 2022, 77. [Google Scholar] [CrossRef]
  67. Rezaei, J. Best-worst multi-criteria decision-making method. Omega 2015, 53, 49–57. [Google Scholar] [CrossRef]
  68. Saaty, T.L. The Analytical Hierarchy Process, Planning, Priority; RWS Publications: Pittsburgh, PA, USA, 1980. [Google Scholar]
  69. Jelokhani-Niaraki, M.; Hajiloo, F.; Samany, N.N. A Web-based Public Participation GIS for assessing the age-friendliness of cities: A case study in Tehran, Iran. Cities 2019, 95, 102471. [Google Scholar] [CrossRef]
  70. Boroushaki, S.; Malczewski, J. Using the fuzzy majority approach for GIS-based multicriteria group decision-making. Comput. Geosci. 2010, 36, 302–312. [Google Scholar] [CrossRef]
  71. Saisana, M.; Tarantola, S. State-of-the-Art Report on Current Methodologies and Practices for Composite Indicator Development; European Commission, Joint Research Centre, Institute for the Protection and the Security of the Citizen, Technological and Economic Risk Management Unit: Ispra, Italy, 2002; Volume 214, pp. 4–15. [Google Scholar]
  72. Wickramasinghe, M.R.C.P.; De Silva, R.P.; Dayawansa, N.D.K. Climate Change Vulnerability in Agriculture Sector: An Assessment and Mapping at Divisional Secretariat Level in Sri Lanka. Earth Syst. Environ. 2021, 5, 725–738. [Google Scholar] [CrossRef]
  73. Darvishi Boloorani, A.; Kazemi, Y.; Sadeghi, A.; Shorabeh, S.N.; Argany, M. Identification of dust sources using long term satellite and climatic data: A case study of Tigris and Euphrates basin. Atmospheric Environ. 2020, 224, 117299. [Google Scholar] [CrossRef]
  74. Wang, Y.; Li, Z.; Tang, Z.; Zeng, G. A GIS-based spatial multi-criteria approach for flood risk assessment in the Dongting Lake Region, Hunan, Central China. Water Resour. Manag. 2011, 25, 3465–3484. [Google Scholar] [CrossRef]
  75. Malczewski, J. On the Use of Weighted Linear Combination Method in GIS: Common and Best Practice Approaches. Trans. GIS 2000, 4, 5–22. [Google Scholar] [CrossRef]
  76. Neisi, A. A survey on the human development index in the Provinces of Iran. Jundishapur J. Health Sci. 2010, 2, 55–62. [Google Scholar]
  77. Das, S.; Ghosh, A.; Hazra, S.; Ghosh, T.; de Campos, R.S.; Samanta, S. Linking IPCC AR4 & AR5 frameworks for assessing vulnerability and risk to climate change in the Indian Bengal Delta. Prog. Disaster Sci. 2020, 7, 100110. [Google Scholar] [CrossRef]
  78. Fariza, A.; Rusydi, I.; Hasim, J.A.N.; Basofi, A. Spatial flood risk mapping in east Java, Indonesia, using analytic hierarchy process—Natural breaks classification. In Proceedings of the 2017 2nd International Conferences on Information Technology, Information Systems and Electrical Engineering (ICITISEE), Yogyakarta, Indonesia, 1–2 November 2017; pp. 406–411. [Google Scholar] [CrossRef]
  79. Samadi, M.; Darvishi Boloorani, A.; Alavipanah, S.K.; Mohamadi, H.; Najafi, M.S. Global dust Detection Index (GDDI); a new remotely sensed methodology for dust storms detection. J. Environ. Health Sci. Eng. 2014, 12, 20. [Google Scholar] [CrossRef] [PubMed] [Green Version]
  80. Papi, R.; Attarchi, S.; Darvishi Boloorani, A.; Neysani Samany, N. Characterization of Hydrologic Sand and Dust Storm Sources in the Middle East. Sustainability 2022, 14, 15352. [Google Scholar] [CrossRef]
  81. Middleton, N.; Kang, U. Sand and Dust Storms: Impact Mitigation. Sustainability 2017, 9, 1053. [Google Scholar] [CrossRef] [Green Version]
  82. Darvishi Boloorani, A.; Marghmaleki, S.N.; Soleimani, M.; Papi, R.; Kardan Moghaddam, H.; Neysani Samany, N. Development of a scenario-based approach using game theory for the restoration of Hawizeh Marsh and dust mitigation. Hydrol. Sci. J. 2022, 131–147. [Google Scholar] [CrossRef]
Figure 1. Methodology developed to assess the vulnerability of rural areas to sand and dust storms.
Atmosphere 14 00281 g001
Figure 2. Iran county map (a number of 429) and SDS-affected areas determined using the proposed threshold by [16], i.e., average MODIS AOD > 0.19 from 2000 to 2022.
Atmosphere 14 00281 g002
Figure 3. Normalized indicators of exposure, sensitivity, and adaptive capacity components for rural vulnerability assessment to sand and dust storm. See Table 1 for acronyms.
Atmosphere 14 00281 g003
Figure 4. Components of sand and dust storm vulnerability assessment.
Atmosphere 14 00281 g004
Figure 5. Iran’s rural vulnerability to sand and dust storms.
Atmosphere 14 00281 g005
Figure 6. Percentage of villages, households, and rural population affected by different levels of SDS vulnerability in Iran.
Atmosphere 14 00281 g006
Figure 7. Provincial SDS vulnerability map for rural areas of Iran.
Atmosphere 14 00281 g007
Figure 8. Sensitivity of the areas in the very high level of SDS vulnerability map to the changes in the indicator weights. The average changes in the area of each component’s indicators are presented in the diagram.
Atmosphere 14 00281 g008
Disclaimer/Publisher’s Note: The statements, opinions and data contained in all publications are solely those of the individual author(s) and contributor(s) and not of MDPI and/or the editor(s). MDPI and/or the editor(s) disclaim responsibility for any injury to people or property resulting from any ideas, methods, instructions or products referred to in the content.

