Abstract
Based on the air quality monitoring data and meteorological data, the pollution characteristics of PM2.5 in southern Beijing and relationships between PM2.5 levels and meteorological features were analyzed. The results showed that during the investigation period, daily air quality was characterized as “excellent” and “favorable” (<75 µg m−3) on 77% of days in southern Beijing, and there were only two days with serious air pollution (>250 µg m−3). The PM2.5 concentration displayed obvious monthly variations with the highest concentration in November and the lowest concentration in August. When PM2.5 pollution episodes occurred (>75 µg m−3) in this area, the wind direction was often south and southeast with low wind speed (<3 m∙s−1), followed by southwest wind; in addition, the air temperature was low (<10 °C) and the relative humidity was high (>75%). The air quality of the study area was affected by the pollution transmission form the surrounding areas, especially the southeastern and the southern transmission paths. The PM2.5 concentration was positively correlated with SO2, NO2 and CO, and negatively correlated with O3. Therefore, to further improve the air quality in the study area, it is necessary to coordinate the control of PM2.5 and O3.
1. Introduction
Due to rapid economic growth, industrialization and urbanization, the air pollution problem in Beijing has seriously affected the normal work and life of people [1]. The particulate matter with an aerodynamic diameter of 2.5 µm or smaller (PM2.5), which is characterized by small particle size and long transmission distance, large influence range and remarkable remote transportation features under the action of atmospheric circulation, has become an important reason for frequent heavy pollution in large cities in China [2]. Significant research has been conducted on the PM2.5 pollution characteristics and the causes of heavy air pollution events in Beijing. The pollution level of PM2.5 in Beijing is autumn > winter > spring > summer, and heavy pollution events mainly occur in autumn and winter [3]. The seasonal variation of atmospheric diffusion capacity was considered as the dominant factor affecting the seasonal variation of PM2.5 [4]. Low pressure gradient, high humidity, low wind speed at the surface, low boundary layer, and special terrain surrounded by mountains on three sides are the important reasons for the frequent occurrence of severer pollution episodes in autumn and winter [5]. The simulation results indicated that in Beijing municipality area, the relative contribution of local emission to PM2.5 reached 81.4% and served as a major source of PM2.5 [6]. Since PM2.5 has adverse effects on human health, researchers have analyzed thoroughly the correlation of PM2.5 concentration in indoor and outdoor environment in the houses. The results showed that the higher outdoor concentration of PM2.5 becomes a dominant factor ainfluencing the indoor PM2.5 concentration under conditions of insignificant indoor pollution source [7].
After the implementation of the action plan of air pollution prevention and control in China, PM2.5 concentrations showed a sharply downward trend nationwide, and the highest drop was observed in Beijing–Tianjin–Hebei region from 2015 to 2018 [8]; especially Beijing experienced dramatic improvement in air quality in recent years [9]. However, the air quality of Beijing remains concerning, with the occasional outbreaks of severe hazes [10]. PM2.5 pollution in Beijing illustrated a distinct spatial distribution pattern, increasing from north to south [11]. The Beijing ambient air quality bulletin also shows that the PM2.5 concentration in southern Beijing is still relatively high. The meteorological variation has a considerable contribution to the air quality in the Beijing–Tianjin–Hebei region [10]. The transport of air pollutants from neighboring provinces and adverse local meteorological conditions could aggravate atmospheric pollution in southern Beijing. Currently, the variation characteristics of PM2.5 and associations with meteorological features in southern Beijing is unclear, and specific investigation and analysis in this region is of great significance and needs to be performed. Therefore, to fill this gap, this study examined the temporal variation of PM2.5 based on real-time monitoring data collected at nine sites across Zhangziying Town in Daxing District of Beijing for the period from October 2018 to September 2019, and analyzed the relationship between meteorological conditions and PM2.5 pollution, with the aim of providing scientific support for rational control of air pollution in the study area.
2. Materials and Methods
2.1. Study Area
Given the relatively high PM2.5 concentration in southern Beijing such as in Daxing District, Zhangziying Town (116°33′7.2″~116°38′56.4″ E, 39°37′1.2″~39°43′37.2″ N) in Daxing District located in southern Beijing was selected as the investigation area. It borders Hebei Province to the south (Figure 1a). The annual average temperature is 11.6 °C, the annual average precipitation is 400 mm, and the average altitude is 38 m.
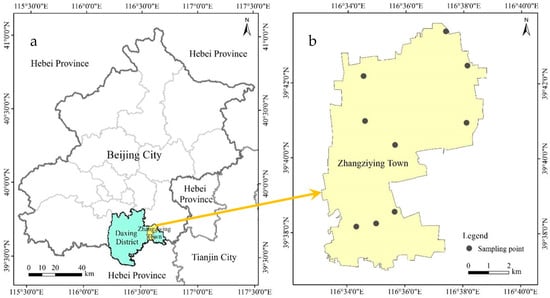
Figure 1.
(a) The study area and (b) air quality monitoring site distribution in Zhangziying town (Daxing district of Beijing, China). The solid points indicate the location of air quality monitoring sites.
2.2. Data Sources
To further identify the sources and key impact factors of PM2.5 in south Beijing, 9 ambient air quality monitoring sites were established in Zhangziying Town in Daxing District of Beijing (Figure 1b). The background environment of these monitoring sites included farmland, road, forest, garden, village, country marketplace and office building array. Information on the mass concentration of air pollutants, including PM2.5, SO2, NO2, CO and O3 from October 2018 to September 2019 (a total of 365 days), was obtained from these monitoring sites. The meteorological data, including air temperature, relative humidity, wind direction, wind speed, and so on, came from Beijing Daxing Station (39.72° N, 116.35° E) of the national ground meteorological observation stations.
2.3. Data Analysis
All data were presented as the mean value of 9 monitoring sites. The difference between monthly PM2.5 was tested by Duncan’s multiple range test (p < 0.05), and data analysis and presentation were carried out using OriginPro 2021 software (Northampton, MA, USA).
3. Results and Discussion
3.1. Characteristics of PM2.5 in Southern Beijing
According to the previous study, there are six grades for 24 h average concentrations of PM2.5: (1) excellent (<35 µg∙m−3), (2) favorable (35–75 µg∙m−3), (3) lightly polluted (75–115 µg∙m−3), (4) moderately polluted (115–150 µg∙m−3), (5) heavily polluted (150–250 µg∙m−3), and (6) ultra-seriously polluted (>250 µg∙m−3) [12]. In addition, according to the annual mean limit of European Union, the grade level below 25 µg∙m−3 was also included in the analysis. Based on the monitoring data of the atmospheric environmental quality monitoring sites in Zhangziying Town in Daxing District of Beijing from October 2018 to September 2019, the number of days characterized as “excellent”, “favorable”, “lightly polluted”, “moderately polluted”, “heavily polluted”, and “ultra-seriously polluted” was 142, 138, 45, 19, 19, and 2, respectively (Figure 2a). The respective proportion to the total observed days was 38.9%, 37.8%, 12.3%, 5.2%, 5.2% and 0.5% (Figure 2b). The number of cumulative days below 25 µg∙m−3 was 101, accounting for 27.7% of the total investigation time. Overall, 77% of days were classified as excellent and favorable, although 0.5% of days were considered as ultra-seriously polluted, indicating the poor air quality in Southern Beijing during the study period.
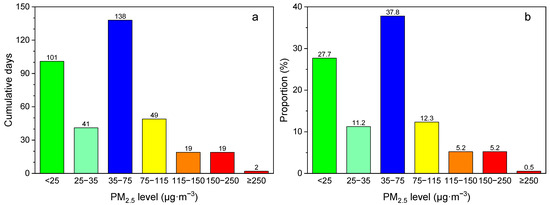
Figure 2.
(a) Cumulative days and (b) its proportion to the total observed days for different levels of PM2.5 from October 2018 to September 2019. Different colors represent different PM2.5 levels.
In terms of monthly PM2.5 concentrations, there was significant difference in monthly PM2.5 concentration over the investigation period, and the concentration of PM2.5 was markedly higher in winter and spring compared to summer and autumn (Figure 3). The light and above pollution weather (≥75 µg∙m−3) mainly occurred from October 2018 to March 2019 (six months in total), and 12.9–30.0% of days when moderately polluted standards were exceeded, depending on month (Figure 4). Among the six months, the proportion of moderate or above polluted days was higher in November, January and February, accounting for more than 25% of respective months. Two ultra-seriously polluted episodes occurred in November and January. The maximum number of cumulative days below 25 µg∙m−3 was in August, and the minimum was in November. The characteristics of PM2.5 also showed a certain trend with respect to monthly distribution. The result was consistent with that of Wang et al. [13]. In winter, static and steady weather conditions with less precipitation were favorable for the PM formation, thus leading to the high occurrence frequency of heavy pollution episodes [5,14]; at the same time, coal-fired heating in winter increased pollutant emissions, resulting in higher PM2.5 concentration in this period than that in other seasons. Under the influence of the summer monsoon, there were fast wind speed, deep vertical convection, and frequent precipitation, which were beneficial for aerosol diffusion and deposition; thus, the PM2.5 concentration was low [4].
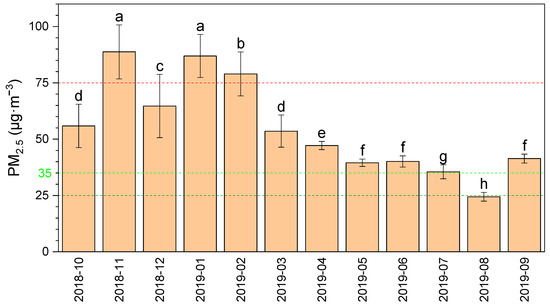
Figure 3.
The levels of monthly PM2.5 from October 2018 to September 2019. Light green and red lines represent daily limits corresponding to classifications of “excellent” and “polluted” days, dark green represents the annual mean limit of European Union. Different letters indicate significant differences between different months according to Duncan’s test (p < 0.05).
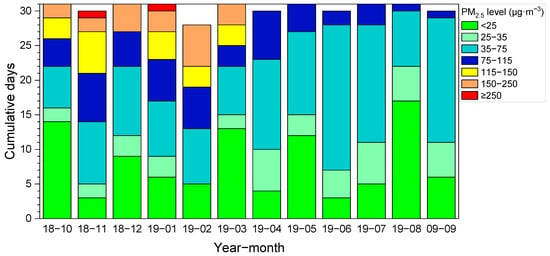
Figure 4.
Cumulative days for different levels of PM2.5 in each month from October 2018 to September 2019.
3.2. Correlation between PM2.5 Concentration and Other Pollutants
There was a significant positive correlation between SO2, NO2, CO and PM2.5 concentrations, with the significance of SO2 < NO2 < CO (Figure 5a–c). SO2, NO2 and CO contributed a lot to PM2.5 pollution, indicating the importance and urgency of controlling these pollutants in the study area. The concentration of NO2 had a great relationship with sunshine. Because of the strong sunshine, high temperature and strong photochemical reaction in the atmosphere in summer, NO2 under sun radiation produced secondary pollutants such as ozone and nitrate, and the consumption of nitrogen oxides increased, which may be one of the reasons for low PM2.5 concentration in summer [15]. SO2 and CO mainly come from the combustion of chemical fuels and automobile exhaust emissions. The coal-to-electricity project has been implemented in Beijing for many years, and the plain area has basically achieved no consumption of coal. The air quality of Zhangziying town was unaffected by local loose coal burning in winter heating season. It can be seen that the surrounding areas with coal as the main energy structure had great influence on the air quality in the study area. In China, considerable effort has been made to control air pollution resulting from coal consumption, and significant results have been achieved in centralized coal management. But scattered coal with characteristics of widespread use and difficulty in monitoring and supervision has gradually become a more prominent factor in China’s air pollution [16]. Therefore, stronger policy measures on the scattered coal management are urgently required for improving air quality. In addition, attention should also be paid to the impact of motor vehicle emissions. Therefore, besides controlling primary particulate emissions, reducing the concentration of precursors of PM2.5, such as SO2, NO2 and CO, can effectively improve the air quality in southern Beijing [13]. There was a significant negative correlation between O3 and PM2.5 (Figure 5d). Zhang et al. also reported that the concentration of these two pollutants showed an alternating peak-and-valley phenomenon [17]. Tropospheric O3 over Beijing showed a winter minimum and a broad summer maximum with a clear positive trend in the maximum summer O3 concentration [18]. A previous study has suggested that, in southern Beijing, the increase in tropospheric O3 in warm seasons was likely associated with biomass burning activities, as well as transport O3 and its precursors [19]. O3 was the product of photochemical reaction in the atmosphere, and the high temperature and strong radiation in summer favored the increase in O3 concentration. In addition, thunderbolt activity may be responsible for the increase in O3 concentration, while the photochemical reaction rate of O3 was low due to the low air temperature and weak radiation in winter. Light absorption by atmospheric particulates was enhanced with increasing PM2.5 concentrations; solar radiation, especially ultraviolet radiation, decreased. Consequently, O3 formation quenched via photolysis rate reduction, and this photochemical process likely explained the negative correlations between PM2.5 and O3 to some extent [20,21]. On the other hand, O3 in the air was diluted by cold waves and strong winds in winter [15]. With the improving PM2.5 air quality, O3 became the top issue of air pollution control in Beijing region. Therefore, to further improve the air quality in the study area, it is necessary to coordinate the control of PM2.5 and O3.
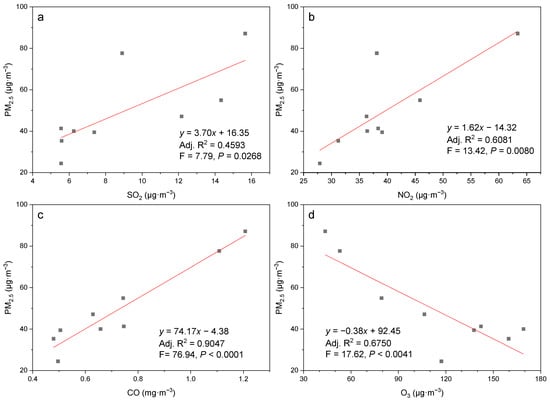
Figure 5.
The correlation between PM2.5 and (a) SO2, (b) NO2, (c) CO, (d) O3. Black squares represent the annual mean values of each monitoring site.
3.3. Effects of Meteorological Parameters on PM2.5 in Southern Beijing
3.3.1. Effects of Wind Direction and Wind Speed on PM2.5
During the period from October 2018 to September 2019 (365 days), the number of days when the wind direction was 100°–250° was 321 in Zhangziying Town, accounting for 88% of the total days. The number of days when the wind direction was below 100° or above 250° was only 44, accounting for 12%; in these wind directions, the air quality can reach favorable or excellent levels (Figure 6). There were high concentrations of PM2.5 (>75 µg∙m−3) in the southeast, south and southwest wind directions (90° < wind direction < 248°). The wind directions in two ultra-seriously polluted events were south and southeast wind, respectively (Figure 6 and Figure 7a). These results indicated that the northerly wind was relatively clear, can dilute and disperse the pollutants in the Beijing area, but the southerly winds played the opposite role [22]. Former studies have also shown that the dominant wind direction in the increasing process of PM2.5 concentration in Beijing area is south and southeast, and Hebei Province and Shandong Province are the important sources of PM2.5 in Beijing [23,24].
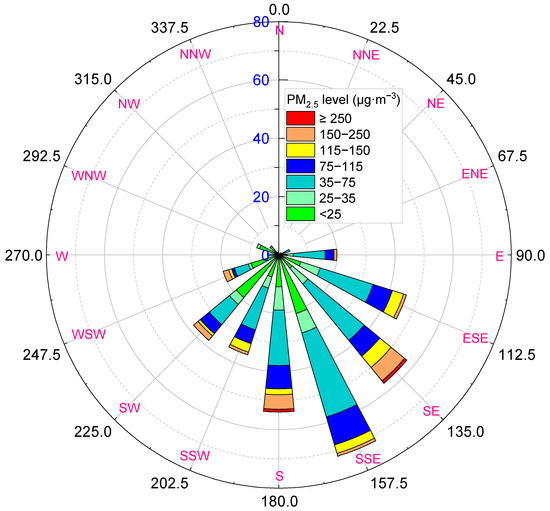
Figure 6.
Effects of wind direction on cumulative days for different levels of PM2.5 from October 2018 to September 2019. E, N, S and W represent East, North, South and West, respectively.
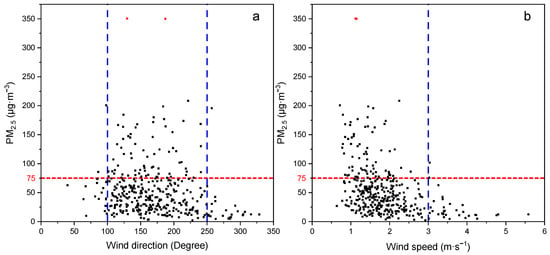
Figure 7.
Effects of (a) wind direction and (b) wind speed on PM2.5 concentration (n = 365).
The PM2.5 pollution event in this study usually occurred from October 2018 to March 2019. From the daily average wind speed and PM2.5 concentration in these six months, it can be seen that PM2.5 pollution episodes occurred at wind speeds below 1.5 m∙s−1, and the air quality was excellent at wind speeds exceeding 2 m∙s−1, (Figure 8). From the daily average wind speed and PM2.5 concentration in the 12 months from October 2018 to September 2019, it can be shown that PM2.5 pollution events occurred at wind speeds below 3 m∙s−1, and wind speeds in two ultra-seriously polluted events were about 1 m∙s−1; the air quality was favorable or excellent at wind speeds exceeding 3 m∙s−1 (Figure 7b). The meteorological data from October 2018 to September 2019 showed that the study area had high frequency of light wind, reaching 91% of total days; there were only 33 days with wind speed exceeding 3 m∙s−1. Many studies showed that there was a negative correlation between wind speed and PM2.5 [24,25,26]. However, the wind speed had a complex effect on PM2.5 concentration, and dust storms caused by strong wind can also cause the increase in PM2.5 concentration, especially in spring [27]. This may also be one of the main reasons for the high PM2.5 concentration in spring in southern Beijing.
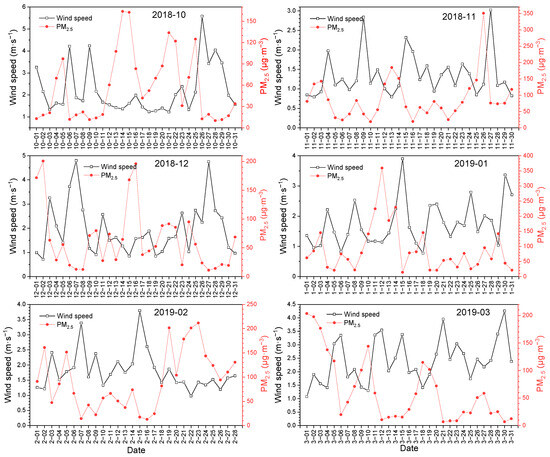
Figure 8.
Association between the PM2.5 concentration and wind speed 1 d interval during PM2.5 pollution periods (from October 2018 to March 2019).
3.3.2. Effects of Air Temperature and Relative Humidity on PM2.5
Temperature and relative humidity also had an obvious influence on PM2.5 concentration. In most cases, PM2.5 concentration was higher than 75 µg∙m−3 under the condition of low temperature (<15 °C); the two ultra-seriously pollution (red points) during the investigation period occurred at temperatures below 5 °C (Figure 9a). A study performed for Alaska, USA also revealed that higher PM2.5 concentrations were related to lower temperatures, typically occurring at temperatures below 20 °C [28]. During the winter, cold temperatures combined with calm winds formed an inversion layer keeping the boundary layer low and inhibiting surface mixing, which easily caused the accumulation of air pollutants [29]. In addition, the increase in PM2.5 concentration at low temperature may also reflect the contribution of emissions from coal consumption for heating in winter [12]. The low PM2.5 concentrations (<75 µg∙m−3) were typically found at low relative humidity (<25%), and the relative humidity on two ultra-seriously polluted days reached 75% (Figure 9b). Water was a significant component of atmospheric aerosols, and its contribution to the formation of PM2.5 increased strongly with relative humidity above 70% [30]. In addition, most ionic species such as sodium chloride, sulfates, and nitrates were hygroscopic, and the high relative humidity was beneficial for the aggregation of these water-soluble ions and finally formed a bigger particulate matter [31]. The high relative humidity can promote the formation of secondary particle matters, and PM2.5 levels tended to increase with relative humidity, indicating that formation of secondary particle matter had important contribution for air pollution occurrences in Beijing [12,25].
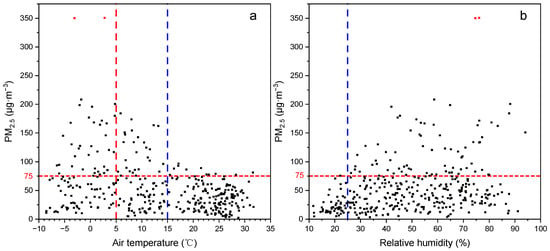
Figure 9.
Effects of (a) air temperature and (b) relative humidity on PM2.5 concentration (n = 365).
3.3.3. Effects of Atmospheric Pressure and Dew Point Temperature on PM2.5
The atmospheric pressure and dew point temperature also had significant effects on PM2.5 levels. For the vast majority of cases in this study, when PM2.5 pollution occurred, the air pressure ranged from 1005 to 1025 HPa (Figure 10a), and the dew point temperature ranged from −21 to 12 °C (Figure 10b). This indicated that such conditions can promote the generation of particle matter and thus cause the increase in PM2.5 levels [32]. Previous studies reported that air pressure had a delayed influence on PM2.5 concentration with a positive correlation, mainly due to the diffusion of inhalable particles [33,34]. However, as there is little difference in air pressure in the study area; the evidence for this result is insufficient and long-term research at large geographical scales is needed to better understand the effect of air pressure on PM2.5 concentration. Another study reported that dew point temperature showed a significant negative association with PM2.5 and was identified as a major meteorological parameter controlling the concentrations of ambient air particulate matter [35]. The dew point was highly correlated with air temperature in the cold season [36] and had a strong influence on PM2.5 in spring and winter, and the influence was close to air temperature [34].
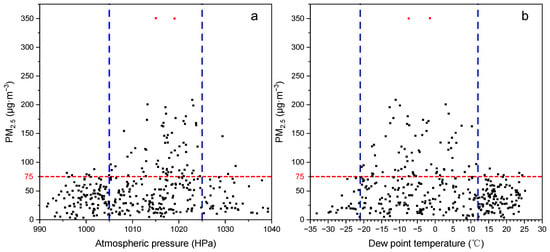
Figure 10.
Effects of (a) atmospheric pressure and (b) dew point temperature on PM2.5 concentration (n = 365).
Our study has some limitations. First, the current study was performed for a relatively short period of one year, and hence a long-term influence of meteorological parameters on PM2.5 needs to be further confirmed. Second, the occurrence of PM2.5 pollution episodes is affected by many different factors, but we only evaluated the effects of meteorological factors. Thus, a comprehensive estimation is needed to determine its major influencing factors and quantitatively apportion their contribution to air pollution.
4. Conclusions
Based on daily data collected over a 1-year period (October 2018 to September 2019), temporal variability of PM2.5 in southern Beijing was analyzed. The daily average concentrations ranged from 3 to 437 µg∙m−3. The days with favorable or excellent air quality (<75 µg∙m−3) accounted for 77% of the total observed days, and there were only two days with ultra-serious pollution in the study area. Monthly PM2.5 levels also exhibited considerable variation, ranging from 24 (August) to 89 (November) µg∙m−3. PM2.5 pollution usually occurred under the following meteorological conditions: southerly and easterly wind with low wind speed (<3 m∙s−1); high relative humidity (>75%) with low temperature (<15 °C); atmospheric pressure ranging from 1005 to 1025 HPa with the dew point temperature of −21 to 12 °C. The air quality in this area was affected by the pollution transmission in the surrounding areas, especially the southeastern and the southern transmission paths. Therefore, more ambitious policy measures on the scattered coal management in these neighboring areas would be urgently required for improving air quality.
Author Contributions
Conceptualization, Z.Y. and Q.W.; investigation, Z.Y., Q.W., X.Y. and C.X.; data curation, Q.W. and X.Y.; writing—original draft preparation, Z.Y. and X.Y.; writing—review and editing, Q.W; visualization, Z.Y. and Q.W. All authors have read and agreed to the published version of the manuscript.
Funding
This research received no external funding.
Institutional Review Board Statement
Not applicable.
Informed Consent Statement
Not applicable.
Data Availability Statement
Data is contained within the article. The data presented in this study are available in this article.
Conflicts of Interest
The authors declare no conflict of interest.
References
- Li, Y.; Wang, L. Grey relational difference analysis of PM2.5 drivers in Beijing-Tianjin-Hebei. China Dev. 2018, 18, 13–25. [Google Scholar]
- Shi, L.; Li, L.; Wang, X.; Jiang, L.; Zhang, L.; Qiu, Y.; Zhang, D. Analysis of characteristics of air pollution transmission in fall and winter by remote sensing in Beijing. Acta Sci. Circumstantiae 2018, 38, 3834–3845. [Google Scholar]
- Wang, H.; Gao, J.; Li, H.; Wang, H.; Li, Y.; Wang, S.; Chai, F. Variation of PM2.5 mass concentration in Beijing area during 2007–2014. Res. Environ. Sci. 2016, 29, 783–790. [Google Scholar]
- Guo, Y.; Quan, J.; Pan, Y.; Pu, W.; Feng, J.; Zhao, X.; Yuan, T. Multi-time scale variations of the PM2.5 in Beijing and its key mechanisms during 2008 to 2017. China Environ. Sci. 2022, 42, 1013–1021. [Google Scholar]
- Xu, R.; Zhang, H.; Yang, X.; Cheng, S.; Zhang, T.; Jiang, Q. Concentration characteristics of PM2.5 and the causes of heavy air pollution events in Beijing during Autumn and Winter. Environ. Sci. 2019, 40, 3405–3414. [Google Scholar]
- Liu, X.; Lang, J.; Cheng, S.; Wang, X.; Wang, G. Pollution characteristics and regional migration impact of PM2.5 in Beijing in winter season. J. Saf. Environ. 2017, 17, 1200–1205. [Google Scholar]
- Wang, Z.; Zhang, J.; Jin, C.; Zhang, Y.; Shao, T.; Zhang, H. The PM2.5 concentration in the indoor and outdoor air of residences during heavy pollution in Beijing. Sci. Technol. Eng. 2019, 19, 312–318. [Google Scholar]
- Zhao, H.; Chen, K.; Liu, Z.; Zhang, Y.; Shao, T.; Zhang, H. Coordinated control of PM2.5 and O3 is urgently needed in China after implementation of the “Air pollution prevention and control action plan”. Chemosphere 2021, 270, 129441. [Google Scholar] [CrossRef]
- Maji, K.J.; Li, V.O.; Lam, J.C. Effects of China’s current Air Pollution Prevention and Control Action Plan on air pollution patterns, health risks and mortalities in Beijing 2014–2018. Chemosphere 2020, 260, 127572. [Google Scholar] [CrossRef]
- Sun, J.; Gong, J.; Zhou, J.; Liu, J.; Liang, J. Analysis of PM2.5 pollution episodes in Beijing from 2014 to 2017: Classification, interannual variations and associations with meteorological features. Atmos. Environ. 2019, 213, 384–394. [Google Scholar] [CrossRef]
- Zhang, L.; An, J.; Liu, M.; Li, Z.; Liu, Y.; Tao, L.; Liu, X.; Zhang, F.; Zheng, D.; Gao, Q.; et al. Spatiotemporal variations and influencing factors of PM2.5 concentrations in Beijing, China. Environ. Pollut. 2020, 262, 114276. [Google Scholar] [CrossRef]
- Batterman, S.; Xu, L.; Chen, F.; Chen, F.; Zhong, X. Characteristics of PM2.5 concentrations across Beijing during 2013–2015. Atmos. Environ. 2016, 145, 104–114. [Google Scholar] [CrossRef]
- Wang, H.; Tian, M.; Li, X.; Chang, Q.; Cao, J.; Yang, F.; Ma, Y.; He, K. Chemical composition and light extinction contribution of PM2.5 in urban Beijing for a 1-year period. Aerosol. Air Qual. Res. 2015, 15, 2200–2211. [Google Scholar] [CrossRef]
- Wang, H.; Xu, J.; Zhang, M.; Yang, Y.; Shen, X.; Wang, Y.; Chen, D.; Guo, J. A study of the meteorological causes of a prolonged and severe haze episode in January 2013 over central-eastern China. Atmos. Environ. 2014, 98, 146–157. [Google Scholar] [CrossRef]
- Zhang, Z.; Li, Y.; Dai, G.; Wang, W.; Cheng, Y. Characteristics of concentrations of main air pollutants at Chaoyang District, Beijing. J. Meteorol. Environ. 2016, 32, 44–51. [Google Scholar]
- Xie, X.; Ai, H.; Deng, Z. Impacts of the scattered coal consumption on PM2.5 pollution in China. J. Clean. Prod. 2020, 245, 118922. [Google Scholar] [CrossRef]
- Zhang, Z.; Hu, M.; Shang, D.; Xiao, Y.; Hu, S.; Qiu, Y.; Xu, N.; Zong, T.; Zhao, G.; Tang, L.; et al. The evolution trend and typical process characteristics of atmospheric PM2.5 and O3 pollution in Beijing from 2013 to 2020. Chin. Sci. Bull. 2022, 67, 1995–2007. [Google Scholar] [CrossRef]
- Wang, Y.; Konopka, P.; Liu, Y.; Chen, H.; Müller, R.; Plöger, F.; Riese, M.; Cai, Z.; Lü, D. Tropospheric ozone trend over Beijing from 2002–2010: Ozonesonde measurements and modeling analysis. Atmos. Chem. Phys. 2012, 12, 8389–8399. [Google Scholar] [CrossRef]
- Zeng, Y.; Zhang, J.; Li, D.; Liao, Z.; Bian, J.; Bai, Z.; Shi, H.; Xuan, Y.; Yao, Z.; Chen, H. Vertical distribution of tropospheric ozone and its sources of precursors over Beijing: Results from ~20 years of ozonesonde measurements based on clustering analysis. Atmos. Res. 2023, 284, 106610. [Google Scholar] [CrossRef]
- Qin, M.; Hu, A.; Mao, J.; Li, X.; Sheng, L.; Sun, J.; Li, J.; Wang, X.; Zhang, Y.; Hu, J. PM2.5 and O3 relationships affected by the atmospheric oxidizing capacity in the Yangtze River Delta, China. Sci. Total Environ. 2022, 810, 152268. [Google Scholar] [CrossRef]
- Wang, Y.; Gao, W.; Wang, S.; Song, T.; Gong, Z.; Ji, D.; Wang, L.; Liu, Z.; Tang, G.; Huo, Y.; et al. Contrasting trends of PM2.5 and surface-ozone concentrations in China from 2013 to 2017. Natl. Sci. Rev. 2020, 7, 1331–1339. [Google Scholar] [CrossRef] [PubMed]
- Pu, W.; Zhao, X.; Zhang, X.; Ma, Z. Effect of Meteorological Factors on PM2.5 during July to September of Beijing. Procedia Earth Planet. Sci. 2011, 2, 272–277. [Google Scholar] [CrossRef]
- Sun, J.; Liang, M.; Shi, Z.; Shen, F.; Li, J.; Huang, L.; Ge, X.; Chen, Q.; Sun, Y.; Zhang, Y.; et al. Investigating the PM2.5 mass concentration growth processes during 2013–2016 in Beijing and Shanghai. Chemosphere 2019, 221, 452–463. [Google Scholar] [CrossRef]
- Zhang, H.; Wang, Y.; Hu, J.; Ying, Q.; Hu, X. Relationships between meteorological parameters and criteria air pollutants in three megacities in China. Environ. Res. 2015, 140, 242–254. [Google Scholar] [CrossRef]
- Zhang, Q.; Quan, J.; Tie, X.; Li, X.; Liu, Q.; Gao, Y.; Zhao, D. Effects of meteorology and secondary particle formation on visibility during heavy haze events in Beijing, China. Sci. Total Environ. 2015, 502, 578–584. [Google Scholar] [CrossRef] [PubMed]
- Trivedi, D.K.; Ali, K.; Beig, G. Impact of meteorological parameters on the development of fine and coarse particles over Delhi. Sci. Total Environ. 2014, 478, 175–183. [Google Scholar] [CrossRef]
- Yin, Q.; Wang, J.; Hu, M.; Wong, H. Estimation of daily PM2.5 concentration and its relationship with meteorological conditions in Beijing. J. Environ. Sci. 2016, 48, 161–168. [Google Scholar] [CrossRef]
- Tran, H.N.Q.; Mölders, N. Investigations on meteorological conditions for elevated PM2.5 in Fairbanks, Alaska. Atmos. Res. 2011, 99, 39–49. [Google Scholar] [CrossRef]
- Strawa, A.W.; Chatfield, R.B.; Legg, M.; Scarnato, B.; Esswein, R. Improving retrievals of regional fine particulate matter concentrations from Moderate Resolution Imaging Spectroradiometer (MODIS) and Ozone Monitoring Instrument (OMI) multisatellite observations. J. Air Waste Manag. 2013, 63, 1434–1446. [Google Scholar] [CrossRef]
- Mcmurry, P.H. A review of atmospheric aerosol measurements. Atmos. Environ. 2000, 34, 1959–1999. [Google Scholar] [CrossRef]
- Xia, D.; Jiang, B.; Xie, Y. Modeling and analysis of PM2.5 generation for key factors identification in China. Atmos. Environ. 2016, 134, 208–216. [Google Scholar] [CrossRef]
- Wang, Z.; Zhong, S.; He, H.; Peng, Z.; Cai, M. Fine-scale variations in PM2.5 and black carbon concentrations and corresponding influential factors at an urban road intersection. Build. Environ. 2018, 141, 215–225. [Google Scholar] [CrossRef]
- Huang, F.; Li, X.; Wang, C.; Xu, Q.; Wang, W.; Luo, Y.; Tao, L.; Gao, Q.; Guo, J.; Chen, S.; et al. PM2.5 spatiotemporal variations and the relationship with meteorological factors during 2013–2014 in Beijing, China. PLoS ONE 2015, 10, e141642. [Google Scholar] [CrossRef] [PubMed]
- Xu, J.; Liu, Z.; Yin, L.; Liu, Y.; Tian, J.; Gu, Y.; Zheng, W.; Yang, B.; Liu, S. Grey correlation analysis of haze impact factor PM2.5. Atmosphere 2021, 12, 1513. [Google Scholar] [CrossRef]
- Mukherjee, A.; Agrawal, M. Assessment of local and distant sources of urban PM2.5 in middle Indo-Gangetic plain of India using statistical modeling. Atmos. Res. 2018, 213, 275–287. [Google Scholar] [CrossRef]
- Sein, Z.M.M.; Ullah, I.; Iyakaremye, V.; Azam, K.; Ma, X.; Syed, S.; Zhi, X. Observed spatiotemporal changes in air temperature, dew point temperature and relative humidity over Myanmar during 2001–2019. Meteorol. Atmos. Phys. 2021, 134, 7. [Google Scholar] [CrossRef]
Disclaimer/Publisher’s Note: The statements, opinions and data contained in all publications are solely those of the individual author(s) and contributor(s) and not of MDPI and/or the editor(s). MDPI and/or the editor(s) disclaim responsibility for any injury to people or property resulting from any ideas, methods, instructions or products referred to in the content. |
© 2023 by the authors. Licensee MDPI, Basel, Switzerland. This article is an open access article distributed under the terms and conditions of the Creative Commons Attribution (CC BY) license (https://creativecommons.org/licenses/by/4.0/).