
Assessment of Radiological Risks due to Indoor Radon, Thoron and Progeny, and Soil Gas Radon in Thorium-Bearing Areas of the Centre and South Regions of Cameroon

 ,
,  , ,
, ,  ,
, 
Abstract
:1. Introduction
2. Materials and Methods
2.1. Study Areas
2.2. Radon in Soil Gas Measurements
2.3. Radon, Thoron and Thoron Progeny Measurements
2.4. Annual Effective Dose
2.5. Excess Lifetime Cancer Risk
2.6. Geogenic Radon Potential
2.7. Inhalation Dose from Outdoor Radon Concentration
2.8. Statistical Analysis
3. Results and Discussion
3.1. Indoor Radon, Thoron and Thoron Progeny Concentrations
3.2. Annual Effective Dose Assessment
3.3. Radon in Soil Gas Concentration, Geogenic Radon Potential and Annual Effective Dose
3.4. Indoor, Outdoor Gamma Exposure Rate and Corresponding External Effective Doses
3.5. Assessment of Excess Lifetime Cancer Risk
3.6. Radon Index
4. Conclusions
Author Contributions
Funding
Institutional Review Board Statement
Informed Consent Statement
Data Availability Statement
Acknowledgments
Conflicts of Interest
References
- Wei, B.L. Internal Dosimetry—A Review of Progress. Jpn. J. Health Phys. 2018, 53, 72–99. [Google Scholar]
- Beyala, A.J.F.; Owono, A.P.; Ben-Bolie, G.H.; Ekobena, F.H.; Ele, A.P.; Abega, C.R.; Mvondo, S. Determination of uranium in rocks and soils of South Cameroon by gamma-ray spectrometry. Radioisotopes 2011, 60, 399–408. [Google Scholar] [CrossRef]
- Bineng, G.S.; Saïdou; Tokonami, S.; Hosoda, M.; Tchuente, S.Y.F.; Issa, H.; Suzuki, T.; Kudo, H.; Bouba, O. The Importance of Direct Progeny Measurements for Correct Estimation of Effective Dose Due to Radon and Thoron. Front. Public Health 2020, 8, 17. [Google Scholar] [CrossRef]
- Saïdou; Modibo, O.B.; Joseph, E.N.N.I.; German, O.; Michaux, K.N.; Abba, H.Y. Indoor radon measurements using radon track detectors and electret ionization chambers in the bauxite-bearing areas of Southern Adamawa, Cameroon. Int. J. Environ. Res. Public Health 2020, 17, 6776. [Google Scholar] [CrossRef]
- UNSCEAR. Source and Effect of Ionizing Radiation. In The General Assembly with Scientific Annex; UNSCEAR, United Nations: New York, NY, USA, 2000. [Google Scholar]
- Akbar, A.; Merfat, A.; Omemh, B.; Hesham, M.H.Z. Windcatcher Ventilation Computation and Indoor 222Rn Concentration in Traditional Adobe Houses. Radiat. Prot. Dosim. 2021, 197, 175–182. [Google Scholar]
- NCRP (National Council on Radiation and Measurement). Uncertainties in Internal Radiation Dose Assessment; Report No. 164; NCRP: Bethesda, MD, USA, 2010. [Google Scholar]
- ICRP (International Commission on Radiological Protection). Age-dependent doses to members of the public from intake of radionuclides: Part 4. Inhalation dose coefficients. A report of a task group of Committee 2 of the International Commission on Radiological Protection. Ann ICRP 1995, 25, 1–405. [Google Scholar]
- World Health Organization. WHO Handbook on Indoor Radon, a Public Health Perspective; World Health Organization: Geneva, Switzerland, 2009.
- Issa, H.; Serge, A.B.M.; Saïdou. Dosimetry of inhaled 219Rn progeny. J. Radiat. 2021, 62, 226–235. [Google Scholar]
- Lara, E.; Rocha, Z.; Palmieri, H.E.L.; Santos, T.O.; Rios, F.J.; Oliveira, A.H. Radon concentration in soil gas and its correlations with pedologies, permeabilities and 226Ra content in the soil of the Metropolitan Region of Belo Horizonte—RMBH, Brazil. Radiat. Phys. Chem. 2015, 116, 317–320. [Google Scholar] [CrossRef]
- Markus 10. Measurements of Radon in Soil: Gamma Data Instrument User Guide; Gammadata: Uppsala, Sweden, 2020.
- Tokonami, S.; Takahashi, H.; Kobayashi, Y.; Zhuo, W.; Hulber, E. Up-to-date radon-thoron discriminative detector for a large-scale survey. Rev. Sci. Instrum. 2005, 76, 113505. [Google Scholar] [CrossRef]
- UNSCEAR. Lung Cancer from Exposure to Radon. In United Nations Scientific Committee on the Effects of Atomic Radiation Report; UNSCEAR Annex B; United Nations: New York, NY, USA, 2019. [Google Scholar]
- Adelikhah, M.E.; Shahrokhi, A.; Chalupnik, S.; Toth-Bodrogi, E.; Kovács, T. High level of natural ionizing radiation at a thermal bath in Dehloran, Iran. Heliyon 2020, 6, e04297. [Google Scholar] [CrossRef]
- Kudo, H.; Tokonami, S.; Omori, Y.; Ishikawa, T.; Iwaoka, K.; Sahoo, S.K.; Akata, N.; Hosoda, M.; Wanabongse, P.; Pornnumpa, C.; et al. Comparative dosimetry for radon and thoron in high background radiation areas in China. Radiat. Prot. Dosim. 2015, 167, 155–159. [Google Scholar] [CrossRef] [PubMed]
- Chen, J.; Tokonami, S.; Sorimachi, A.; Takahashi, H.; Falcomer, R. Preliminary results of simultaneous radon and thoron tests in Ottawa. Radiat. Prot. Dosimetry 2007, 130, 253–256. [Google Scholar] [CrossRef] [PubMed]
- Kranrod, C.; Tamakuma, Y.; Hosoda, M.; Tokonami, S. Importance of Discriminative Measurement for Radon Isotopes and Its Utilization in the Environment and Lessons Learned from Using the RADUET Monitor. Int. J. Environ. Res. Public Health 2020, 17, 4141. [Google Scholar] [CrossRef]
- ISO 16641; Measurement of Radioactivity in the Environment-Air-Radon 220: Integrated Measurement Methods for the Determination of the Average Activity Concentration Using Passive Solid-State Nuclear Track Detectors. ISO: Geneva, Switzerland, 2014.
- Zhuo, W.; Lidia, T. Estimation of thoron progeny concentration in dwellings with their deposition rate measurements. Jpn. J. Health Phys. 2000, 35, 365–370. [Google Scholar] [CrossRef]
- UNSCEAR. Vol. I: Exposures of the Public and Workers from Various Sources of Radiation. In United Nations Scientific Committee on the Effects of Atomic Radiation Report; UNSCEAR, United Nations: New York, NY, USA, 2008. [Google Scholar]
- Taskin, H.; Karavus, M.; Ay, P.; Topuzoglu, A.; Hidiroglu, S.; Karahan, G. Radionuclide concentrations in soil and lifetime cancer risk due to gamma radioactivity in Kirklareli, Turkey. J. Environ. Radioact. 2009, 100, 49–53. [Google Scholar] [CrossRef] [PubMed]
- Monica, S.; Visnu, P.A.K.; Soniya, S.R.; Jojo, P.J. Estimation of indoor and outdoor effective doses and lifetime cancer risk from gamma dose rates along the coastal regions of Kollam district, Kerala. Radiat. Prot. Environ. 2016, 39, 38–43. [Google Scholar]
- Andersen, C.E. Numerical modelling of radon-222 entry into houses: An outline of techniques and results. Sci. Total Environ. 1999, 19, 33–42. [Google Scholar] [CrossRef]
- Benavente, D.; Valdés-Abellán, J.; Pla, C.; Sanz-Rubio, E. Estimation of soil gas permeability for assessing radon risk using Rosetta pedotransfer function based on soil texture and water content. J. Environ. Radioact. 2019, 208, 105992. [Google Scholar] [CrossRef]
- Esan, D.T.; Sridhar, M.K.C.; Obed, R.; Ajiboye, Y.; Afolabi, O.; Olubodun, B.; Oni, O.M. Determination of residential soil gas radon risk indices over the lithological units of a southwestern Nigeria university. Sci. Rep. 2020, 10, 7368. [Google Scholar] [CrossRef]
- Neznal, M.; Neznal, M.; Matolín, M.; Barnrt, I.; Miksova, J. The New Method for Assessing the Radon Risk of Building Sites; Czech Geological Survey: Praga, Czech Republic, 2004. [Google Scholar]
- UNSCEAR. Sources and Effects of Ionizing Radiation. In United Nations Scientific Committee on the Effects of Atomic Radiation Report; UNSCEAR, United Nations: New York, NY, USA, 2019. [Google Scholar]
- EPA (US Environmental Protection Agency). EPA Map of Radon Zones (Report 402-R-93-071). Available online: http://www.epa.gov/radon/zonemap.html (accessed on 13 June 2014).
- Barnet, I.; Pacherová, P.; Neznal, M. Radon in Geological Environment; Czech experience; Czech Geological Survey: Praga, Czech Republic, 2008; Volume 19, pp. 19–28. [Google Scholar]
- Kemski, J.; Siehl, A.; Stegemann, R.; Valdia-Manchego, M. Mapping the geogenic radon potential in Germany. Sci. Total Environ. 2001, 272, 217–230. [Google Scholar] [CrossRef]
- Kemski, J.; Klingel, R.; Siehl, A. Classification and Mapping of Radon-Affected Areas in Germany. Environ. Int. 1996, 22, 789–798. [Google Scholar] [CrossRef]
- Cosma, C.; Cucos (Dinu), A.; Dicu, T. Preliminary Results Regarding the First Map of Residential Radon in Some Regions in Romania. Radiat. Prot. Dosim. 2013, 155, 343–350. [Google Scholar] [CrossRef]
- Giustini, F.; Ciotoli, G.; Rinaldini, A.; Ruggiero, L.; Voltaggio, M. Mapping the Geogenic Radon Potential and Radon Risk by Using Empirical Bayesian Kriging Regression: A Case Study from a Volcanic Area of Central Italy. Sci. Total Environ. 2019, 661, 449–464. [Google Scholar] [CrossRef]
- Karthik, K.M.; Nagaiah, N.; Mathews, G.; Ambika, M. Assessment of annual effective dose due to outdoor radon activity in the environment of Bengaluru. Radiat. Prot. Environ. 2018, 41, 115. [Google Scholar]
- ICRP (International Commission on Radiological Protection). Lung Cancer Risk from Radon and Progeny and Statement on Radon; ICRP Publication 115. Ann; Pergamon Press: Oxford, UK, 2010. [Google Scholar]
- Tokonami, S.; Janik, M.; Samuel, B.G.; Emmanuel, N.N.I.J. Radon-Thoron discriminative measurements in the high natural radiation areas of southwestern Cameroon. J. Environ. Radioact. 2015, 150, 242–246. [Google Scholar]
- Takoukam, S.S.D.; Saïdou; Tokonami, S.; Hosoda, M.; Takahito, S.; Hiromi, K.; Oumarou, B. Simultaneous measurements of indoor radon and thoron and inhalation dose assessment in Douala City, Cameroon. Isot. Environ. Health Stud. 2019, 55, 499–510. [Google Scholar]
- Krewski, D.; Lubin, J.H.; Zielinski, J.M.; Alavanja, M.; Catalan, V.S.; Field, R.W.; Klotz, J.B.; Letourneau, E.G.; Lynch, C.F.; Lyon, J.I.; et al. Residential radon and risk of lung cancer. A combined analysis of seven North American case-control studies. Epidemiology 2005, 16, 137–145. [Google Scholar] [CrossRef] [PubMed]
- Smith, B.J.; Zhang, L.; Field, R.W. Iowa radon leukaemia study: A hierarchical population risk model for spatially correlated exposure measured with error. Stat. Med. 2007, 26, 4619–4642. [Google Scholar] [CrossRef] [PubMed]
- ICRP (International Commission on Radiological Protection). Radiation Dose to Patients from Radiopharmaceuticals; Pergamon Press: Oxford, UK, 2008. [Google Scholar]
- UNSCEAR (United Nations Committee on the Effects of Atomic Radiation Report). Vol. II: Sources and Effects of Ionizing Radiation; UNSCEAR, United Nations: New York, NY, USA, 2008. [Google Scholar]
- Hinkle, M.E. Factors Affecting Concentrations of Helium and Carbon Dioxide in Soil Gases; Theophrastus Publications S.A.: Athens, Greece, 1990; pp. 421–447. [Google Scholar]
- Klusman, R.W.; Jaacks, J.A. Environmental influences upon mercury, radon and helium concentrations in soil gases at a site near Denver, Colorado. J. Geochem. Explor. 1987, 27, 259–280. [Google Scholar] [CrossRef]
- Pinault, J.L.; Baubron, J.C. Signal processing of soil gas radon, atmospheric pressure, moisture and soil temperature data: A new approach for radon concentration modelling. J. Geophys. Res. 1996, 101, 3157–3171. [Google Scholar] [CrossRef]
- Toutain, J.P.; Baubron, J.C. Gas geochemistry and seismotectonics: A review. Tectonophys 1999, 304, 1–27. [Google Scholar] [CrossRef]
- Alharbi, R.W.; Abbadym, A.G.E. Measurement of radon concentrations in soil and the extent of their impact on the environment from Al-Qassim, Saudi Arabia. Sci. Res. 2013, 5, 93–98. [Google Scholar] [CrossRef]
- Bourai, A.A.; Aswal, S.; Dangwal, A.; Rawat, M.; Prasad, M.; Naithani, N.P.; Joshi, V.; Ramola, R.C. Measurements of radon flux and soil-gas radon concentration along the main central thrust, Garhwal Himalaya, using SRM and RAD7 detectors. Acta Geophys. 2013, 61, 950–957. [Google Scholar] [CrossRef]
- Jayasheelan, A.; Manjunatha, S.; Sannappa, J.; Umeshareddy, K.; Ningappa, C. Radon concentration in atmosphere and its variation with depth of the soil in and around Tumkur, Karnataka, India. Int. J. Adv. Sci. Technol. Res. 2013, 2, 158–162. [Google Scholar]
- Beaubien, S.E.; Ciotoli, G.; Lombardi, S. Carbon dioxide and radon gas hazard at the Alban hill area (Central Italy). J. Volcanol. Geotherm. Res. 2003, 123, 63–80. [Google Scholar] [CrossRef]
- Nuhu, H.; Hashim, S.; Aziz, S.M.; Syazwan, M.S.M.; Hussein, A.A.; Jamal, M.H.; Abdullah, R.A.; Hassan, S.A. Soil gas radon and soil permeability assessment: Mapping radon risk areas in Perak State, Malaysia. PLoS ONE 2021, 16, e0254099. [Google Scholar] [CrossRef] [PubMed]
- Badr, L.; Oliver, M.A.; Durrani, S.A. Statistical evidence of the geological control over radon soil gas concentrations and its implications for mapping radon potential. Radiat. Prot. Dosim. 1996, 63, 281–291. [Google Scholar] [CrossRef]
- Dubois, G. An Overview of Radon Surveys in Europe; Radioactivity environmental monitoring emissions and health unit institute for environment and sustainability, EUR 21892 EN; JRC—European Commission: Brussels, Belgium, 2005. [Google Scholar]
- Koyang, F.; Awe, R.; Bineng, G.S.; Ndimantchi, A.; Hamadou, A.Y.; Saïdou; Ben-Bolie, G.H. Assessment of natural radiation exposure due to 222Rn and external radiation sources: Case of the Far North, Cameroon. Health Phys. 2022, 123, 444–456. [Google Scholar]
- Kaur, M.; Ajay, K.; Rohit, M.; Rosaline, M. Study of radon/thoron exhalation rate, soil-gas radon concentration, and assessment of indoor radon/thoron concentration in Siwalik Himalayas of Jammu & Kashmir. Hum. Ecol. Risk Assess. Int. J. 2018, 24, 2275–2287. [Google Scholar]
- ICRP (International Commission on Radiological Protection). The 2007 Recommendations of the International Commission on Radiological Protection; Pergamon Press: Oxford, UK, 2007. [Google Scholar]
- WHO (World Health Organization). Vol. I: Guidelines for Drinking-Water Quality; World Health Organization: Geneva, Switzerland, 2004.
- Taalab, S.A.; Mohamed, W.H.; Abdel-Rahman, A.M.; Alqahtani, M.S.; La Verde, G.; Pugliese, M.; Hanfi, M.Y.M.; Ambrosino, F. Distribution maps and hazard of radioelements from granitic rocks in an Egypt region. Eur. Phys. J. Plus 2023, 138, 828. [Google Scholar] [CrossRef]
- Rafat, M.A. Assessment of concentration and exposure doses due to radon by using CR-39 plastic track detectors in the dwellings of Saudi Arabia. Adv. Appl. Sci. Res. 2015, 6, 42–48. [Google Scholar]
- Ramasamy, V.; Sundarrajan, M.; Paramasivam, K.; Meenakshisundaram, V.; Suresh, G. Assessment of spatial distribution and radiological hazardous nature of radionuclides in high background radiation area, Kerala, India. Appl. Radiat. Isot. 2013, 73, 21–31. [Google Scholar] [CrossRef] [PubMed]
- Aytas, S.; Yusan, S.; Aslani, M.A.; Karali, T.; Turkozu, D.A.; Gok, C.; Erenturk, S.; Gokce, M.; Oguz, K.F. Natural radioactivity of riverbank sediments of the Maritza and Tundja Rivers in Turkey. J. Environ. Sci. Health A Toxic Hazard. Subst. Environ. Eng. 2012, 47, 2163–2172. [Google Scholar] [CrossRef]
- Health Canada. Part 1: Guidance on Human Health Preliminary Quantitative Risk Assessment (PQRA), Version 2.0; Federal Contaminated Site Risk Assessment in Canada; Health Canada: Ottawa, ON, Canada, 2010. [Google Scholar]
- Institut National du Cancer. INCa Radon et Cancer Collection Fiches Repère; Etat des connaissances; Institut National du Cancer: Boulogne-Billancourt, France, 2011. [Google Scholar]
- Catelinois, O.; Rogel, A.; Laurier, D.; Billon, S.; Tirmarche, M.; Hemon, D.; Verger, P. Assessment of the health impact related to indoor exposure to radon in France; Evaluation de l’impact sanitaire de l’exposition domestique au radon en France. BEH Bull. Epidemiol. Hebd. 2007, 2, 18–19. [Google Scholar]
- ICRP (International Commission on radiological Protection). Radiological Protection against Radon Exposure; ICRP Publication 126. Ann. ICRP 43; Pergamon Press: Oxford, UK, 2014. [Google Scholar]
- Baysson, H.; Tirmarche, M. Indoor radon exposure and lung cancer risk: A review of case-control studies. Rev. Epidemiol. Sante Publique 2004, 52, 161–171. [Google Scholar] [CrossRef]
- Isabelle, B.; Denis, B.; Robert, B.; Simone, B.; Jacques, B.; Marie-Odile, B.; Olivier, B.; Pierre, C.; Jocelyn, C.; Emmanuelle, C.-J.; et al. Cancer et Environnement; Institut National de la Santé et de la Recherche Médicale (INSERM): Paris, France, 2008. [Google Scholar]
- Darby, S.; Hill, D.; Deo, H.; Auvinen, A.; Barros-Dios, J.M.; Baysson, H.; Bochicchio, F.; Falk, R.; Farchi, S.; Figueiras, A.; et al. Residential radon and lung cancer-detailed results of a collaborative analysis of individual data on 7148 persons with lung cancer and 14,208 persons without lung cancer from 13 epidemiologic studies in Europe. Scand. J. Work Environ. Health 2006, 32, 1–83. [Google Scholar]
- Scott, B.R. Residential radon appears to prevent lung cancer. Dose-Response 2011, 9, 444–464. [Google Scholar] [CrossRef]
- Klaus, B. Health Effects of High Radon Environments in Central Europe: Another Test for the LNT Hypothesis? Nonlinearity Biol. Toxicol. Med. 2003, 1, 3–35. [Google Scholar]
- Bachirou, S.; Saïdou; Kranrod, C.; Ndjana, N.J.E.I.I.; Bongue, D.; Abba, Y.H.; Hosoda, M.; Kwato, N.M.G.; Tokonami, S. Mapping in a radon-prone area in Adamawa region, Cameroon. Radiat. Environ. Biophys. 2023, 62, 427–439. [Google Scholar] [CrossRef]


| Locality | Range | AM ± SD a | GM (GSD) a | Median | |
|---|---|---|---|---|---|
| Radon (Bq m−3) (N = 47) | Bikoue | 22–56 | 36 ± 7 | 34 (1) | 34 |
| Ngombas | 21–45 | 33 ± 4 | 33 (1) | 34 | |
| Awanda | 19–40 | 29 ± 6 | 28 (1) | 30 | |
| Nkouloungui | 23–44 | 32 ± 6 | 31 (1) | 30 | |
| Akongo | 29–62 | 39 ± 11 | 37 (1) | 32 | |
| Thoron (Bq m−3) (N = 44) | Bikoue | 74–274 | 182 ± 65 | 165 (2) | 193 |
| Ngombas | 44–394 | 142 ± 86 | 110 (2) | 99 | |
| Awanda | 10–149 | 76 ± 35 | 61 (2) | 67 | |
| Nkouloungui | 11–332 | 153 ± 113 | 99 (3) | 91 | |
| Akongo | 11–100 | 53 ± 32 | 37 (3) | 48 | |
| EETC (Bq m−3) (N = 49) | Bikoue | 3.2–14.7 | 7.9 ± 4.2 | 6.7 (1.7) | 5.9 |
| Ngombas | 1.8–21.8 | 8.4 ± 4.2 | 6.8 (2.1) | 7.4 | |
| Awanda | 1–7.8 | 3.8 ± 1.8 | 3.2 (1.9) | 3.6 | |
| Nkouloungui | 0.5–17.1 | 6.6 ± 5.1 | 3.7 (3.4) | 4.1 | |
| Akongo | 1.8–7.5 | 3.7 ± 1.9 | 3.0 (1.8) | 2.7 |
| House Type | Range | AM ± SD | GM (GSD) | Median | |
|---|---|---|---|---|---|
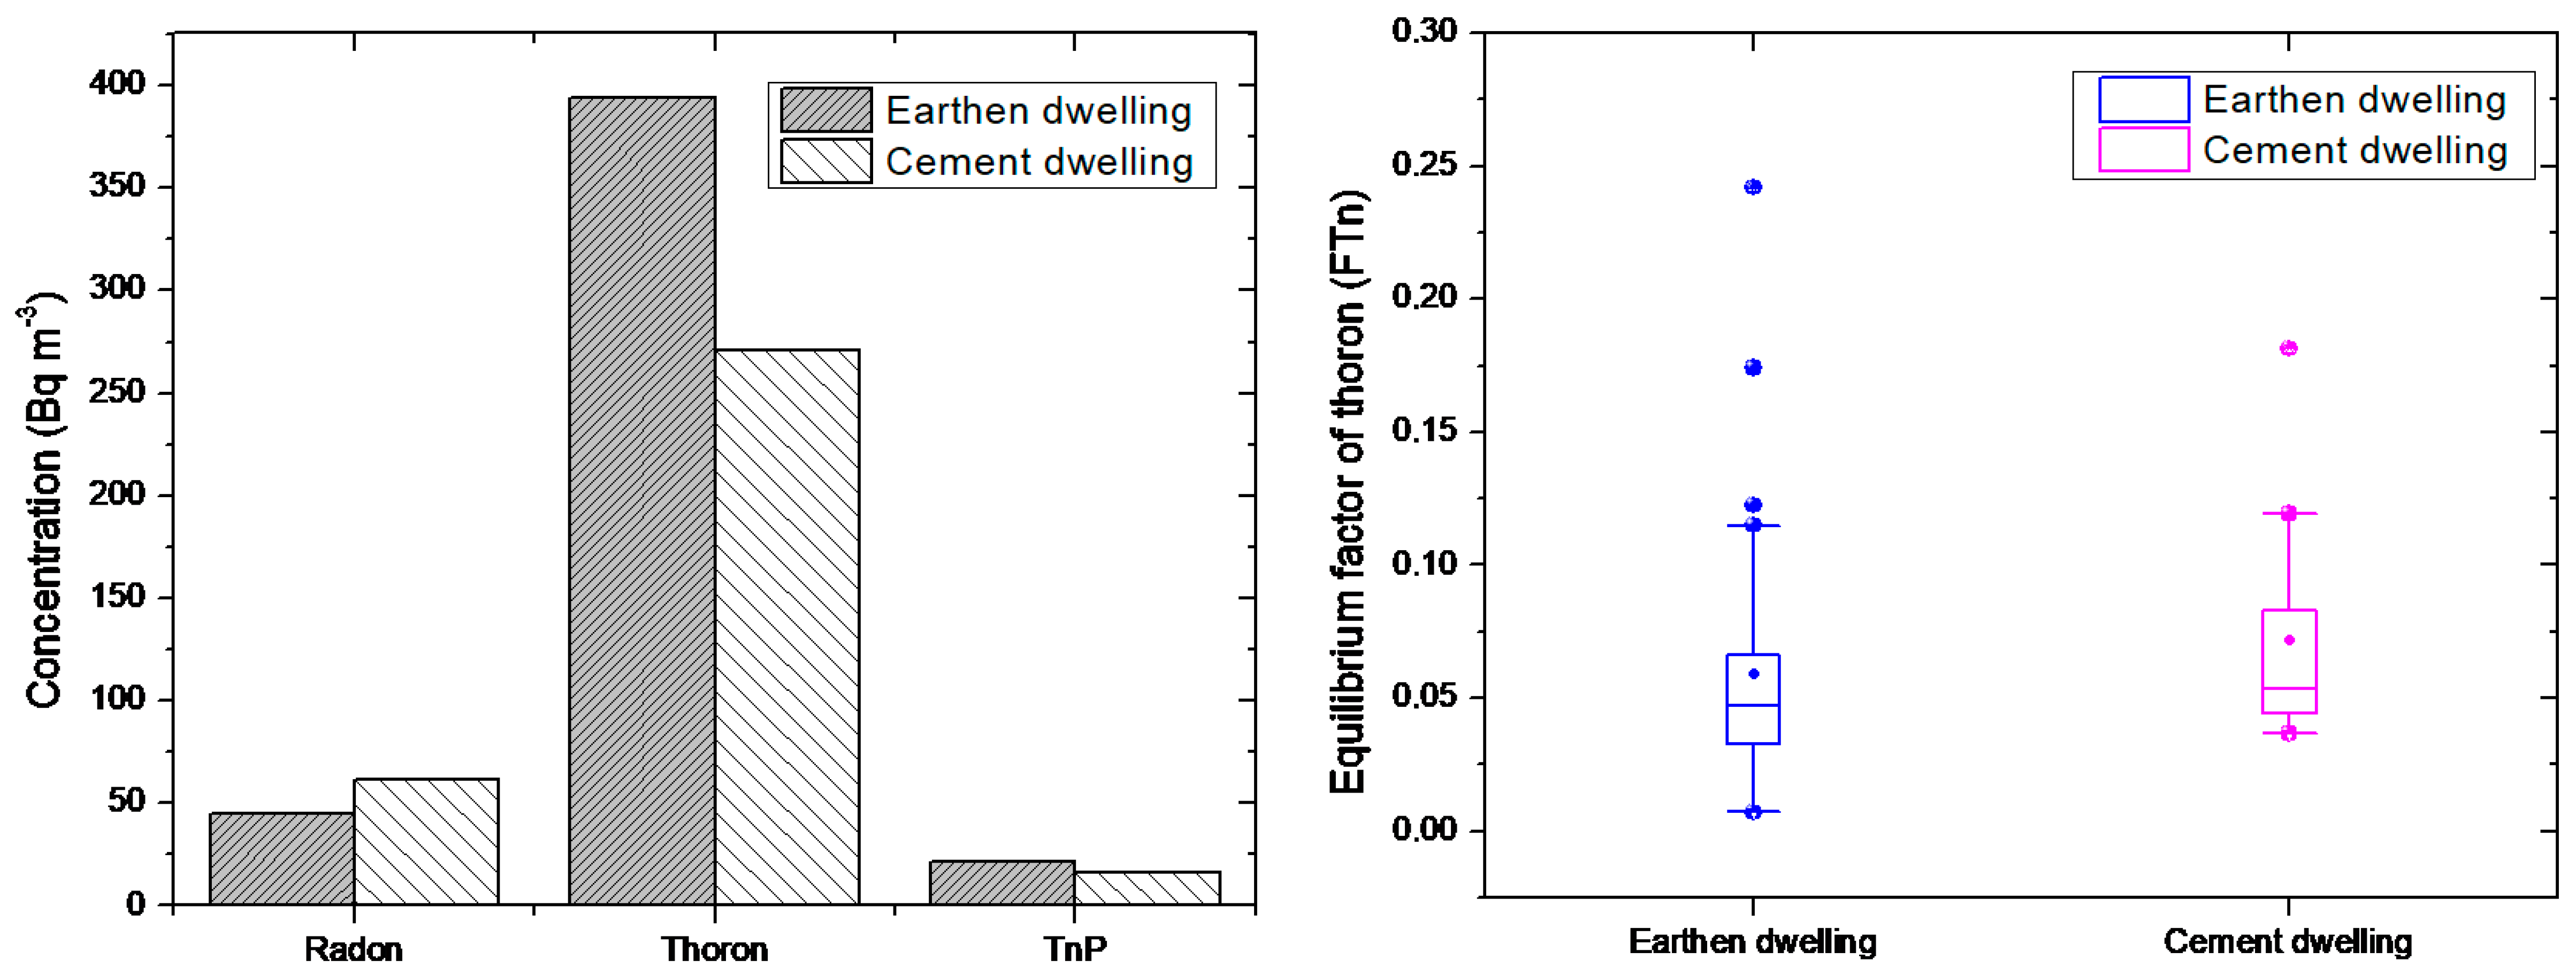
| Radon (Bq m−3) | Earthen dwelling (N = 34) | 19–45 | 32 ± 5 | 32 (1) | 32 |
| Cement dwelling (13) | 23–62 | 35 ± 10 | 34 (1) | 33 | |
| Thoron (Bq m−3) | Earthen dwelling (N = 33) | 11–394 | 152 ± 67 | 119 (2) | 106 |
| Cement dwelling (11) | 10–271 | 81 ± 53 | 55 (3) | 58 | |
| EETC (Bq m−3) | Earthen dwelling (N = 35) | 0.5–21.8 | 7.3 ± 4.1 | 5.5 (2.2) | 5.8 |
| Cement dwelling (N = 14) | 0.6–16.0 | 5.1 ± 3.2 | 3.7 (2.3) | 3.6 | |
| FTn | Earthen dwelling (N = 33) | 0.01–0.24 | 0.06 ± 0.03 | 0.05 (2.0) | 0.05 |
| Cement dwelling (N = 11) | 0.04–0.18 | 0.07 ± 0.03 | 0.06 (1.6) | 0.05 |
| Locality | Range | AM ± SD | GM (GSD) | Median | |
|---|---|---|---|---|---|
| E_Rn (mSv y−1) | Bikoue | 0.02–0.05 | 0.03 ± 0.01 | 0.03 (1.3) | 0.03 |
| Ngombas | 0.02–0.04 | 0.03 ± 0.01 | 0.03 (1.2) | 0.03 | |
| Awanda | 0.02–0.04 | 0.03 ± 0.01 | 0.03 (1.3) | 0.03 | |
| Nkouloungui | 0.02–0.04 | 0.03 ± 0.01 | 0.03 (1.2) | 0.03 | |
| Akongo | 0.03–0.06 | 0.03 ± 0.01 | 0.03 (1.2) | 0.03 | |
| E_Tn (mSv y−1) | Bikoue | 0.04–0.16 | 0.11 ± 0.04 | 0.1 (1.6) | 0.11 |
| Ngombas | 0.03–0.23 | 0.08 ± 0.05 | 0.06 (2) | 0.06 | |
| Awanda | 0.01–0.09 | 0.04 ± 0.02 | 0.04 (2.1) | 0.04 | |
| Nkouloungui | 0.01–0.19 | 0.09 ± 0.07 | 0.06 (2.9) | 0.05 | |
| Akongo | 0.01–0.06 | 0.03 ± 0.02 | 0.02 (2.5) | 0.03 | |
| E_TnP (mSv y−1) | Bikoue | 0.67–3.01 | 1.7 ± 0.9 | 1.4 (1.8) | 1.2 |
| Ngombas | 0.39–4.59 | 1.8 ± 0.9 | 1.4 (2.0) | 1.5 | |
| Awanda | 0.2–1.6 | 0.8 ± 0.4 | 0.7 (1.9) | 0.8 | |
| Nkouloungui | 0.12–3.60 | 1.4 ± 1.1 | 0.8 (3.4) | 0.9 | |
| Akongo | 0.4–1.6 | 0.8 ± 0.4 | 0.6 (1.8) | 0.6 | |
| E_RnP (mSv y−1) | Bikoue | 0.4–1.1 | 0.67 ± 0.14 | 0.7 (1.9) | 0.6 |
| Ngombas | 0.4–0.8 | 0.63 ± 0.08 | 0.6 (1.8) | 0.6 | |
| Awanda | 0.4–0.8 | 0.55 ± 0.11 | 0.5 (1.7) | 0.6 | |
| Nkouloungui | 0.4–0.8 | 0.60 ± 0.11 | 0.6 (1.8) | 0.6 | |
| Akongo | 0.6–1.2 | 0.73 ± 0.22 | 0.7 (1.9) | 0.6 |
| House Type | Range | AM ± SD | GM (GSD) | Median | |
|---|---|---|---|---|---|
| E_Rn (mSv y−1) | Earthen dwelling | 0.02–0.04 | 0.03 ± 0.01 | 0.03 (1.2) | 0.03 |
| Cement dwelling | 0.02–0.06 | 0.03 ± 0.01 | 0.03 (1.4) | 0.03 | |
| E_Tn (mSv y−1) | Earthen dwelling | 0.01–0.23 | 0.09 ± 0.05 | 0.07 (2.1) | 0.06 |
| Cement dwelling | 0.01–0.16 | 0.05 ± 0.03 | 0.03 (2.5) | 0.03 | |
| E_TnP (mSv y−1) | Earthen dwelling | 0.1–4.6 | 1.5 ± 0.9 | 1.2 (2.2) | 1.2 |
| Cement dwelling | 0.13–3.36 | 1.1 ± 0.7 | 0.8 (2.3) | 0.8 | |
| E_RnP (mSv y−1) | Earthen dwelling | 0.4–0.8 | 0.6 ± 0.1 | 0.6 (1.4) | 0.6 |
| Cement dwelling | 0.44–1.17 | 0.67 ± 0.19 | 0.64 (1.4) | 0.62 |
| Range (mSv y−1) | Mean Inhalation Dose (mSv y−1) | Total Inhalation Dose (mSv y−1) | Range Contribution (%) | Mean Contribution (%) | |
|---|---|---|---|---|---|
| Radon | 0.02–0.06 | 0.03 | 2.14 | 0.5–3 | 2 |
| Thoron | 0.01–0.23 | 0.08 | 0.2–13 | 4 | |
| Radon progeny | 0.36–1.17 | 0.63 | 11–71 | 34 | |
| Thoron progeny | 0.12–4.60 | 1.4 | 12–87 | 60 |
| Point | Location | GPS Coordinates | Radon Concentration (kBq m−3) | Annual Effective Dose (mSv y−1) | GRP Based on Assumed Permeability | |||
|---|---|---|---|---|---|---|---|---|
| N | E | 10−11 | 10−12 | 10−13 | ||||
| P1 | Bikoué | 3°18′ | 10°53′ | 10.2 | 0.19 | 10.2 | 5.1 | 3.4 |
| P2 | 3°19′ | 10°53′ | 9.8 | 0.19 | 9.8 | 4.9 | 3.3 | |
| P3 | 3°18′ | 10°53′ | 22.2 | 0.42 | 22.2 | 11.1 | 7.4 | |
| P4 | 3°19′ | 10°52′ | 12.6 | 0.24 | 12.6 | 6.3 | 4.2 | |
| P5 | 3°19′ | 10°50′ | 19.2 | 0.36 | 19.2 | 9.6 | 6.4 | |
| P6 | 3°19′ | 10°52′ | 57.3 | 1.08 | 57.3 | 28.65 | 19.1 | |
| P7 | Ngombas | 3°25′ | 11°5′ | 14.7 | 0.28 | 14.7 | 7.35 | 4.9 |
| P8 | 3°24′ | 11°3′ | 6.6 | 0.12 | 6.6 | 3.3 | 2.2 | |
| P9 | 3°25′ | 11°5′ | 21.3 | 0.40 | 21.3 | 10.65 | 7.1 | |
| P10 | 3°24′ | 11°4′ | 7.5 | 0.14 | 7.5 | 3.75 | 2.5 | |
| P11 | 3°24′ | 11°4′ | 12.3 | 0.23 | 12.3 | 6.15 | 4.1 | |
| P12 | 3°24′ | 11°3′ | 8.1 | 0.15 | 8.1 | 4.05 | 2.7 | |
| P13 | 3°24′ | 11°3′ | 14.1 | 0.27 | 14.1 | 7.05 | 4.7 | |
| P14 | Awanda | 3°20′ | 10°57′ | 10.2 | 0.19 | 10.2 | 5.1 | 3.4 |
| P15 | 3°20′ | 10°57′ | 13.2 | 0.25 | 13.2 | 6.6 | 4.4 | |
| P16 | 3°20′ | 10°57′ | 13.5 | 0.26 | 13.5 | 6.75 | 4.5 | |
| P17 | 3°20′ | 10°57′ | 11.4 | 0.22 | 11.4 | 5.7 | 3.8 | |
| P18 | 3°20′ | 10°57′ | 13.8 | 0.26 | 13.8 | 6.9 | 4.6 | |
| P19 | Nkouloungui | 3°21′ | 11°5′ | 6.6 | 0.12 | 6.6 | 3.3 | 2.2 |
| P20 | 3°22′ | 11°5′ | 5.4 | 0.10 | 5.4 | 2.7 | 1.8 | |
| P21 | 3°21′ | 11°5′ | 4.8 | 0.09 | 4.8 | 2.4 | 1.6 | |
| P22 | 3°23′ | 11°5′ | 10.5 | 0.20 | 10.5 | 5.25 | 3.5 | |
| P23 | Akongo | 3°23′ | 11°5′ | 21.3 | 0.40 | 21.3 | 10.65 | 7.1 |
| P24 | 3°23′ | 11°6′ | 19.5 | 0.37 | 19.5 | 9.75 | 6.5 | |
| P25 | Lolodorf | 3°13′ | 10°43′ | 18.9 | 0.36 | 18.9 | 9.45 | 6.3 |
| P26 | 3°14′ | 10°43′ | 11.7 | 0.22 | 11.7 | 5.85 | 3.9 | |
| P27 | 3°14′ | 10°43′ | 21.6 | 0.41 | 21.6 | 10.8 | 7.2 | |
| P28 | 3°14′ | 10°44′ | 6.9 | 0.13 | 6.9 | 3.45 | 2.3 | |
| P29 | 3°14′ | 10°43′ | 5.1 | 0.10 | 5.1 | 2.55 | 1.7 | |
| Range | 0.09–1.08 | 4.8–57.3 | 2.4–28.7 | 1.6–19.1 | ||||
| AM ± SD | 0.27 ± 0.12 | 14.14 ±6.11 | 7.07 ± 3.06 | 4.7 ± 2.0 | ||||
| GM(GSD) | 0.23(1.71) | 12.1(1.7) | 6.0(1.7) | 4.0(1.7) | ||||
| Median | 0.23 | 12.3 | 6.2 | 4.1 | ||||
| Country | Detector | Range (kBq m−3) | Mean (kBq m−3) | References |
|---|---|---|---|---|
| Al-Qassim, Saudi Arabia | Alpha GUARD 2000 | 0.12 to 0.34 | 0.22 | Alharbi and Abbady, 2013 [47] |
| Garhwal Himalaya, India | RAD7 | 0.01 to 2.33 | 0.30 | Bourai et al. 2013 [48] |
| Tumkur | SSNTD’s | 5.97 to 9.27 | 7.97 | Jayasheelany et al. 2013 [49] |
| Italy | - | 0.4 to 1.200 | 26.6 | Beaubien et al. 2003 [50] |
| Perak State, Malaysia | RAD7 | 0.11 to 434.5 | 18.96 | Nuhu et al. 2021 [51] |
| United Kingdom | SSNTD | 0.6 to 43.3 | 15.5 | Badr et al. 1996 [52] |
| Czech Republic | - | 1 to 1.664 | 28.1 | Dubois 2005 [53] |
| Far-North Region, Cameroon | Markus 10 | 1.2 to 138.3 | 32.7 | Koyang et al. 2022 [54] |
| Nigeria | RAD7 | 0.4 to 190 | 14 | Esan et al. 2020 [26] |
| Jammu and Kashmir | RAD7 | 0.08 to 8.26 | 1.6 | Kaur et al. 2018 [55] |
| Cameroon | Markus 10 | 4.8 to 57.3 | 14.15 | Present investigation |
| Absorbed Dose Rate in Air (nGy h−1) | External Effective Dose Due to Gamma Rays (mSv y−1) ×10−3 | ||||
|---|---|---|---|---|---|
| Indoor | Outdoor | Indoor | Outdoor | Total | |
| Min | 0.08 | 0.08 | 0.3 | 0.2 | 1.2 ± 0.4 |
| Max | 0.4 | 0.64 | 1.5 | 1.6 | |
| AM ± SD | 0.19 ± 0.06 | 0.19 ± 0.06 | 0.7 ± 0.2 | 0.5 ± 0.1 | |
| GM | 0.18 | 0.18 | 0.7 | 0.4 | |
| Median | 0.18 | 0.16 | 0.7 | 0.4 | |
| Excess Lifetime Cancer Risk (×10−3) | ||||||
|---|---|---|---|---|---|---|
| Gamma_In | Gamma_Out | Radon | Thoron | Radon Progeny | Thoron Progeny | |
| Min | 0.001 | 0.001 | 0.07 | 0.02 | 1.45 | 0.46 |
| Max | 0.006 | 0.006 | 0.22 | 0.91 | 4.65 | 18.33 |
| AM ± SD | 0.003 ± 0.001 | 0.002 ± 0.001 | 0.12 ± 0.02 | 0.31 ± 0.19 | 2.51 ± 0.47 | 5.58 ± 3.36 |
| GM | 0.003 | 0.002 | 0.12 | 0.23 | 2.44 | 4.13 |
| Median | 0.003 | 0.002 | 0.11 | 0.23 | 2.41 | 4.03 |
| Radon Concentration (kBq m−3) | Percentage (%) | Risk Category |
|---|---|---|
| <10 | 31 | Low |
| 10–50 | 66 | Medium |
| ˃50 | 3 | High |
Disclaimer/Publisher’s Note: The statements, opinions and data contained in all publications are solely those of the individual author(s) and contributor(s) and not of MDPI and/or the editor(s). MDPI and/or the editor(s) disclaim responsibility for any injury to people or property resulting from any ideas, methods, instructions or products referred to in the content. |
© 2023 by the authors. Licensee MDPI, Basel, Switzerland. This article is an open access article distributed under the terms and conditions of the Creative Commons Attribution (CC BY) license (https://creativecommons.org/licenses/by/4.0/).
Share and Cite
Serge, A.B.M.; Didier, T.S.S.; Samuel, B.G.; Kranrod, C.; Omori, Y.; Hosoda, M.; Saïdou; Tokonami, S. Assessment of Radiological Risks due to Indoor Radon, Thoron and Progeny, and Soil Gas Radon in Thorium-Bearing Areas of the Centre and South Regions of Cameroon. Atmosphere 2023, 14, 1708. https://doi.org/10.3390/atmos14121708
Serge ABM, Didier TSS, Samuel BG, Kranrod C, Omori Y, Hosoda M, Saïdou, Tokonami S. Assessment of Radiological Risks due to Indoor Radon, Thoron and Progeny, and Soil Gas Radon in Thorium-Bearing Areas of the Centre and South Regions of Cameroon. Atmosphere. 2023; 14(12):1708. https://doi.org/10.3390/atmos14121708
Chicago/Turabian StyleSerge, Atangana Bingana Martin, Takoukam Soh Serge Didier, Bineng Guillaume Samuel, Chutima Kranrod, Yasutaka Omori, Masahiro Hosoda, Saïdou, and Shinji Tokonami. 2023. "Assessment of Radiological Risks due to Indoor Radon, Thoron and Progeny, and Soil Gas Radon in Thorium-Bearing Areas of the Centre and South Regions of Cameroon" Atmosphere 14, no. 12: 1708. https://doi.org/10.3390/atmos14121708
APA StyleSerge, A. B. M., Didier, T. S. S., Samuel, B. G., Kranrod, C., Omori, Y., Hosoda, M., Saïdou, & Tokonami, S. (2023). Assessment of Radiological Risks due to Indoor Radon, Thoron and Progeny, and Soil Gas Radon in Thorium-Bearing Areas of the Centre and South Regions of Cameroon. Atmosphere, 14(12), 1708. https://doi.org/10.3390/atmos14121708