


Ventilation Strategies for Mitigating Indoor Air Pollutants in High-Rise Residential Buildings: A Case Study in Dubai


Abstract
:1. Introduction
2. Materials and Methods
2.1. IAQ Standards
2.2. IAQ Control and Ventilation System
2.3. Ventilation Amount by Wind Pressure Difference
- Q: ventilation amount (m3/s);
- A: inlet area (m2);
- v: flow speed (m/s);
- E: opening efficiency;
- When the wind blows perpendicular to the opening: 0.5–0.6;
- When b, the wind blows at an angle of 45° to the opening: 0.25–0.3.
2.4. IAQ Measurement by Ventilation Methods
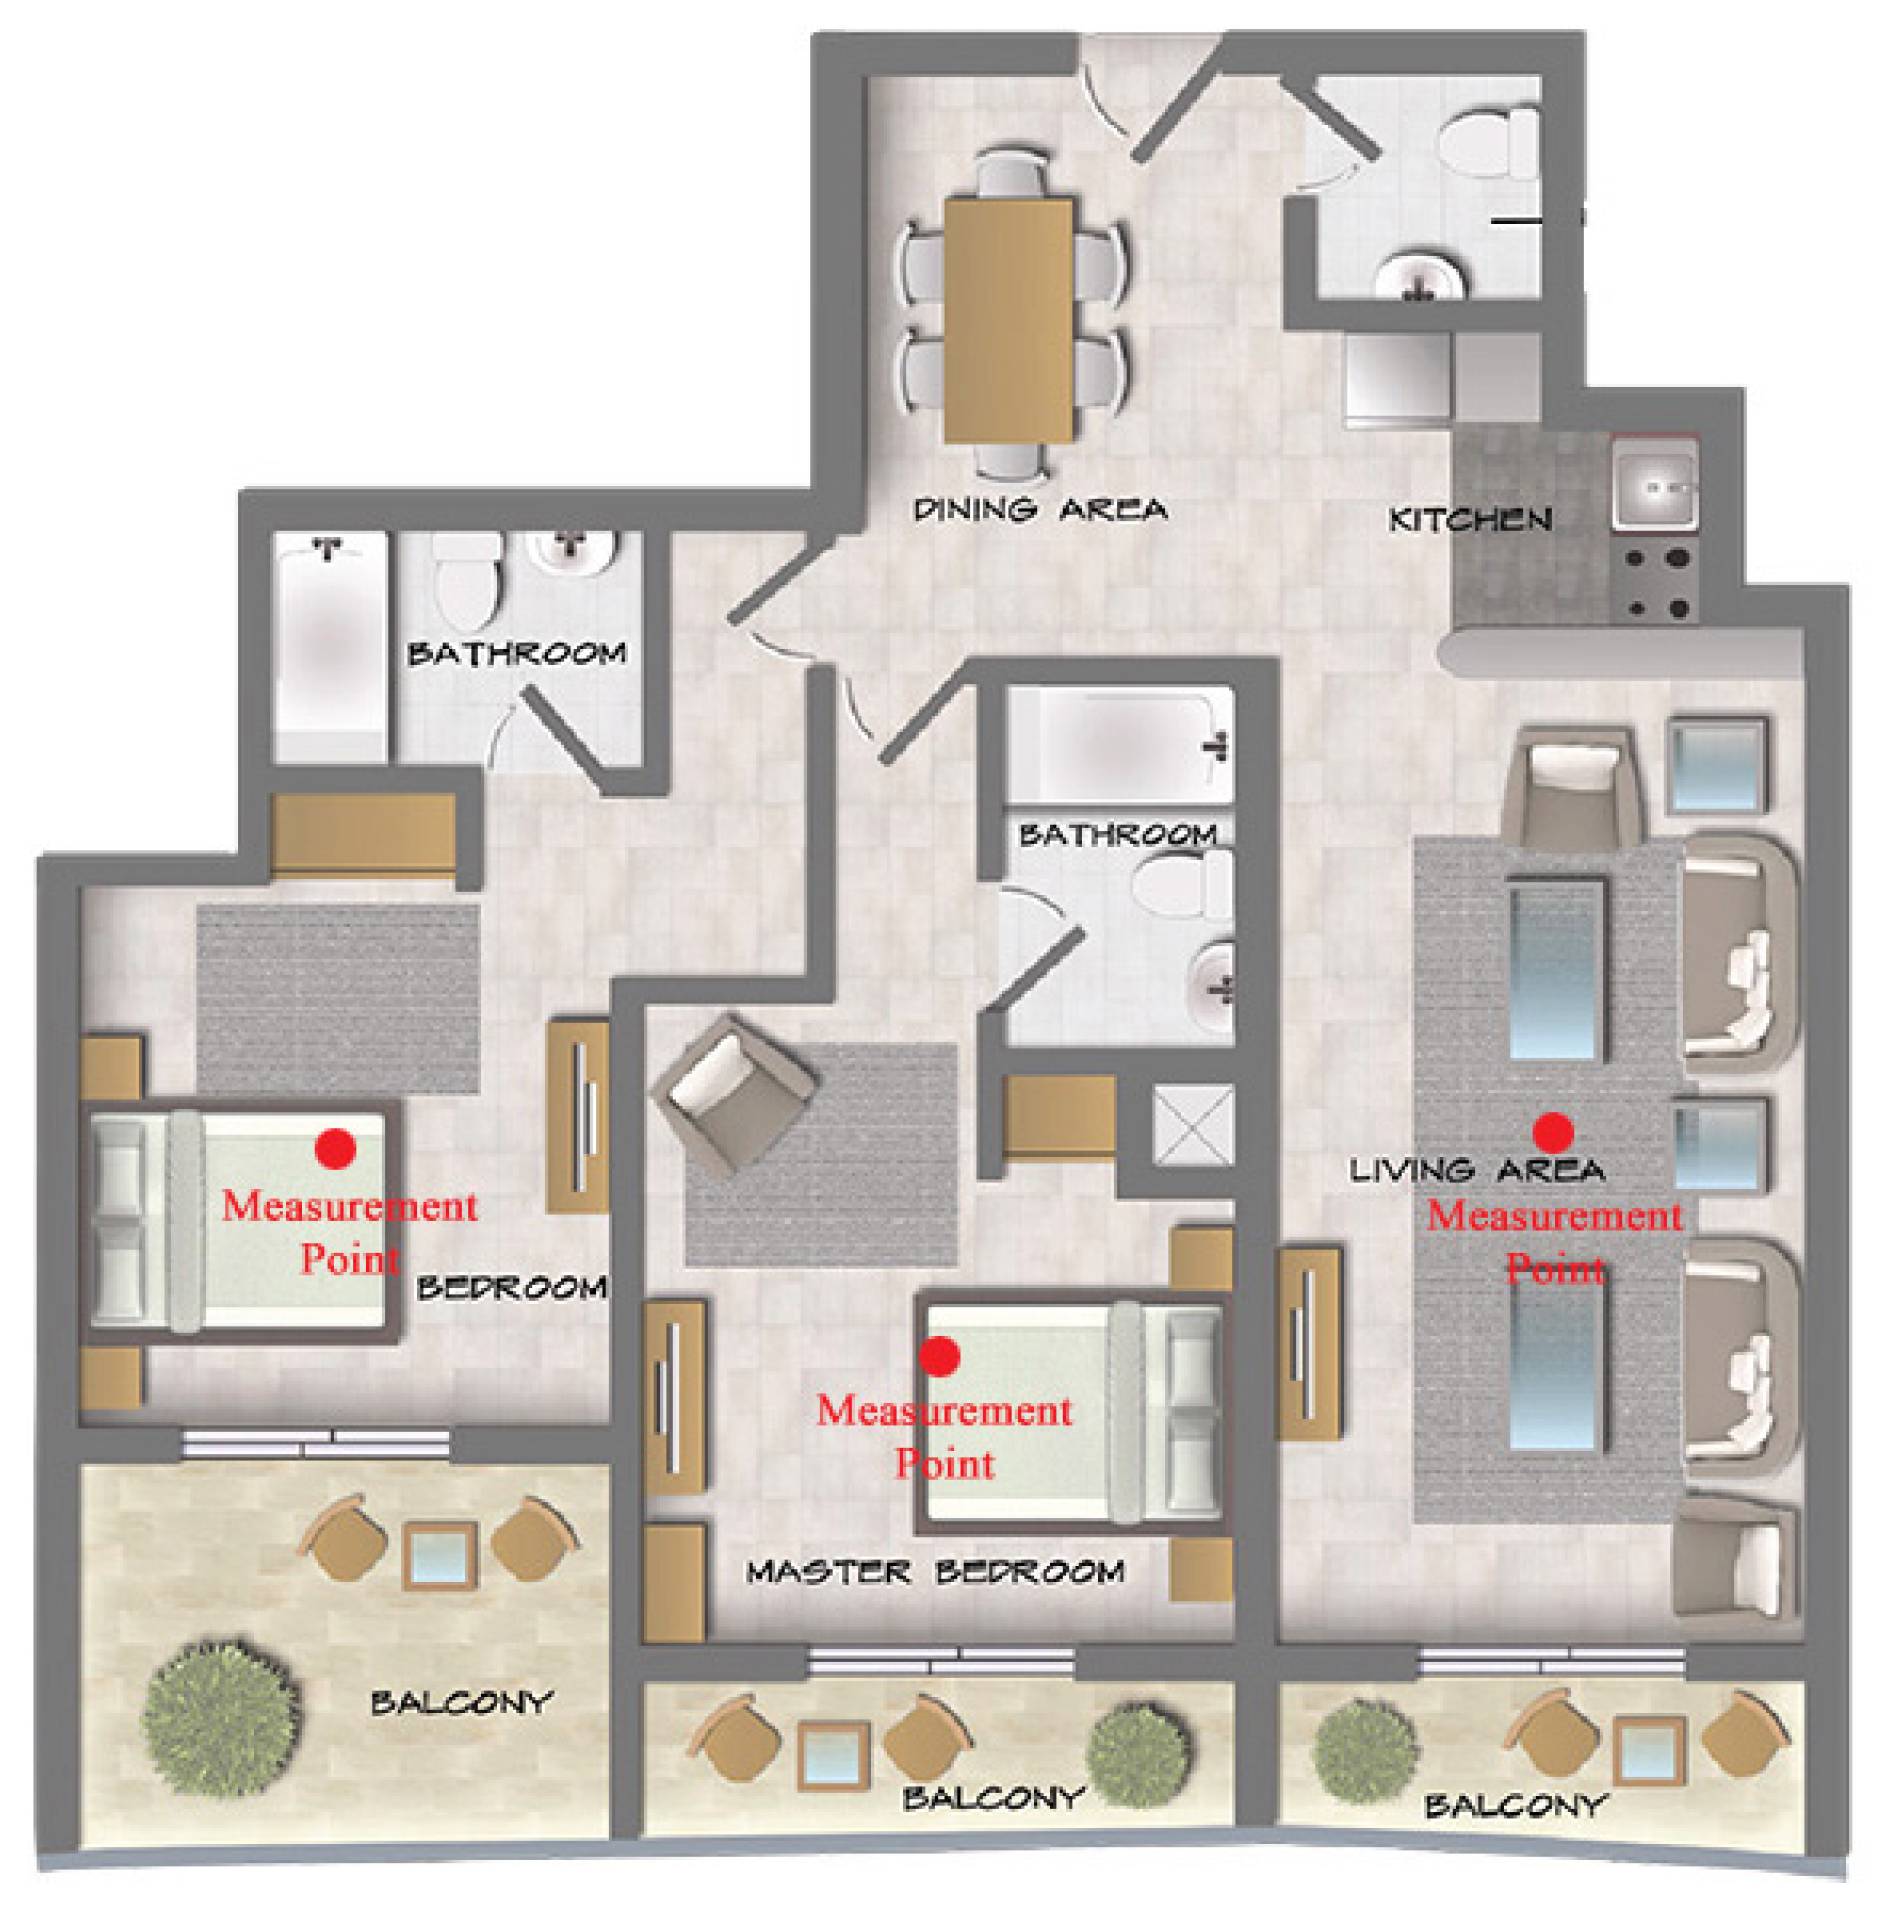
2.4.1. Measurement Overview
2.4.2. Measurement Condition and Analysis Method
2.4.3. Ventilation Amount by Different Methods
3. Results
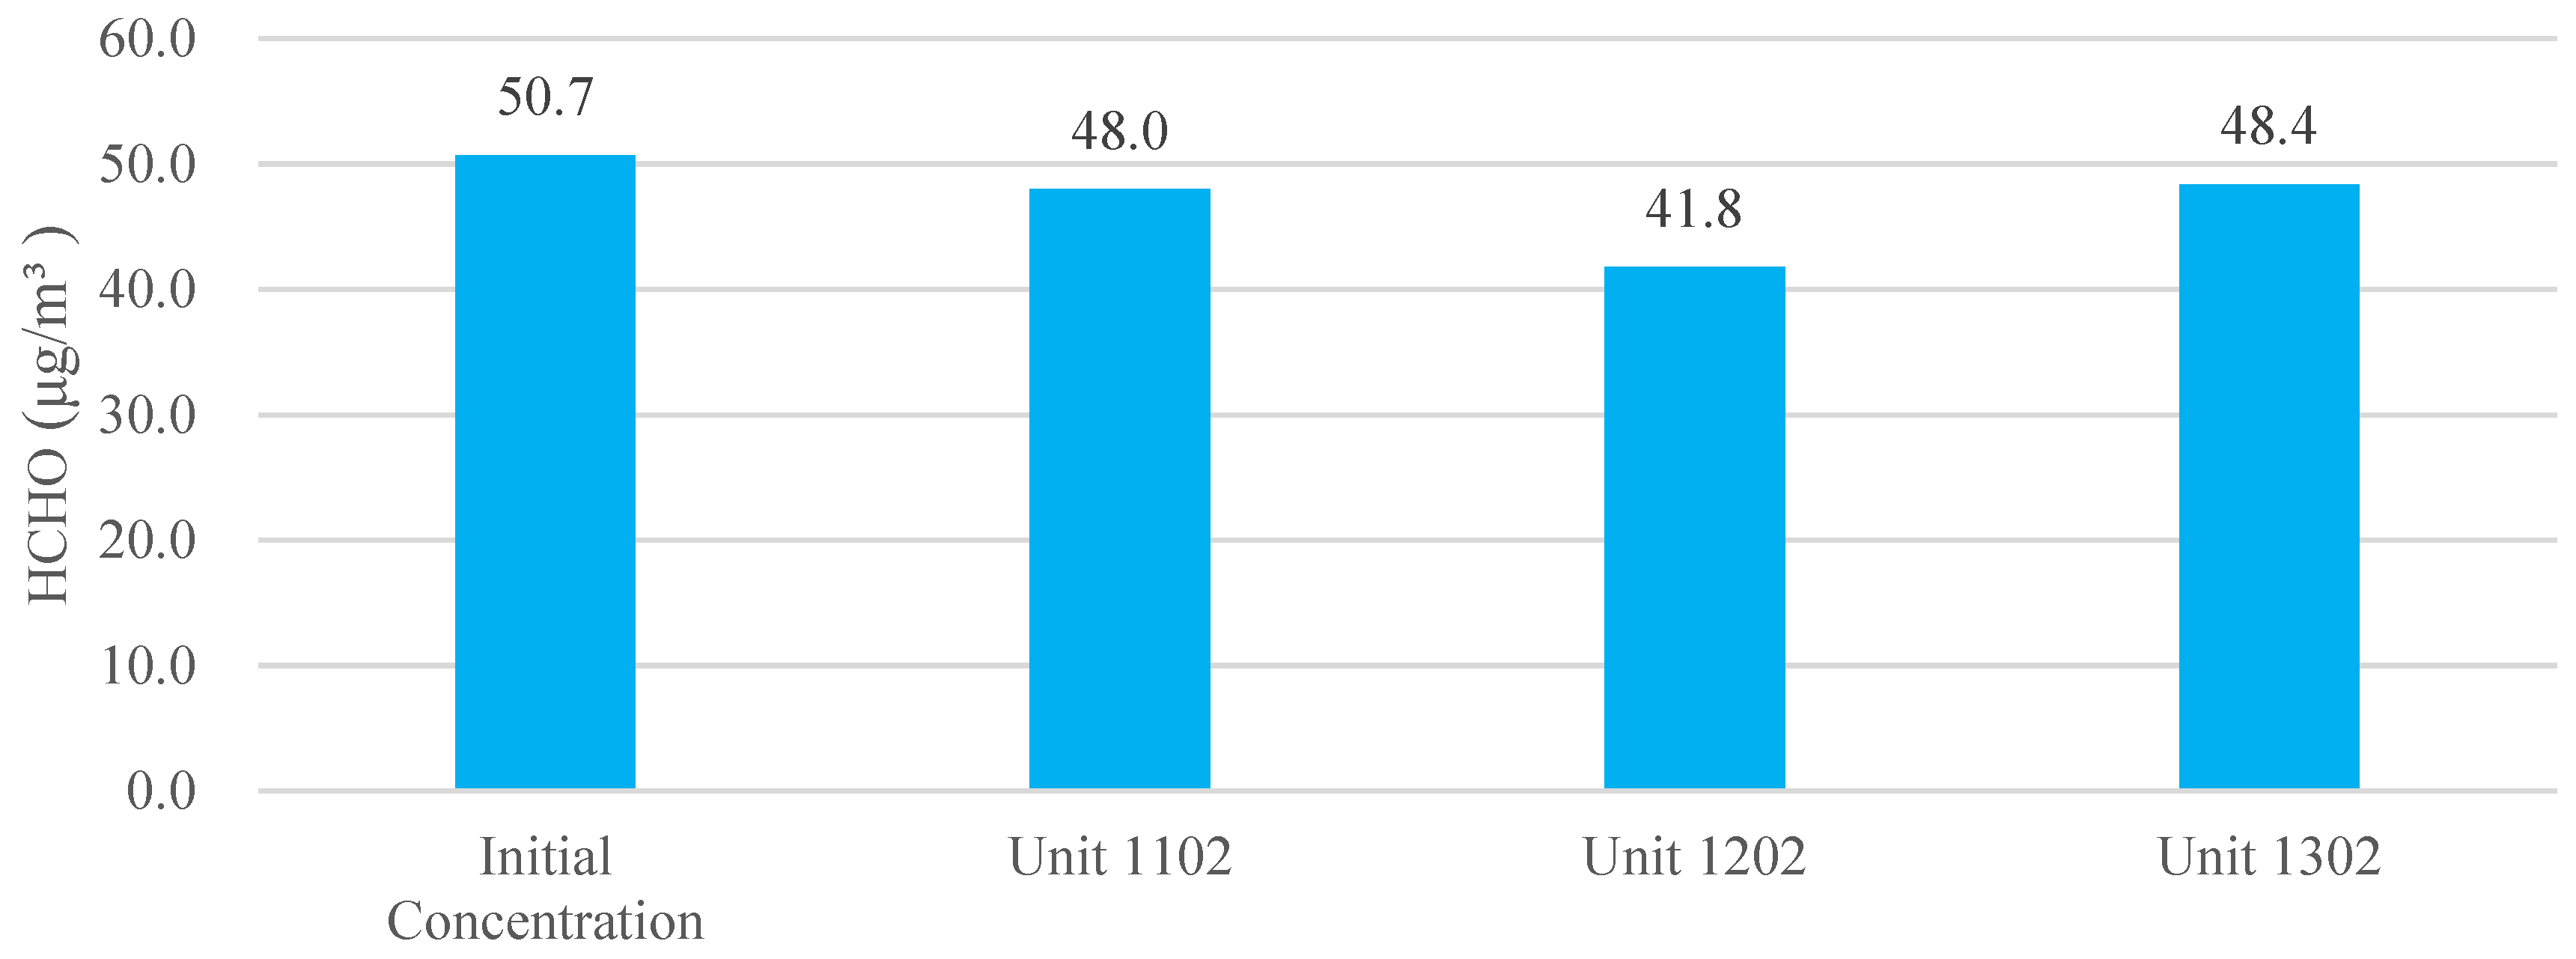
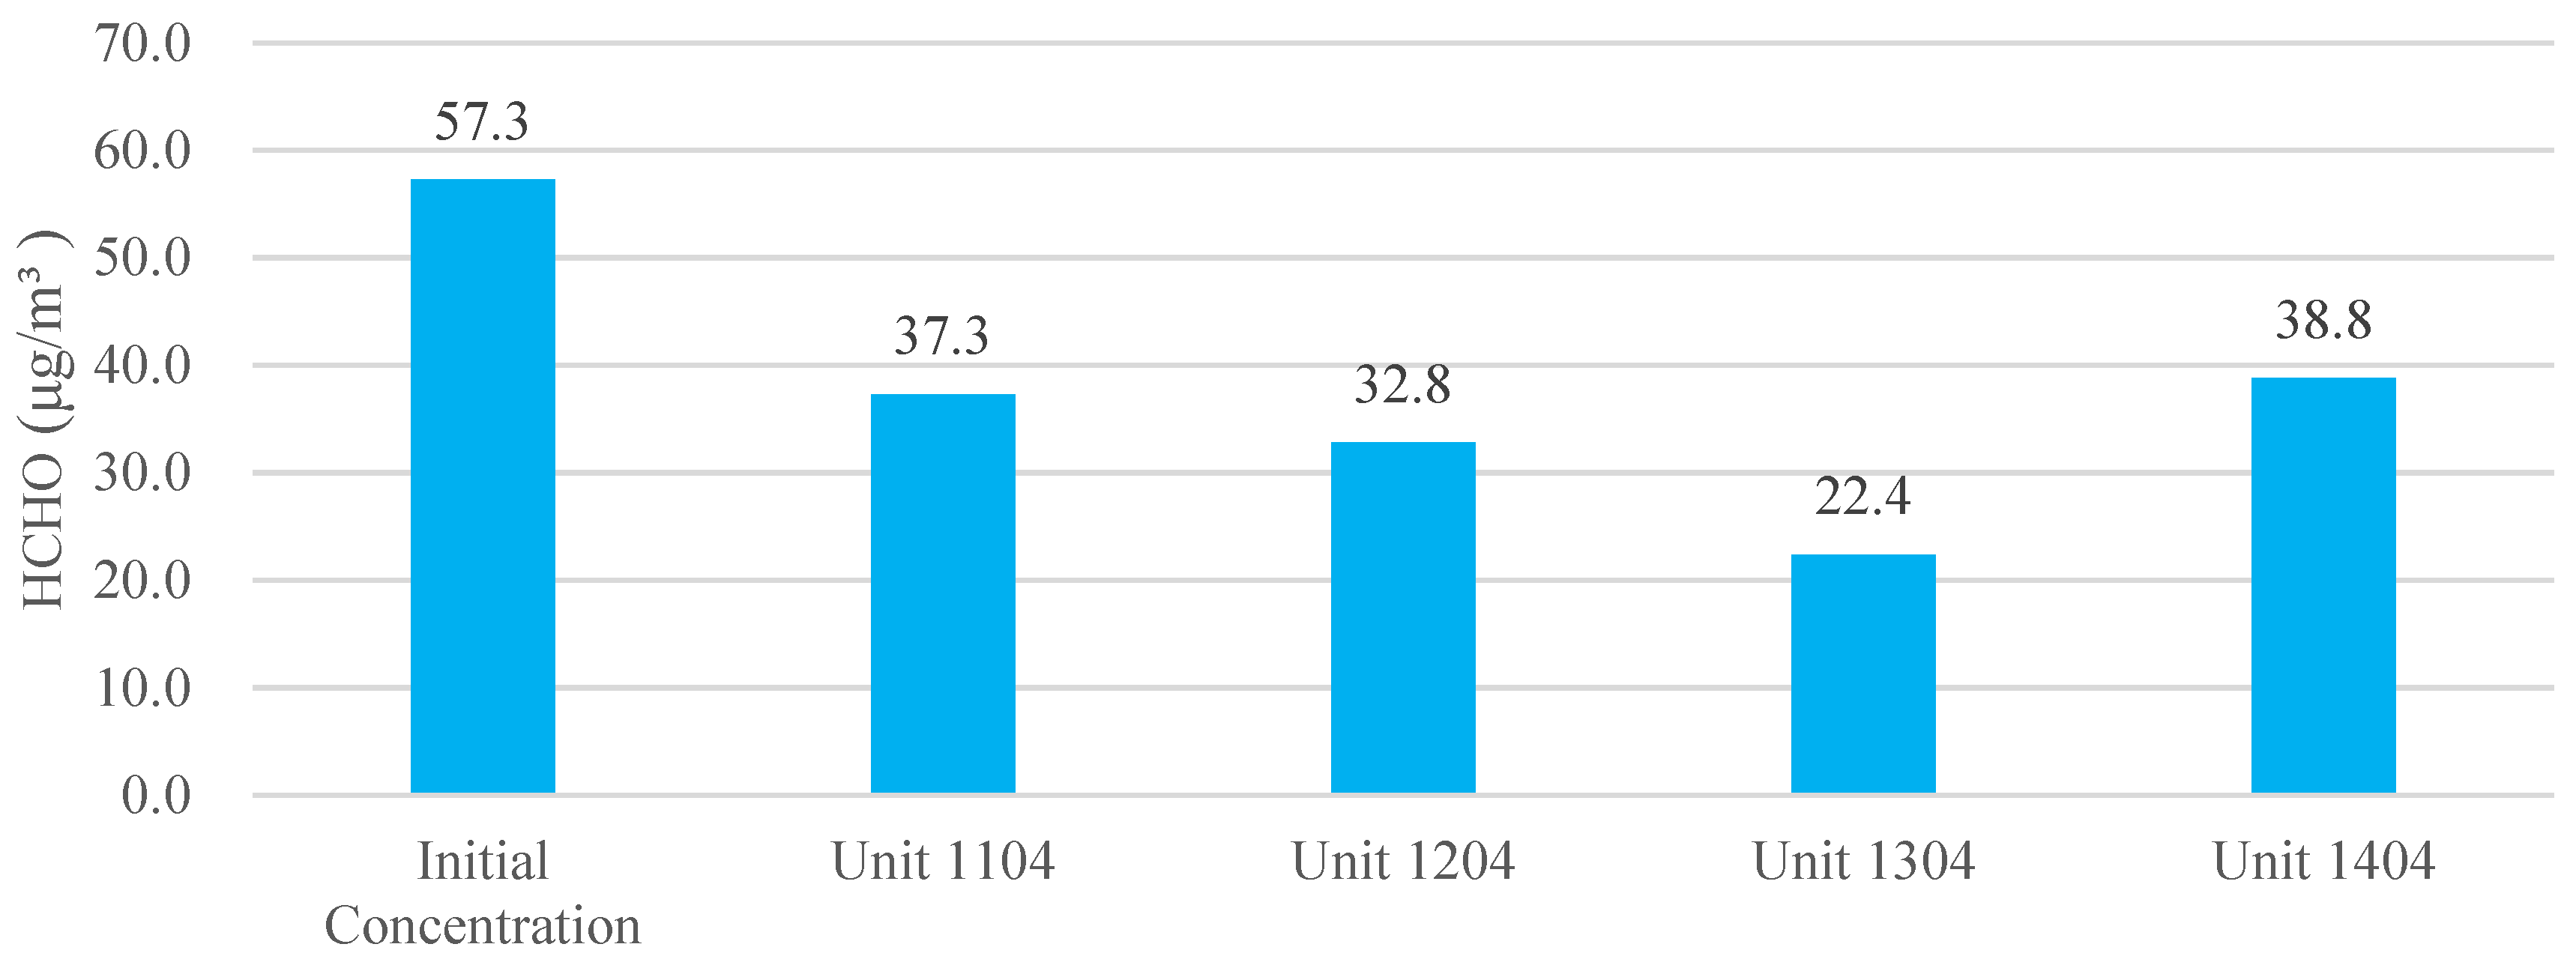
3.1. HCHO
3.2. VOCs
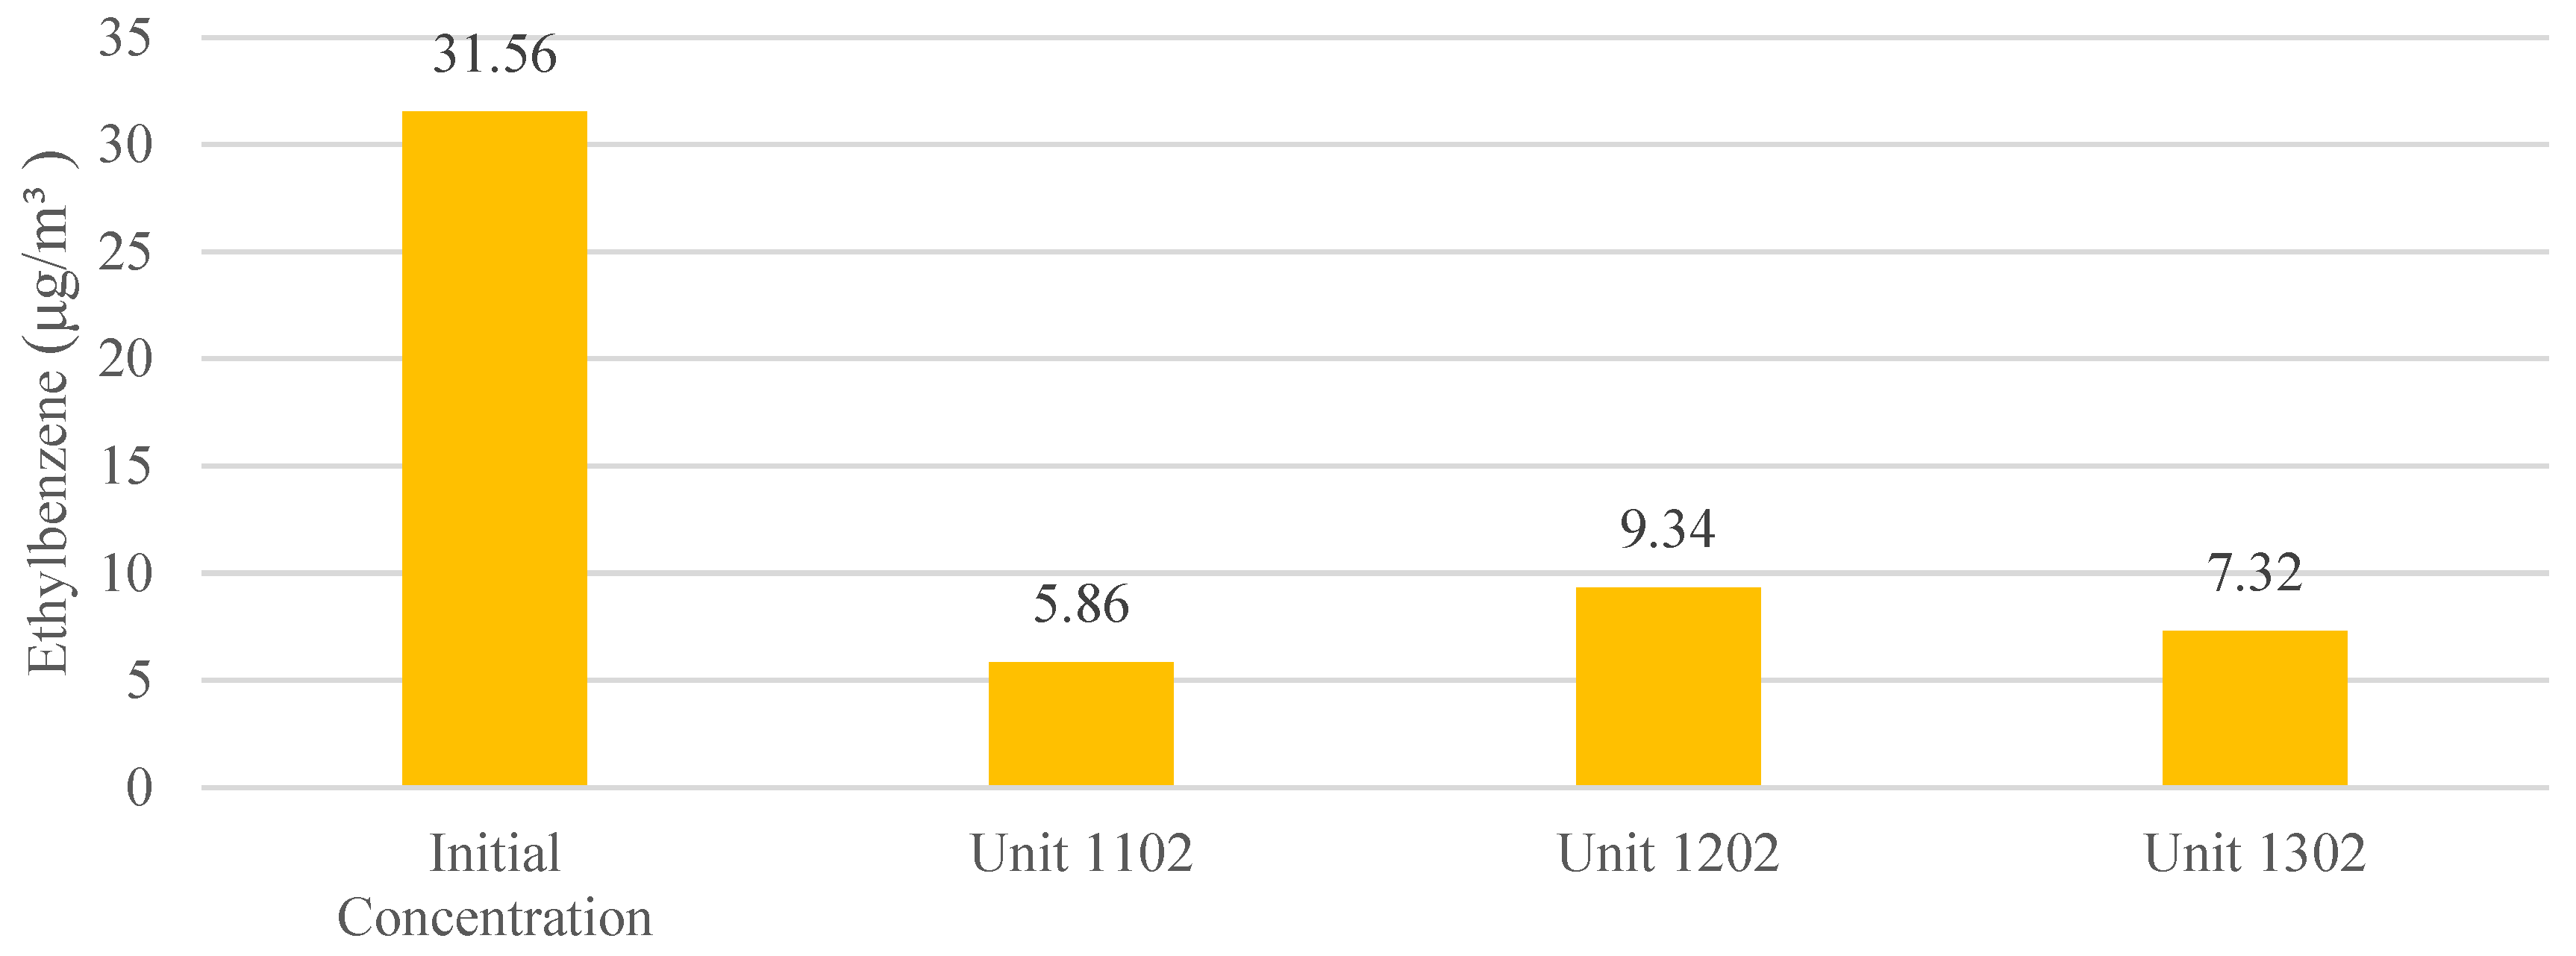
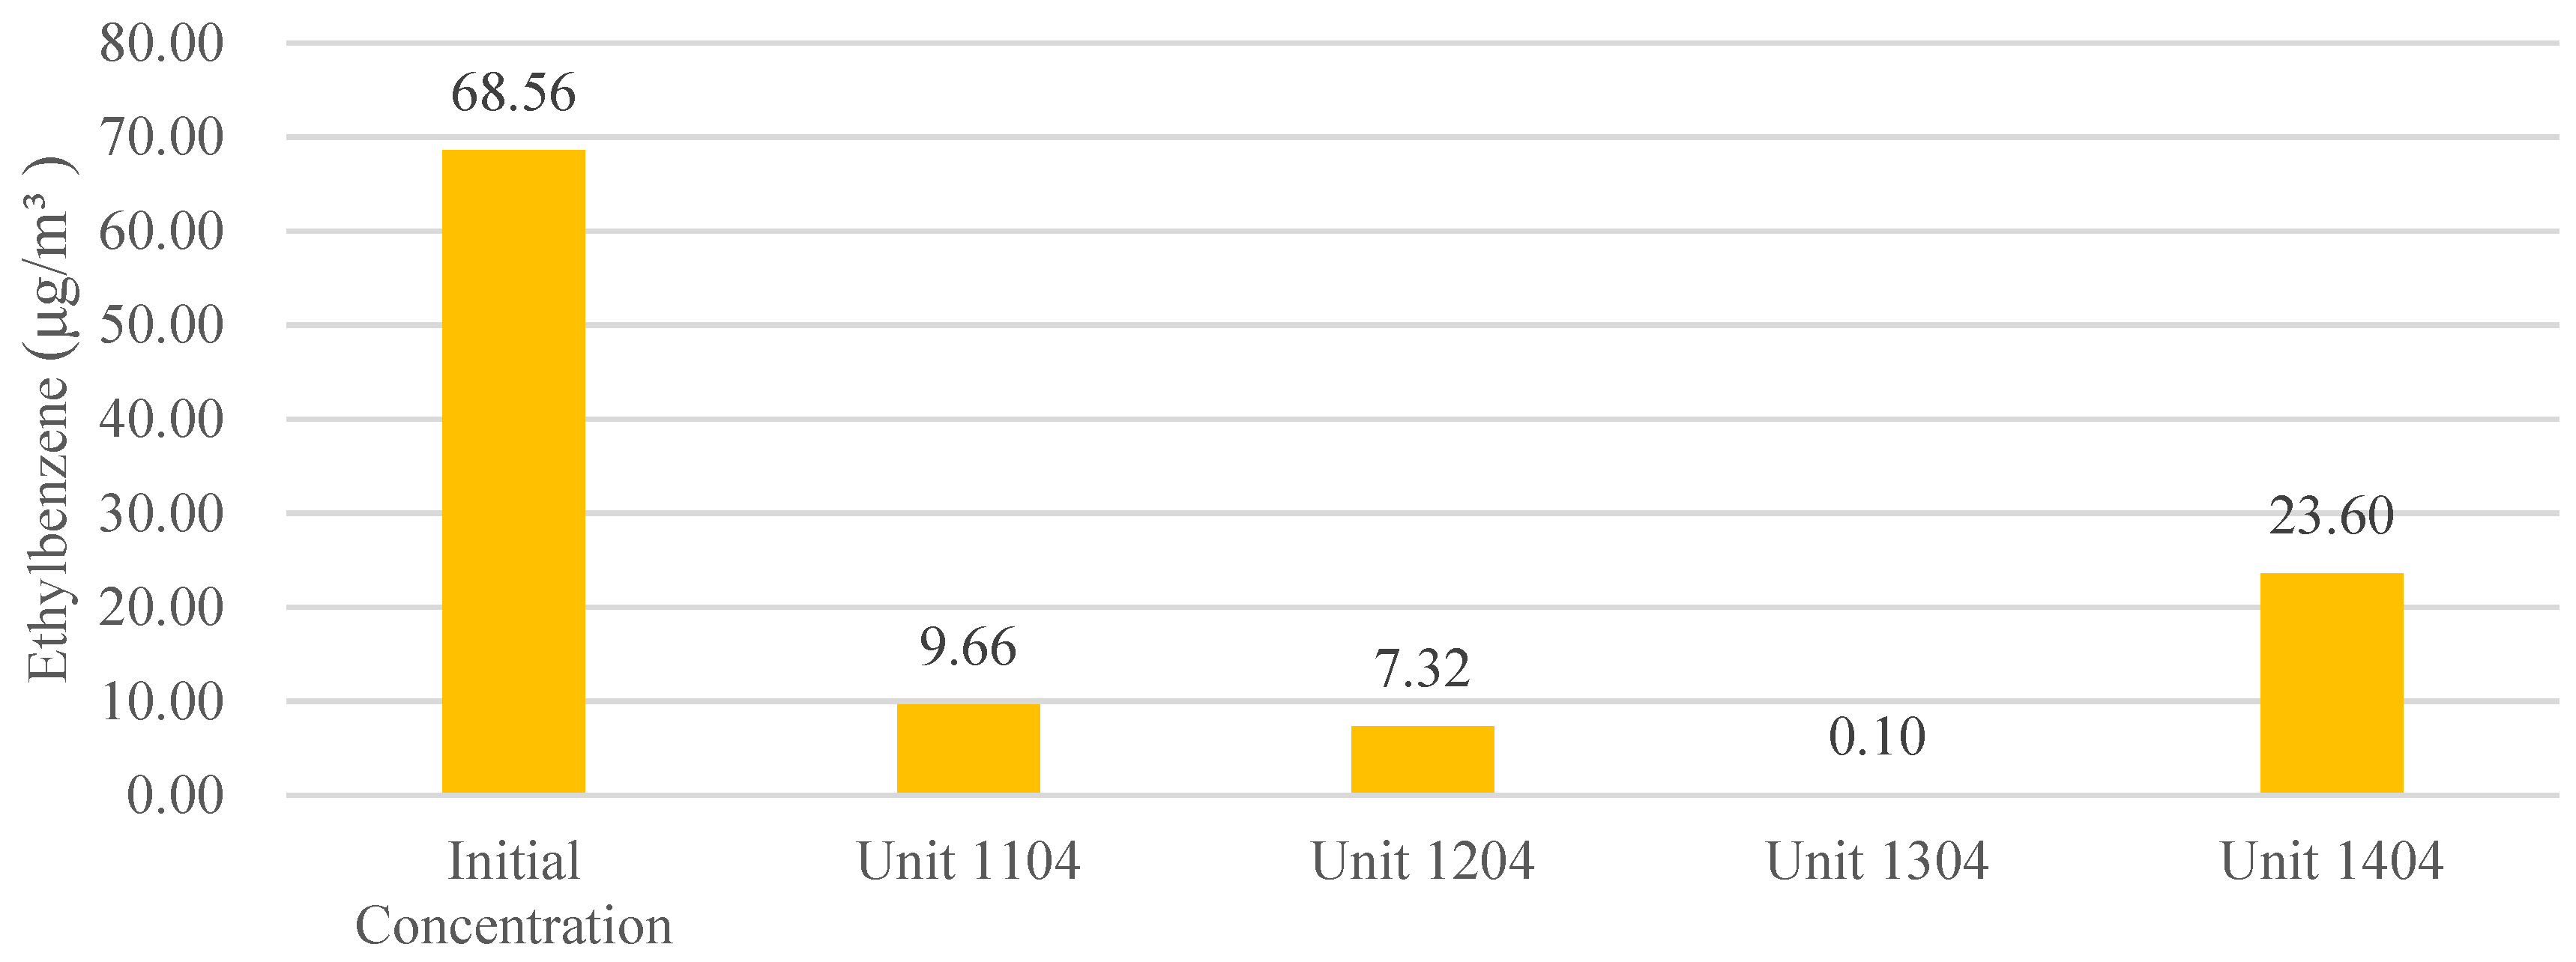
3.2.1. Benzene, Ethylbenzene, Stylene
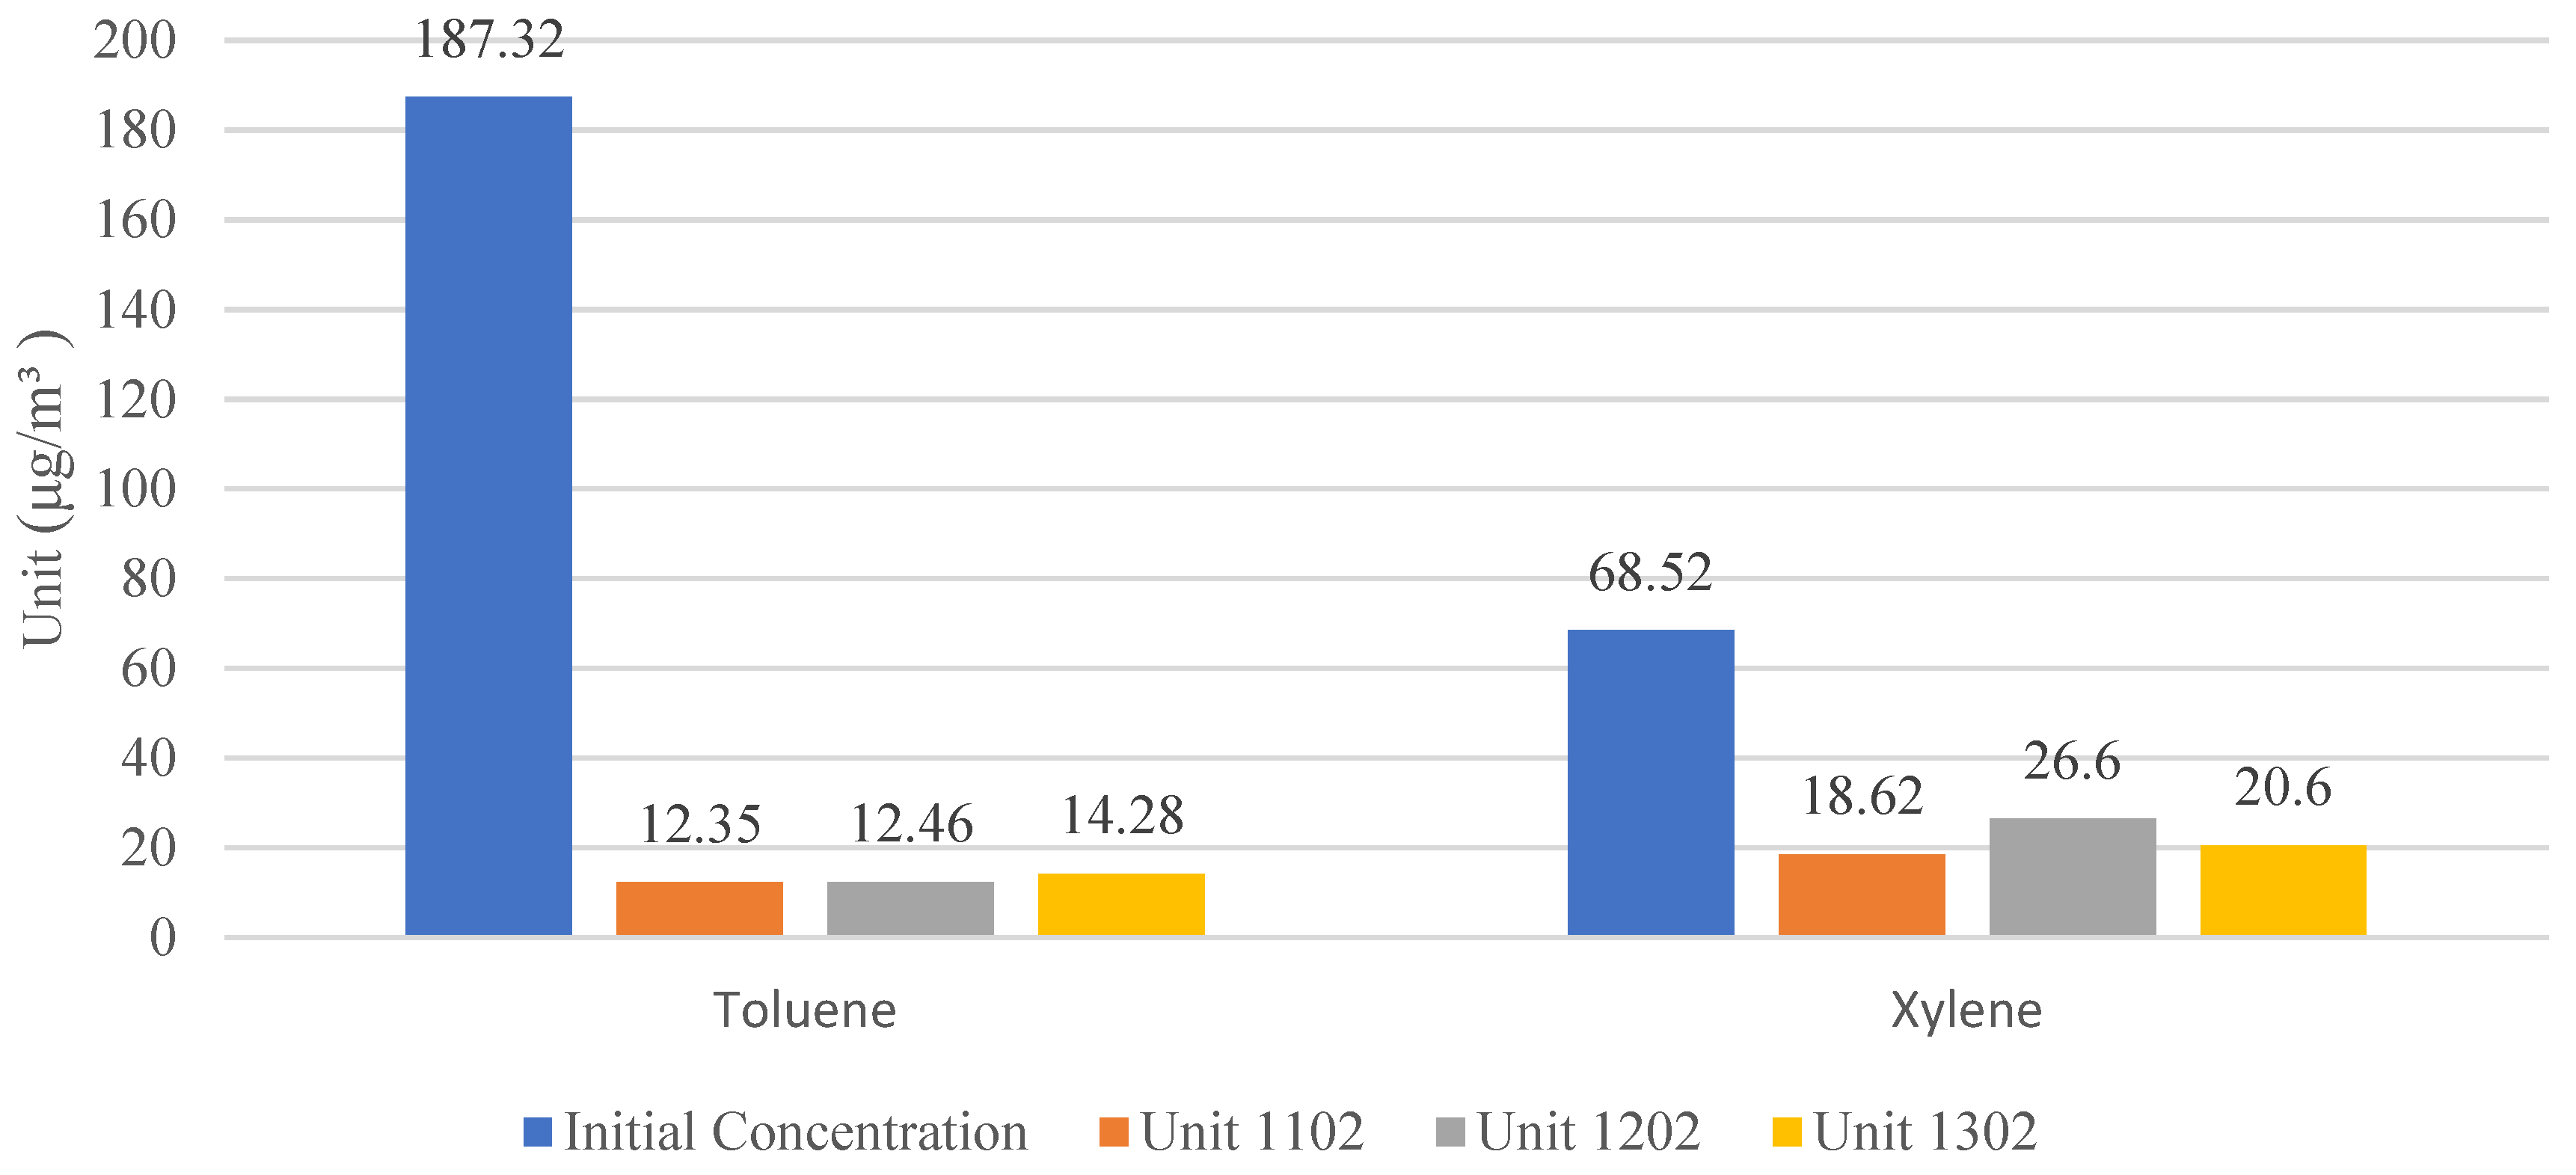
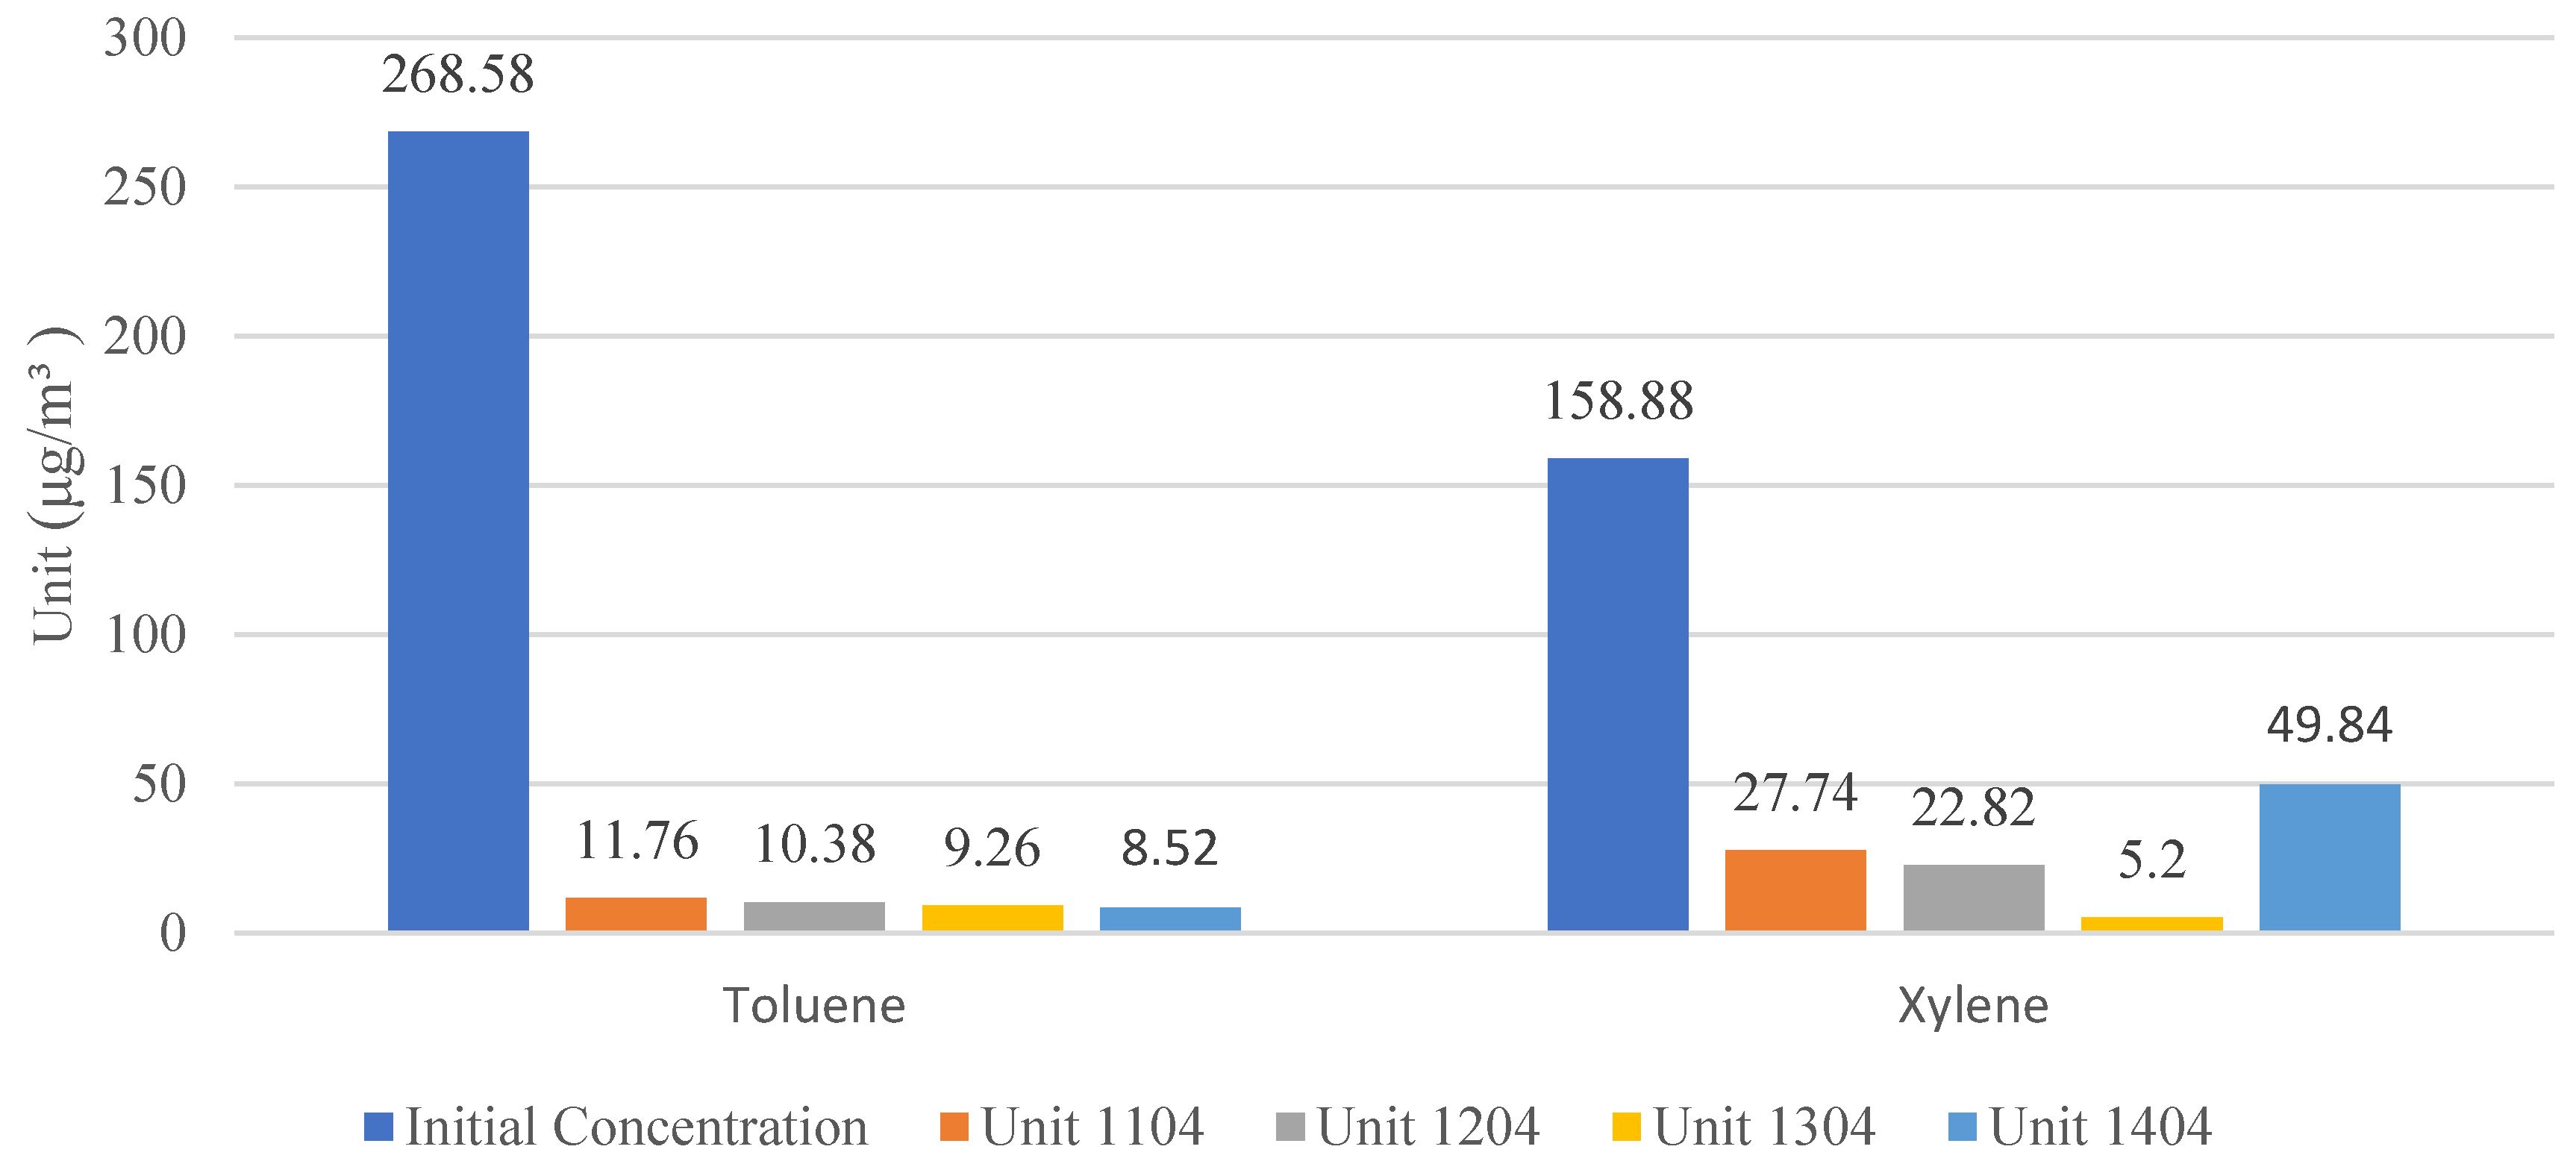
3.2.2. Toluene, Xylene
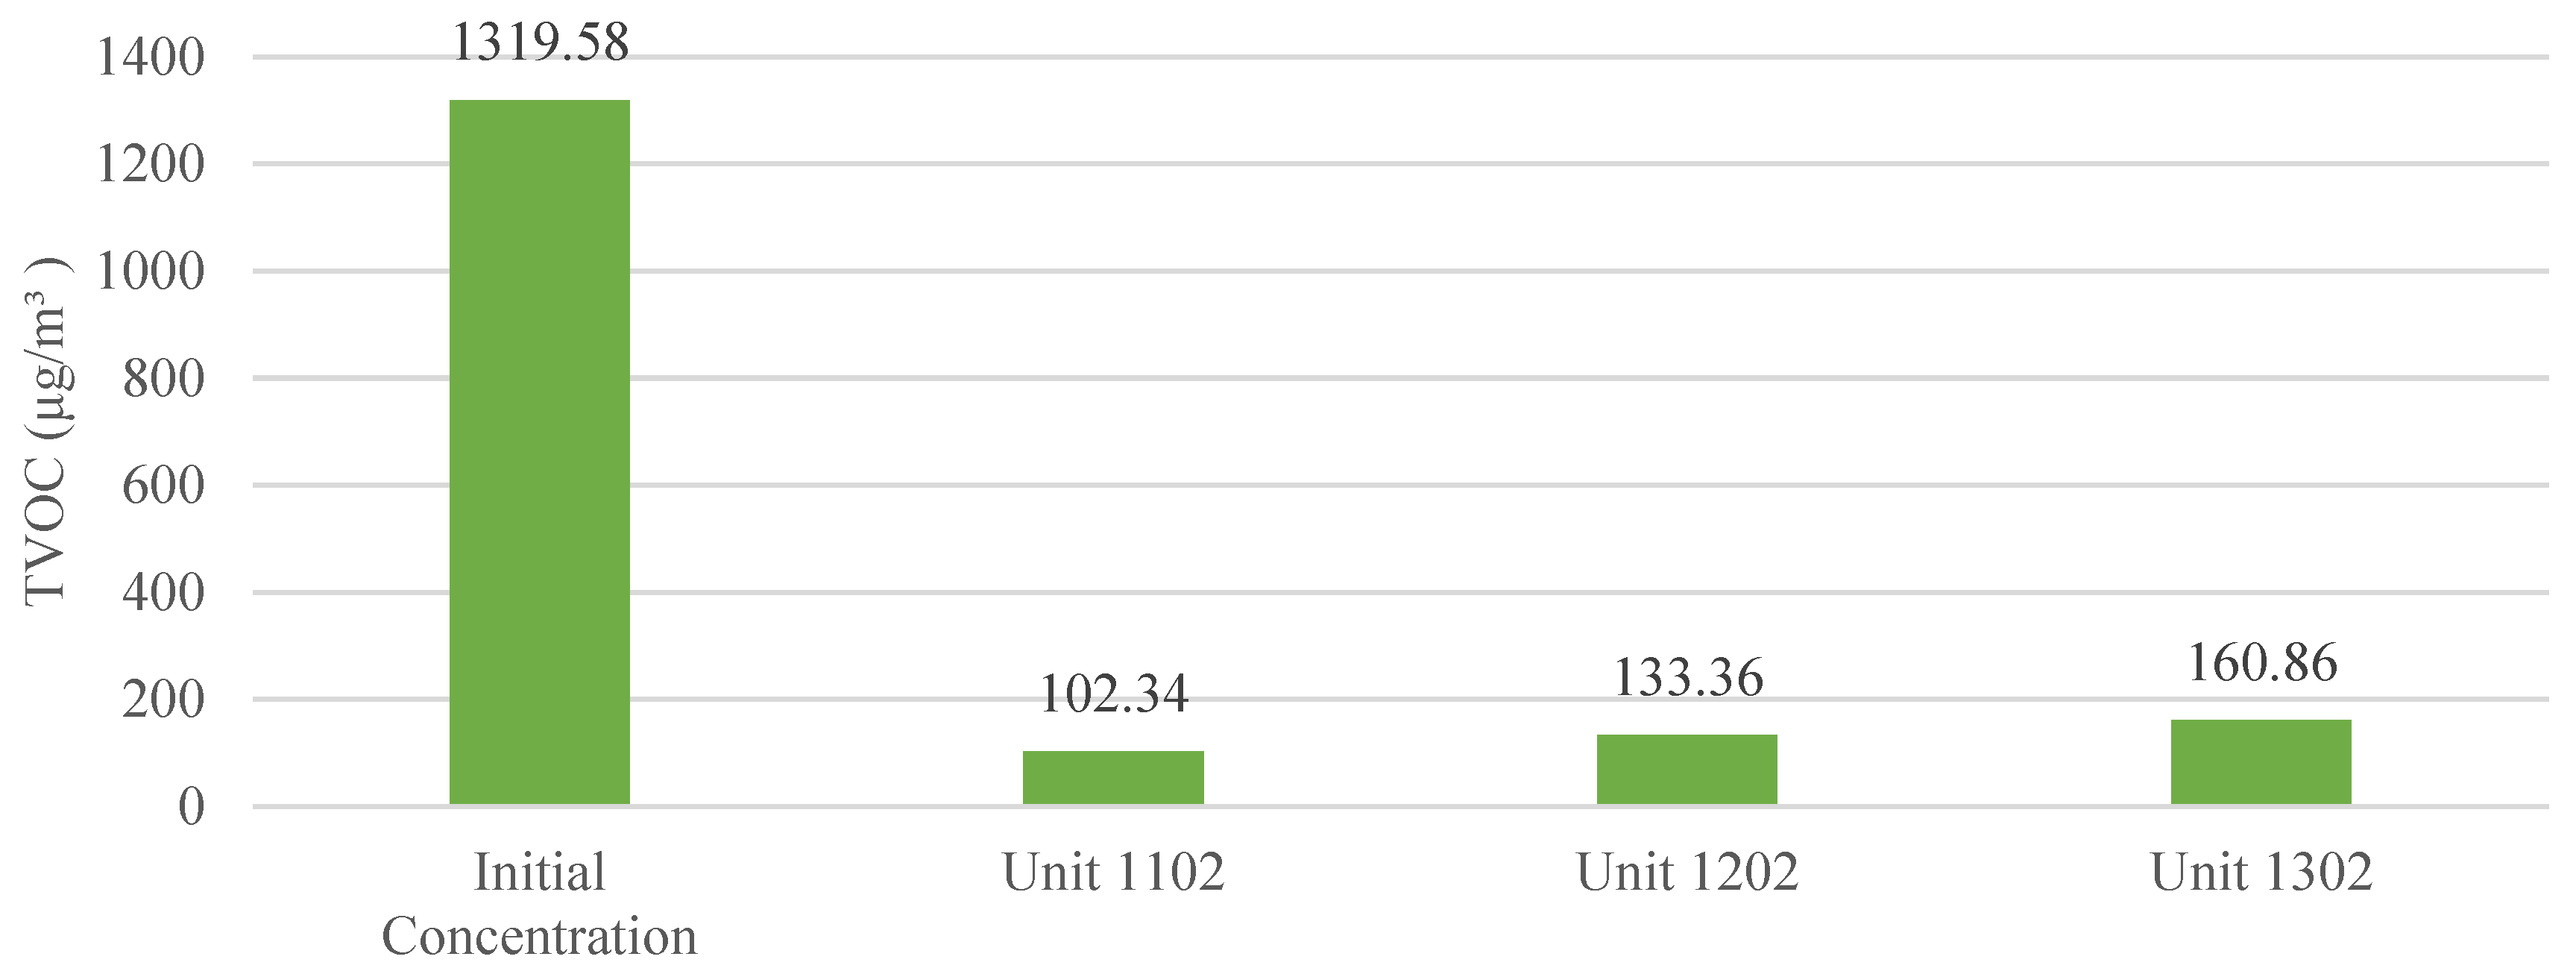
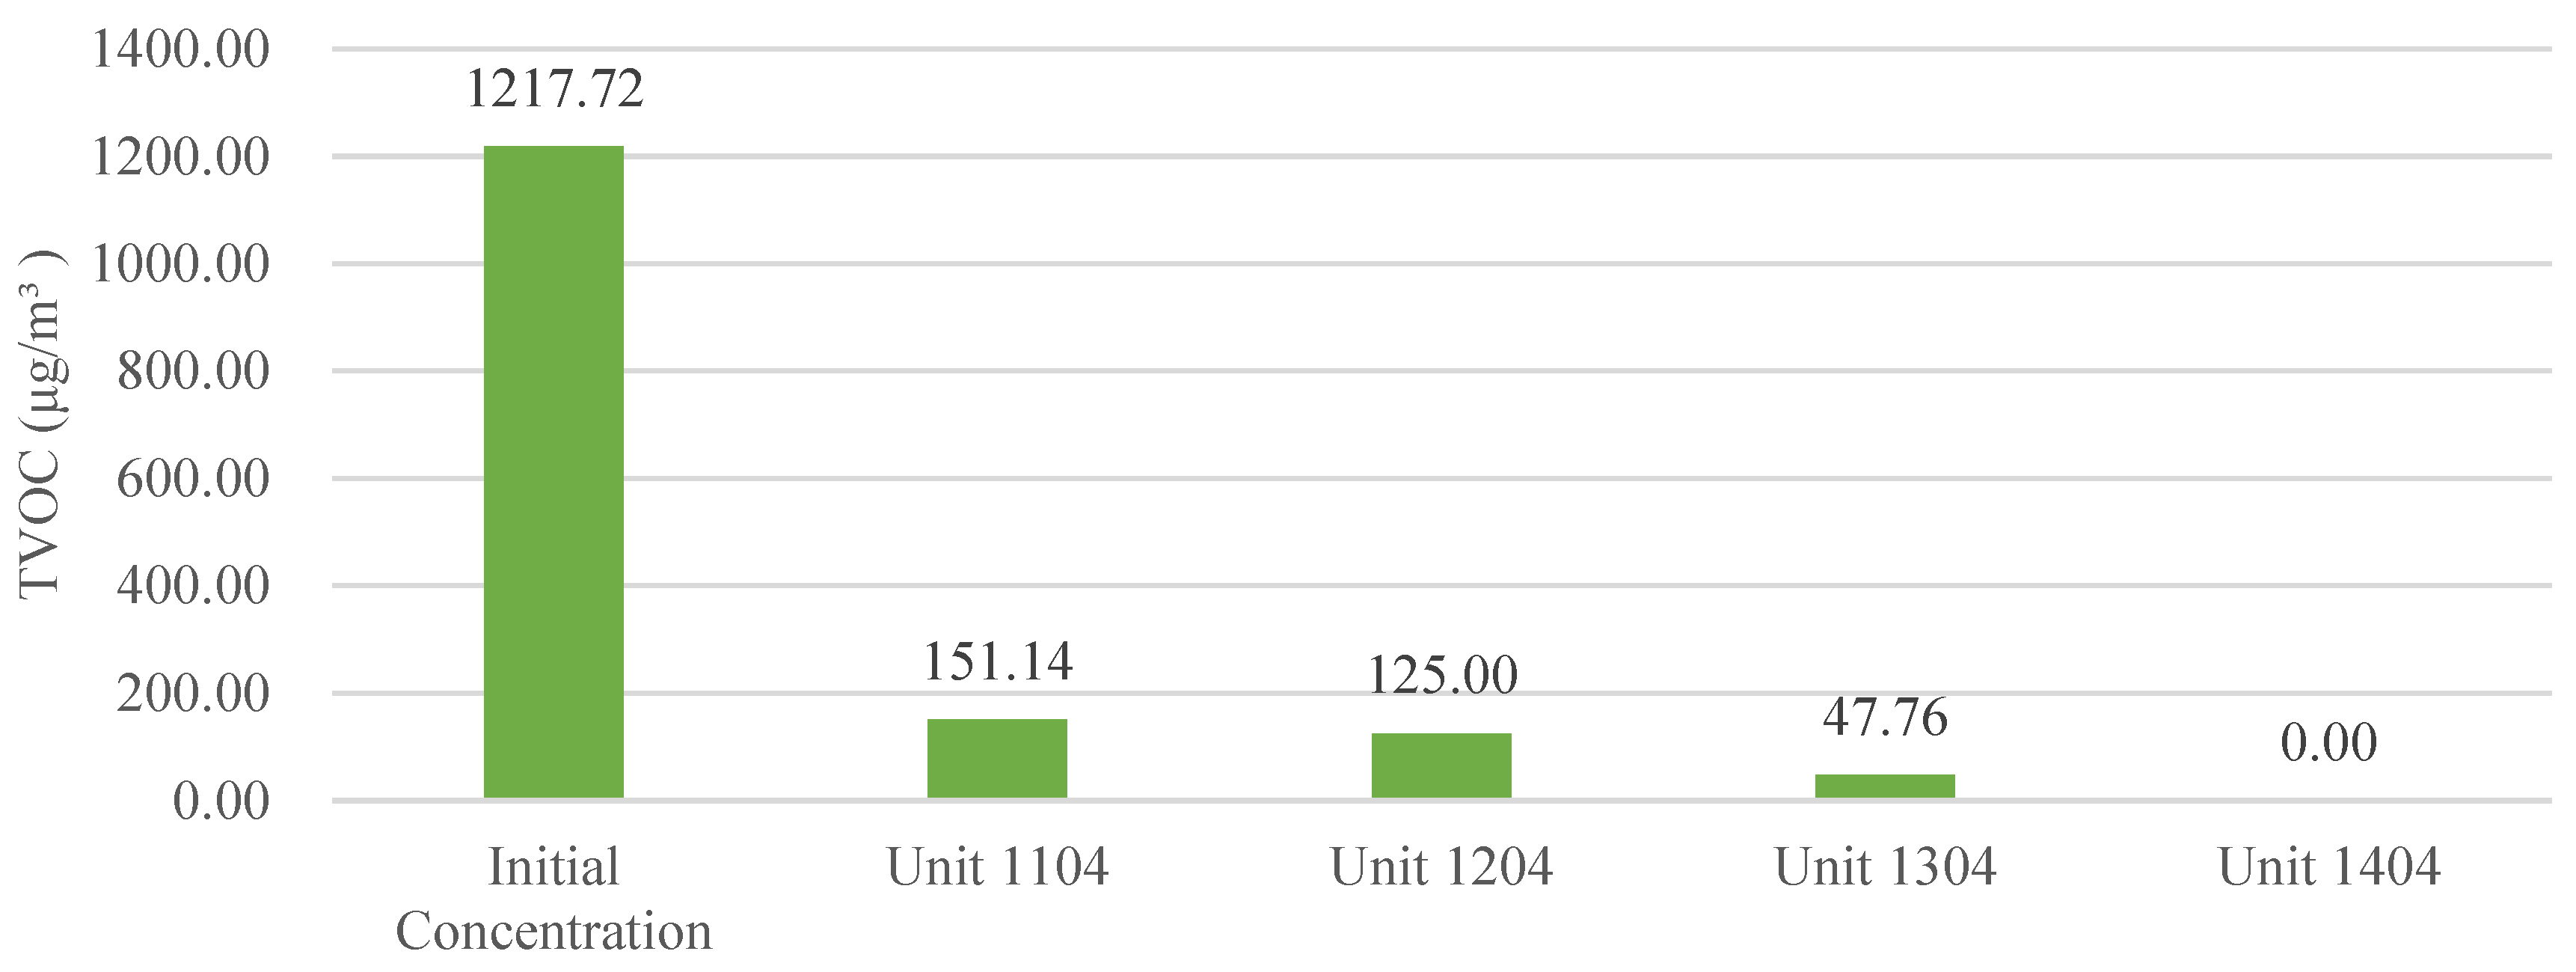
3.2.3. TVOC
4. Discussion
5. Conclusions
- Applying the mechanical exhaust method, using a bathroom exhaust fan in the bedroom, resulted in an HCHO reduction rate of approximately 20% and a TVOC reduction rate of 90% after three weeks. In the living room, utilizing a kitchen exhaust fan and a bathroom exhaust fan led to a significant HCHO reduction rate of about 60% and a high TVOC reduction rate of 96% after the same duration;
- Among the VOCs, the reduction rates of ethylbenzene and xylene pollutants were measured after three weeks for each ventilation method in the bedroom. Similarly, the reduction rates of toluene and xylene pollutants were evaluated in the living room. Notably, the combined use of kitchen and bathroom exhaust fans exhibited remarkable efficiency, achieving a 100% reduction rate for toluene and a 7% reduction rate for xylene in unit 1304;
- Natural ventilation conducted in both the bedroom and living room for 3 weeks before moving into the apartment resulted in a decrease in HCHO concentration ranging from 5% to 35% and a reduction in TVOC concentration ranging from 88% to 92% compared to the immediate post-construction levels;
- Before moving into the apartment, the ventilation method revealed that the third-class mechanical exhaust method, utilizing local ventilation through an exhaust fan to eliminate moisture and odors, was approximately 1 to 1.7 times more effective than the natural ventilation method in reducing HCHO concentrations.
Author Contributions
Funding
Institutional Review Board Statement
Informed Consent Statement
Data Availability Statement
Acknowledgments
Conflicts of Interest
References
- Silva, M.F.; Maas, S.; de Souza, H.A.; Gomes, A.P. Post-occupancy evaluation of residential buildings in Luxembourg with centralized and decentralized ventilation systems, focusing on indoor air quality (IAQ). Assessment by questionnaires and physical measurements. Energy Build. 2017, 148, 119–127. [Google Scholar] [CrossRef]
- Kakoulli, C.; Kyriacou, A.; Michaelides, M.P. A review of field measurement studies on thermal comfort, indoor air quality and virus risk. Atmosphere 2022, 13, 191. [Google Scholar] [CrossRef]
- Jung, C.; Awad, J. The improvement of indoor air quality in residential buildings in Dubai, UAE. Buildings 2021, 11, 250. [Google Scholar] [CrossRef]
- Awad, J.; Jung, C. Evaluating the indoor air quality after renovation at the Greens in Dubai, United Arab Emirates. Buildings 2021, 11, 353. [Google Scholar] [CrossRef]
- Persily, A. Challenges in developing ventilation and indoor air quality standards: The story of ASHRAE Standard 62. Build. Environ. 2015, 91, 61–69. [Google Scholar] [CrossRef] [PubMed]
- Jung, C.; Al Qassimi, N. Investigating the emission of hazardous chemical substances from mashrabiya used for indoor air quality in hot desert climate. Sustainability 2022, 14, 2842. [Google Scholar] [CrossRef]
- Mushtaha, E.; Helmy, O. Impact of building forms on thermal performance and thermal comfort conditions in religious buildings in hot climates: A case study in Sharjah city. Int. J. Sustain. Energy 2017, 36, 926–944. [Google Scholar] [CrossRef]
- Jung, C.; Awad, J.; Sami Abdelaziz Mahmoud, N.; Salameh, M. An analysis of indoor environment evaluation for The Springs development in Dubai, UAE. Open House Int. 2021, 46, 651–667. [Google Scholar] [CrossRef]
- Araki, A.; Ketema, R.M.; Bamai, Y.A.; Kishi, R. Aldehydes, Volatile Organic Compounds (VOCs), and Health. In Indoor Environmental Quality and Health Risk toward Healthier Environment for All; Springer: Singapore, 2020; pp. 129–158. [Google Scholar]
- Sarkhosh, M.; Najafpoor, A.A.; Alidadi, H.; Shamsara, J.; Amiri, H.; Andrea, T.; Kariminejad, F. Indoor Air Quality associations with sick building syndrome: An application of decision tree technology. Build. Environ. 2021, 188, 107446. [Google Scholar] [CrossRef]
- Bani Mfarrej, M.F.; Qafisheh, N.A.; Bahloul, M.M. Investigation of Indoor Air Quality inside Houses From UAE. Air Soil Water Res. 2020, 13, 1178622120928912. [Google Scholar] [CrossRef]
- Ali, M.M.; Al-Kodmany, K. Tall Buildings and Urban Habitat of the 21st Century: A Global Perspective. Buildings 2012, 2, 384–423. [Google Scholar] [CrossRef]
- Chen, J.; Brager, G.S.; Augenbroe, G.; Song, X. Impact of Outdoor Air Quality on the Natural Ventilation Usage of Commercial Buildings in the US. Appl. Energy 2019, 235, 673–684. [Google Scholar] [CrossRef]
- Jung, C.; Al Qassimi, N.; Arar, M.; Awad, J. The Improvement of User Satisfaction for Two Urban Parks in Dubai, UAE: Bay Avenue Park and Al Ittihad Park. Sustainability 2022, 14, 3460. [Google Scholar] [CrossRef]
- Arar, M.; Jung, C.; Qassimi, N.A. Investigating the influence of the building material on the indoor air quality in apartments in Dubai. Front. Built Environ. 2022, 7, 804216. [Google Scholar] [CrossRef]
- Jung, C.; Al Qassimi, N.; Arar, M.; Awad, J. The Analysis of Indoor Air Pollutants From Finishing Material of New Apartments at Business Bay, Dubai. Front. Built Environ. 2021, 7, 765689. [Google Scholar] [CrossRef]
- Arar, M.; Jung, C. Analyzing the Perception of Indoor Air Quality (IAQ) from a Survey of New Townhouse Residents in Dubai. Sustainability 2022, 14, 15042. [Google Scholar] [CrossRef]
- Maghrabie, H.M.; Abdelkareem, M.A.; Al-Alami, A.H.; Ramadan, M.; Mushtaha, E.; Wilberforce, T.; Olabi, A.G. State-of-the-art technologies for building-integrated photovoltaic systems. Buildings 2021, 11, 383. [Google Scholar] [CrossRef]
- Jung, C.; Awad, J.; Chohan, A. The planning of smart elderly housing in Dubai with IoT technologies. Open House Int. 2021, 46, 668–681. [Google Scholar] [CrossRef]
- Jung, C.; El Samanoudy, G. Mitigating Indoor Air Pollution in University Dormitory: The Need for Better Ventilation and Resident Awareness. Buildings 2023, 13, 1144. [Google Scholar] [CrossRef]
- Bai, H.Y.; Liu, P.; Alonso, M.J.; Mathisen, H.M. A Review of Heat Recovery Technologies and Their Frost Control for Residential Building Ventilation in Cold Climate Regions. Renew. Sustain. Energy Rev. 2022, 162, 112417. [Google Scholar] [CrossRef]
- Alwetaishi, M.; Gadi, M. New and innovative wind catcher designs to improve indoor air quality in buildings. Energy Built Environ. 2021, 2, 337–344. [Google Scholar] [CrossRef]
- Al Qassimi, N.; Jung, C. Impact of Air-Purifying Plants on the Reduction of Volatile Organic Compounds in the Indoor Hot Desert Climate. Front. Built Environ. 2022, 7, 188. [Google Scholar] [CrossRef]
- Abdelaziz Mahmoud, N.S.; Jung, C. Analyzing the Bake-Out Effect in Winter for the Enhancement of Indoor Air Quality at New Apartments in UAE. Buildings 2023, 13, 846. [Google Scholar] [CrossRef]
- Jung, C.; Mahmoud, N.S.A. Extracting the Critical Points of Formaldehyde (HCHO) Emission Model in Hot Desert Climate. Air Soil Water Res. 2022, 15, 11786221221105082. [Google Scholar] [CrossRef]
- Kharrufa, S.N.; Awad, J.; Jung, C.; Sherzad, M. Evaluating an active low-energy cooling upgrade to the building envelope in the hot climates of the Middle East. Int. J. Low-Carbon Technol. 2022, 17, 118–129. [Google Scholar] [CrossRef]
- Izadyar, N.; Miller, W.; Rismanchi, B.; Garcia-Hansen, V. Impacts of façade openings’ geometry on natural ventilation and occupants’ perception: A review. Build. Environ. 2020, 170, 106613. [Google Scholar] [CrossRef]
- Dodoo, A.; Gustavsson, L.; Sathre, R. Primary energy implications of ventilation heat recovery in residential buildings. Energy Build. 2011, 43, 1566–1572. [Google Scholar] [CrossRef]
- Cao, X.; Yang, C.; Sun, Z.; Lu, Y.M.; Chang, M.M.; Shao, L.L.; Zhang, C.L. A novel packaged outdoor air dehumidifier with exhaust air heat pump–Experiment and simulation. Appl. Therm. Eng. 2020, 181, 115986. [Google Scholar] [CrossRef]
- Jung, C.; Al Qassimi, N.; Abdelaziz Mahmoud, N.S.; Lee, S.Y. Analyzing the Housing Consumer Preferences via Analytic Hierarchy Process (AHP) in Dubai, United Arab Emirates. Behav. Sci. 2022, 12, 327. [Google Scholar] [CrossRef]
- Zhao, L.; Liu, J. Physical Environmental and Behavioral Drivers of Heat Recovery Ventilation System Feasibility in Various Climate Zones. Energy Convers. Manag. 2022, 259, 115586. [Google Scholar] [CrossRef]
- Jung, C.; Awad, J.; Al Qassimi, N. Evaluation of residents’ comfort in high-rise residential buildings in Dubai, United Arab Emirates. Front. Built Environ. 2021, 7, 766057. [Google Scholar] [CrossRef]
- Mushtaha, E.; Salameh, T.; Kharrufa, S.; Mori, T.; Aldawoud, A.; Hamad, R.; Nemer, T. The impact of passive design strategies on cooling loads of buildings in temperate climate. Case Stud. Therm. Eng. 2021, 28, 101588. [Google Scholar] [CrossRef]
- Taheri, S.; Razban, A. Learning-based CO2 concentration prediction: Application to indoor air quality control using demand-controlled ventilation. Build. Environ. 2021, 205, 108164. [Google Scholar] [CrossRef]
- Kang, S.H.; Kim, H.J.; Cho, Y.H. A study on the control method of single duct VAV terminal unit through the determination of proper minimum air flow. Energy Build. 2014, 69, 464–472. [Google Scholar] [CrossRef]
- Taal, A.; Itard, L. Fault detection and diagnosis for indoor air quality in DCV systems: Application of 4S3F method and effects of DBN probabilities. Build. Environ. 2020, 174, 106632. [Google Scholar] [CrossRef]
- Tapia-Brito, E.; Riffat, J.; Wang, Y.; Wang, Y.; Ghaemmaghami, A.M.; Coleman, C.M.; Erdinç, M.T.; Riffat, S. Experimental study of the purification performance of a MopFan-based photocatalytic air cleaning system. Build. Environ. 2023, 240, 110422. [Google Scholar] [CrossRef]
- Mushtaha, E.; Shareef, S.; Alsyouf, I.; Mori, T.; Kayed, A.; Abdelrahim, M.; Albannay, S. A study of the impact of major Urban Heat Island factors in a hot climate courtyard: The case of the University of Sharjah, UAE. Sustain. Cities Soc. 2021, 69, 102844. [Google Scholar] [CrossRef]
- Lee, S.; Hwangbo, S.; Kim, J.T.; Yoo, C.K. Gain scheduling based ventilation control with varying periodic indoor air quality (IAQ) dynamics for healthy IAQ and energy savings. Energy Build. 2017, 153, 275–286. [Google Scholar] [CrossRef]
- Heo, S.; Nam, K.; Loy-Benitez, J.; Li, Q.; Lee, S.; Yoo, C. A deep reinforcement learning-based autonomous ventilation control system for smart indoor air quality management in a subway station. Energy Build. 2019, 202, 109440. [Google Scholar] [CrossRef]
- Mushtaha, E.; Alsyouf, I.; Al Labadi, L.; Hamad, R.; Khatib, N.; Al Mutawa, M. Application of AHP and a mathematical index to estimate livability in tourist districts: The case of Al Qasba in Sharjah. Front. Archit. Res. 2020, 9, 872–889. [Google Scholar] [CrossRef]
- Basińska, M.; Michałkiewicz, M.; Ratajczak, K. Effect of Air Purifier Use in the Classrooms on Indoor Air Quality—Case Study. Atmosphere 2021, 12, 1606. [Google Scholar] [CrossRef]
- Tsoulou, I.; Senick, J.; Mainelis, G.; Kim, S. Residential indoor air quality interventions through a social-ecological systems lens: A systematic review. Indoor Air 2021, 31, 958–976. [Google Scholar] [CrossRef] [PubMed]
- Wang, Y.; Tahmasebi, F.; Cooper, E.; Stamp, S.; Chalabi, Z.; Burman, E.; Mumovic, D. An investigation of the influencing factors for occupants’ operation of windows in apartments equipped with portable air purifiers. Build. Environ. 2021, 205, 108260. [Google Scholar] [CrossRef]
- Hussien, A.; Saleem, A.A.; Mushtaha, E.; Jannat, N.; Al-Shammaa, A.; Ali, S.B.; Assi, S.; Al-Jumeily, D. A statistical analysis of life cycle assessment for buildings and buildings’ refurbishment research. Ain Shams Eng. J. 2023, 14, 102143. [Google Scholar] [CrossRef]
- Johnson, D.L.; Lynch, R.A.; Floyd, E.L.; Wang, J.; Bartels, J.N. Indoor air quality in classrooms: Environmental measures and effective ventilation rate modeling in urban elementary schools. Build. Environ. 2018, 136, 185–197. [Google Scholar] [CrossRef]
- Loy-Benitez, J.; Li, Q.; Ifaei, P.; Nam, K.; Heo, S.; Yoo, C. A dynamic gain-scheduled ventilation control system for a subway station based on outdoor air quality conditions. Build. Environ. 2018, 144, 159–170. [Google Scholar] [CrossRef]
- Zender–Świercz, E. Improvement of indoor air quality by way of using decentralised ventilation. J. Build. Eng. 2020, 32, 101663. [Google Scholar] [CrossRef]
- Heracleous, C.; Michael, A. Experimental assessment of the impact of natural ventilation on indoor air quality and thermal comfort conditions of educational buildings in the Eastern Mediterranean region during the heating period. J. Build. Eng. 2019, 26, 100917. [Google Scholar] [CrossRef]
- Tsai, W.T. A comparative study on the statutory and technical regulations for controlling indoor volatile organic compounds in Taiwan and Japan. Atmosphere 2018, 9, 195. [Google Scholar] [CrossRef]
- Settimo, G.; Manigrasso, M.; Avino, P. Indoor air quality: A focus on the European legislation and state-of-the-art research in Italy. Atmosphere 2020, 11, 370. [Google Scholar] [CrossRef]
- Amoatey, P.; Omidvarborna, H.; Baawain, M.S.; Al-Mamun, A. Indoor air pollution and exposure assessment of the gulf cooperation council countries: A critical review. Environ. Int. 2018, 121, 491–506. [Google Scholar] [CrossRef] [PubMed]
- Kotol, M. Current ventilation strategies in Greenlandic dwellings. J. Build. Eng. 2021, 39, 102283. [Google Scholar] [CrossRef]
- Man, X.; Lu, Y.; Li, G.; Wang, Y.; Liu, J. A study on the stack effect of a super high-rise residential building in a severe cold region in China. Indoor Built Environ. 2020, 29, 255–269. [Google Scholar] [CrossRef]
- Raji, B.; Tenpierik, M.J.; Bokel, R.; van den Dobbelsteen, A. Natural summer ventilation strategies for energy-saving in high-rise buildings: A case study in the Netherlands. Int. J. Vent. 2020, 19, 25–48. [Google Scholar] [CrossRef]
- Lozinsky, C.H.; Touchie, M.F. Inter-zonal airflow in multi-unit residential buildings: A review of the magnitude and interaction of driving forces, measurement techniques and magnitudes, and its impact on building performance. Indoor Air 2020, 30, 1083–1108. [Google Scholar] [CrossRef] [PubMed]
- Salehi, A.; Torres, I.; Ramos, A. Assessment of ventilation effectiveness in exiting residential building in mediterranean countries: Case study, existing residential building in Portugal. Sustain. Cities Soc. 2017, 32, 496–507. [Google Scholar] [CrossRef]
- Hussien, A.; Jannat, N.; Mushtaha, E.; Al-Shammaa, A. A holistic plan of flat roof to green-roof conversion: Towards a sustainable built environment. Ecol. Eng. 2023, 190, 106925. [Google Scholar] [CrossRef]
- Carlsson, M.; Touchie, M.; Richman, R. Investigating the potential impact of a compartmentalization and ventilation system retrofit strategy on energy use in high-rise residential buildings. Energy Build. 2019, 199, 20–28. [Google Scholar] [CrossRef]
- Lim, E.; Sandberg, M.; Ito, K. Returning characteristics of pollutants for a local domain in the presence of returning and recirculating airflow in indoor environments. Indoor Air 2021, 31, 1267–1280. [Google Scholar] [CrossRef]
- Jiang, Z.; Kobayashi, T.; Yamanaka, T.; Sandberg, M.; Kobayashi, N.; Choi, N.; Sano, K. Validity of Orifice Equation and Impact of Building Parameters on Wind-Induced Natural Ventilation Rates with Minute Mean Wind Pressure Difference. Build. Environ. 2022, 219, 109248. [Google Scholar] [CrossRef]
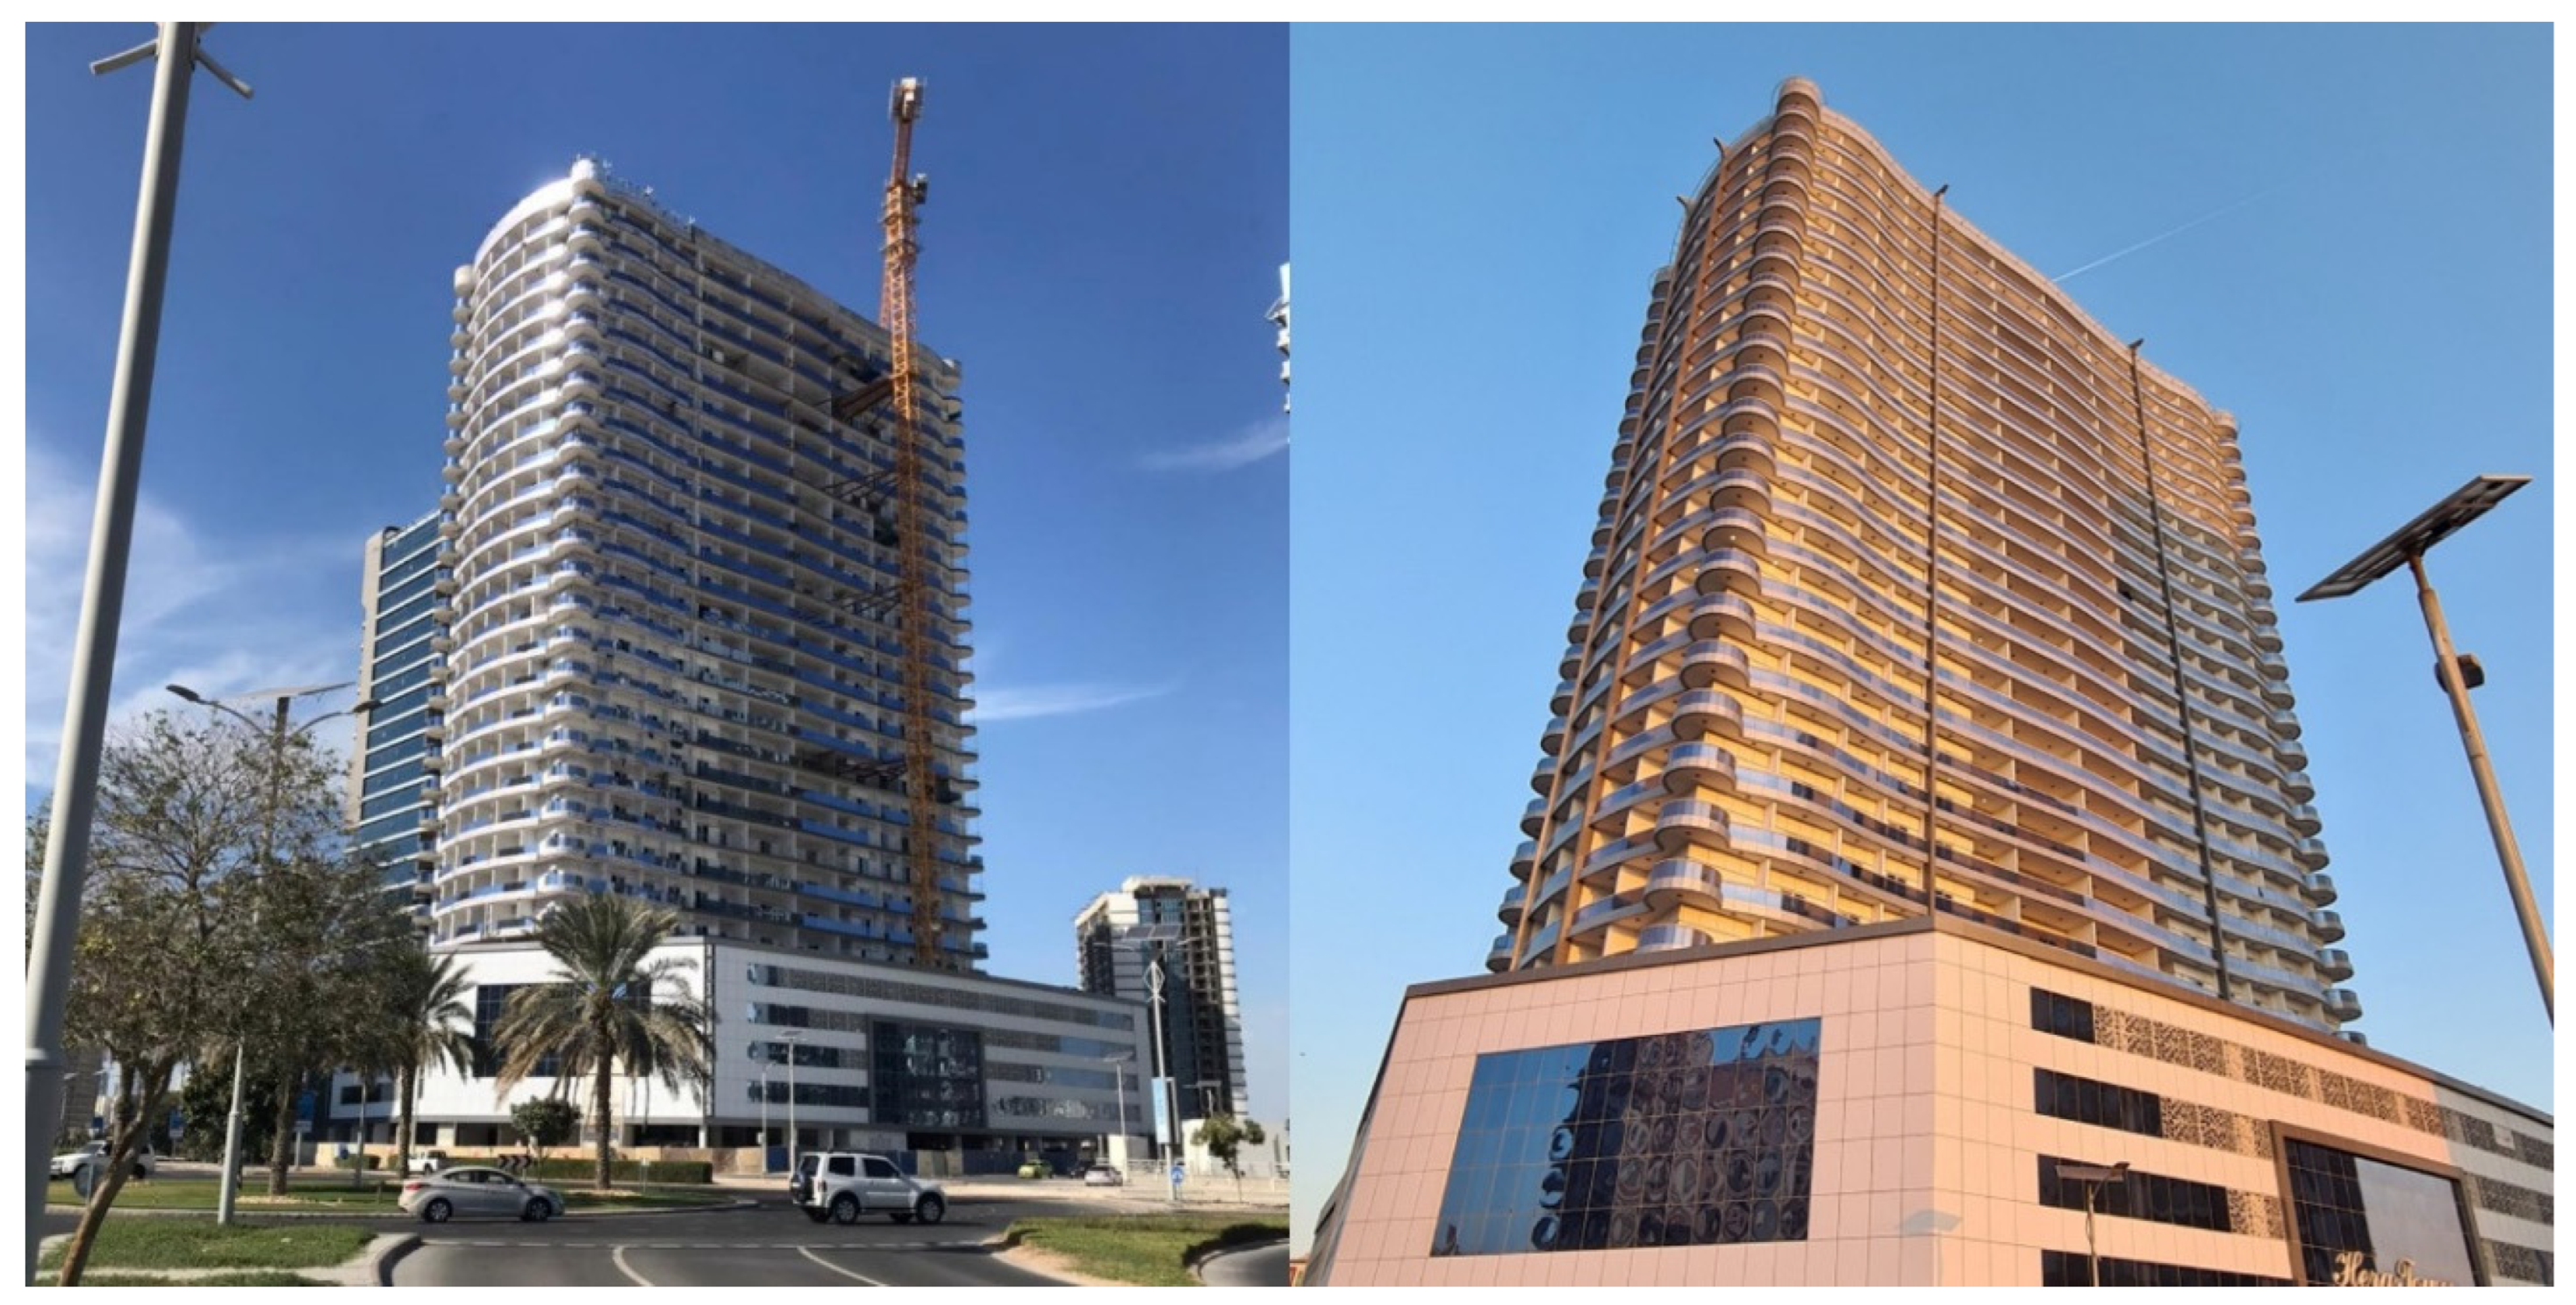
- Fam Properties Hera Tower Apartments—Dubai Sports City by Titans Development. 2023. Available online: https://famproperties.com/dubai-sports-city/hera-tower-apartments (accessed on 10 September 2023).
- Thevenet, F.; Debono, O.; Rizk, M.; Caron, F.; Verriele, M.; Locoge, N. VOC uptakes on gypsum boards: Sorption performances and impact on indoor air quality. Build. Environ. 2018, 137, 138–146. [Google Scholar] [CrossRef]
- Licina, D.; Langer, S. Indoor air quality investigation before and after relocation to WELL-certified office buildings. Build. Environ. 2021, 204, 108182. [Google Scholar] [CrossRef]
- Orecchio, S.; Fiore, M.; Barreca, S.; Vara, G. Volatile profiles of emissions from different activities analyzed using canister samplers and gas chromatography-mass spectrometry (GC/MS) analysis: A case study. Int. J. Environ. Res. Public Health 2017, 14, 195. [Google Scholar] [CrossRef] [PubMed]
- Xiang, Z.; Wang, H.; Stevanovic, S.; Jing, S.; Lou, S.; Tao, S.; Li, L.; Liu, J.; Yu, M.; Wang, L. Assessing impacts of factors on carbonyl compounds emissions produced from several typical Chinese cooking. Build. Environ. 2017, 125, 348–355. [Google Scholar] [CrossRef]
- Babaoglu, U.T.; Milletli Sezgin, F.; Yag, F. Sick building symptoms among hospital workers associated with indoor air quality and personal factors. Indoor Built Environ. 2020, 29, 645–655. [Google Scholar] [CrossRef]
- Yu, S.J.; Kwon, M.K.; Choi, W.; Son, Y.S. Preliminary study on the effect of using heat-not-burn tobacco products on indoor air quality. Environ. Res. 2022, 212, 113217. [Google Scholar] [CrossRef]
- Xu, L.; Hu, Y.; Liang, W. Composition and correlation of volatile organic compounds and odor emissions from typical indoor building materials based on headspace analysis. Build. Environ. 2022, 221, 109321. [Google Scholar] [CrossRef]
- Meng, X.; Wang, Y.; Xing, X.; Xu, Y. Experimental study on the performance of hybrid buoyancy-driven natural ventilation with a mechanical exhaust system in an industrial building. Energy Build. 2020, 208, 109674. [Google Scholar] [CrossRef]
- Yin, H.; Li, Z.; Zhai, X.; Ning, Y.; Gao, L.; Cui, H.; Ma, Z.; Li, A. Field measurement of the impact of natural ventilation and portable air cleaners on indoor air quality in three occupant states. Energy Built Environ. 2023, 4, 601–613. [Google Scholar] [CrossRef]
- Gonzalo, F.D.A.; Griffin, M.; Laskosky, J.; Yost, P.; González-Lezcano, R.A. Assessment of indoor air quality in residential buildings of New England through actual data. Sustainability 2022, 14, 739. [Google Scholar] [CrossRef]
- Liu, S.; Song, R.; Zhang, T.T. Residential building ventilation in situations with outdoor PM2. 5 pollution. Build. Environ. 2021, 202, 108040. [Google Scholar] [CrossRef]
- Bonato, P.; D’Antoni, M.; Fedrizzi, R. Modelling and simulation-based analysis of a façade-integrated decentralized ventilation unit. J. Build. Eng. 2020, 29, 101183. [Google Scholar] [CrossRef]
- Belmonte, J.F.; Barbosa, R.; Almeida, M.G. CO2 concentrations in a multifamily building in Porto, Portugal: Occupants’ exposure and differential performance of mechanical ventilation control strategies. J. Build. Eng. 2019, 23, 114–126. [Google Scholar] [CrossRef]
- Coggins, A.M.; Wemken, N.; Mishra, A.K.; Sharkey, M.; Horgan, L.; Cowie, H.; Bourdin, E.; McIntyre, B. Indoor air quality, thermal comfort and ventilation in deep energy retrofitted Irish dwellings. Build. Environ. 2022, 219, 109236. [Google Scholar] [CrossRef]
- Salis, L.C.R.; Abadie, M.; Wargocki, P.; Rode, C. Towards the definition of indicators for assessment of indoor air quality and energy performance in low-energy residential buildings. Energy Build. 2017, 152, 492–502. [Google Scholar] [CrossRef]

| Hazardous Substances | Sources | The Effects on the Human Body | |
|---|---|---|---|
| Formaldehyde (HCHO) |
|
| |
| Volatile Organic Compounds (VOCs) | Benzene (C6H6) |
|
|
| Toluene (C7H8) |
|
| |
| Ethylbenzene (C8H10) |
|
| |
| Xylene (C8H10) |
|
| |
| Styrene (C8H8) |
|
| |
| Hazardous Substances | Concentration (µg/m3) | |
|---|---|---|
| Formaldehyde (HCHO) | 210 | |
| Volatile Organic Compounds (VOCs) | Benzene (C6H6) | 30 |
| Toluene (C7H8) | 1000 | |
| Ethylbenzene (C8H10) | 360 | |
| Xylene (C8H10) | 700 | |
| Styrene (C8H8) | 300 | |
| Outlet Area/Inlet Area | Correction Factor |
|---|---|
| 5 | 1.38 |
| 4 | 1.37 |
| 3 | 1.33 |
| 2 | 1.26 |
| 1 | 1.00 |
| 0.75 | 0.84 |
| 0.50 | 0.63 |
| 0.25 | 0.34 |
| Indoor Air Pollutants | Measurement Method and Equipment |
|---|---|
| VOCs |
|
| TVOC | |
| HCHO |
|
| Temperature, Humidity, Air Pressure, CO, CO2, NO2 |
|
| Category | Ventilation Type | ||
|---|---|---|---|
| Bedroom | 1102 | Natural Ventilation |
|
| 1202 | Mechanical Exhaust |
| |
| 1302 | Natural Ventilation + Mechanical Exhaust |
| |
| Living Room | 1104 | Natural Ventilation |
|
| 1204 | Mechanical Exhaust-A |
| |
| 1304 | Mechanical Exhaust-B |
| |
| 1404 | Natural Ventilation + Mechanical Exhaust-B |
| |
| Category | Ventilation Type | Indoor Airflow | Balcony Airflow | Ventilation Amount (m3/h) | |
|---|---|---|---|---|---|
| Bedroom | 1102 | Natural Ventilation | 0.09 | 1.32 | Natural ventilation: 2182 |
| 1202 | Mechanical Exhaust | N/A | 1.01 | Exhaust: 90 (bathroom fan: 60 m3/h) | |
| 1302 | Natural Ventilation + Mechanical Exhaust | 0.05 | 0.83 | Natural ventilation: 1372 Exhaust: 90 | |
| Living Room | 1104 | Natural Ventilation | 0.33 | 1.22 | Natural ventilation: 2148 |
| 1204 | Mechanical Exhaust-A | N/A | 1.10 | Exhaust: 90 (bathroom fan: 60 m3/h) | |
| 1304 | Mechanical Exhaust-B | N/A | 1.04 | Exhaust: 500 (bathroom fan: 60 m3/h/ kitchen hood fan: 410 m3/h) | |
| 1404 | Natural Ventilation + Mechanical Exhaust-B | 0.36 | 1.33 | Natural ventilation: 2034 Exhaust: 500 | |
| VOCs | Initial Concentration (μg/m3) | Unit 1102 (μg/m3) | Unit 1202 (μg/m3) | Unit 1302 (μg/m3) |
|---|---|---|---|---|
| Benzene (C6H6) | 1.52 | 0.48 | 0.46 | 0.56 |
| Toluene (C7H8) | 187.32 | 12.35 | 12.46 | 14.28 |
| Ethylbenzene (C8H10) | 31.56 | 5.86 | 9.34 | 7.32 |
| Xylene (C8H10) | 68.52 | 18.62 | 26.6 | 20.6 |
| Styrene (C8H8) | 2.22 | 0.64 | 0.92 | 1.02 |
| TVOC | 1319.58 | 102.34 | 133.36 | 160.86 |
| VOCs | Initial Concentration (μg/m3) | Unit 1104 (μg/m3) | Unit 1204 (μg/m3) | Unit 1304 (μg/m3) | Unit 1404 (μg/m3) |
|---|---|---|---|---|---|
| Benzene (C6H6) | 1.08 | 0.48 | 0.46 | 0.50 | 1.04 |
| Toluene (C7H8) | 268.58 | 11.76 | 10.38 | 9.26 | 8.52 |
| Ethylbenzene (C8H10) | 68.56 | 9.66 | 7.32 | 0.1 | 23.6 |
| Xylene (C8H10) | 158.88 | 27.74 | 22.82 | 5.2 | 49.84 |
| Styrene (C8H8) | 0.00 | 0.98 | 0.82 | 0.68 | 4.10 |
| TVOC | 1217.72 | 151.14 | 125.00 | 47.76 | N/A |
Disclaimer/Publisher’s Note: The statements, opinions and data contained in all publications are solely those of the individual author(s) and contributor(s) and not of MDPI and/or the editor(s). MDPI and/or the editor(s) disclaim responsibility for any injury to people or property resulting from any ideas, methods, instructions or products referred to in the content. |
© 2023 by the authors. Licensee MDPI, Basel, Switzerland. This article is an open access article distributed under the terms and conditions of the Creative Commons Attribution (CC BY) license (https://creativecommons.org/licenses/by/4.0/).
Share and Cite
Jung, C.; Abdelaziz Mahmoud, N.S. Ventilation Strategies for Mitigating Indoor Air Pollutants in High-Rise Residential Buildings: A Case Study in Dubai. Atmosphere 2023, 14, 1600. https://doi.org/10.3390/atmos14111600
Jung C, Abdelaziz Mahmoud NS. Ventilation Strategies for Mitigating Indoor Air Pollutants in High-Rise Residential Buildings: A Case Study in Dubai. Atmosphere. 2023; 14(11):1600. https://doi.org/10.3390/atmos14111600
Chicago/Turabian StyleJung, Chuloh, and Naglaa Sami Abdelaziz Mahmoud. 2023. "Ventilation Strategies for Mitigating Indoor Air Pollutants in High-Rise Residential Buildings: A Case Study in Dubai" Atmosphere 14, no. 11: 1600. https://doi.org/10.3390/atmos14111600
APA StyleJung, C., & Abdelaziz Mahmoud, N. S. (2023). Ventilation Strategies for Mitigating Indoor Air Pollutants in High-Rise Residential Buildings: A Case Study in Dubai. Atmosphere, 14(11), 1600. https://doi.org/10.3390/atmos14111600