Abstract
An updated climatology of EF1+ (Enhanced Fujita category 1 or stronger) tornadoes in Italy (445 events in the period of 1990–2021) confirms that the central Tyrrhenian (CT) and the southeastern (SE) regions of the Italian peninsula represent two of the areas most affected by tornadoes in the Mediterranean. We performed a comparative analysis between these two hotspots, examining the large-scale atmospheric features associated to the tornado occurrences, throughout the analysis of radiosounding observations and reanalysis (ERA5) fields. The conditions in which the tornadoes develop are investigated using metrics regarding atmospheric instability and/or horizontal/vertical wind shear. Common synoptic characteristics are found for both regions, i.e., a prevalent occurrence of tornadoes on the eastern flank of approaching troughs, with moderate shear/CAPE mean values. A large number of events develop in a high-shear/low-CAPE (HSLC) environment, in the presence of positive sea surface and 850 hPa temperature anomalies. Conversely, the upper-level winds suggest different characteristics of the tornado-spawning cells in the two areas, i.e., multi-cells/linear systems for CT and isolated supercells for SE. The maximum values for some typical atmospheric fields/instability parameters in the areas around the tornado hotspots permit the obtention of thresholds that identify the most favorable environments for tornado formation in these Italian areas.
1. Introduction
The growing attention by the scientific community and civil society on hazardous weather phenomena and environmental disasters has led to a significant increase in tornado research interest, not only confined to the USA as in the past, but also extended to other mid-latitude countries. European tornadoes have been analyzed in several works, either in terms of single case studies or through continental or regional climatological analysis, that were able to demonstrate the high frequency and damage potential of tornadoes in many European countries [1,2,3,4,5,6].
The analysis of the environmental conditions conducive to tornadoes has been based in the past on radiosounding profiles (e.g., [7,8,9]). However, to overcome the problem of sparse radiosonde locations or limited availability of data, climatological studies in some European regions have been based more and more on atmospheric reanalysis over the years [10,11,12]. In some cases, both soundings and reanalysis data have been used together to investigate tornado events in Europe (e.g., [13]), mainly with the aim of comparing the associated environmental conditions. Although reanalysis fields (due to their limited horizontal resolution) cannot reproduce fine-scale atmospheric features, they can adequately represent synoptic/mesoscale patterns potentially associated with extreme weather events, as recently investigated by Pilguj et al. [14].
The Mediterranean basin is considered a hotspot for climate change (e.g., [15]) and, as a consequence, is becoming more exposed to extreme weather events. Therefore, some recent studies have focused on the possible change in the intensity of significant tornadoes because of global warming. Miglietta et al. [16] and Avolio and Miglietta [17] investigated two significant tornadoes occurred in two different parts of the Italian peninsula, the central Tyrrhenian coast (CT) and southeastern Italy (SE), which are among the areas most affected by tornadoes in the Mediterranean. Using numerical simulations, they explored the sensitivity of the tornado-spawning supercells to sea surface temperature (SST), finding a significant impact of the latter on the supercell intensity (a higher SST implies more intense supercells).
The aim of the present work is a comparative analysis between the two tornado hotspot regions CT and SE, examining the large-scale atmospheric features and the main instability parameters associated to the tornado occurrences. Compared to previous works on Italian tornadoes [18,19], the present study represents a step forward in the sense that: (i) it includes a larger number of years (32), thus a larger number of reports; (ii) the investigation is performed using not only gridded data (reanalysis), but also upper air observations. The use of two different datasets will also allow evaluating and comparing the main environmental fields and instability parameters. Finally, the paper reflects the interest in comparing the environmental conditions in two coastal regions that are going to suffer more from climate change issues related to the increase in SST.
The paper is organized as follows. The 32-year period of tornado reports and the observational and gridded data used to analyze them are described in Section 2. Section 3 presents the results in terms of climatological analysis, sounding/pseudo-sounding-derived parameters, and main synoptic/instability environments. Section 4 summarizes the main results of the work.
2. Data and Methods
2.1. Tornadoes in Italy
Until a few years ago, the scientific literature dealing with tornadoes in Italy was limited to a few climatological studies [20,21,22] and some qualitative papers describing events affecting mainly northeastern Italy (e.g., [23,24,25]). More recently, Miglietta and Matsangouras [18] developed an updated “climatology” of tornadoes and waterspouts based on 10 years of data, identifying the areas particularly affected by tornadoes in Italy: the Po Valley and the Venetian Plain in particular, the Central Italy Tyrrhenian coasts, southeastern Italy (the Apulia region in particular), and Sicily. In two subsequent works [19,26], the synoptic/mesoscale conditions favorable to Italian tornado occurrence were addressed using reanalysis data.
In order to better understand the mechanisms of development of tornado-spawning supercells affecting the Italian peninsula, some numerical studies were also performed. Using a combination of numerical simulations and high-resolution observations, Miglietta et al. [27] proposed a conceptual model for the development of intense supercells in northeastern Italy. The genesis and intensification of a supercell responsible for a significant tornado in the Italian Ionian regions were also investigated through numerical simulations [16,28]. Avolio and Miglietta [29] extended the work to three additional tornado-spawning supercells in the same southeastern regions that hit the same areas and were characterized by similar synoptic conditions. Avolio and Miglietta [17] focused on the most intense tornadoes affecting the central Italian regions through synoptic/mesoscale analysis of the main patterns emerging in about 20 years of reanalysis data and through the high-resolution simulation of a significant tornado. Furthermore, they extended the climatology of EF1+ (Enhanced Fujita scale [30], category 1 or higher) tornadoes over Italy to a longer period and confirmed the existence of some tornado hotspots (shown in Figure 1).
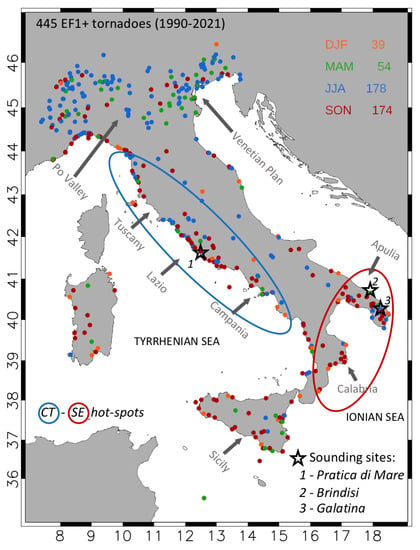
Figure 1.
The selected EF1+ tornadoes over Italy in the whole study period (1990–2021) and other locations cited in the manuscript. Figure reprinted/adapted with permission from Figure B1 of [17]. 2022, Elsevier. The ellipses indicate the main tornadic hotspots considered in the present study, i.e., CT (blue ellipse) and SE (red ellipse) regions. On the top right, the different colors refer to the seasons: DJF (December, January, February), MAM (March, April, May), JJA (June, July, August), SON (September, October, November).
2.2. Tornado Reports
Tornado events were identified starting from the European Severe Weather Database (ESWD [31]), which collects and provides quality-controlled information on different kinds of severe convective storms over Europe. The database is widely used and successfully adopted in several research activities and publications.
In the present study, we first selected all the tornado reports (1848) that occurred in Italy from 1990 to 2021 (in the following, we will refer to the “32-year period” for the complete database). Then, the reliability of the reports was considered by retaining only reports with quality control level 1 (reports confirmed by reliable sources) or 2 (scientific case studies). In addition, we considered only:
- -
- events classified with category 1 or higher on the Enhanced Fujita scale (EF1+);
- -
- tornadoes over land (thus including waterspouts making landfall, but excluding waterspouts remaining over sea);
- -
- reports with a time accuracy of 3 h (−1.5 h/+1.5 h) or less, and location accuracy smaller than 3 km.
We did not perform a separate detailed analysis of tornadoes and waterspouts making landfall (apart from the hodographs of the RAOB data), as we are mainly interested in the ground effects of the vortices, although their formation environments could be rather different.
After this selection, 445 events were identified over Italy; of these cases, 93 events occurred in the CT regions (Tuscany, Lazio, and Campania) and 48 in the SE regions (Calabria and Apulia).For CT (SE), 52% (71%) of the total tornadoes are reported over land; the remaining percentages refer to waterspouts making landfall.
These restrictive criteria, while they caused the conspicuous reduction of the initial database, permitted the analysis of all and only the highly plausible most intense events recorded in the two hotspots.
2.3. Upper Air Observations
Upper air Radiosonde Observations (RAOB) from the Global Telecommunications System (GTS) were used to study the atmospheric conditions closest to the time of tornado occurrences and to compute some instability parameters to be compared with those derived from ERA5 reanalysis. Sounding data were downloaded from the Department of Atmospheric Science, University of Wyoming archive. Only the profiles at 00:00 and 12:00 UTC were taken and, to make uniform the sounding format among the observations, only the 18 mandatory pressure levels from the surface up to 5 hPa (https://glossary.ametsoc.org/wiki/Mandatory_level, accessed on 10 December 2022) were considered.
As representative for the CT regions, the sounding station of Pratica di Mare (Lazio region; Figure 1) was chosen, while for the SE regions we have considered the soundings at Brindisi until March 2021 and Galatina airport (Apulia region; Figure 1) afterward, as the radiosounding station was moved.
The considered RAOB parameters are primarily the wind and the temperature fields at the prescribed 18 pressure levels. Apart from these fields, other parameters useful for severe weather studies have been extracted or calculated: the Convective Available Potential Energy of the most unstable parcel (MUCAPE), the Total Totals index (TT), the deep/mid-layer wind shear (DLS/MLS), and the 0–3/0–1 km storm relative helicity (SRH03/SRH01). Their definitions are provided in Table A1 (Appendix A).
In order to choose the representative soundings for the selected tornadoes, we followed a temporal proximity inflow method already used in other studies (e.g., [9,17,32,33]). This criterion consists of retaining the soundings within a 9 h window, starting 6 h before and ending 3 h after each event; the asymmetry of the time window with respect to the tornado occurrence takes into account the possible changes in the environmental conditions caused by the passage of the mesocyclone and the tornado itself; thus, the soundings at earlier times are considered more representative of the environment in which tornadoes develop.
For CT (SE), of 93 (48) cases, we retained 78 (44) of them; of these events, 9 (3) soundings were not available in the University of Wyoming archive, and 6 (7) refer to two or more nearby events. Therefore, 63 (34) proximity soundings were ultimately considered.
2.4. ERA5 ReAnalysis
The analysis carried out in this work is also based on the use of the global climate monitoring dataset ECMWF ReAnalysis (ERA5; [34,35]). Reanalyses are used with the dual purpose of studying the main large-scale atmospheric patterns and of characterizing the convective environment related to the tornado occurrences.
We will firstly compute the composite hodographs and some sounding-derived parameters at the sounding sites, with the aim of comparing them with the analogous hodographs/parameters derived from the RAOB observations. Then, we will compare the main synoptic patterns, also in terms of anomalies, between the two hotspot regions.
We considered the ERA5 fields, available on a regular latitude–longitude grid with 0.25° × 0.25° horizontal resolution, at 00:00 and 12:00 UTC for the 32-year period (1990–2021) over the domain delimited by: 20° W, 20° S, 50° E, 60° N. Both “pressure-levels” and “single-levels” fields are extracted: geopotential height at 500 hPa (HGT500); temperature at 850 hPa (T850); mean sea level pressure (MSLP); U and V wind components at 500, 700, 900 hPa and at 10 m height; MUCAPE; TT; and K-index (KI). Conversely, deep/mid/low layer wind shear (DLS/MLS/LLS) and SRH03/SRH01 were calculated from the wind fields (see Table A1 in Appendix A). For the punctual comparison between RAOB and ERA5 (Section 3.2), the shear was calculated using 1000 hPa as the lower level (the lowest available level for RAOB); for the discussion accounting for only the reanalysis (Section 3.3), we instead considered the wind at 10 m. The sea surface temperature (SST) is provided to ERA5 from two external sources, HadISST2 (Hadley Centre Sea Ice and Sea Surface Temperature v.2) and OSTIA (Operational Sea Surface Temperature and Ice Analysis) datasets, both from the Met Office, and is a combination of satellite and in situ data, available at daily temporal resolution (thus, diurnal variations are not represented).
For the punctual comparison with the RAOB data (Section 3.2), we exclude the times at which the soundings were not available. Thus, 63 (34) pseudo-proximity soundings will be computed for the CT (SE) regions. Conversely, for the analysis of the main large-scale patterns (Section 3.3), the full set of 72 (37) events will be considered.
3. Results and Discussion
3.1. Climatology of Intense Tornadoes from 1990 to 2021 in the CT and SE Regions
Figure 2 reports the event locations for both CT and SE hotspots: in the upper panels (a,b), the colors refer to the decades; on the bottom (c,d), the colors refer to the seasons.
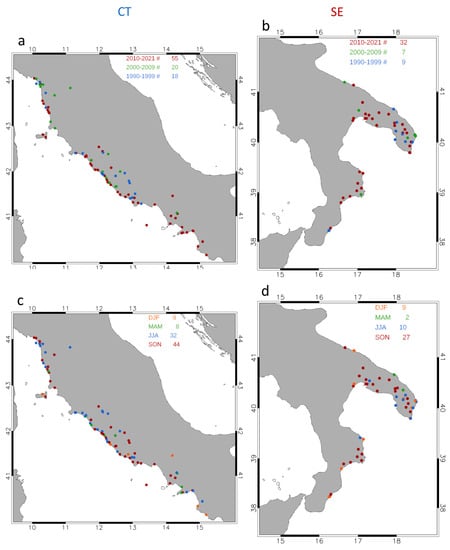
Figure 2.
Position of the 93 (CT regions; (a,c)) and 48 (SE regions; (b,d)) tornadoes during the 32-year period. On the top right, the different colors in (a,b) refer to the different last decades, while in (c,d) they refer to the seasons: DJF (December, January, February), MAM (March, April, May), JJA (June, July, August), SON (September, October, November).
Figure 2a,b permits the assessment of a significant increase in the number of events in the last 10 years, both for CT and SE (60% and 67% of the total tornadoes occur in the last decade, respectively). This can be mainly attributed to the greater availability of data, due to the increased possibility of reporting provided by smartphones and social network pages and websites. The same temporal distribution is observed for the most intense events (EF2+). Although the dataset is not homogeneous, we believe that including the information provided by these early cases makes the statistics more robust; thus, we decided to keep them in our analysis.
The increase in the number of reports in the last 10 years would allow us to speculate on a possible role of climate change, but for the reasons indicated above, a more in-depth analysis is needed to identify possible interconnections between tornado intensity/frequency and climate change effects. However, numerical simulations allowed assessing a significant role played by the SST (e.g., [17,29,36]) in the intensity and trajectories of tornado-spawning cells. The conclusion of these studies is that a warmer SST, as expected in the future climate, will favor the occurrence of stronger events.
The bottom panels of Figure 2c,d allow us to evaluate the seasonality of these events in the Mediterranean. Both for CT and SE, autumn (September, October, November) is the season most affected by tornadoes (47% and 56% of the total, respectively), followed by summer (June, July, August) (34% and 21%). During winter (December, January, February), the number of events in the SE regions is nearly the same as in the CT regions, thus the relative frequency in SE is much higher (19% against 10%).
3.2. Composite Hodographs and Sounding-Derived Parameters in the CT and SE Sounding Sites
The upper-level atmospheric characteristics at the sounding sites of Pratica di Mare (for CT) and Brindisi/Galatina (for SE) (Figure 1) are compared hereafter in terms of composite hodographs and sounding-derived parameters, considering both observations (RAOB) and reanalysis (ERA5). As previously stated, 63 proximity soundings are considered for CT and 34 for SE; the composite hodographs and the sounding-derived parameters are calculated averaging all data on the mandatory 18 standard pressure levels (see Section 2.2).
The composite hodographs are reported in Figure 3, while some sounding-derived parameters are shown in Table 1.
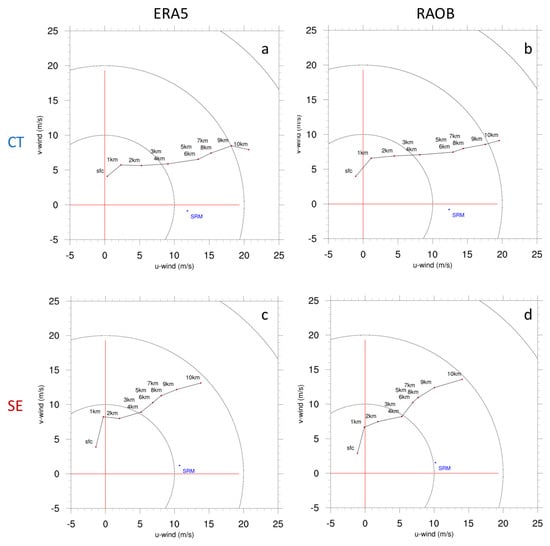
Figure 3.
Composite hodographs at Pratica di Mare (a,b) and Brindisi/Galatina (c,d) from RAOB sounding (b,d) and from ERA5 reanalysis (a,c). The blue points near the x-axes represent the storm relative motion (SRM) (RAOB data source: Department of Atmospheric Science, University of Wyoming).

Table 1.
Composite sounding-derived and convective parameters in the two sounding locations.
The composite hodographs show, in both regions, a very similar shape of the RAOB and ERA5 data, proving the ability of the latter to correctly reproduce the observed wind profiles. For CT, the linear shape indicates more favorable conditions for multicell systems [37], with some directional shear distinguishable only at the lower levels. The latter is mainly due to the contribution of the tornadoes originated inland (Figure A1a), while for those originated as waterspouts (Figure A1b) the low-level shear is mainly related to a strong change in wind speed and very weak directional shear in the lower 1 km (this behavior suggests the presence of a low-level jet and favorable conditions for isolated supercells in this subcategory). Above, the linear shape characterizes both sub-categories (Figure A1, top), although for tornadoes originated as waterspouts, the flow has a stronger westerly component. For SE, a more pronounced clockwise low-level curvature suggests, together with the intense deep layer shear, conditions more favorable for isolated supercell development [10,38,39]. The hodograph shape follows fairly well that of the inland tornadoes (Figure A1c), which represent the large majority of the cases.
The upper-level flow is also different for the two regions, i.e., west-southwesterlies in CT and southwesterlies in SE; this is consistent with a trough more elongated in the meridional direction in the SE events (cfr. with Figure 4). In both areas, the increase in wind speed with height is not associated with significant changes in direction (unidirectional shear).
The storm relative motion reported in Figure 3 is an estimate based on the hodograph structure and indicates that the system moves mainly eastward, with a slight northerly (southerly) component in CT (SE), thus to the right side of the mean environmental wind, a typical feature of right-moving supercells [40].
In a recent study about significant tornadoes, Coffer et al. [10] showed how European hodographs are on average much more linear than in the USA, particularly in the lower levels; in these conditions, the storms initially develop with weaker updrafts [41]. This is the case of the CT hodographs, which more closely resemble those of multicellular systems [38], rather than the case of the SE hodographs, which look closer to those of the typical tornadic supercells in the USA [10].
The differences we identified so far in the composite hodographs in the two regions are consistent with those emerging in previous case studies, i.e., a QLCS (Quasi-Linear Convective System) affecting CT [17] and multiple supercell occurrences in SE [29]. However, more in-depth analysis would be needed to exhaustively discriminate the characteristics of the tornadoes in the two regions (e.g., by analyzing Doppler radar maps and/or by performing dedicated high-resolution numerical simulations). The unavailability of a complete archive of radar data, mainly due to the high number of years/events here considered, does not allow us to draw definitive conclusions regarding the convective modes for each event.
The obtained DLS values suggest conditions moderately favorable for supercell development in both regions, with a non-negligible splitting storm potential. A stronger updraft force would favor more discrete cells in the SE region, compared to CT which appears mainly influenced by the presence of cold fronts/baroclinic zones, implying more linear storm modes.
In Table 1, we report the composite values for some sounding-derived and convective parameters defined above, calculated in the two sounding locations. In particular, we report the composite values of TT, MUCAPE, DLS, MSL, SRH03, and SRH01.
Overall, ERA5 and RAOB data are quite similar; the main differences are observed in CT and are associated with stronger instability and weaker storm relative helicity (both SRH01 and SRH03) in ERA5. Comparing the two regions, the environment appears more favorable to tornadogenesis in CT, due to higher MUCAPE (in ERA5) and stronger shear (both DLS and MLS). No conclusions can be drawn on storm relative helicity, since soundings indicate higher values in CT, while ERA5 shows the opposite. However, the SRH calculation, near the ground, was made using too few levels; also, we can speculate that the ERA5 underestimation can be a consequence of the smaller wind shear in the low levels.
In addition to Table 1, we also report in Appendix A (Figure A2) the box-and-whiskers plots for TT, MUCAPE, DLS, and SRH03/SRH01, both for CT and SE, in order to better evaluate the statistical distribution of the data. All the sounding-derived parameters show a good agreement between observations and reanalysis in terms of upper/lower extremes/quartiles and medians (except for the SRH03). However, for CT, the upper extremes of MUCAPE in ERA5 data are higher than in RAOB; for SE, the opposite is true.
In general, moderate values are observed both for MUCAPE and wind shear parameters. However, these results should be taken with caution; parameter values in Table 1 are composite that refer to single points, which may not be representative of the convective environment where tornado-spawning cells form, considering the strong spatial variability of some of these fields (e.g., Figure 13 in ref. [16]). Therefore, to cope with this issue, the environmental features are also analyzed on a wider domain rather than on single points, studying some ERA5 environmental conditions in the two tornado hotspots.
3.3. Large-Scale Meteorological and Convective Environments
Based on ERA5 reanalysis, the main large-scale atmospheric patterns are commented on hereafter, both in terms of anomalies (HGT500, MSLP, T850, SST; Figure 4) and average fields (10 m wind, MUCAPE, DLS, SRH03; Figure 5) for the reported tornadoes (72 events for CT and 37 for SE). For the anomaly calculation, the whole 32-year period was considered to compute the average fields in the ERA5 dataset, apart from the SST and temperature, which have a clear seasonal component. For these two fields, the averages and anomalies were calculated considering the same day on which the event occurred in each of 32 years; then, the anomalies were averaged over all days.
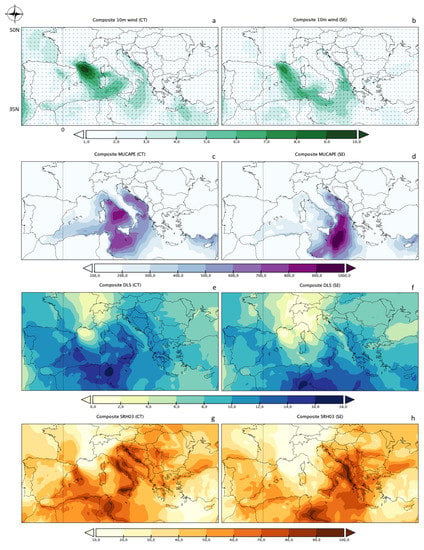
Figure 5.
Average ERA5 fields of: 10 m wind (vector and speed) [m s−1] (a,b), MUCAPE [J kg−1] (c,d), deep layer wind shear [m s−1] (e,f), and 0–3 km storm relative helicity [m2 s−2] (g,h). Left (right) panels refer to CT (SE) regions.
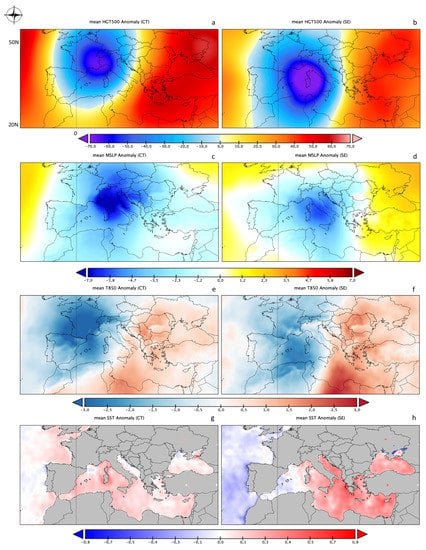
Figure 4.
Average anomalies of the ERA5 fields of: geopotential height at 500 hPa [m] (a,b), mean sea level pressure [hPa] (c,d), temperature at 850 hPa [K] (e,f), and sea surface temperature [K] (g,h). Left (right) panels refer to CT (SE) regions.
Figure 4 and Figure 5 allow us to evaluate, in a comparative way, the roles of the main large-scale atmospheric fields and of some instability parameters during the identified tornadic events.
The main findings from Figure 4 can be summarized as follows:
- -
- For both CT and SE, a deeper-than-average upper-level trough is observed over the western Mediterranean Sea (elongated further south and shifted southeast for the SE cases) (Figure 4a,b). The tornado-spawning cells occur on the southeastern/eastern side of the trough, driven by a southwesterly steering flow.
- -
- The mean sea level pressure fields exhibit lower-than-average values for both regions (Figure 4c,d), centered about 400 km (northwest for CT and west for SE) from the center of the tornado hotspots. Maximum negative anomalies of about 8 hPa (6 hPa) were found for the CT (SE) cases.
- -
- Positive low-level temperature anomalies are present in both CT and SE (up to 2 K for CT and 3 K for SE; Figure 4e,f) surrounding regions, while negative anomalies are evident west of the areas with lower-than-average MSLP. However, for the CT cases, the tornado locations are at the border between the cold and warm air (slightly on the colder side); conversely, in the SE regions, the tornadoes occur in the warm anomaly, as the cold front is still over the Tyrrhenian Sea.
- -
- For both CT and SE, positive SST anomalies are found (Figure 4g,h) in the sea sectors near the areas affected by the tornadoes in the central Tyrrhenian and Ionian Sea, respectively. However, for CT cases, the anomalies are of a few tenths of K near the Tyrrhenian coast, while averaged values up to 0.8 K are visible in the SE cases (however, much higher peaks of positive anomalies were found in single events, as discussed in the next section). These results are consistent with previous works [19].
From Figure 5, the following conclusions can be drawn:
- -
- For the CT regions (Figure 5a), colder air is advected toward the western Mediterranean Basin by higher-than-average (anomaly not shown) surface (mistral) winds (10 m wind speed locally greater than 9 m s−1). This is a typical configuration associated with Atlantic perturbations penetrating the Mediterranean basin through the Rhone Valley/Gulf of Lion. The CT regions, Lazio in particular, are affected by southwesterly surface currents, flowing on the southeastern side of the low-pressure area (Figure 4c). For the SE regions (Figure 5b), the mistral wind is still present in the western Mediterranean, while stronger-than-average (anomaly not shown) southerly surface winds (10 m wind speed locally greater than 6 m s−1) blow on average from North Africa to the Ionian Sea, transporting warm air over warm sea sectors (Figure 4f,h) that further increase the instability of the air mass.
- -
- Moderate-to-high values of the composite MUCAPE are present in the sea sectors near the tornado areas, for both hotspots (maximum values of composite MUCAPE up to 850/1000 J kg−1 for CT/SE, respectively; Figure 5c,d). However, while the area of maximum instability reaches the Tyrrhenian coast in CT cases, it is located some hundreds of km further south from the position of the tornadoes in SE events, which explains the higher values of MUCAPE in the tornado locations in CT (ERA5 values in Table 1).
- -
- Nearby the tornado hotspots, both average DLS and SRH03 exhibit moderate-to-high values. DLS (Figure 5e,f) is stronger on the southern side of the corresponding tornado hotspot areas, in the southern Mediterranean, close to the northern African coasts. For the CT regions, directly exposed to the prevailing westerly currents, the highest SRH values are near the coastlines adjacent to the tornado areas (Figure 5g), while, for the SE regions, the highest SRH values are in the Balkan regions that are affected by the intense southerly flow over the Ionian Sea.
3.3.1. Maximum-Values Approach
From the maps reported in the previous sections, the high spatial variability of some fields/parameters is noticeable; thus, also considering the limited temporal and spatial resolution of the reanalysis fields, it may be useful to estimate their values even at distance of several km from the areas affected by the tornadoes. In this section, we propose an approach based on the definition of specific 400 km × 400 km sub-boxes (close to the two hotspots, including the areas in which the tornadic cells developed), in which we will calculate the maximum areal values of different parameters, both in terms of mean fields and extremes.
The choice of the position and the extent of these boxes (hereafter, CT-box and SE-box; Figure A3) was based on Figure 4 and Figure 5, which revealed the sub-areas characterized by higher values of the mean fields and anomalies. Since the CT regions cover a large spatial extent, the CT-box position was defined taking into account that about 56% of the events occurred in the Lazio region.
This procedure provides the opportunity of identifying specific thresholds (in terms of maximum values) for different fields/parameters, also from the perspective of an operational use for forecasting purposes. Other works used a similar approach to characterize the environmental conditions: Chernokulsky et al. [42] computed the maximum values of several thermodynamic and kinematic parameters over the Ural Region; Grieser and Haines [3] proposed a tornado risk climatology over Europe, also based on the maximum daily values of CAPE and DLS in specific grid boxes of 0.5° × 0.5°; maximum values of tornado-related indices and convective parameters were also evaluated for several tornado cases in Italy [17,29].
The results of this analysis are summarized in Table 2. The maxima refer to: KI, TT, wind speed at 10 m (WSP10), MUCAPE, DLS, MLS, and LLS. Only for SST and T850, the daily anomalies are considered rather than the daily fields.

Table 2.
Maximum values in the two sub-boxes. ”MEAN” indicates the averages of the maxima and “MAX” indicates the extreme values.
The values reported in Table 2 were calculated as follows: first, the daily field/anomaly was considered for each day/event (72 for CT and 37 for SE); then, the spatial maximum was calculated in the two defined boxes; finally, the maxima were averaged over the whole set of events. In addition to the average value, their extreme maximum value (corresponding to a single day/event) is also reported in the table. Thus, the values in Table 2 refers to maxima and not to averages, as in Section 3.3.
The maximum values of KI and TT are on average high in both boxes, with isolated peaks up to 40 K (KI) and 60 K (TT), indicating that conditions extremely favorable to convective development may occasionally occur. The maximum horizontal 10 m wind speed exhibits average maximum values greater than 11 m s−1 in both areas, with peaks of almost 20 m s−1. The CT-box shows, on average, a maximum value of MUCAPE slightly higher than the SE-box (both above 1700 J kg−1), although the highest values in the latter case are mainly observed in the southern part of the area covered by the SE-box (Figure 5); for both regions, in single events, MUCAPE may reach values greater than 5300 J kg−1. Maximum values of deep-, medium-, and low-level shear are very similar in the two boxes. The high values of shear are comparable with those found by Pilguj et al. [14] for 12 violent (EF4+) tornadoes in Europe, although they considered the mean values from the proximity soundings and not the mean of the areal maxima as we did.
The maximum SST anomaly is on average +1 K for both regions; isolated values of 3.1 K (CT) and 2.4 K (SE) were also found. However, the maximum values were observed quite far from the coastlines and may not be representative of the temperature of the sea surface on which the tornado-spawning cells developed. For T850, the daily maximum anomaly in the SE-box is on average about 1 K greater than in the CT-box (3 K vs. 2 K), in agreement with the results in [19]; very high isolated peaks can be observed in both regions (9 K for CT-box and 7 K for SE-box).
Overall, the mean values of the parameters in the two boxes are very similar, suggesting that some thresholds in the ERA5 data can be identified independently of the considered area. What differs between the two areas is the main synoptic configuration associated with these events (Figure 4) and the nature of the cells that generate tornadoes (Figure 3). For the SE regions, the high values of SST and the noticeable positive anomalies of T850 (Figure 4), combined with a favorable hodograph pattern, support the formation of single convective cells over the sea. A greater tendency to develop linear and multicellular systems in CT can be reasonably attributed to the greater frequency of conditions in which a contrast of different air masses occurs (i.e., cold front from NW and low-level warmer air from the south), a configuration generally associated with the development of linear convective systems (e.g., [43]).
To conclude this section, we analyze two scatter plots to investigate the simultaneous occurrence of couples of fields/parameters in the tornado cases. A similar analysis (not shown) concerning all the fields/parameters and all their possible combinations confirmed that no linear relationship is easily identifiable; however, the most interesting results concern the scatter plot for the maximum MUCAPE and DLS values (Figure 6a).
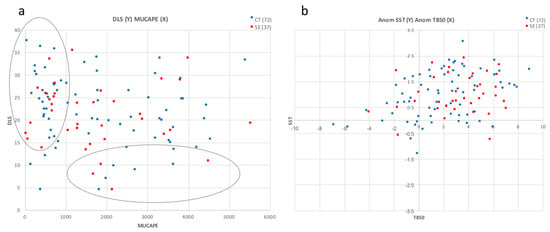
Figure 6.
Scatter plots for the maximum daily values of: (a) MUCAPE [J kg−1] (x-axis) and DLS [m s−1] (y-axis) and (b) maximum daily anomaly values of T850 [K] (x-axis) and SST [K] (y-axis). Blue (red) dots refer to the CT−box (SE−box) maxima. The two ellipses on (a) help to individuate the HSLC/LSHC environments.
In both regions, intense tornadoes occur predominantly in HSLC (high-shear/low-CAPE) environments; furthermore, a certain number of cases fall near the diagonal of the graph, indicating situations in which CAPE and DLS exhibit similar characteristics (low/medium/high). Only a few cases show LSHC (low-shear/high-CAPE) characteristics.
HSLC environments are often responsible for severe weather events with strong synoptic-scale disturbances and are particularly frequent and well-documented in the USA [44,45]. A typical, although not strict, HSLC criterion (mainly related to the USA, where events are generally more extreme with respect to Europe) is based on MUCAPE ≤ 1000 J kg−1 and 0–6-km wind shear ≥ 18 m s−1 [45]; 33% (27%) of our CT (SE) cases fall into these criteria. The related tornadoes may be associated either to supercells or non-supercell systems; therefore, major forecast operational difficulties are assessed with respect to situations with high CAPE [46,47,48].
Figure 6b shows the scatter plot for the maximum daily anomaly values of T850 and SST. The figure clearly shows that positive SST and T850 anomalies characterize most of the tornadic events in both regions, and, for a few days, the daily anomalies are noteworthy. The positive anomalies of these thermodynamic fields in these two Mediterranean hotspots thus describe an environment particularly prone to tornado occurrences.
4. Summary and Conclusions
In this work we presented a comparative analysis of two Mediterranean tornado hotspots, namely the central Tyrrhenian (CT) and the southeastern (SE) regions of the Italian peninsula, considering long-term series (32 years, 1990–2021) of radiosonde observations and ERA5 reanalysis. We analyzed the main synoptic patterns, the atmospheric instability conditions, and the wind variability to assess the environmental conditions associated with these events.
The two regions share common features, characterized by a large horizontal geopotential and mean sea level pressure gradient over an area of enhanced instability. In both regions, tornadoes mainly occur in the warm sector, on the eastern flank of an approaching trough, and the events are accompanied by low-tropospheric southerlies (for CT) and south-southeasterlies (for SE). Considering the wind at different levels, tornadoes in SE regions exhibit more clockwise-curved hodographs, especially in the low levels, compared to those in CT, suggesting a stronger tendency to isolated supercell development for the former and favorable conditions for multicellular systems for the latter.
The analysis of the main instability parameters reveals that a large number of events develop, in both regions, in high-shear/low-CAPE (HSLC) environments; the events occurring in low-shear and high-CAPE situations are rare. The variability in CAPE is very large, ranging from 100 up to 5000 J kg−1; the average maximum values of the deep layer shear are greater than 21 m s−1, with isolated cases having maximum shear greater than 35 m s−1.
In almost all the selected events, positive anomalies in sea surface temperature and in 850 hPa temperature are found; several tornadoes are characterized by very large anomalies of these parameters, since a significant number of cases occurs in an environment with T850 (SST) anomaly greater than 6 K (2 K). Ongoing global warming suggests that these thermodynamic conditions will be exacerbated in the future, possibly affecting the intensity of Mediterranean tornado occurrences; a more in-depth analysis is however needed to assess the possible interconnections between tornado intensity/frequency and climate change effects.
The growing attention by the scientific community towards these issues, together with a greater civil society awareness for environmental disasters, emphasizes the need to develop integrated observational/modeling systems devoted to the study and the prediction of such extreme weather events in Italy and in the Mediterranean regions.
Author Contributions
Conceptualization, E.A. and M.M.M.; methodology, E.A. and M.M.M.; software, E.A.; validation, E.A.; data curation, E.A.; writing—original draft preparation, E.A.; writing—review and editing, E.A. and M.M.M.; supervision, M.M.M. All authors have read and agreed to the published version of the manuscript.
Funding
This research received no external funding.
Institutional Review Board Statement
Not applicable.
Informed Consent Statement
Not applicable.
Data Availability Statement
ERA5 data were downloaded from the Copernicus Climate Change Service (C3S) Climate Data Store (https://cds.climate.copernicus.eu/cdsapp#!/home), last accessed on 14 December 2022. Sounding profiles were downloaded from the University of Wyoming archive (https://weather.uwyo.edu/upperair/sounding.html), last accessed on 14 December 2022.
Acknowledgments
ERA5 data [34,35] were downloaded from the Copernicus Climate Change Service (C3S) Climate Data Store. The results contain modified Copernicus Climate Change Service information 2020. Neither the European Commission nor ECMWF are responsible for any use that may be made of the Copernicus information or data it contains. The authors gratefully acknowledge four anonymous reviewers.
Conflicts of Interest
The authors declare no conflict of interest.
Appendix A
In this Appendix are shown: the equations for some parameters considered in the manuscript (Table A1), the figure with the composite hodographs (RAOB data) for inland tornadoes and waterspouts making landfall (Figure A1), the box-and-whiskers plots supporting the comments in Section 3.2 (Figure A2), and the map showing the two sub-boxes considered in Section 3.3.1 (Figure A3).

Table A1.
Equations, units, and main references for some of the calculated parameters. v is the horizontal wind vector (the numbers, when no units appear, refer to the vertical pressure level); g is the gravitational acceleration; LFC is the level of free convection; EL is the equilibrium level; TLP is the lifting parcel temperature; TE is the environmental temperature; k is the upward unit vector; c is the storm motion vector; T is the temperature; Td is the dew point temperature.
| Parameter Equation | Long Name | Units | References |
|---|---|---|---|
| DLS = |v500-v1000/10m| | Deep Level Shear | m s−1 | [49] |
| MLS = |v700-v1000/10m| | Mid Level Shear | “ ” | “ ” |
| LLS = |v900-v10m| (*) ERA5 maps only | Low Level Shear | “ ” | “ ” |
| CAPE = g | Convective Available Potential Energy | J kg−1 | [50] |
| SRH03/SRH01 = − | Storm Relative Helicity (0–3/0–1 km) | m2 s−2 | [51] |
| KI = (T850-T500) + Td850-(T700-Td700) | K index | K | [52] |
| TT = (T850-T500) + (Td850- T500) | Total Totals index | K | [53] |
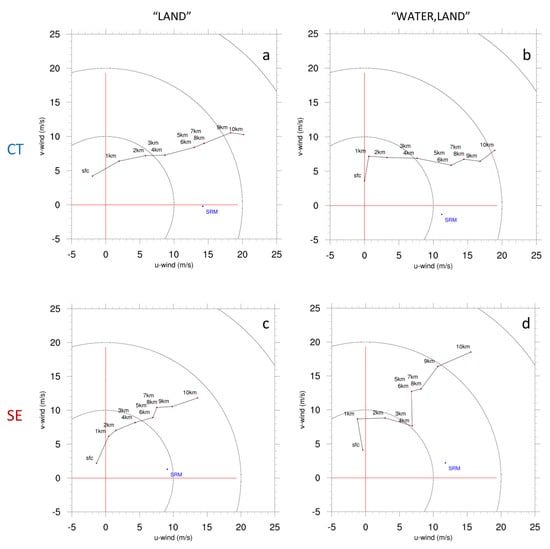
Figure A1.
Composite hodographs at Pratica di Mare (top) and Brindisi/Galatina (bottom) from RAOB sounding. The blue points near the x−axes represent the storm relative motion (SRM). The events are divided into inland tornadoes ((a,c); 33 events in CT and 24 in SE) and waterspouts making landfall ((b,d); 30 events in CT and 10 in SE).
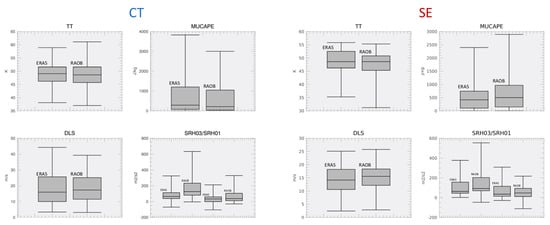
Figure A2.
Box−and−whiskers plots for TT, MUCAPE, DLS, and SRH03/SRH01, both for CT and SE.
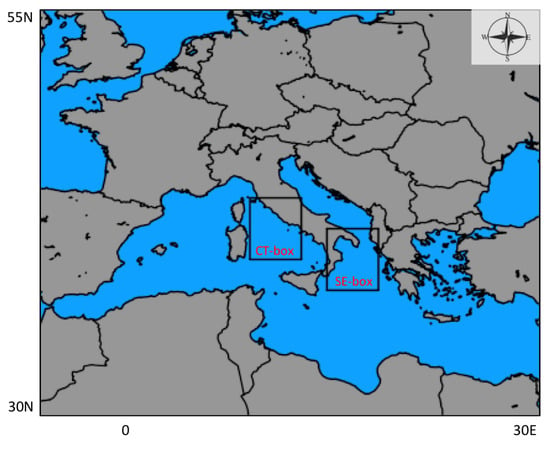
Figure A3.
The two sub-boxes (namely CT-box and SE-box) in which the maximum values are computed.
References
- Antonescu, B.; Schultz, D.M.; Lomas, F.; Kühne, T. Tornadoes in Europe: Synthesis of the observational datasets. Mon. Weather Rev. 2016, 144, 2445–2480. [Google Scholar] [CrossRef]
- Antonescu, B.; Schultz, D.M.; Holzer, A.; Groenemeijer, P. Tornadoes in Europe: An underestimated threat. Bull. Am. Meteorol. Soc. 2017, 98, 713–728. [Google Scholar] [CrossRef]
- Grieser, J.; Haines, P. Tornado risk climatology in Europe. Atmosphere 2020, 11, 768. [Google Scholar] [CrossRef]
- Dotzek, N. An updated estimate of tornado occurrence in Europe. Atmos. Res. 2003, 67, 153–161. [Google Scholar] [CrossRef]
- Taszarek, M.; Allen, J.T.; Groenemeijer, P.; Edwards, R.; Brooks, H.E.; Chmielewski, V.; Enno, S.E. Severe convective storms across Europe and the United States. Part I: Climatology of lightning, large hail, severe wind, and tornadoes. J. Clim. 2020, 33, 10239–10261. [Google Scholar] [CrossRef]
- Groenemeijer, P.; Kühne, T. A climatology of Tornadoes in Europe: Results from the European Severe Weather Database. Mon. Weather Rev. 2014, 142, 4775–4790. [Google Scholar] [CrossRef]
- Groenemeijer, P.; Van Delden, A. Sounding-derived parameters associated with large hail and tornadoes in the Netherlands. Atmos. Res. 2007, 83, 473–487. [Google Scholar] [CrossRef]
- Taszarek, M.; Kolendowicz, L. Sounding-derived parameters associated with tornado occurrence in Poland and universal tornadic index. Atmos. Res. 2013, 134, 186–197. [Google Scholar] [CrossRef]
- Rodríguez, O.; Bech, J. Sounding-derived parameters associated with tornadic storms in Catalonia. Int. J. Climatol. 2018, 38, 2400–2414. [Google Scholar] [CrossRef]
- Coffer, B.E.; Taszarek, M.; Parker, M.D. Near-ground wind profiles of tornadic and nontornadic environments in the United States and Europe from ERA5 reanalyses. Weather. Forecast. 2020, 35, 2621–2638. [Google Scholar] [CrossRef]
- Taszarek, M.; Allen, J.T.; Púčik, T.; Hoogewind, K.A.; Brooks, H.E. Severe convective storms across Europe and the United States. Part 2: ERA5 environments associated with lightning, large hail, severe wind and tornadoes. J. Clim. 2020, 33, 10263–10286. [Google Scholar] [CrossRef]
- Rodríguez, O.; Bech, J. Tornadic environments in the Iberian Peninsula and the Balearic Islands based on ERA5 reanalysis. Int. J. Climatol. 2020, 41, S1. [Google Scholar] [CrossRef]
- Taszarek, M.; Pilguj, N.; Allen, J.T.; Gensini, V.A.; Brooks, H.E.; Szuster, P. Comparison of convective parameters derived from ERA5 and MERRA2 with sounding data over Europe and North America. J. Clim. 2021, 34, 3211–3255. [Google Scholar] [CrossRef]
- Pilguj, N.; Taszarek, M.; Allen, J.T.; Hoogewind, K.A. Are trends in convective parameters over the United States and Europe consistent between reanalyses and observations? J. Clim. 2022, 35, 3605–3626. [Google Scholar] [CrossRef]
- Tuel, A.; Eltahir, E.A.B. Why Is the Mediterranean a Climate Change Hot Spot? J. Clim. 2020, 33, 15. [Google Scholar] [CrossRef]
- Miglietta, M.M.; Mazon, J.; Rotunno, R. Numerical simulations of a tornadic supercell over the Mediterranean. Weather. Forecast. 2017, 32, 1209–1226. [Google Scholar] [CrossRef]
- Avolio, E.; Miglietta, M.M. Tornadoes in the Tyrrhenian regions of the Italian peninsula: The case study of 28 July 2019. Atmos. Res. 2022, 278, 106285. [Google Scholar] [CrossRef]
- Miglietta, M.M.; Matsangouras, I.T. An updated climatology of tornadoes and waterspout in Italy. Int. J. Climatol. 2018, 38, 3667–3683. [Google Scholar] [CrossRef]
- Bagaglini, L.; Ingrosso, R.; Miglietta, M.M. Synoptic patterns and mesoscale precursors of Italian tornadoes. Atmos. Res. 2021, 253, 105503. [Google Scholar] [CrossRef]
- Palmieri, S.; Pulcini, A. Trombe d’aria sull’Italia. Riv. Meteorol. Aeronaut. 1978, 4, 263–277. [Google Scholar]
- Gianfreda, F.; Miglietta, M.M.; Sansò, P. Tornadoes in southern Apulia (Italy). Nat. Hazards 2005, 34, 71–89. [Google Scholar] [CrossRef]
- Giaiotti, D.B.; Giovannoni, M.; Pucillo, A.; Stel, F. The climatology of tornadoes and waterspouts in Italy. Atmos. Res. 2007, 83, 534–541. [Google Scholar] [CrossRef]
- Bertato, M.; Giaiotti, D.B.; Manzato, A.; Stel, F. An interesting case of tornado in Friuli-Northeastern Italy. Atmos. Res. 2003, 67, 3–21. [Google Scholar] [CrossRef]
- Pipinato, A. Recent northeast Italian tornado events: Lesson learned for improving structures. Nat. Hazards 2018. [Google Scholar] [CrossRef]
- Zanini, M.A.; Hofer, L.; Faleschini, F.; Pellegrino, C. Building damage assessment after the Riviera del Brenta tornado, northeast Italy. Nat. Hazards 2017, 86, 1247–1273. [Google Scholar] [CrossRef]
- Ingrosso, R.; Lionello, P.; Miglietta, M.M.; Salvadori, G. A statistical investigation of mesoscale precursors of significant tornadoes: The Italian case study. Atmosphere 2020, 11, 301. [Google Scholar] [CrossRef]
- Miglietta, M.M.; Manzato, A.; Rotunno, R. Characteristics and Predictability of a Supercell during HyMeX SOP1, Q.J. Roy. Meteor. Soc. 2016, 142, 2839–2853. [Google Scholar] [CrossRef]
- Miglietta, M.M.; Rotunno, R. An EF3 Multivortex Tornado over the Ionian Region: Is it time for a dedicated warning system over Italy? Bull. Am. Meteorol. Soc. 2016, 97, 337–344. [Google Scholar] [CrossRef]
- Avolio, E.; Miglietta, M.M. Multiple tornadoes in the Italian Ionian regions: Observations, sensitivity tests and mesoscale analysis of convective storm environmental parameters. Atmos. Res. 2021, 263, 105800. [Google Scholar] [CrossRef]
- Doswell, C.; Brooks, H.E.; Dotzek, N. On the implementation of the enhanced Fujita scale in the USA. Atmos. Res. 2009, 93, 554–563. [Google Scholar] [CrossRef]
- Dotzek, N.; Groenemeijer, P.; Feuerstein, B.; Holzer, A.M. Overview of ESSL’s severe convective storms research using the European Severe Weather Database ESWD. Atmos. Res. 2009, 93, 575–586. [Google Scholar] [CrossRef]
- Rasmussen, E.N.; Blanchard, D.O. A baseline climatology of sounding-derived supercell and tornado forecast parameters. Wea. Forecast. 1998, 13, 1148–1164. [Google Scholar] [CrossRef]
- Renko, T.; Kuzmić, J.; Šoljan, V.; Mahović, N.S. Waterspouts in the Eastern Adriatic from 2001 to 2013. Nat. Hazards 2016, 82, 441–470. [Google Scholar] [CrossRef]
- Hersbach, H.; Bell, B.; Berrisford, P.; Biavati, G.; Horányi, A.; Muñoz Sabater, J.; Nicolas, J.; Peubey, C.; Radu, R.; Rozum, I.; et al. ERA5 Hourly Data on Single Levels from 1959 to Present. Copernicus Climate Change Service (C3S) Climate Data Store (CDS). 2018. Available online: https://cds.climate.copernicus.eu/cdsapp#!/dataset/reanalysis-era5-single-levels?tab=overview (accessed on 1 July 2022).
- Hersbach, H.; Bell, B.; Berrisford, P.; Biavati, G.; Horányi, A.; Muñoz Sabater, J.; Nicolas, J.; Peubey, C.; Radu, R.; Rozum, I.; et al. ERA5 Hourly Data on Pressure Levels from 1959 to present. Copernicus Climate Change Service (C3S) Climate Data Store (CDS). 2018. Available online: https://cds.climate.copernicus.eu/cdsapp#!/dataset/reanalysis-era5-pressure-levels?tab=overview (accessed on 1 July 2022).
- Miglietta, M.; Mazon, J.; Motola, V.; Pasini, A. Effect of a positive sea surface temperature anomaly on a Mediterranean tornadic supercell. Sci. Rep. 2017, 7, 1–8. [Google Scholar] [CrossRef] [PubMed]
- Corfidi, S.F. Cold pools and MCS propagation: Forecasting the motion of downwind-developing MCSs. Weather Forecast. 2003, 18, 997–1017. [Google Scholar] [CrossRef]
- Chisholm, A.J.; Renick, J.H. The kinematics of multi-cell and supercell Alberta hailstorms. Res. Council Alberta Hail Stud. Rep. 1972, 72, 24–31. [Google Scholar]
- Weisman, M.L.; Klemp, J.B. The structure and classification of numerically simulated convective storms in directionally varying wind shears. Mon. Weather Rev. 1984, 112, 2479–2498. [Google Scholar] [CrossRef]
- Bunkers, M.J.; Klimowski, B.A.; Zeitler, J.W.; Thompson, R.L.; Weisman, M.L. Predicting supercell motion using a new hodograph technique. Weather Forecast. 2000, 15, 61–79. [Google Scholar] [CrossRef]
- Weisman, M.L.; Rotunno, R. The use of vertical wind shear versus helicity in interpreting supercell dynamics. J. Atmos. Sci. 2000, 57, 1452–1472. [Google Scholar] [CrossRef]
- Chernokulsky, A.; Shikhov, A.; Bykov, A.; Azhigov, I. Satellite-based study and numerical forecasting of two Tornado outbreaks in the Ural region in June 2017. Atmosphere 2000, 11, 1146. [Google Scholar] [CrossRef]
- Weisman, M.L.; Davis, C.A. Mechanisms for the generation of mesoscale vortices within quasi-linear convective systems. J. Atmos. Sci. 1998, 55, 2603–2622. [Google Scholar] [CrossRef]
- Sherburn, K.D.; Parker, M.D. Climatology and ingredients of significant severe convection in high-shear, low-CAPE environments. Weather Forecast. 2014, 29, 854–877. [Google Scholar] [CrossRef]
- Sherburn, K.D.; Parker, M.D.; King, J.R.; Lackmann, G.M. Composite environments of severe and nonsevere high-shear, low-CAPE convective events. Weather Forecast. 2016, 31, 1899–1927. [Google Scholar] [CrossRef]
- Anderson-Frey, A.K.; Richardson, Y.P.; Dean, A.R.; Thompson, R.L.; Smith, B.T. Investigation of near-storm environments for tornado events and warnings. Weather Forecast. 2016, 31, 1771–1790. [Google Scholar] [CrossRef]
- Davis, J.M.; Parker, M.D. Radar climatology of tornadic and nontornadic vortices in high-shear, low-CAPE environments in the mid-Atlantic and southeastern United States. Weather Forecast. 2014, 29, 828–853. [Google Scholar] [CrossRef]
- Šinger, M.; Púčik, T. A challenging tornado forecast in Slovakia. Atmosphere 2000, 11, 821. [Google Scholar] [CrossRef]
- Weisman, M.L.; Klemp, J.B. The dependence of numerically simulated convective storms on vertical wind shear and buoyancy. Mon. Weather Rev. 1982, 110, 504–520. [Google Scholar] [CrossRef]
- Moncrieff, M.W.; Miller, M.J. The dynamics and simulation of tropical cumulus and squall lines. Q. J. Roy. Meteor. Soc. 1976, 102, 373–394. [Google Scholar] [CrossRef]
- Davies-Jones, R.; Burgess, D.W.; Foster, M. Test of helicity as a forecast parameter. In Preprints Proceedings of the 16th Conference on Severe Local Storms, Kananaskis Park, AB, Canada, 22–26 October 1990; American Meteorological Society: Bostn, MA, USA, 1990; pp. 588–592. [Google Scholar]
- George, J.J. Weather Forecasting for Aeronautics; Academic Press: Cambridge, MA, USA, 1960; p. 673. [Google Scholar]
- Miller, R.C. Notes on Analysis and Severe Storm Forecasting Procedures of the Air Force Global Weather Center; Report 200 (Rev.); Air Weather Service, Scott Air Force Base: Belleville, IL, USA, 1972; p. 106. [Google Scholar]
Disclaimer/Publisher’s Note: The statements, opinions and data contained in all publications are solely those of the individual author(s) and contributor(s) and not of MDPI and/or the editor(s). MDPI and/or the editor(s) disclaim responsibility for any injury to people or property resulting from any ideas, methods, instructions or products referred to in the content. |
© 2023 by the authors. Licensee MDPI, Basel, Switzerland. This article is an open access article distributed under the terms and conditions of the Creative Commons Attribution (CC BY) license (https://creativecommons.org/licenses/by/4.0/).