Abstract
Standardized Runoff Index (SRI), as one of the well-known hydrological drought indices, may contain uncertainties caused by the employment of the distribution function, time scale, and record length of statistical data. In this study, the uncertainty in the SRI estimation of monthly discharge data of 30- and 49-year lengths from the Minab Dam watershed, south of Iran, was investigated. Four probability distribution functions (Gamma, Weibull, Lognormal, and Normal) were used to fit the cumulative discharge data at 3-, 6-. 9-, 12-, 24-, and 48-month time scales, with their goodness-of-fit and normality evaluated by K-S and normality tests, respectively. Using Monte Carlo sampling, 50,000 statistical data were generated for each event and each time scale, followed by 95% confidence interval. The width of the confidence interval was used as uncertainty, and sources of uncertainty were investigated using miscellaneous factors. It was found that the maximum uncertainty was related to Normal and Lognormal distributions and the minimum uncertainty to Gamma and Weibull distributions. Furthermore, the increase in both time scale and record length led to the decrease in uncertainty.
1. Introduction
Drought, basically caused by a reduction in precipitation, may occur in both high- and low-rainfall areas of the globe. It is observed that in the recent decades, drought intensity has increased, and the time period between severe droughts has decreased, which is related to climate change [1].
The standardized precipitation index (SPI) [2] has been widely used for meteorological drought monitoring. A similar index, called the Standardized Runoff Index (SRI), is used for hydrological drought characterization [3]. SRI, like SPI, has some advantages, as for instance, the capability to compare spatial positions of regions, the flexibility of using different time scales, non-complexity in calculations, and the ease of obtaining the required information (for SPI: precipitation data and for SRI: discharge data) [4,5]. It also has negative points, such as the problem of finding appropriate distribution functions to simulate the observed precipitation series [6,7,8] and the need for long time series for attaining reliable validity [8,9,10]. The type of probability distribution function used highly impacts the SRI calculation. For instance, the choice of an inappropriate distribution function can lead to overestimation or underestimation of drought intensity, error in realizing the start and end of drought, and miscalculation of drought duration [11]. This is the first source of uncertainty, because the use of different distributions to illustrate precipitation data series results in different values of SRI [8].
Two-parameter Gamma distribution is often useful for monthly and seasonal precipitation data and has been widely used [2,12,13].
Another source of uncertainty has been shown by length and the variety of rainfall records used to fit the probability. This has been the case among other researchers, such as Guttman [8] and Wu et al. [10] on the need for accurate estimation of SPI estimates, with data of different lengths. For this purpose, the minimum time series is considered to be a 30-year time series, but it is recommended to use a [14] time series of 50 or 60 years. In addition, with the same time-series length, rainfall variability affects the SPI confidence limits. That is, the higher the variability of precipitation, the greater the uncertainty. This aspect can be observed for the same station with the change in moon and time scale.
Some studies employed a bootstrap technique to analyze uncertainty intervals caused by the distribution function, time scale, and length of time series [9,10,15,16,17,18].
This study aims to assess the sources of uncertainty in hydrological drought using Monte Carlo stochastic data generation due to different probability distribution functions and time scales at the Minab hydrometric station for 49 and 30 years of record lengths.
Due to these outstanding cases with implementation SPI, this study is designed to standardize the SPI method with introduction and use a more sensitive statistical test for the probability of candidate distributions used to normalize these drought indices. Objectives: (1) more information is needed to highlight careful testing of the assumed distributions for SPI; (2) to provide several improvements the SPI method; and (3) relative presentation comparison of several common distributions used for the normalization of SPI with general distribution advice.
2. Materials and Methods
2.1. Case Study
The study region, Minab Dam watershed, having 856.95 square kilometers of area, is located 70 km east of Bandar Abbas City, adjacent to Hormoz Strait, south of Iran. It is limited to 26°96′ N–27°40′ N latitudes and 56°78′ E–57°13′ E longitudes. Possessing a mild steepness, this watershed links the western parts of Mokran geological formations to the Persian Gulf beach and is surrounded by soil foothills.
2.2. Required Data
The Minab Hydrometric Station in Minab river at the upstream side of the Minab Dam has been active since 1966. The statistical properties of the station for 30- and 49- year-long time series are shown in Table 1. Furthermore, the Hurst test and Return test were used to examine the sufficiency and homogeneity of data, respectively, as shown in Table 1. Figure 1 shows the time series of precipitation and dishcharge in monthly scale. Since the studies conducted in this research are on hydrological drought, the data used are based on the water year (beginning: October this year and ending: September next year). The statistical period in this research is from 1966-97 to 2014-15.

Table 1.
Statistical characteristics (in m3/s) of case study (Mean: average; SD: Standard Deviation; Max: Maximum; Min: Minimum).
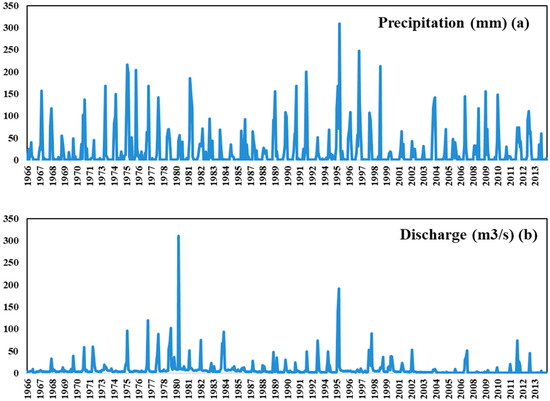
Figure 1.
Time series of precipitation (a) and discharge (b) in the Minab station.
2.3. Standardized Runoff Index (SRI) and Drought Characteristics
To study meteorological drought, several indexes have been proposed, of which the standardized precipitation index (SPI) [2] is more commonly used. Regarding hydrological drought, two well-known indexes, mainly the Palmer hydrological drought severity index (PHDSI) and surface water supply index (SWSI) have been proposed, but were difficult to use because of the need for numerous and partly complicated calculations. To simplify, similar to SPI, standardized runoff index (SRI) index was introduced, based on monthly discharge data. The basic steps to calculate SRI are as follows: First, an appropriate distribution is fitted to monthly discharge values of each station and cumulative probabilities are calculated. Some studies suggest a Gamma distribution for small watersheds and Normal or two-variable Lognormal distributions for large basins as the best fitting distributions for monthly discharge data. Second, co-probability transfer from cumulatively fitted distribution to cumulatively Normal standard distribution is performed. Then, the corresponding SRI of a specific discharge is defined as the value of the normal standard variable for which the cumulative probability is equal to that of the fitted distribution [3,19].
The characteristics of drought in this study are intensity and duration. Drought duration is defined as the length of a time period having SRI values less than zero continuously [20]. The cumulative indexes through the drought duration are summarized to obtain drought intensity. For ease, the drought intensity (S) is considered as an absolute value as follows:
In which S is the drought intensity, and D is the number of the consecutive drought periods.
2.4. Fitting the Best Statistical Distribution Function to Discharge Data and Applying Normality Test for Calculated SRI
In order to determine the most appropriate statistical distribution function for a specific time scale and station, the Kolmogrov–Smirnov (K-S) test was employed. The K-S statistic is obtained based on the maximum frequency difference between empirical and theoretical distribution functions as:
In which is the real cumulative relative frequency, and is the expected cumulative relative frequency. If is less than the critical value then the null hypothesis () is accepted. Here, the hypothesis is no significant difference between empirical and theoretical values. In this study, the K-S test at 95% confidence level (or 5% error level) was examined [21]. As another criterion, if p-value is less than 0.05, the corresponding function is not desirable.
Another method for the goodness-of-fit evaluation of SPI values is the normality test, which is used for SRI data in the current study (Wu et al., 2007). The normality degree would decline when the ratio of zero values in initial data was high. Furthermore, a weak fitting of the selective distribution function could lead to non-normality in the SPI time series [6].
2.5. Determining SRI Confidence Intervals and Uncertainty Analysis Using Monte Carlo Method
The resampling Monte Carlo Method (MCM) was used for uncertainty analysis. The MCM is classified among the calculation algorithms for which the results are obtained based on stochastic sample iteration. This method is often used in physical simulation, mathematical systems, commercial risk assessment, and uncertainty evaluation of measurements in testing and calibration laboratories. Calculations of this method are commonly performed on computers and its application is best justified when descriptive methods are not responsible for the evaluation and analysis of phenomena when different inputs and outputs or their results are not so reliable.
MCM was employed for different time scales (k= 3, 6, 9, 12, 24, and 48 months), different years (j = 1966, 1967, …, 2014), and different months (i = 1, 2, …, 12). The next steps of MCM were as follows:
- Using Latin Hypercube Sampling (LHS) to generate a number of 50,000 stochastic discharge samples for each according to the probability density function (here: Normal, Gamma, Weibull, and Lognormal).
- Fitting an appropriate distribution function to the generated data.
- Calculating the cumulative probability for the values and changing it to standard normal values (SRI) similar to the SPI calculation.
- Analyzing the upper and lower limits for 95% confidence level, including 97.5% () and 2.5% () percentiles.
- For more clarity, some of the steps are shown via an example in Figure 2a,b, which refer to the determination of the SRI confidence interval for a discharge value (k = 6 months’ time scales, i = 2013; j = 2 is 8.563 m3/s (6 months’ time scale, 2: February in 2013; ) recorded at the Minab station. In this example, the Gamma distribution is adopted for the description of discharge probability. In particular, Figure 2a shows 50,000 cumulative distributions, obtained by fitting the Gamma distribution to each of the N samples. In Figure 2b, the empirical cumulative distribution function of the M values of P () is drawn, and the 5th P () = 0.259) and 95th P ) = 0.75) percentiles are determined. The standard normal variates corresponding to these cumulative probabilities are, respectively, the lower (SRI = −0.64) and upper (SRI = 0.69) limits of the SRI confidence interval (p = 90%).
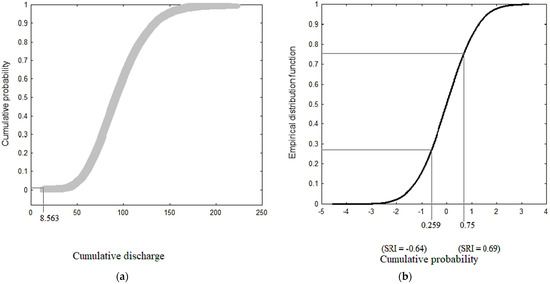 Figure 2. Representation of some steps required to obtain a confidence (a) cumulative distributions function (b) the empirical cumulative distribution function.
The interval for SRI by a Monte Carlo procedure. The example concerning the station of Minab, the time scale k = 6 months, the month j = 2, and the discharge value X = 8.563 m3/s. (a) The M (M = 50,000) Gamma cumulative distribution functions (fitted to each sample Monte Carlo from the original discharge data) and M possible values of cumulative probability P ( are estimated, and (b) the empirical cumulative distribution function of the M values of and the 0.25 th P () = 0.259 and 0.75 th P () = 0.75 percentile detected. The standard normal variates corresponding to these cumulative probabilities are, respectively, the lower (SRI = −0.64) and upper (SRI = 0.69) limits of the SRI confidence interval (p = 95%)
3. Results and Discussion
3.1. Goodness-of-Fit and Normality Test Results
Results of K-S and normality tests for two record lengths (30 and 49 years) are given in Table 2. For the long period (49 years) and Gamma distribution, according to the results of the K-S test, all time scales were significant, and according to the normality test, all time scales except 3 months were significant. For the Weibull and Lognormal distributions, both K-S and normality tests showed significant fitting for 6-, 9-, 12-, and 48-month time scales. For the Normal distribution, none of the time scales were significant. Finally, according to Table 2, Gamma and normal distributions showed the best and weakest fits. For a short period (30 years), most time scales were significant for the Weibull and Gamma distributions. The mitigation of record length from 49 to 30 years resulted in a reduction in significance percentage for the Normal and Lognormal distributions.
Table 2.
Results of the Kolmogorov–Smirnov test (K-S test) at the 0.05 significance level and the Normality test.
3.2. Monitoring of Drought Using SRI
Figure 3 shows the results of drought monitoring for a 48-month time scale according to the discharge data for long (49 year) and short (30 year) time periods. Commonly, different distributions showed similar results for various time scales, such that wet and dry years were estimated more or less identically. Among all cases, under-estimation (the highest drought intensity) was related to the lognormal function and over-estimation (the maximum non-drought intensity) was related to the Normal distribution. As an example, for the 49-year record length and 48-month time scale (Figure 3a), the extreme values of SRI were −3.24 and +2.94, estimated by Lognormal and Normal distributions, respectively. Furthermore, the estimated values from of the Gamma and Weibull distributions were very similar. Similar results were obtained for other time scales of the 49-year record length as well as all time scales of the 30-year record length.
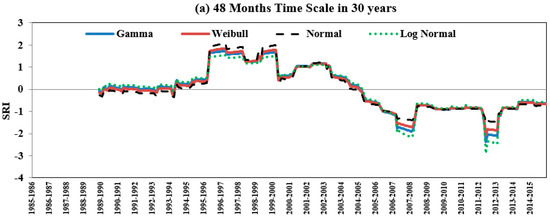
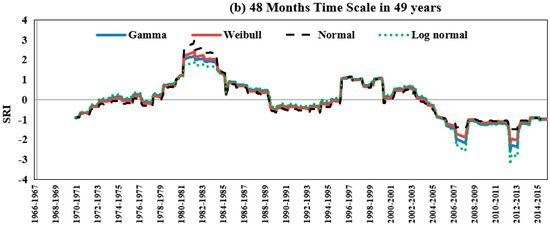
Figure 3.
Drought monitoring using different probability distribution functions; (a) 30 years and (b) 49 years.
3.3. Influence of Selective Distribution Function on Drought Monitoring
In order to determine the upper and lower limits of the confidence interval, the SRI values for 3–48-month time scales were calculated; for the predefined confidence level of 95%, the values of average, standard deviation, minimum, and maximum for the upper and lower limits were calculated. According to Figure 4, the highest and lowest values of the above-mentioned statistics for both 30- and 49-year record lengths were related to the Normal and Lognormal distributions, respectively.
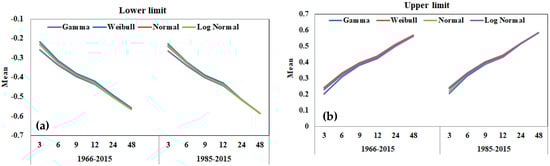
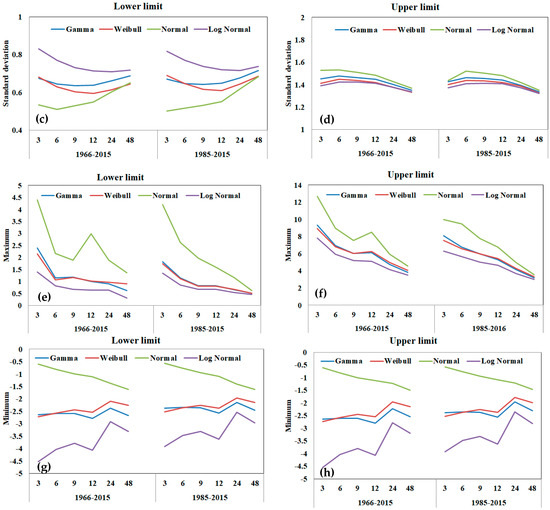
Figure 4.
Average values of mean (a,b) and standard deviation (c,d) of the maximum (e,f) and minimum (g,h) of the size of the SRI 90% confidence interval, varying the underlying probability distribution and the time scale k on the basis of the data of all stations and the complete time series (1964-65 to 2014-15) and (1986–2015).
The investigation of different time scales from 3 to 48 months for all distribution functions, with the exception of the Normal distribution, showed that the increase in time scale resulted in the increase in absolute values of average and maximum and the decrease in absolute values of minimum values. Furthermore, the highest and lowest curves were related to the Normal and Lognormal distributions, respectively (Figure 4). No significant difference was seen between long and short record lengths. Some studies propose that 40 to 60 years of data are needed for the stable estimation of statistics and 70 to 80 years of data are required for stable assessment of SPI confidence limits [9].
3.4. Drought Assessment of Specified Confidence Limits and Distribution Functions
The aim of this section was to estimate the uncertainty in the SRI estimation. Graphical analysis of SRI time series shown as upper and lower limits could reveal some information about this uncertainty. For instance, Figure 5 displays the results of SRI values as well as the 95% confidence interval for the 48-month time scale and the 30- and 49-year time series. To avoid complexity, the display period was limited to 2010–2015, and the results of August 2012 are shown for all distribution functions.
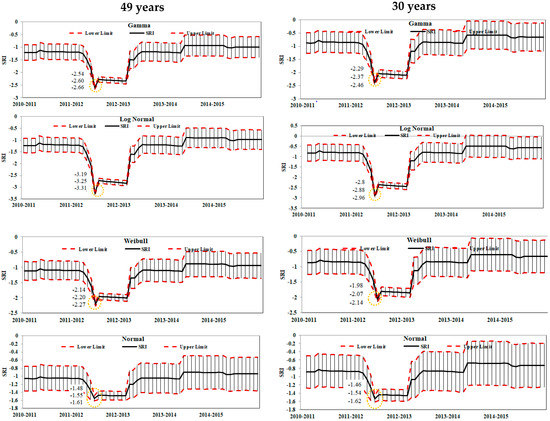
Figure 5.
Time series 2010-11–2014-15 of SRI-48 and of the corresponding 95% confidence limits according to different underlying probability distributions (Gamma, Lognormal, Normal, and Weibull) (Aug 2011–12).
As shown in Figure 5, for August 2012, the upper and lower limits from the Gamma distribution function were (−2.54, −2.66) for 30 years and (−2.29, −2.46) for 49 years, which were classified as extreme drought. Limits from other distribution functions showed consistency in drought classification. Estimations from the Gamma and Weibull distributions showed no significant differences, while the upper and lower limits of the Lognormal distribution (−3.19, −3.31) estimated the highest drought intensities, but the Normal distribution with (−1.48, −1.61) limits revealed the lowest drought values as moderate and severe droughts, respectively [2]. According to Vergeni et al. [17], among the two-parameter distribution functions, Gamma has better performance.
3.5. Assessment of Maximum Magnitude and Duration of Drought in Studying Distribution Functions
Drought intensity and duration for various time scales and distribution functions were calculated, after which the maximum intensity and the longest duration of drought were obtained for different functions, time scales, and record lengths. Figure 6 displays the maximum intensity and the longest duration of drought for six time scales, four distribution functions, and two time periods. A look at the duration bars showed that longer time scales were accompanied by longer droughts. The longest duration for all time scales was related to the Normal distribution, except the 48-month time scale which was related to the Lognormal distribution. Among the longer time scales (12–48 months), no notable difference was seen between two record lengths (30 and 49 years) for any of the distributions. A survey of maximum drought intensities showed that the increase in time scale led to the increase in drought magnitude. The highest drought magnitude was related to the Lognormal distribution for all time scales, except for the 24-month time scale and the 30-year period, which were related to the Normal distribution. Generally, the highest intensities were observed for the 49-year period.
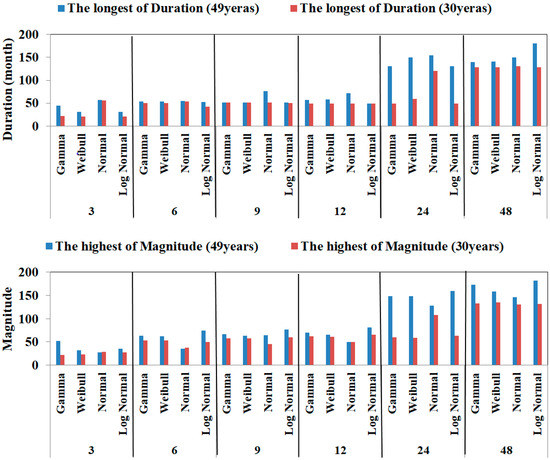
Figure 6.
The highest magnitude and the longest duration for 30- and 49-year time periods, different time scales, and distribution functions.
3.6. Uncertainty Analysis of Mean Upper and Lower Limit Differences in Various Distribution Functions and Record Lengths
The average difference between upper and lower limits for different distribution functions and 3–48-month time scales was surveyed. As displayed in Figure 7, after an increment of time scale or record length, a reduction in uncertainty was detected. No significant difference was seen between four distribution functions. This result shows consistency with other studies in the literature [16,17,18]. Based on Vegni et al. [17], the record length is a leading source of uncertainty in SRI estimates since the mean and the standard deviation of the size of the confidence interval increase considerably passing from the 49-year to the 30-year time series. However, with the increase in the time window from short term to long term, this effect is less evident. The results of the present research also show the same truth. In fact, according to Wu et al. [10], 30 years is the minimum record length to have acceptable and reliable SPI and SRI estimates.
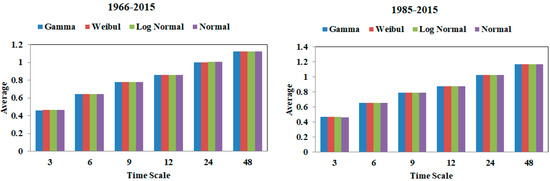
Figure 7.
Uncertainty to upper and lower limit for average statistics in various distributions, time scales (3–48 months), and record lengths (49 and 30 years).
4. Conclusions
The current study was carried out to analyze uncertainty concerning two record lengths (30- and 49-year), four distribution function types (Gamma, Normal, Lognormal, and Weibull) and six time scales (3, 6, 9, 12, 24, and 48 months). In order to calculate SRI, each of the four distribution functions was fitted to discharge data separately; goodness-of-fit test and normality of SRI values were evaluated using the K-S test and normality test, respectively. Afterwards, for “i”th month, “j”th year, and “k”th time scale, 50,000 stochastic data was generated by means of MCM and LHS, and an uncertainty interval at 95% confidence level was calculated.
Results of the goodness-of-fit and normality tests for SRI reveal that the Gamma and Weibull distributions had the best fitting, and the Normal distribution had the weakest fitting for both 30- and 49-year record lengths. The interpretation of the Gamma and Weibull parameters provides the possibility of understanding model properties and clustering the models performance for the various precipitation regimes. Unlike the Normal and Lognormal distribution that can intuitively evaluate the behavior of the model through its parameters, in these two models, the effect of parameters cannot be evaluated distinctly and should be considered simultaneously. The runoff data are not normally distributed. They are positive right skewed, and Gamma and Weibull have better performance in these cases.
The maximum and minimum curves of the upper and lower limits for the surveyed functions, time scales, and record lengths showed that regardless of time scale, the highest and lowest values belonged to the Normal and Lognormal distributions, respectively. Furthermore, the absolute values of mean and maximum increased with an increase in the time scale, while the absolute values of minimum decreased. The exception was the Normal distribution, for which the absolute values of minimum showed an increasing behavior with the increase in time scale.
Concerning all studied distribution functions and record lengths, the results manifested that the highest duration and magnitude of drought related to the Normal and Lognormal distribution functions, respectively. Generally, Gamma and Weibull distributions exhibited similar results.
A special regularity was found between the time-scale length and confidence limits, such that an increase in time scale resulted in an increment in the difference between upper and lower limits, after which the confidence interval increased and the uncertainty of estimation decreased. Obviously, for time scales longer than 12 months, uncertainty decreased and similarity between various distribution functions increased.
Author Contributions
Conceptualization, F.G., and O.B.; methodology, F.G.; software, M.F.; validation, M.F., M.P. and V.P.S.; formal analysis, F.G.; investigation, O.B.; data curation, O.B.; writing—original draft preparation, M.F.; writing—review and editing, M.F., V.P.S.; visualization, F.G.; supervision, O.B, M.F.; project administration, M.F., O.B. All authors have read and agreed to the published version of the manuscript.
Funding
This research received no external funding.
Data Availability Statement
Will be sent upon request.
Conflicts of Interest
The authors declare no conflict of interest.
References
- Mishra, A.; Singh, V. A review of drought concepts. J. Hydrol. 2010, 391, 202–216. [Google Scholar] [CrossRef]
- McKee, T.; Doesken, J.; Kleist, J. The relationship of drought frequency and duration to time scales. In Proceedings of the 8th Conference on Applied Climatology, Anaheim, CA, USA, 17–22 January 1993; American Meteorological Society: Anaheim, CA, USA, 1993; pp. 179–184. [Google Scholar]
- Zhu, N.; Xu, J.; Li, W.; Li, K.; Zhou, C. A Comprehensive Approach to Assess the Hydrological Drought of Inland River Basin in Northwest China. Atmosphere 2018, 9, 370. [Google Scholar] [CrossRef]
- Guttman, N. Comparing the Palmer drought index and the standardized precipitation index. J. Am. Water Resour. Assoc. 1998, 34, 113–121. [Google Scholar] [CrossRef]
- Lloyd-Hughes, B.; Saunders, M. A drought climatology for Europe. Int. J. Climatol. A J. R. Meteorol. Soc. 2002, 22, 1571–1592. [Google Scholar] [CrossRef]
- Wu, H.; Svoboda, M.; Hayes, M.; Wilhite, D.; Wen, F. Appropriate application of the standardised precipitation index in arid locations and dry seasons. Int. J. Climatol. A J. R. Meteorol. Soc. 2007, 27, 65–79. [Google Scholar] [CrossRef]
- Angelidis, P.; Maris, F.; Kotsovinos, N.; Hrissanthou, V. Computation of drought index SPI with alternative distribution functions. Water Resour. Manag. 2012, 26, 2453–2473. [Google Scholar] [CrossRef]
- Guttman, N. Accepting the standardized precipitation index: A calculation algorithm. J. Am. Water Resour. Assoc. 1999, 35, 311–322. [Google Scholar] [CrossRef]
- Guttman, N.B.; Hosking, J.R.M.; Wallis, J.R. Regional precipitation quantile values for the continental United States computed from Lmoments. J. Clim. 1994, 6, 2326–2340. [Google Scholar] [CrossRef]
- Wu, H.; Hayes, M.; Wilhite, D.; Svoboda, F. The effect of the length of record on the standardized precipitation index calculation. Int. J. Climatol. A J. R. Meteorol. Soc. 2005, 25, 205–520. [Google Scholar] [CrossRef]
- Sienz, F.; Bothe, O.; Fraedrich, K. Monitoring and quantifying future climate projections of dryness and wetness extremes: SPI bias. Hydrol. Earth Syst. Sci. 2012, 16, 2143–2157. [Google Scholar] [CrossRef] [Green Version]
- Ropelewski, C.; Janowiak, J.; Halpert, M. The analysis and display of real time surface climate data. Mon. Weather Rev. 1985, 113, 1101–1106. [Google Scholar] [CrossRef]
- Wilks, D.; Eggleston, K. Estimating monthly and seasonal precipitation distributions using the 30- and 90-day outlooks. J. Clim. 1992, 5, 252–259. [Google Scholar] [CrossRef]
- World Meteorological Organization. Guidelines on the Calculation of Climate Normals (WMO-No. 1203); World Meteorological Organization: Geneva, Switzerland, 2017. [Google Scholar]
- Vicente-Serrano, S.; Beguería, S.; López-Moreno, J. A multiscalar drought index sensitive to global warming: The standardized precipitation evapotranspiration index. J. Clim. 2010, 23, 1696–1718. [Google Scholar] [CrossRef]
- Hong, X.; Guo, S.; Zhou, Y.; Xiong, L. Uncertainties in assessing hydrological drought using streamflow drought index for the upper Yangtze River basin. Environ. Res. Risk Assess. 2015, 29, 1235–1247. [Google Scholar] [CrossRef]
- Vergni, L.; Lena, B.D.; Todisco, F.; Mannocchi, F. Uncertainty in drought monitoring by the Standardized Precipitation Index: The case study of the Abruzzo region (central Italy). Theor. Appl. Clim. 2017, 128, 13–26. [Google Scholar] [CrossRef]
- Hu, Y.-M.; Liang, Z.-M.; Liu, Y.-W.; Wang, J.; Yao, L.; Ning, Y. Uncertainty analysis of SPI calculation and drought assessment based on the application of Bootstrap. Int. J. Clim. 2015, 35, 1847–1857. [Google Scholar] [CrossRef]
- Nalbantis, I.; Tsakiris, G. Assessment of hydrological drought revisited. Water Resour. Manag. 2008, 23, 881–897. [Google Scholar] [CrossRef]
- Vasiliades, L.; Loukas, A.; Liberis, N. A water balance derived drought index for Pinios River Basin, Greece. Water Resour. Manag. 2011, 25, 1087–1101. [Google Scholar] [CrossRef]
- Naghettini, M. Fundamentals of Statistical Hydrology; Springer International Publishing: Cham, Switzerland, 2017. [Google Scholar]
Publisher’s Note: MDPI stays neutral with regard to jurisdictional claims in published maps and institutional affiliations. |
© 2022 by the authors. Licensee MDPI, Basel, Switzerland. This article is an open access article distributed under the terms and conditions of the Creative Commons Attribution (CC BY) license (https://creativecommons.org/licenses/by/4.0/).