Article

Impacts of Air Pollution and Dampness on Occupant Respiratory Health in Unplanned Houses: A Case Study of Bandung, Indonesia

1
Graduate School of Advanced Science and Engineering, Hiroshima University, 1-5-1 Kagamiyama, Higashi-Hiroshima, Hiroshima 739-8529, Japan
2
Hiroshima City Hall, Hiroshima 730-8586, Japan
3
Department of Architecture, Universitas Pendidikan Indonesia, Bandung 40154, Indonesia
*
Author to whom correspondence should be addressed.
Atmosphere 2022, 13(8), 1272; https://doi.org/10.3390/atmos13081272
Submission received: 14 June 2022 / Revised: 30 July 2022 / Accepted: 2 August 2022 / Published: 11 August 2022
(This article belongs to the Special Issue Indoor Air Quality and Health Impacts)

Abstract

:
This paper presents the results from field measurements and household surveys on the severity of indoor mold risk and its impact on respiratory health in a typical unplanned neighborhood of kampungs in Bandung, Indonesia. Mold risk was investigated using fungal risk detectors (n = 102), while air pollution levels were established with total suspended particulate (TSP) and particulate matter (PM2.5) (n = 38). The self-reported prevalence of respiratory diseases was obtained using a questionnaire form (ATS-DLD-78) (n = 599). The results showed that respiratory health problems were higher in the rainy season, particularly among children. Most houses suffered from severe mold risk, primarily due to extreme humid weather conditions, especially during rainy season (97%) where water leakage was prevalent (60%). In addition, the TSP and PM2.5 concentrations exceeded the WHO standards in most kampung houses, where around 58% of the houses recorded higher outdoor mean PM2.5 concentrations than indoors. Further, the path analysis showed that allergies followed by humidity rate and smell, which were affected by window-opening duration, directly impacted children’s respiratory health. Smoking behavior and building-related health problems, due to exposure to outdoor air pollution, affected the respiratory health of those aged 15 years old and over.

1. Introduction

People spend most of their time (90%) indoors [1]. Therefore, indoor air quality (IAQ) becomes crucial to address the health and well-being of the occupants. In particular, in developing countries, occupants in residential buildings can be exposed to a complex mix of air pollution not only from indoor sources but also from outdoor sources [2]. Building dampness is one of the causes of IAQ problems that commonly occur in many countries [3,4,5,6,7]. Common built-environment related challenges, such as dampness in housing, have been thoroughly associated with numerous adverse health symptoms, particularly of the respiratory system, including (i) aggravation of asthma, (ii) increased occurrence of wheezing, coughing and other respiratory symptoms, (iii) increased rate of upper respiratory infections, and (iv) irritation of airways [7]. There are observable qualitative signs of current or/and past dampness, including visible mold spots, water damage or leakage, floor moisture, visible damp spot, and condensation on windows [8,9,10,11]. Intermediate flood incidents and high humid weather conditions are often ideal for indoor mold growth, imposing severe concerns about the possible adverse direct and indirect health effects associated with indoor mold exposure. Though not many, there are several examples of evidence proposed that the indoor mold growth and subsequent human exposure to spores, as well as to mold cell wall proteins, may cause occupant health problems [3,4,5,6,8,11,12,13,14,15,16,17], especially diseases related to asthma and allergic [18,19,20,21,22,23]. On the other hand, outdoor air pollution (e.g., SO2, NO2, O3, and PM) can increase the risk and incidence of IAQ problems. Outdoor air pollution is still increasing in most developing countries primarily due to industrialization and urbanization [24]. In addition to indoor ventilation conditions, occupant behavior, including window-opening behavior [25], indoor smoking habits [26], and ventilation-related behavior, such as installation of active cooling devices [27], also modifies indoor mold growth and IAQ levels.
The world’s fastest population and urban growth are experienced in Southeast Asian cities [28]. Indonesia has a population of more than 250 million as of today, and it is continuously rising, particularly in urban areas. However, many parts of the cities still comprise traditional unplanned houses, the so-called kampungs. Most kampung houses are tiny, detached houses constructed by non-professional workers in densely crowded settlements. Despite the different definitions, the term, kampung, can be translated as an urban village. The houses in kampungs vary in size and wealth, and it is possible to see many different house types in the same kampung [29]. Moreover, houses in kampungs still carry community behaviors and build characteristics of rural life, i.e., close family ties, rich social connections (leading to a high sense of ownership), and irregular and informal building environments [30]. This morphology of a kampung leads to an urban microclimate, where relative humidity (RH) is often significantly higher compared to other urban areas, which was measured at 74–91% in the dry season, especially in Bandung [31]. Dampness and mold are, therefore, commonly seen in kampungs, particularly during the rainy season and seasonal floods, and thus adverse health effects, especially respiratory diseases, are suspected among residents.
Bandung has significantly evolved from a small-sized city to an extensive and populous city, where the urban economic activities have expanded, together with the development of residential areas, businesses, and basic infrastructures [32]. Currently, Bandung is the third-largest city in Indonesia, where there are 121 neighborhoods, which are categorized as kampungs. Whereas the proper urban infrastructure has not yet been provided, most kampungs are highly dense, resulting in irregular grid patterns and chaotic neighborhoods. Bandung also experienced an increase in average air temperature, urban heat island phenomenon, and high humidity level [31,33]. Furthermore, compared to Jakarta and Surabaya (the first and second-largest cities in Indonesia), there were fewer Kampung Improvement Programs (KIP) implemented in Bandung [34]. Therefore, these conditions made it essential to investigate Bandung as the study area where the dampness and IAQ problems might occur in unplanned houses, kampungs.
Previous studies analyzed IAQ and dampness, mainly focusing on the region of the global north [7,35] and four-season counties [36], which have very distinct climatic features compared to the tropics. The limited studies related to this topic within the topics focused on non-residential buildings, such as schools and offices, with children as the primary samples [37,38,39,40,41] had limitations in the assessment method, which was based on self-reported information [23] and focused only on investigating the current indoor environment condition of the schoolchildren’s houses [42]. Meanwhile, this study applied a combination of objective measurements and self-reported surveys to assess dampness in health-related epidemiological studies [43] and investigated the influential factors that affect occupants’ respiratory health among children, youths, and adults. This study investigates the health status and living environment of typical dense unplanned houses, kampungs, where dampness and health problems, especially respiratory diseases, are suspected among the residents. The study analyzed the correlation of the living environment in kampung, such as dampness, mold, and air quality, to a respiratory health condition through a statistical analysis. In Section 3, first, we analyze the respiratory health of the occupants and the results of field measurements to reveal the current conditions. Second, the factors affecting respiratory health and the relationship between the physical environments and behavior are analyzed.

2. Materials and Methods

Bandung is the provincial capital city of West Java that is considered one of the densest cities in Indonesia [44]. A typical kampung neighborhood in the center of Bandung, Kampung Pasteur, comprising 360 households, was selected as the case study area. These unplanned houses accounted for 68.5% of the total existing housing stocks in Bandung [45]. It is located close to the main street, in the business district with a large shopping mall and traditional market nearby. The roads in the kampung were narrow, barely wide enough for one motorcycle to pass (Figure 1). The total area is 5.3 hectares, comprising six RTs (sub-neighborhoods). After obtaining consent from the head of the neighborhood association, the first field measurements and interviews were conducted during the dry season (September–November 2018) and the rainy season (March–April 2019). The second additional field measurement of particulate matter (PM) and total suspended particulate (TSP) was conducted in the next dry season (September–November 2019) based on the result of the first measurement. We interviewed a total of 599 respondents, i.e., 333 and 266 residents in dry and rainy seasons, respectively. These respondents were randomly chosen by visiting the houses in every certain interval. A total of 102 samples who agreed to participate in the measurement were selected for field measurements of mold risk (potential mold growth in the measured area), air temperature (AT), and relative humidity (RH), whereas 38 houses were selected for TSP and PM2.5 measurements (Table 1). These surveys and measurements were conducted before the COVID-19 pandemic and, therefore, there was no influence on the results.

2.1. Questionnaire Survey: Household Attributes and Self-Reported Health Conditions

The face-to-face interviews were conducted using a questionnaire form, based on the American Thoracic Society-Division of Lung Diseases (ATS-DLD-78) [46]. The ATS-DLD questionnaire has been widely used in the literature to investigate general respiratory health [47,48,49]. Information about personal attributes, occupational history, building characteristics, cleaning habits, window-opening behavior, and tobacco smoking habits was inquired (Table 2). Interior features, including envelope features and ventilation conditions were additionally recorded. Self-reported health symptoms of cough, phlegm, wheezing, breathlessness, chest colds, and chest illnesses were reckoned by yes/no questions. Similarly, the occurrence of mold, mites, and water leakage were also self-reported by yes/no question based on the observation of the respondents. The whole survey was carried out for two target groups, children under 15 years old and youths, and adults and seniors of 15 years old and over. The questions were slightly different between these two groups; for children, questions about allergies were added, and for adults, questions about work history and smoking habits were added.

2.2. Field Measurement: Indoor and Outdoor Air Quality

Various types of sensors with data loggers were deployed in the dwelling units to gain insight into air pollution and mold conditions (Table 3). The air temperature and humidity sensors were validated by comparing with the Asman thermometer by the researchers, whereas the dust meters and the fungal risk detectors were validated in the manufactures before the measurement. The mold risk measurements were taken at approximately 10 cm above the floor in the master bedroom during the dry and rainy seasons, respectively (Figure 2b). The sampler was kept in a dry place with silica gel before the measurement. The measurement was conducted by exposing the fungal risk detector to the ambient environment for two days to four weeks, followed by keeping the detector in a container with silica gel to stop the growth of the hyphae. This sample was then sent to the laboratory for mold prediction in Japan. Fungal contamination was predicted using a fungal risk detector developed by Abe [50], which is a device containing the dried fungal spores, which have different sensitivity to RH (moderately xerophilic Eurotium herbariorum J-183, strongly xerophilic Aspergillus penicillioides K-712, and hydrophilic Alternaria alternate S-78) and nutrients. The number of the response unit, ru, was determined from the length of hyphae in each sensor [51,52]. The fungal index, defined by Abe [50], quantifies the capacity for mold growth in the environment being examined. Therefore, similar to the previous study [53], it was considered one of the valuable indices for evaluating microclimates for potential mold growth in buildings, although a moisture meter is commonly used in the measurement of a given surface on the other hand [54] (p. 5). AT and RH were measured simultaneously using a sensor (T&D 72ui, 72wf & 73u) at five minutes intervals for seven days. Meanwhile, a digital dust meter (SIBATA, LR-5R) was also deployed to measure the TSP and PM2.5 at 1.1 m above the floor in indoor (bedroom) and immediate outdoor environment for 24 h with an interval time of one minute (Figure 2a,c). This device applied a dust indicator based on the light scattering methods, which enabled the calculation of particles and fumes that can output the average particle size in air based on the specific sensor for particle size [55]. It is suitable for a measurement in a specific location for an extended period [56]. The outdoor measurement was recorded in front of the house at a roofed place facing the front alley.

2.3. Statistical Analysis

A path analysis using the results of the questionnaire survey was performed to find the causal structure, influencing particularly the persistent cough among the Kampong residents in Bandung. Here, the self-reported respiratory disease symptoms were considered as the dependent/objective variable. The path analysis clearly presents the strengths of mathematical relationships between variables, which helped to simultaneously assess the structure of relations among variables [57]. In order to depict the relationships between variables, this method uses various types of models, based on the hypothesis of the researcher. Direct and indirect relationships among variables are the parameters used to describe the amounts of variances. In this study, first, a linear regression analysis was conducted to find the hypothesis variables involved in the path analysis model. The regression analysis was conducted from the dependent variable (downstream) to the upstream (explanatory variables/independent variables). Second, the path analysis was conducted based on the results of the linear regression. The best fit model was found by trial and error based on the indicators, including CFI (>0.8), RMSAE (<0.05), and chi-square values of the model. All the statistical analyses were conducted using the SPSS program.

3. Results and Discussion

3.1. Household Survey

Table 4 demonstrates that the average age of respondents was 36.3 years old, with 17.9% of children aged under 15 years old. Male respondents were more frequent than females (52.3/47.7%) in the children group, whereas female respondents (44.7/54.5%) prevailed in larger numbers in the group of 15 years old and over. It is noted that working population is defined to be 15 years old and over in Indonesia [58]. These demographic profiles almost correspond with those of the general Indonesian population, in which the percentage of children was 26.8% and the male/female ratio was 51.1/48.9% for children, while that for 15 years old and over was 49.9/50.1% [59]. The majority of the respondents (56.3%) belonged to the income group of USD 150–450, whereas the average monthly household income in Bandung was approximately USD 190 [60].
It was observed that the respondents tended to open windows for approximately 9 h in the bedroom and 12 h in the living room, particularly during the daytime. Approximately 46.2% of the respondents (active; 31.9%, passive; 36.5%) were exposed to environmental tobacco smoke (ETS) during the dry season, while more than 62.9% (active; 50.0%, passive; 47.1%) were exposed to those during the rainy season. The main difference between active smoking and passive smoking is the type of smoke inhaled. Active smoking breathes in the mainstream smoke (MSS) during a puff, whereas the passive smoker inhales the smoke generated by the lit cigarette between two puffs (SSS) and the smoke exhaled by an active smoker (EXS) [61]. Children are commonly exposed to the environment where there is an adult smoker around them, which categorizes them as a passive smoker. It is a frequent habit in Southeast Asia, where the smoking rate is 29.0% [62].
As indicated in Table 5, the sample size for the dry season was 333, whereas that for the rainy season was 266. As shown, there was little difference between the two samples in terms of socio-economic profiles, such as gender, age, income as well as building age, and, therefore, these two samples are considered comparable. Among the whole sample, the average building age was 40.7 years, with 36.5% of more than 50 years old. It should be noted that, overall, approximately 24.8% and 32.1% of houses did not have any windows in the master bedroom and the living room, respectively.
Dampness was prevailed in the kampung houses. Visible mold was reported in 48.9% of the houses, whereas 64.0% of dwellings in the children group indicated the presence of mold. Furthermore, about 18% of houses reported mite problems; water leakage (59.9%) along with smell and odor (60.6%) was reported, particularly in the rainy season. Overall, IAQ was perceived to be ‘dirty’ by 15.3% of the respondents of 15 years old and over and 18.7% of those under 15 years old; about 19.3% (≥15 years old) and 12.0% (<15 years old) of the respondents perceived outdoor air quality (OAQ) to be ‘dirty’. Approximately 10.1% of the respondents expressed the feeling of being annoyed by the outdoor air pollution.

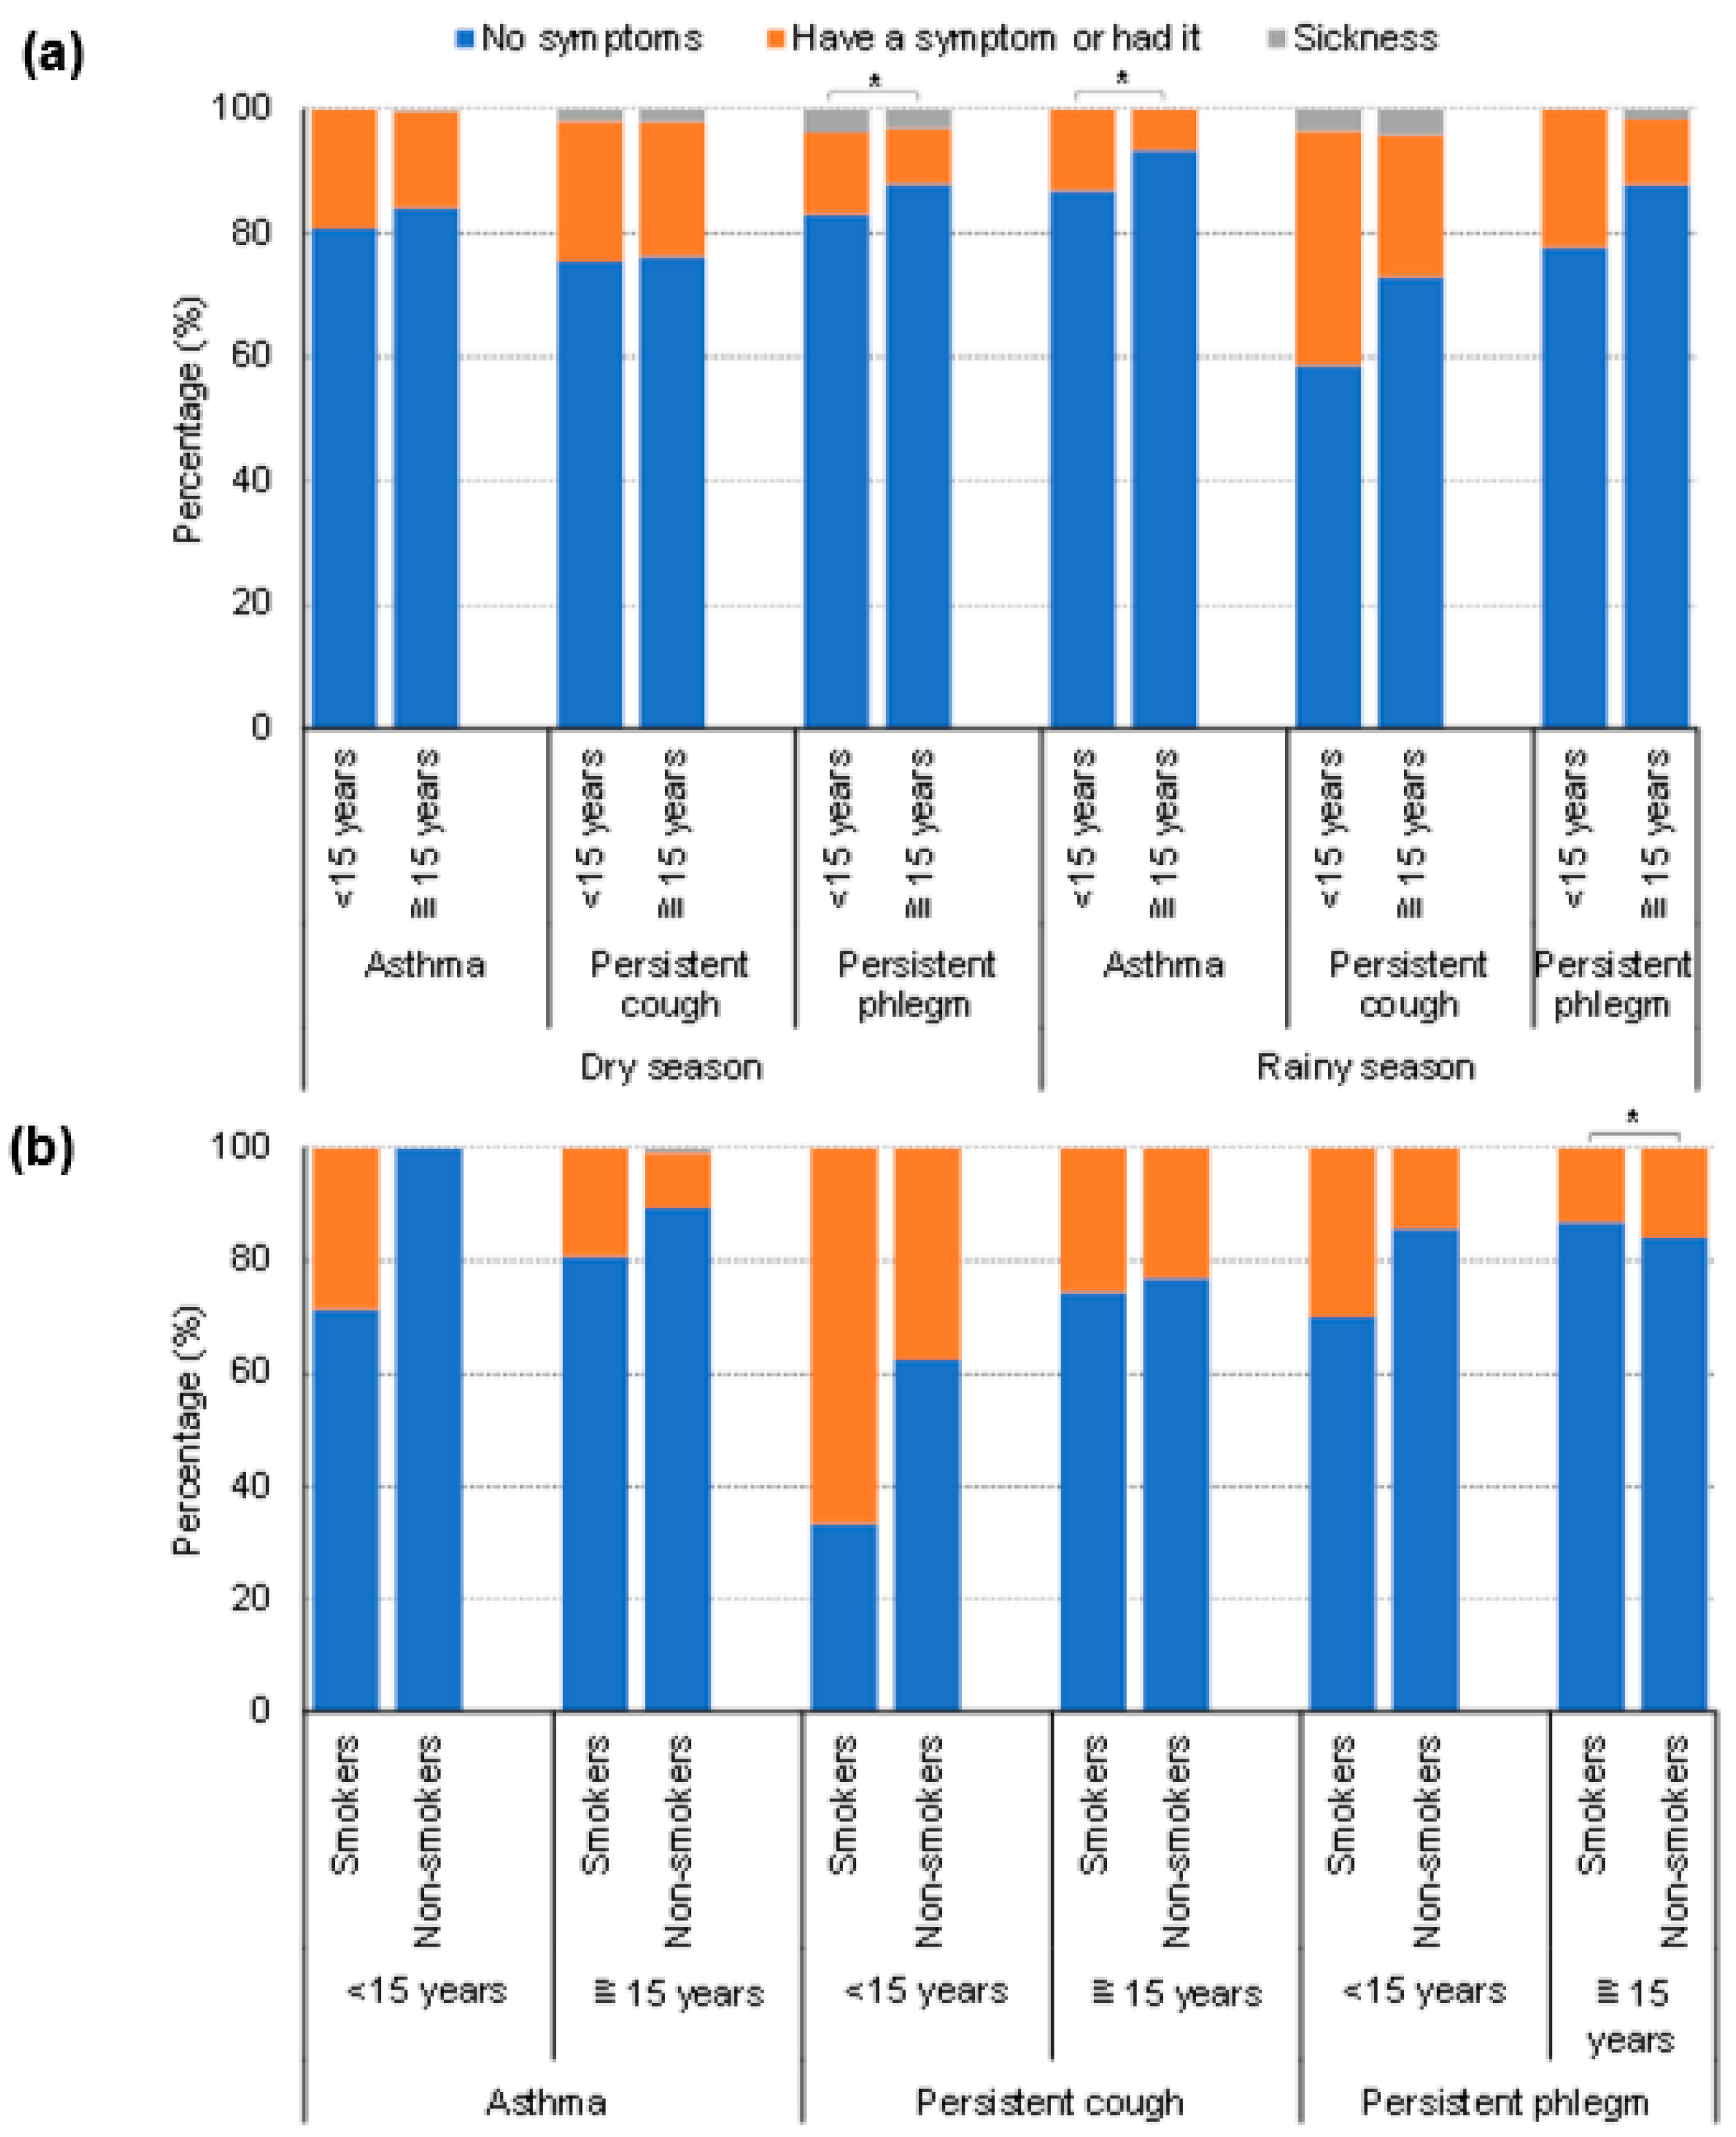
3.2. Self-Reported Respiratory Health

The questionnaire of the ATS-DLD-78 investigates the magnitude of symptoms on respiratory health, including asthma, persistent cough, and persistent phlegm. Comparisons were made for different seasons and ages, with those under 15 years old and 15 years and over, respectively, because the questionnaire form for children and adults was initially constructed differently in the ATS-DLD-78. As shown in Figure 3a, overall, those under 15 years old exhibited a higher percentage of severe symptoms (i.e., sickness) except asthma in the dry season. In the dry season, the percentages of sickness and some symptoms among those under 15 years old were found to be 19.2% (asthma), 24.4% (cough), and 17.0% (phlegm), respectively, whereas the incidence rate increased in the rainy season, especially in persistent cough and phlegm, with 13.0% (asthma), 41.3% (cough), and 22.2% (phlegm). The percentage on persistent cough was also found to be the highest among those of 15 years and over, with 23.8% and 27.1% in dry and rainy seasons, respectively.
Figure 3b compares the magnitude of symptoms between smokers, including active and passive smokers, and non-smokers for those under 15 years old and 15 years and over, respectively. As shown, the magnitudes are higher for smokers among those under 15 years old for asthma, cough, and phlegm, although significant differences were not obtained, mainly due to the small sample sizes.

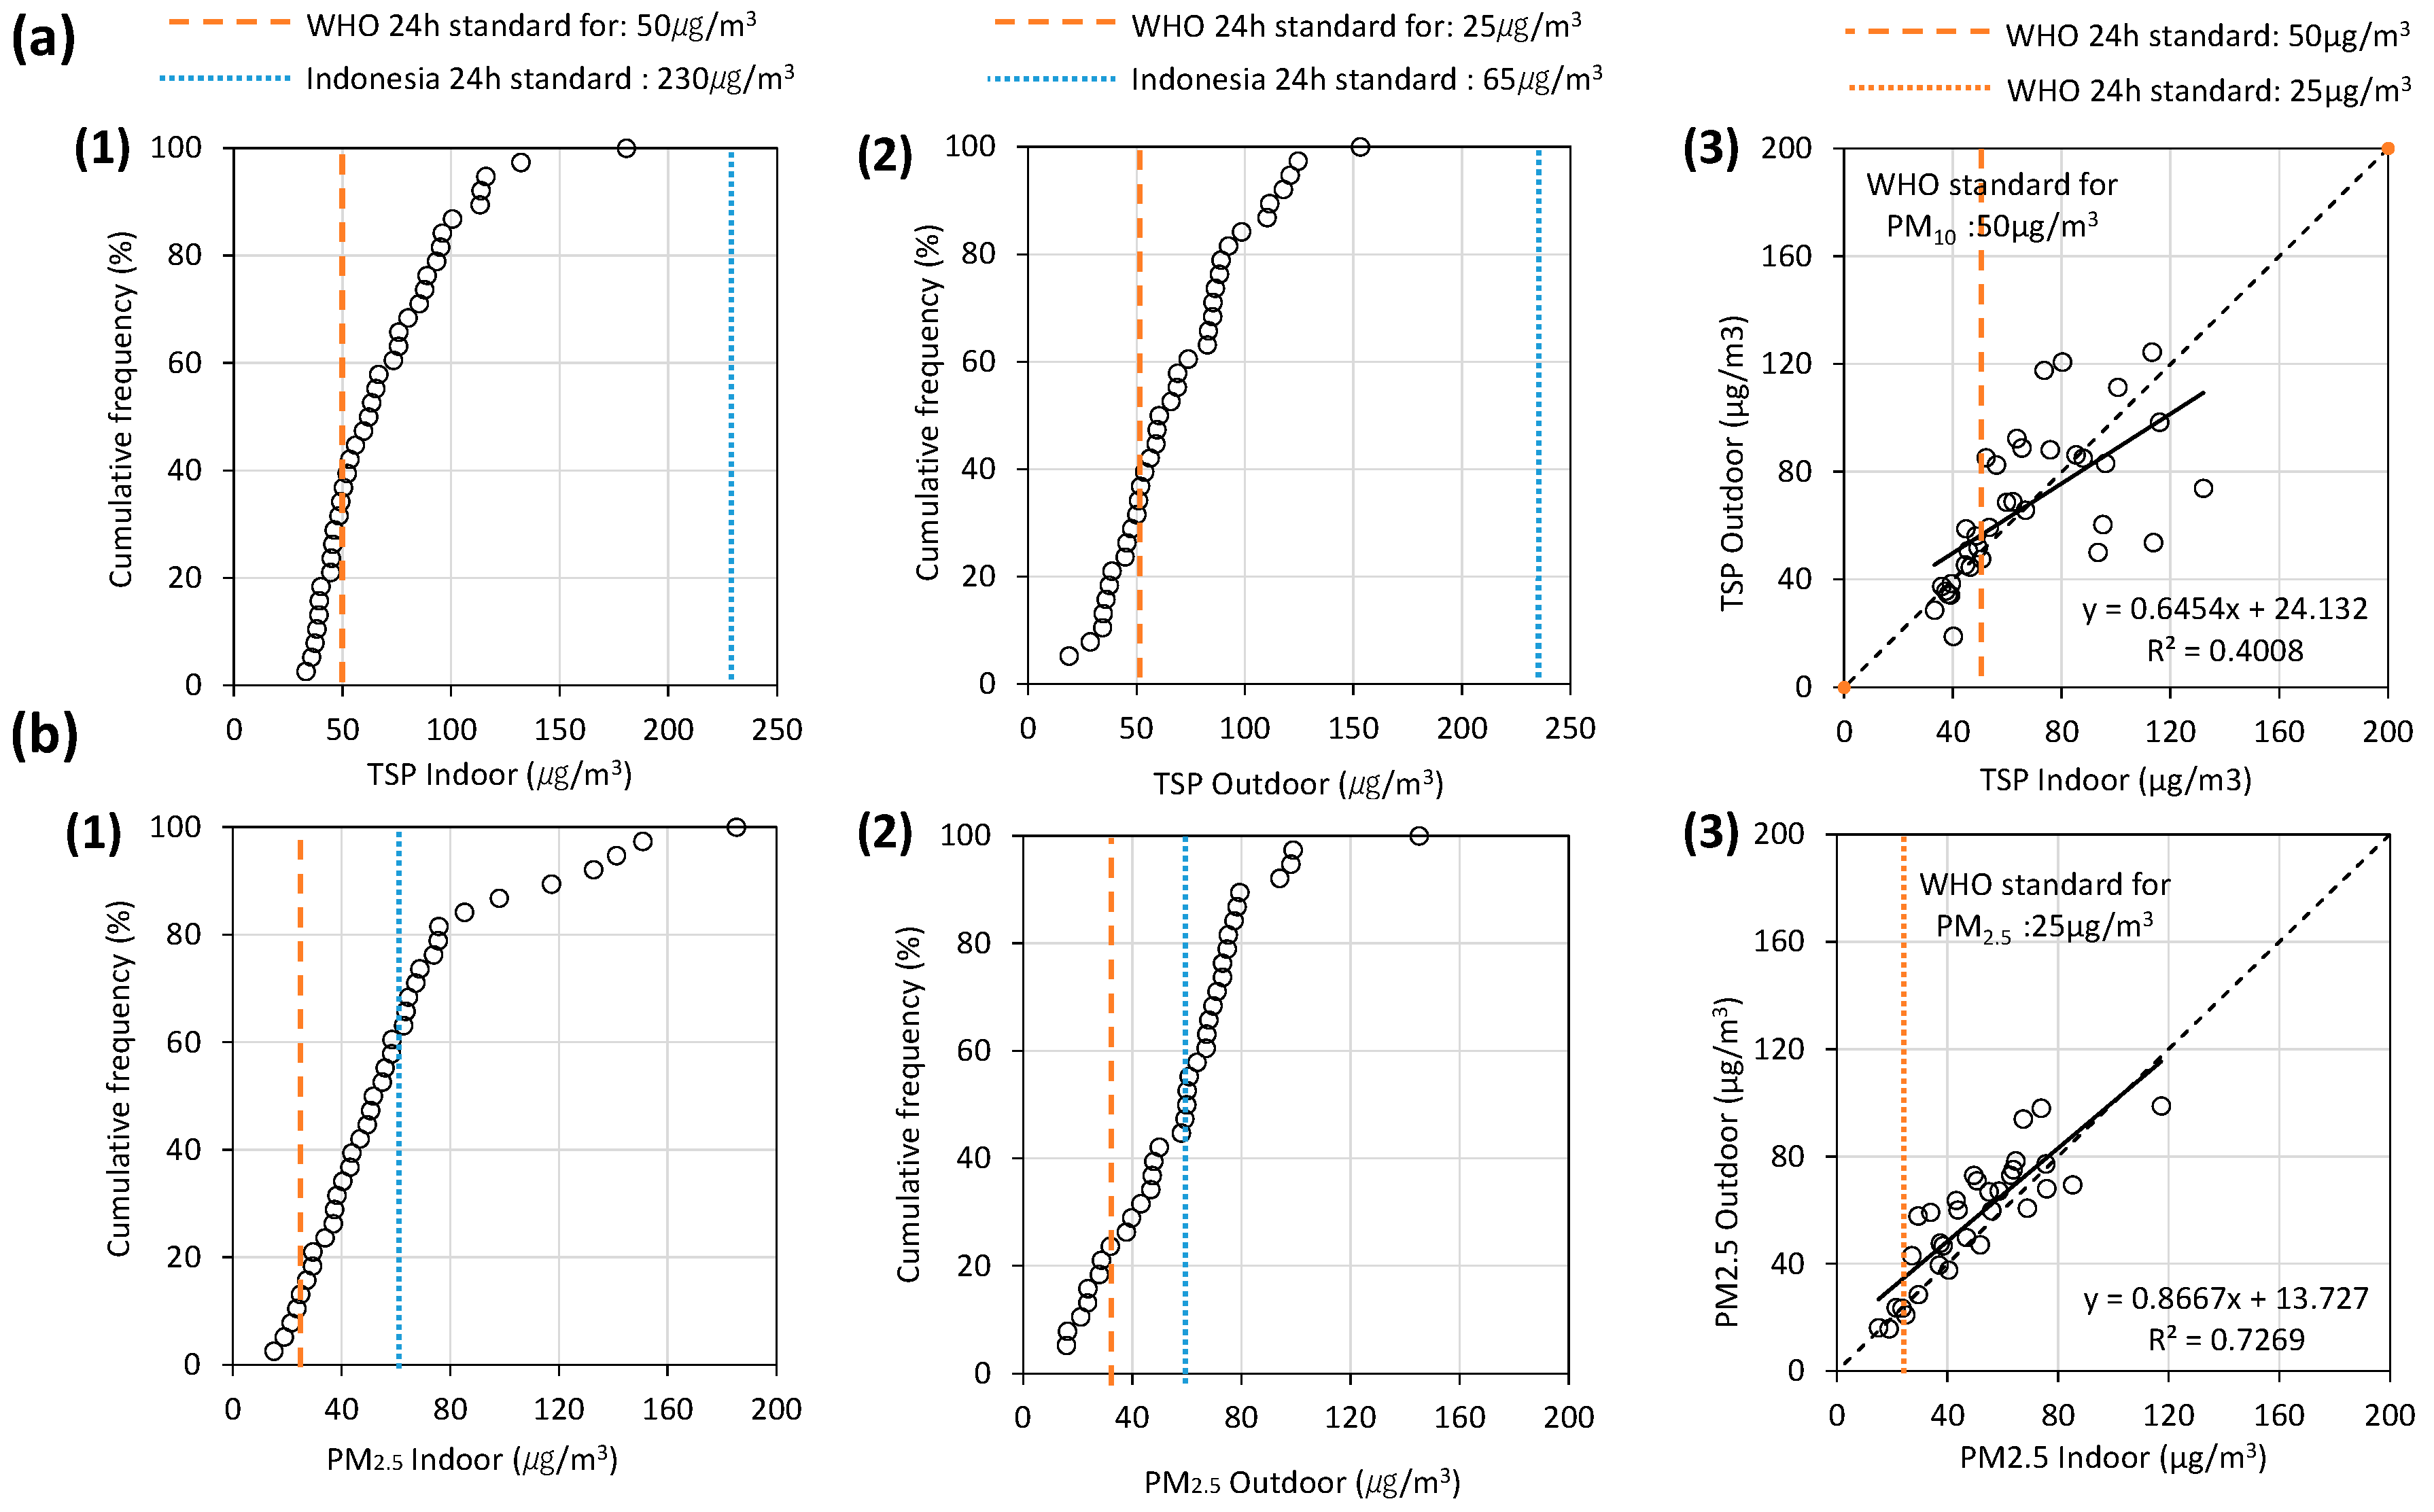
3.3. Field Measurement

Figure 4 illustrates the results of mold risk measurement associated with the measured thermal conditions. Mold risk is expected to turn apparent when the RH exceeds 70% and air temperature is below 27 °C (Figure 4b,c). The mold risk A means that there is no possibility of fungi propagation while D indicates a high possibility of propagation. The mold risk was found to be severe, mostly in the rainy season of 2019, with 97% of houses experiencing a high risk of propagation. In the dry season of 2018, 67% of houses were exposed to the high risk of mold, although owing to exceptionally low humidity (average 65%), 91% of houses showed no possibility of mold propagation in the dry season of 2019. In the dry season of 2019, indoor air temperature was higher on average (26 °C) and often exceeded the above threshold point of temperature. However, the measured mold indexes were found to vary in a negligible magnitude even when the indoor RH was observed to be more than 70%. This can be attributed to the other conditions, such as surface material properties and dampness conditions.
Figure 5 presents the 24 h average indoor and outdoor particle concentrations for each dwelling. As shown, in most houses for both TSP and PM2.5, indoor concentrations correspond with those of outdoors with several exceptions (i.e., outliers), where indoor concentrations significantly exceeded that of outdoors. Similar results were obtained in a field measurement conducted by Lueker et al. [1], where indoor and outdoor PM2.5 concentrations were correlated in slum tenements of Dharavi, Mumbai, India, except for a few indoor cooking induced particulate spikes. In this study, the average indoor TSP was reckoned at 70.5 μg/m3, with approximately 65% of houses exceeding the WHO standard (24-h PM10) for indoor TSP concentrations (50 μg/m3) (Figure 5a). Besides, the average indoor PM2.5 was recorded at 61.9 μg/m3, with approximately 87% of houses exceeding the standard threshold concentration of PM2.5 (25 μg/m3) (Figure 5b), indicating severe indoor pollutions. Interestingly, for 58% of the houses, the average outdoor concentration of PM2.5 exceeded that of the indoor (Figure 5b(3)). Meanwhile, in TSP, 47% of the average outdoor concentration was higher compared to average indoor TSP concentration. This can be attributed to the emissions from diesel engines and hydrocarbons, particularly from 2-stroke motorcycles, and air pollution, such as haze from open burning.

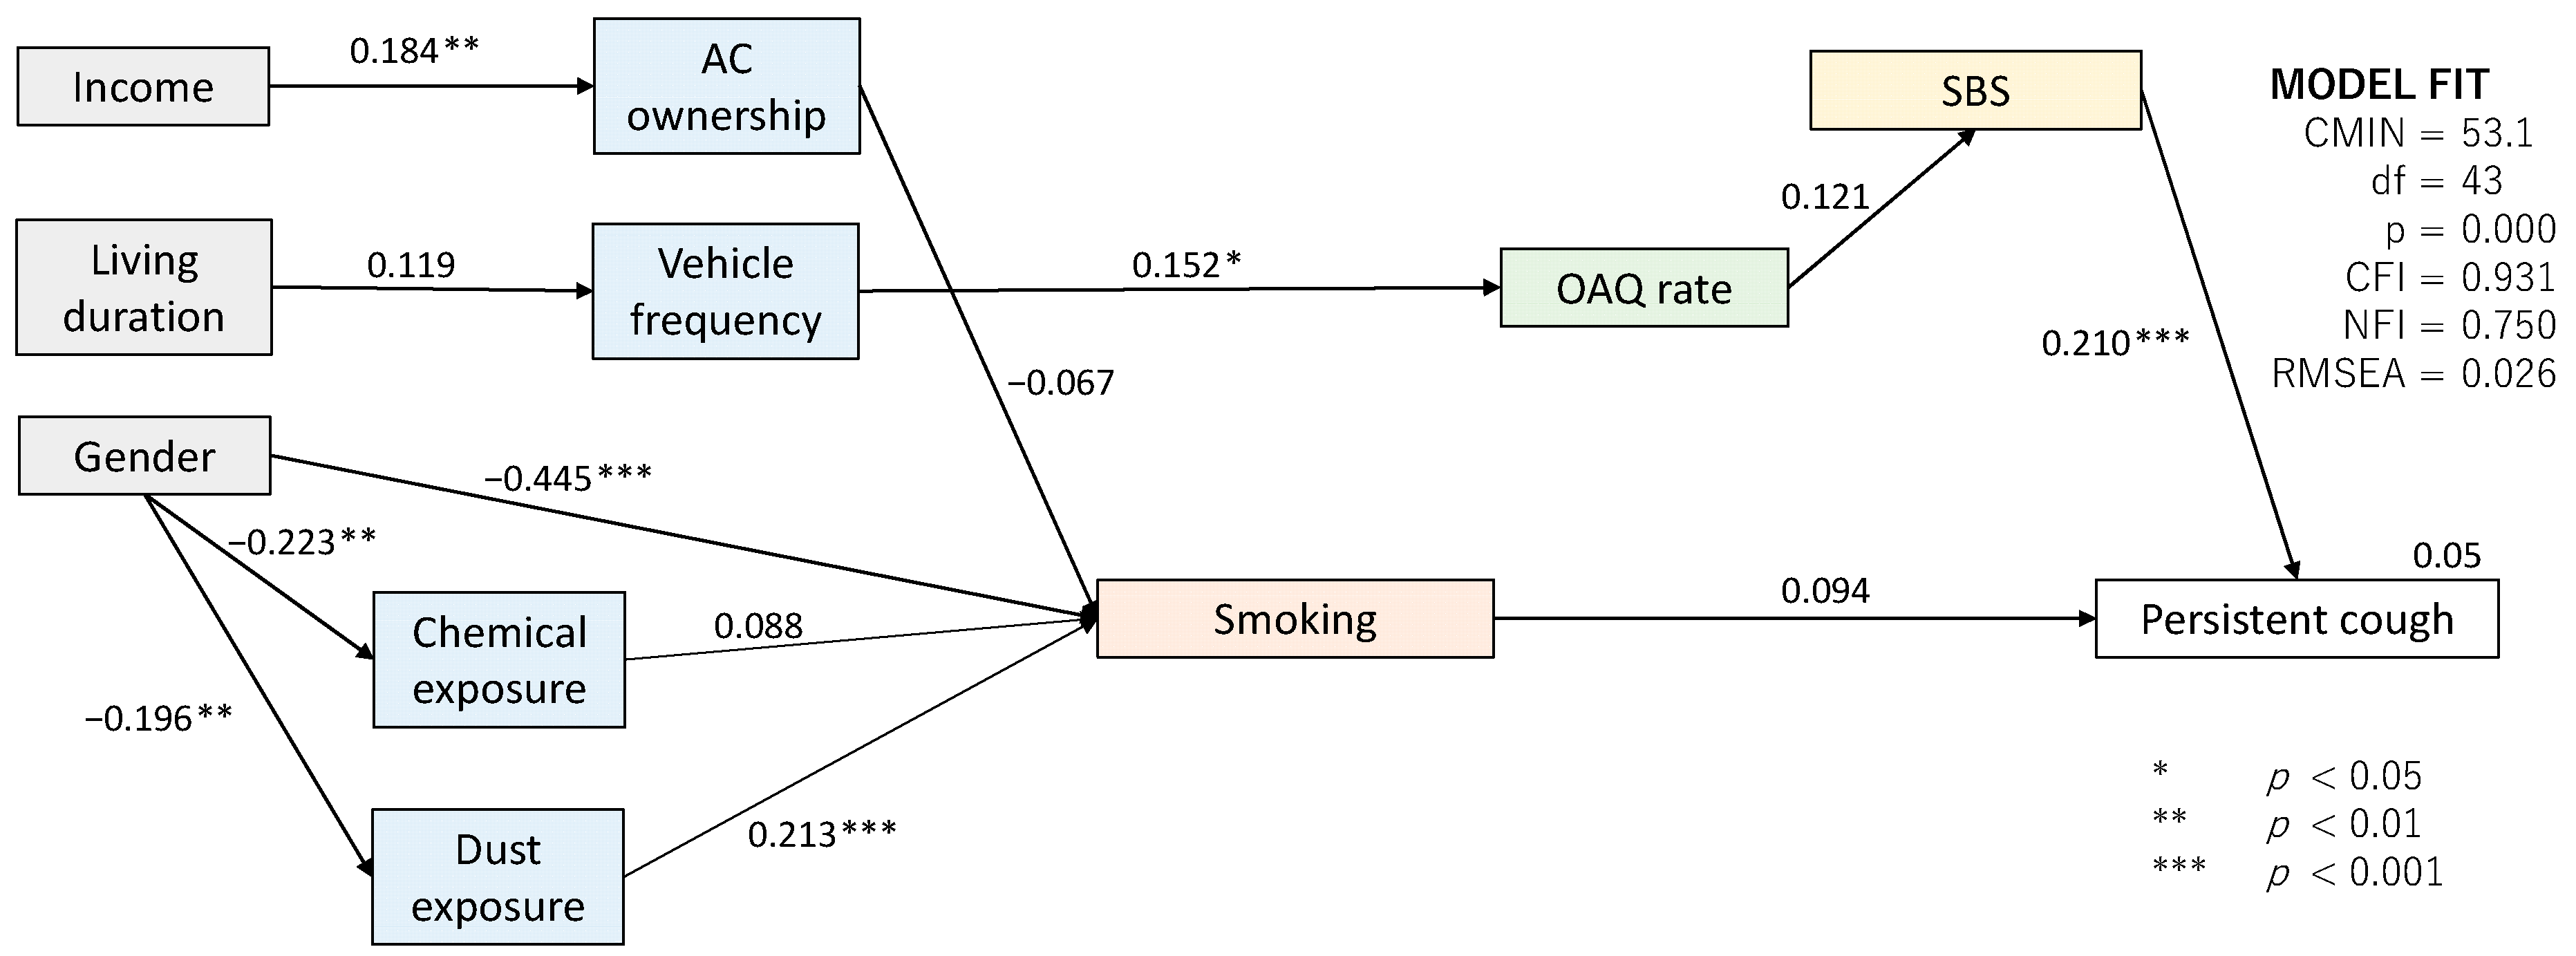
3.4. Factors Impacting Occupant Respiratory Health Symptoms

The path analysis was performed using the IBM AMOS to identify the factors affecting occupants’ respiratory health problems. In this study, the persistent cough was selected as the major dependent variable for the path analysis, due to its highest occurrence rate among the self-reported respiratory health symptoms (see Figure 3). In a path analysis, the impacts of an explanatory variable on the dependent variable are analyzed in the following three categories, i.e., direct effect, indirect effect, and total effect. The direct effect indicates the amount of changes in the independent variable, due to a unit change in a dependent variable. The indirect effect measures the magnitude of predicted changes in the dependent variable through interceding variables if one unit of an independent variable changes. It can be calculated by multiplying path coefficients that construct the causal path. The total effect is the addition of direct effect and indirect effect [58].
Figure 6 shows the results of the path analysis for those under 15 years old with persistent cough symptoms. The conformance values of the model are reported as follows: CFI = 0.855, NFI = 0.572, and RMSEA = 0.042, indicating that the model was moderately fitted. The multiple correlation coefficient for persistent cough symptoms is 0.36, indicating that 36% of persistent cough symptom factors among those under 15 years old can be explained through this diagram. As shown, the highest total effect is “allergies” (0.357), followed by “humidity” (0.262), “income” (−0.217), “smell” (0.203), “mite” (0.191), and “window opening in bedroom” (−0.136).
In this survey, persistent cough symptoms were found to be prevalent among those under 15 years old who suffered from allergies (Figure 6). This indicates that pre-conditions concerning health have a strong effect on cough symptoms. The allergic conditions can be caused by the occurrence of mites (0.211) and mold (0.061) in the house [63]. The perceived occurrence of mites is influenced by the perceived mold occurrence (0.289). Therefore, the mold occurrence is considered to be one of the key factors affecting the children’s cough symptoms. The mold occurrence is influenced by the perceived OAQ rates (0.328) and the perceived water leakage (0.203). Table 6a depicts the significant association between the perceived occurrence of water leakage in their houses and that of mold. This result implies that the water leakage may be one of the root causes of the children’s cough, although it does not directly trigger the cough symptoms (Table 6b).
Furthermore, humidity conditions were also observed to influence directly on the cough symptoms among those under 15 years old (0.262). These results are supported by the previous results, where the children were exposed to higher health risks during the humid rainy season (see Figure 3). Meanwhile, the results show that the indoor humidity levels were affected by the window-opening behavior, especially in the master bedroom, with the total effect of −0.325, indicating that the more frequent households open windows, the less humid the room is. Improved ventilation is considered to increase removal rates for air pollutants and moisture. Similar results were reported in Fabi et al. [64], where window-opening behavior significantly changed indoor environmental conditions. However, window-opening duration in the living room had a positive impact on the incidences of mold and mites, respectively, although they are not incorporated in the path model. This indicates that the more frequent households open windows in the living room, the higher the chances of perceiving the mold growth and mite occurrence inside the room. On the other hand, window-opening in the bedroom shows a negative effect on mite occurrence with the total effect of −0.264. This condition might be related to the indoor moisture sources. In kampongs, a bathroom and a kitchen, which are major indoor moisture sources, are usually connected to the living room. Therefore, opening windows and internal doors would increase the indoor humidity levels. Meanwhile, the OAQ is also included as one of the influential factors affecting the persistent cough indirectly while the perceived OAQ rate directly affects that for mold occurrence (0.328). Overall, the results suggest that children’s persistent cough symptoms were influenced primarily by indoor environmental conditions, such as high indoor humidity, smell, and the perceived mites and mold growth, on top of the pre-conditions of allergy. Moreover, the water leakage in their houses might be one of the root causes of mold and thus children’s persistent cough.
Figure 7 illustrates the results of the path diagram for those of 15 years old and over. The multiple correlation coefficient for cough symptoms is 0.05, indicating that the diagram only explains 5% of all persistent cough symptoms. However, the conformance value was reported sufficiently fit (CFI = 0.931, NFI = 0.750, and RMSEA = 0.026). This can be attributed to the fact that the percentage of those 15 years old and over suffering from persistent cough was smaller compared to that of children. As shown in Figure 7, the persistent cough among 15 years and over is highly affected by “Sick Building Syndrome (SBS)” (0.210), followed by “smoking (including active and passive smoking)” (0.094). In this study, the “SBS” indicates whether the health conditions of the occupants were worsened during the stay in their houses due to unidentified factors. However, these building-related health problems were found to be directly affected by the perceived OAQ, which was likely associated with the vehicle frequency with the total effect of 0.152. This indicates that traffic-related air pollution would degrade the OAQ.
Figure 7 shows that the smoking habits, including active and passive smoking, are significantly related to the gender (−0.445), AC ownership (−0.067), dust exposure (0.213), and chemical exposure (0.088), which is probably from their working places. These exposures are associated with the gender, i.e., male dominant. The AC ownership had a negative relationship with smoking habits, indicating that the households with ACs tended to have a lower probability of smoking inside the houses. This is probably because the other household members avert themselves from smoking when they operate AC. The detailed associations between the smoking habits and persistent cough are summarized in Table 7. Though the multiple correlation coefficient is small, it is concluded that the smoking habits, as well as the degraded OAQ mainly caused by the traffic-related air pollution, can be potential factors influencing the symptoms of persistent cough among those 15 years old and over.

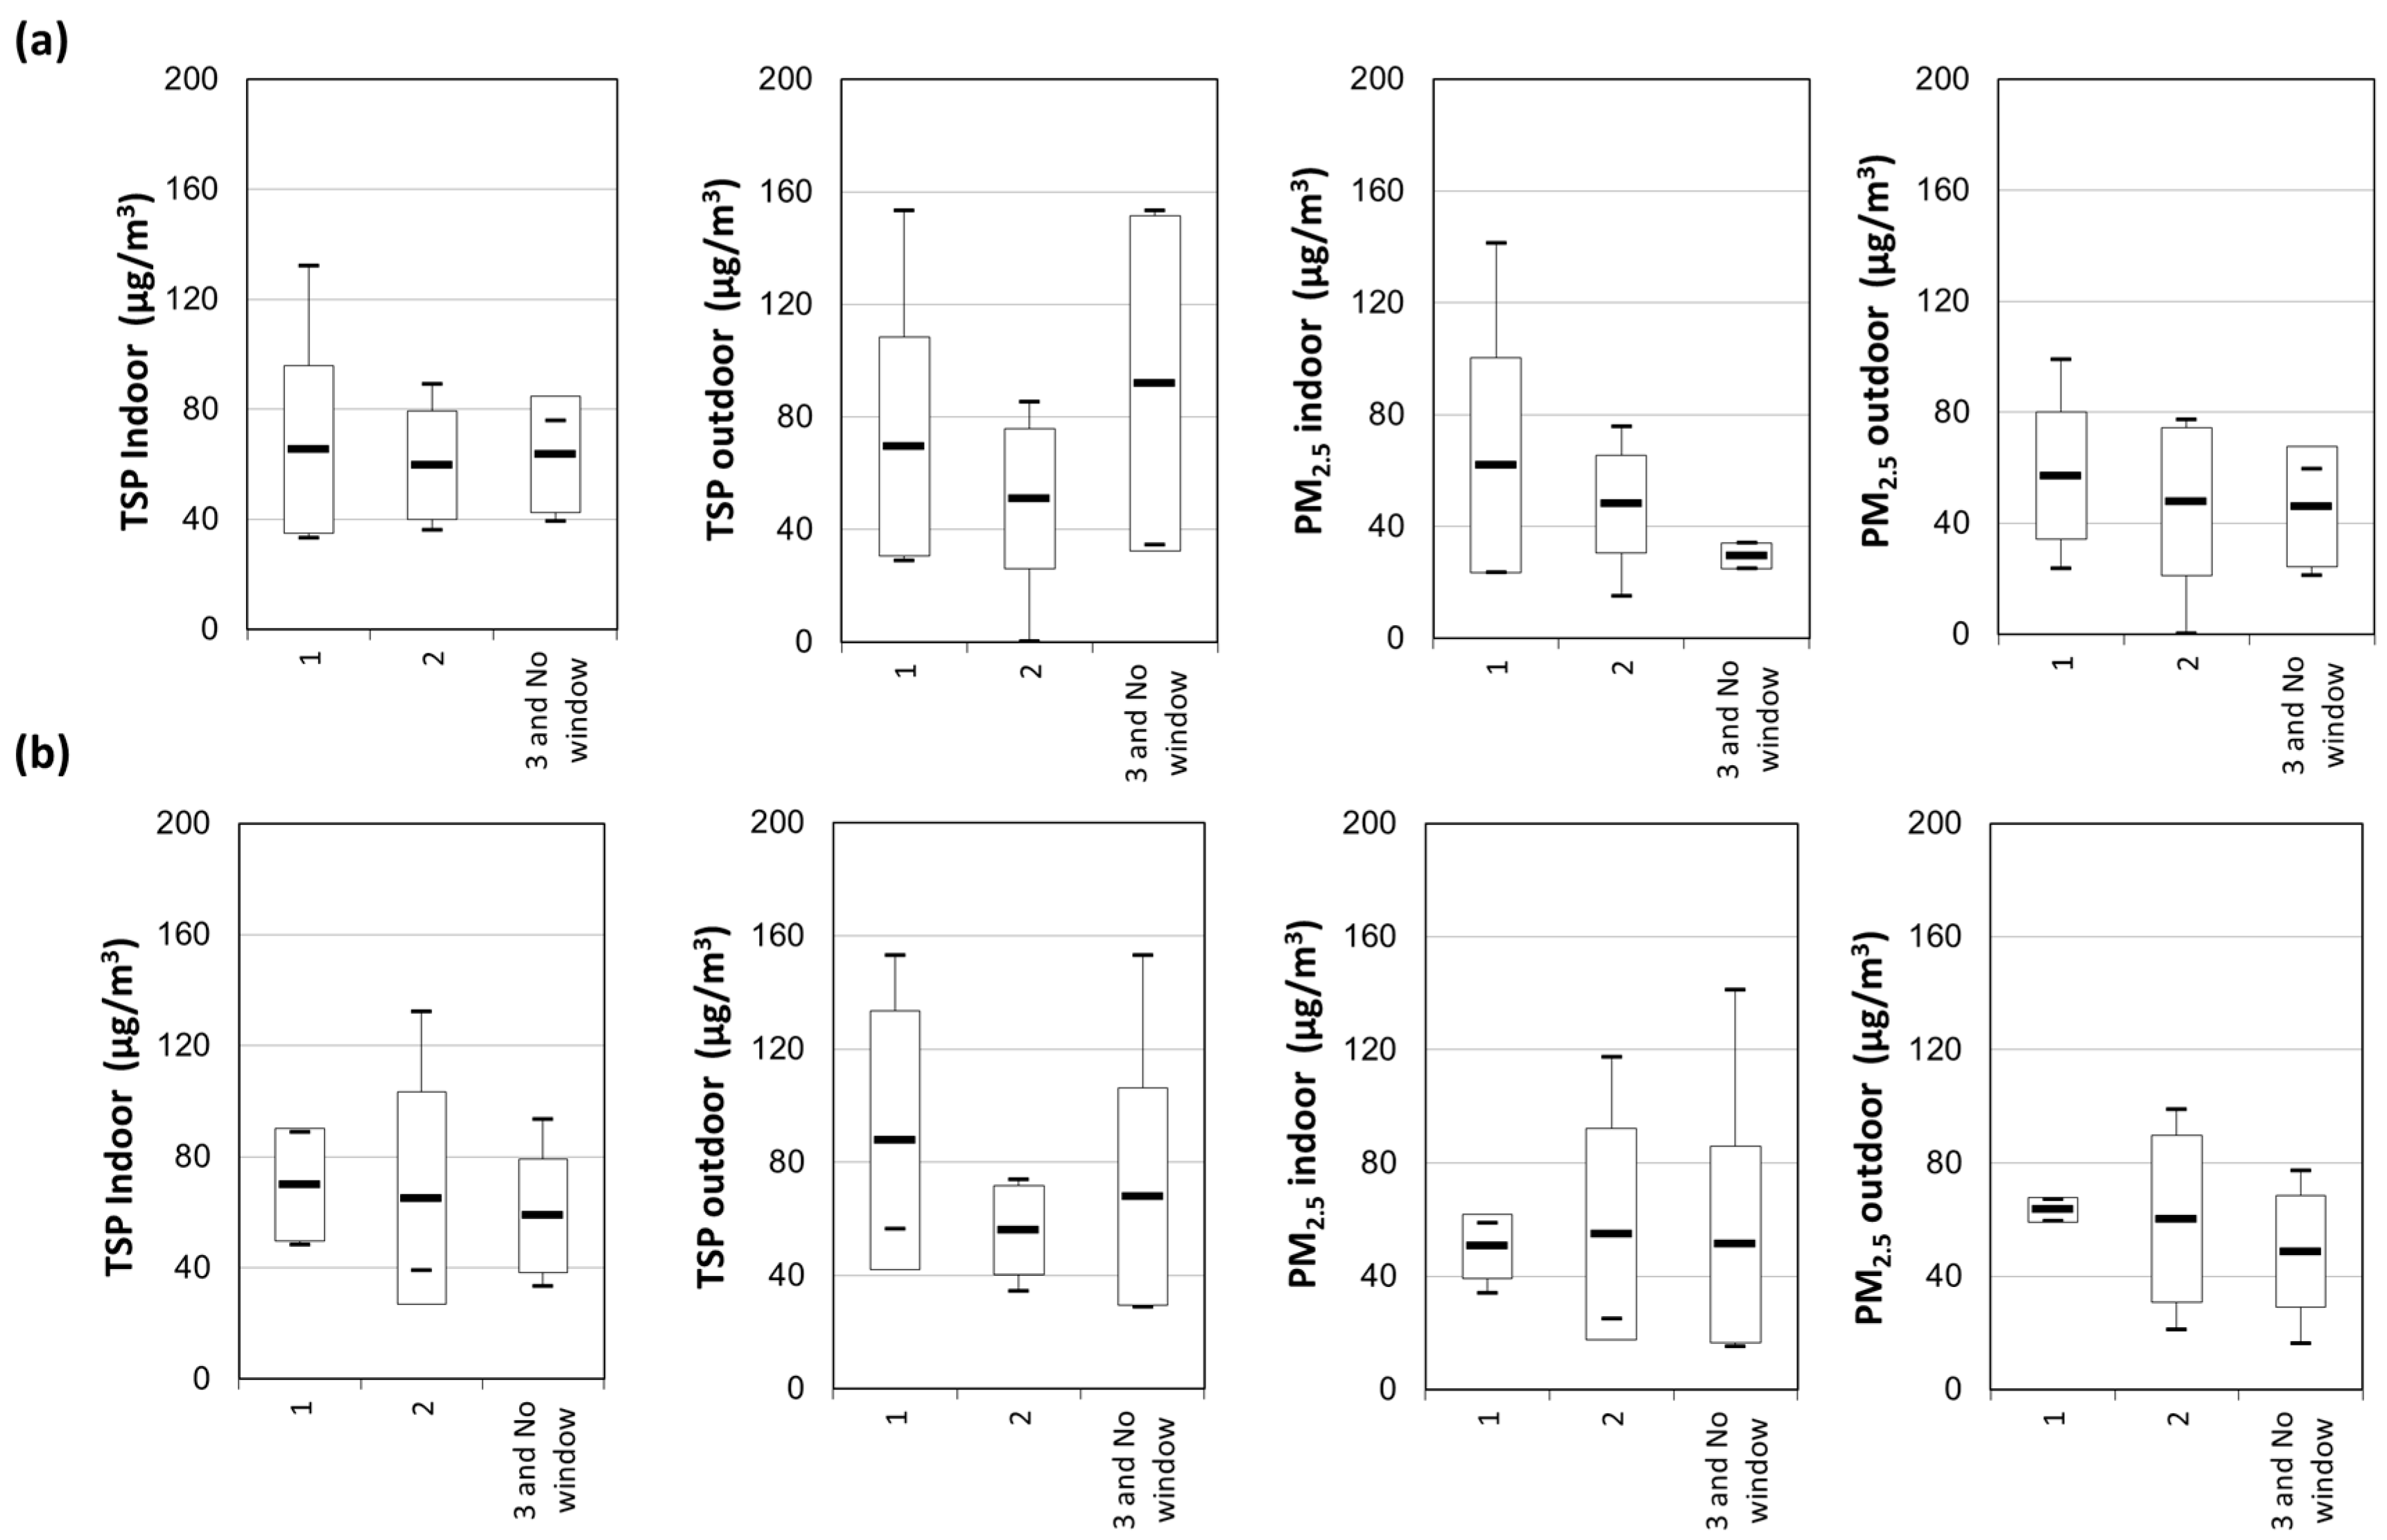
3.5. Window-Opening Behavior in Kampung Houses

As described before, window-opening behaviors indirectly affected the persistent cough among those under 15 years old in kampungs (see Figure 6). Nevertheless, both positive and negative correlation were seen, depending on the room. Window-opening in the bedroom negatively affected the persistent cough, whereas that in the living room positively affected it. Figure 8 shows the results of IAQ measurements analyzed by window-opening patterns; 1 (24 h open), 2 (open during daytime (12.6 h)), and 3 (open less than one hour or no windows), in the living room and the bedroom among the households with children.
As depicted in Figure 8a, particularly for indoor/outdoor PM2.5 in the living room, a longer duration of opening windows shows a higher average concentration of PM2.5 (61.9 μg/m3 in Pattern 1, 48.0 μg/m3 in Pattern 2 and 29.3 μg/m3 in Pattern 3). This indicates that the major sources of PM2.5 in the living room are considered to be outdoor sources, such as traffic-related air pollution, and they entered the room through opening windows. On the other hand, in the bedroom, Pattern 1 shows the lowest average concentration of PM2.5 (50 μg/m3) compared to the others (54.9 μg/m3 in Pattern 2 and 51.2 μg/m3 in Pattern 3). The maximum value of PM2.5 in Pattern 2 (117.2 μg/m3) and 3 (141.2 μg/m3) are more than double that of Pattern 1 (58.6 μg/m3). This indicates that opening windows in the bedroom helped reduce the concentration of PM2.5 in the room. The location of the rooms can be a possible reason; bedrooms are commonly located deep inside of the house, while the living room is located close to the front road [29]. Houses in kampungs typically have narrow frontage with a relatively small terrace close to the road [29], which made air pollutants from the road easily reach the living room. Room arrangement and opening design should be considered in Kampong houses to avoid the exposure to the traffic-related air pollution. On the other hand, it is also important to control the traffics inside the densely populated Kampong neighborhood.

4. Conclusions

This study presented the results from field measurements and household surveys on the severity of indoor mold risk and its impact on respiratory health among residents in a typical unplanned neighborhood in Bandung. The key findings of this study are summarized as follows:
  • The symptoms of respiratory health problems were higher among children, particularly in the rainy season. The percentage of persistent cough symptoms was found to be more than 40% among those under 15 years old during the rainy season, whereas that of 15 years and over was 27%.
  • Kampung houses were observed to suffer from severe mold risk. More than 97% of the houses were highly likely to have a mold propagation in the rainy season. Even in the dry season, the outdoor RH can be as high as 80% on average and approximately 79% of houses had a mold risk, and 68% was considered a high possibility of propagation. The outdoor RH averaged at 83%, while the corresponding indoor RH averaged at 82% during the rainy season. Water leakages were reported by 50% and 60% of the respondents in the dry and rainy seasons, respectively.
  • The concentrations of indoor TSP and PM2.5 far exceeded the WHO standards in more than 50% of the kampung houses, whereas the outdoor air pollution within kampungs contributed to the degraded IAQ.
  • Opening windows in the bedroom negatively affected mite occurrence and humidity rate. Furthermore, a longer duration of opening windows in the bedroom showed a lower concentration of PM2.5, while that in the living room was the other way around, i.e., a longer duration of opening windows showed a higher concentration of PM2.5.
The deterioration of the health conditions and duration of staying indoors showed the highest associations with persistent cough among those aged 15 years old and over, followed by smoking habits. Meanwhile, mold, smell, mite occurrence, and humidity were found to be influential factors affecting the persistent cough among those under 15 years old. The water leakage in their houses might be one of the root causes of the mold growth, and thus children’s cough. It was suggested that the room arrangement and opening design should be considered in Kampong houses to avoid the exposure to the traffic-related air pollution. In addition, a proper traffic control for Kampong neighborhood is probably important to reduce the internal traffic-related air pollution. Moreover, a public policy of not smoking indoors with children should be considered to prevent the respiratory problems among children.
Unplanned houses, such as Kampongs, are observed in many countries, especially in the global south [30]. Although having different connotations and being unique in their social–cultural aspects, they possess very similar physical characteristics [30]. Hence, although this study dealt with the city of Bandung as a case study, the results can be applicable for other similar unplanned houses, particularly in the hot–humid tropical developing countries. However, a future study is needed to increase samples and case study cities, making more detailed statistical analyses possible.

Author Contributions

Conceptualization, T.K.; methodology, T.K.; data collection, H.S., J.S. and U.S.; formal analysis, H.S. and J.S.; supervision, T.K. and U.S.; writing—original draft preparation, H.S., J.S. and T.K.; wiring—review and editing, T.K. and U.S.; visualization, H.S. and J.S.; project administration, T.K. and U.S.; funding acquisition, T.K. All authors have read and agreed to the published version of the manuscript.

Funding

This research was supported by the Science and Technology Research Partnership for Sustainable Development (SATREPS) in collaboration between Japan Science and Technology Agency (JST, JPMJSA1904) and Japan International Cooperation Agency (JICA).

Informed Consent Statement

Informed consent was obtained from all subjects involved in the study.

Acknowledgments

Special thanks are extended to the Division of Building Sciences, Directorate of Engineering Affairs for Human Settlements and Housing, Ministry of Public Works and Housing, Indonesia for their strong supports.

Conflicts of Interest

The authors declare no conflict of interest.

References

  1. Lueker, J.; Bardhan, R.; Sarkar, A.; Norford, L. Indoor air quality among Mumbai’s resettled populations: Comparing Dharavi slum to nearby rehabilitation sites. Build. Environ. 2019, 167, 106419. [Google Scholar] [CrossRef]
  2. Romieu, I.; Samet, J.M.; Smith, K.R.; Bruce, N. Outdoor air pollution and acute respiratory infections among children in developing countries. J. Occup. Environ. Med. 2002, 44, 640–649. [Google Scholar] [CrossRef] [PubMed]
  3. Bornehag, C.-G.; Sundell, J.; Sigsgaard, T. Dampness in buildings and health (DBH): Report from an ongoing epidemiological investigation on the association between indoor environmental factors and health effects among children in Sweden. Indoor Air 2004, 14, 59–66. [Google Scholar] [CrossRef] [PubMed]
  4. Sundell, J. Reflections on the history of indoor air science, focusing on the last 50 years. Indoor Air 2017, 27, 708–724. [Google Scholar] [CrossRef]
  5. Takaoka, M.; Norback, D. The Home Environment of Japanese Female University Students—Association with Respiratory Health and Allergy. Indoor Built Environ. 2011, 20, 369–376. [Google Scholar] [CrossRef]
  6. Wang, L.; Qu, F.; Zhang, Y.; Weschler, L.B.; Sundell, J. Home environment in relation to allergic rhinitis among preschool children in Beijing, China: A cross-sectional study. Build. Environ. 2015, 93, 54–63. [Google Scholar] [CrossRef]
  7. WHO. WHO Guidelines for Air Quality Dempess and Mould; WHO Regional Office for Europe: Scherfigsvej, Denmark, 2009; p. 248. [Google Scholar]
  8. Choi, J.; Chun, C.; Sun, Y.; Choi, Y.; Kwon, S.; Bornehag, C.; Sundell, J. Associations between building characteristics and children’s allergic symptoms—A cross-sectional study on child’s health and home in Seoul, South Korea. Build. Environ. 2014, 75, 176–181. [Google Scholar] [CrossRef]
  9. Hägerhed-Engman, L.; Bornehag, C.-G.; Sundell, J. Building characteristics associated with moisture related problems in 8,918 Swedish dwellings. Int. J. Environ. Health Res. 2009, 19, 251–265. [Google Scholar] [CrossRef]
  10. Hu, Y.; Liu, W.; Huang, C.; Zou, Z.J.; Zhao, Z.H.; Shen, L.; Sundell, J. Home dampness, childhood asthma, hay fever, and airway symptoms in Shanghai, China: Associations, dose-response relationships, and lifestyle’s influences. Indoor Air 2014, 24, 450–463. [Google Scholar] [CrossRef]
  11. Sun, Y.; Zhang, Y.; Sundell, J.; Fan, Z.; Bao, L. Dampness in dorm rooms and its associations with allergy and airways infections among college students in China: A cross-sectional study. Indoor Air 2009, 19, 348–356. [Google Scholar] [CrossRef]
  12. Larsson, M.; Weiss, B.; Janson, S.; Sundell, J.; Bornehag, C.-G. Associations between indoor environmental factors and parental-reported autistic spectrum disorders in children 6–8 years of age. NeuroToxicology 2009, 30, 822–831. [Google Scholar] [CrossRef] [PubMed] [Green Version]
  13. Fisk, W.J.; Lei-Gomez, Q.; Mendell, M.J. Meta-analyses of the associations of respiratory health effects with dampness and mold in homes. Indoor Air 2007, 17, 284–296. [Google Scholar] [CrossRef] [PubMed]
  14. Gunnbjörnsdottir, M.; Norbäck, D.; Plaschke, P.; Norrman, E.; Björnsson, E.; Janson, C. The relationship between indicators of building dampness and respiratory health in young Swedish adults. Respir. Med. 2003, 97, 302–307. [Google Scholar] [CrossRef] [PubMed] [Green Version]
  15. Ignatavičius, Č.; Ignatavičius, G. Investigation of Damage and Microclimate Deterioration Caused by Dampness in the Palace of Signatories to the Declaration of Independence. Indoor Built Environ. 2005, 14, 89–95. [Google Scholar] [CrossRef]
  16. Jaakkola, J.J.K.; Hwang, B.-F.; Jaakkola, N. Home Dampness and Molds, Parental Atopy, and Asthma in Childhood: A Six-Year Population-Based Cohort Study. Environ. Health Perspect. 2005, 113, 357–361. [Google Scholar] [CrossRef] [PubMed]
  17. Zhang, X.; Sahlberg, B.; Wieslander, G.; Janson, C.; Gislason, T.; Norback, D. Dampness and moulds in workplace buildings: Associations with incidence and remission of sick building syndrome (SBS) and biomarkers of inflammation in a 10year follow-up study. Sci. Total Environ. 2012, 430, 75–81. [Google Scholar] [CrossRef]
  18. Hsu, N.-Y.; Lee, C.-C.; Wang, J.-Y.; Li, Y.-C.; Chang, H.-W.; Chen, C.-Y.; Bornehag, C.-G.; Wu, P.-C.; Sundell, J.; Su, H.-J. Predicted risk of childhood allergy, asthma, and reported symptoms using measured phthalate exposure in dust and urine. Indoor Air 2011, 22, 186–199. [Google Scholar] [CrossRef]
  19. Naydenov, K.; Melikov, A.; Markov, D.; Stankov, P.; Bornehag, C.-G.; Sundell, J. A comparison between occupants’ and inspectors’ reports on home dampness and their association with the health of children: The ALLHOME study. Build. Environ. 2008, 43, 1840–1849. [Google Scholar] [CrossRef]
  20. Smedje, G.; Norbäck, D. Asthmatic Symptoms in School Children in Relation to Building Dampness and Atopy. Indoor Built Environ. 2003, 12, 249–250. [Google Scholar] [CrossRef]
  21. Sun, Y.; Sundell, J. Life style and home environment are associated with racial disparities of asthma and allergy in Northeast Texas children. Sci. Total Environ. 2011, 409, 4229–4234. [Google Scholar] [CrossRef]
  22. Sun, Y.; Sundell, J. On Associations between Housing Characteristics, Dampness and Asthma and Allergies among Children in Northeast Texas. Indoor Built Environ. 2013, 22, 678–684. [Google Scholar] [CrossRef]
  23. Tham, K.W.; Zuraimi, M.S.; Koh, D.; Chew, F.T.; Ooi, P.L. Associations between home dampness and presence of molds with asthma and allergic symptoms among young children in the tropics. Pediatr. Allergy Immunol. 2007, 18, 418–424. [Google Scholar] [CrossRef] [PubMed]
  24. Haq, G.; Han, W.; Kim, C.; Vallack, H. Benchmarking Urban Air Quality Management and Practice in Major and Mega Cities of Asia; Air Pollution in the Megacities of Asia (APMA): Seoul, Korea, 2002. [Google Scholar]
  25. Deng, T.; Shen, X.; Cheng, X.; Liu, J. Investigation of window-opening behaviour and indoor air quality in dwellings situated in the temperate zone in China. Indoor Built Environ. 2020, 30, 938–956. [Google Scholar] [CrossRef]
  26. Lin, H.H.; Ezzati, M.; Murray, M. Tobacco smoke, indoor air pollution and tuberculosis: A systematic review and meta-analysis. PLoS Med. 2007, 4, 0173–0189. [Google Scholar] [CrossRef] [PubMed]
  27. Yu, B.; Hu, Z.; Liu, M.; Yang, H.; Kong, Q.; Liu, Y. Review of research on air-conditioning systems and indoor air quality control for human health. Int. J. Refrig. 2008, 32, 3–20. [Google Scholar] [CrossRef]
  28. Demographia. Demographia World Urban Areas. 2017. Available online: http://www.demographia.com/db-worldua.pdf (accessed on 18 January 2022).
  29. Funo, S.; Yamamoto, N.; Silas, J. Typology of Kampung Houses and Their Transformation Process—A Study on Urban Tissues of an Indonesian City. J. Asian Archit. Build. Eng. 2018, 7581, 193–200. [Google Scholar] [CrossRef] [Green Version]
  30. Parisi, C.D.A.; Kubota, T.; Surahman, U. Affordable modifications for sustainable houses in urban informal settlements: A case study of Bandung, Indonesia. Int. J. Urban Sustain. Dev. 2021, 13, 659–689. [Google Scholar] [CrossRef]
  31. Paramita, B.; Suparta, W. Alteration of Urban Microclimate in Bandung, Indonesia Based on Urban Morphology. Geogr. Tech. 2019, 14, 213–220. [Google Scholar] [CrossRef]
  32. Tarigan, A.; Sagala, S.; Samsura, D.A.; Fiisabiilillah, D.F.; Simarmata, H.A.; Nababan, M. Bandung City, Indonesia. Cities 2016, 50, 100–110. [Google Scholar] [CrossRef]
  33. Paramita, B.; Fukuda, H. Building Groups Design Strategies in Hot-humid Climate: A Dense Residential Planning in Bandung, Indonesia. In PLEA 2013: Sustainable Architecture for a Renewable Future; IRB-Verlag: Stuttgart, Germany, 2013. [Google Scholar]
  34. Indonesia’s Kampung Improvement Program: Policy Issues and Local Impacts for Secondary Cities. J. Plan. Educ. Res. 1989, 9, 79–83. [CrossRef]
  35. BRE. Condensation and Dampness; IHS BRE Press: London, UK, 2007. [Google Scholar]
  36. Bai, L.; Li, C.; Yu, C.W.; He, Z. Air pollution and health risk assessment in Northeastern China: A case study of Jilin Province. Indoor Built Environ. 2021, 30, 1857–1874. [Google Scholar] [CrossRef]
  37. Fu, X.; Norbäck, D.; Yuan, Q.; Li, Y.; Zhu, X.; Hashim, J.H.; Hashim, Z.; Ali, F.; Zheng, Y.-W.; Lai, X.-X.; et al. Indoor microbiome, environmental characteristics and asthma among junior high school students in Johor Bahru, Malaysia. Environ. Int. 2020, 138, 105664. [Google Scholar] [CrossRef] [PubMed]
  38. Norbäck, D.; Hashim, J.H.; Hashim, Z.; Cai, G.-H.; Sooria, V.; Ismail, S.A.; Wieslander, G. Respiratory symptoms and fractional exhaled nitric oxide (FeNO) among students in Penang, Malaysia in relation to signs of dampness at school and fungal DNA in school dust. Sci. Total Environ. 2017, 577, 148–154. [Google Scholar] [CrossRef] [PubMed] [Green Version]
  39. Norbäck, D.; Hashim, Z.; Ali, F.; Hashim, J.H. Asthma symptoms and respiratory infections in Malaysian students-associations with ethnicity and chemical exposure at home and school. Environ. Res. 2021, 197, 111061. [Google Scholar] [CrossRef]
  40. Yap, J.; Toh, Z.A.; Goh, V.; Ng, L.C.; Vesper, S. Assessment of mold concentrations in Singapore shopping centers using mold-specific quantitative PCR (MSQPCR) analysis. Indian J. Microbiol. 2009, 49, 290–293. [Google Scholar] [CrossRef] [Green Version]
  41. Zuraimi, M.; Tham, K. Indoor air quality and its determinants in tropical child care centers. Atmos. Environ. 2007, 42, 2225–2239. [Google Scholar] [CrossRef]
  42. Hu, J.; Li, N.; Zou, S.; Yoshino, H.; Yanagi, U.; Yu, C.W.; Qu, H. Indoor environmental conditions in schoolchildren’s homes in central-south China. Indoor Built Environ. 2019, 29, 956–971. [Google Scholar] [CrossRef]
  43. Manivannan, S.; Venugopal, V.; Kindo, A.J.; Kuppuswamy, R. Method for assessment of indoor household dampness for its use in epidemiological studies in tropical settings. Ann. Trop. Med. Public Health 2017, 10, 966. [Google Scholar] [CrossRef]
  44. Bandung, B. Bandung City Figure; BPS: Bandung, Indonesia, 2016. Available online: https://bandungkota.bps.go.id/subject/151/iklim.html#subjekViewTab3 (accessed on 31 January 2022).
  45. Portal Data Kota Bandung. Tahun 2017—Data Jumlah Unit Bangunan dan Keteraturan Bangunan Hunian Per RT; Dinas Perumahan dan Kawasan Permukiman, Pertanahan dan Pertamanan: Bandung, Indonesia, 2019. [Google Scholar]
  46. Ferris, B.G. Epidemiology Standardization Project (American Thoracic Society). Am. Rev. Respir. Dis. 1978, 118 Pt 2, 1–120. [Google Scholar]
  47. Enright, P.L.; Kronmal, R.A.; Higgins, M.W.; Schenker, M.B.; Haponik, E.F. Prevalence and Correlates of Respiratory Symptoms and Disease in the Elderly. Chest 1994, 106, 827–834. [Google Scholar] [CrossRef]
  48. Langkulsen, U.; Jinsart, W.; Karita, K.; Yano, E. Respiratory symptoms and lung function in Bangkok school children. Eur. J. Public Health 2006, 16, 676–681. [Google Scholar] [CrossRef] [PubMed] [Green Version]
  49. Nkosi, V.; Voyi, K. Reliability of an adult respiratory symptom questionnaire in a community located near a mine dump in South Africa: Pilot study. South. Afr. J. Infect. Dis. 2016, 31, 103–105. [Google Scholar] [CrossRef]
  50. Abe, K. A Method For Numerical Characterization Of Indoor Climates By A Biosensor Using A Xerophilic Fungus. Indoor Air 1993, 3, 344–348. [Google Scholar] [CrossRef]
  51. Abe, K. Assessment of the environmental conditions in a museum storehouse by use of a fungal index. Int. Biodeterior. Biodegrad. 2010, 64, 32–40. [Google Scholar] [CrossRef]
  52. Abe, K. Assessment of home environments with a fungal index using hydrophilic and xerophilic fungi as biologic sensors. Indoor Air 2011, 22, 173–185. [Google Scholar] [CrossRef]
  53. Hildebrandt, S.; Kubota, T.; Sani, H.A.; Surahman, U. Indoor Air Quality and Health in Newly Constructed Apartments in Developing Countries: A Case Study of Surabaya, Indonesia. Atmosphere 2019, 10, 182. [Google Scholar] [CrossRef] [Green Version]
  54. Using a Protimeter Moisture Meter to Check Damp within a Building Using a Protimeter Moisture Meter. 2015. Available online: https://www.damp-meter-direct.co.uk (accessed on 7 July 2022).
  55. Chicea, D.; Leca, C.; Olaru, S.; Chicea, L. An Advanced Sensor for Particles in Gases Using Dynamic Light Scattering in Air as Solvent. Sensors 2021, 21, 5115. [Google Scholar] [CrossRef]
  56. Sinclair, D. Light Scattering Instruments as an Aid in Air Pollution Measurements. Air Repair 1953, 3, 51–56. [Google Scholar] [CrossRef]
  57. Olobatuyi, M.E. A User’s Guide to Path Analysis; University Press of America: Lanham, MD, USA, 2006. [Google Scholar]
  58. Kota Bandung Dalam Angka; Badan Pusat Statistik Kota Bandung Bps-Statistics of Bandung Municipality: Bandung, Indonesia, 2020.
  59. Statistik Indonesia 2020. Bandan Pusat Statistik Indonesia. 2020. ISSN 0126-2912. Available online: https://www.bps.go.id/publication/2020/04/29/e9011b3155d45d70823c141f/statistik-indonesia-2020.html (accessed on 19 July 2022).
  60. Provinsi Jawa Barat Dalam Angka Jawa Barat Province in Figures 2020 Penyediaan Data untuk Perencanaan Pembangunan Delivering Data to Inform Development Planning. 2020. Available online: https://jabar.bps.go.id/publication/2020/04/27/cfab9a400cf304f800182a5f/provinsi-jawa-barat-dalam-angka-2020.html (accessed on 17 July 2022).
  61. Schramm, S.; Carré, V.; Scheffler, J.-L.; Aubriet, F. Active and passive smoking—New insights on the molecular composition of different cigarette smoke aerosols by LDI–FTICRMS. Atmos. Environ. 2014, 92, 411–420. [Google Scholar] [CrossRef]
  62. Smoking Rates by Country. 2022. Available online: https://worldpopulationreview.com/country-rankings/smoking-rates-by-country (accessed on 11 May 2022).
  63. Gent, J.F.; Kezik, J.M.; Hill, M.E.; Tsai, E.; Li, D.-W.; Leaderer, B.P. Household mold and dust allergens: Exposure, sensitization and childhood asthma morbidity. Environ. Res. 2012, 118, 86–93. [Google Scholar] [CrossRef] [Green Version]
  64. Fabi, V.; Andersen, R.V.; Corgnati, S.; Olesen, B.W. Occupants’ window opening behaviour: A literature review of factors influencing occupant behaviour and models. Build. Environ. 2012, 58, 188–198. [Google Scholar] [CrossRef]
Figure 1. Layout of kampung and outdoor and indoor views of kampung case study area.
Atmosphere 13 01272 g001
Figure 2. Measurement setting in the case study area, (a) PM2.5 and TSP sensor installed outdoor, (b) fungal risk detector for mold risk measurement, and (c) PM2.5 and TSP sensor installed indoor.
Atmosphere 13 01272 g002
Figure 3. Self-reported respiratory health among (a) under 15 years old and 15 years and over and (b) smokers and non-smokers in both dry and rainy season. * 5% significant level.
Atmosphere 13 01272 g003
Figure 4. (a) Measured fungal indexes in kampung houses. (b) Relationship between thermal conditions and mold risk. (c) Measured fungal indexes in psychrometric charts (indoor thermal conditions).
Atmosphere 13 01272 g004
Figure 5. Cumulative frequency of (a) TSP and (b) PM2.5; (1) indoor, (2) outdoor, and (3) association between indoor and outdoor.
Atmosphere 13 01272 g005
Figure 6. Path diagrams for persistent cough among those under 15 years old.
Atmosphere 13 01272 g006
Figure 7. Path diagrams for persistent cough among those aged 15 years old and over.
Atmosphere 13 01272 g007
Figure 8. Indoor and outdoor TSP and PM2.5 concentration based on window-opening pattern in (a) living room and (b) bedroom.
Atmosphere 13 01272 g008
Table 1. Number of samples.
Samples Dry Season
(September–November 2018)
Rainy Season
(March–April 2019)
Dry Season
(September–November 2019)
Total
QuestionnairesATS-DLD-78333266-599
MeasurementsMold risk343434102
TSP and PM2.5 3838
Table 2. Questions interviewed for households.
QuestionnaireFactors/ScalesDetails
House’s and
respondent’s information
Personal
attributes
Age, gender, occupation, asthma (past/present), eczema (past/present),
allergic symptoms (past/present), stress level (10-point scale), other diseases
Household
attributes
Established year, living duration, cleaning habits, furniture conditions,
household income
Indoor air quality Smell sensation (past/present), humidity sensation (10-point scale), mold and water leakage occurrence (past/present), mite observation (past/present), air quality sensation (indoor and outdoor, 10-point scale)
Detailed cooling behavior Windows-opening behavior, AC and fan availability and usage
Table 3. Instruments for field measurement.
Measured VariableInstrument ModelAccuracy
Air temperature,
relative humidity
T&D TR-72UiAccuracy: ±0.3 °C, ±5% RH
Resolution: 0.1 °C, 1% RH
Range: 0~50 °C, 10~95%
Air temperature,
relative humidity, air pressure
T&D TR-73UAccuracy: ±0.3 °C, ±5% RH
Resolution: 0.1 °C, 1% RH, 1 hpa
Range: 0~50 °C, 10~95%, 750~1100 hpa
TSP, PM2.5SIBATA LD-5R
cyclone granulator for PM2.5
Accuracy: ±10% (relative to standard particles)
Range: 0.001~10,000 mg/m3 (for standard particles)
Mold riskFungal risk detectorThe error range for mold index measurement at constant temperature and humidity is a few percent (up to 20 percent).
Measurable range: fungal index from 8 to 70.5 for one week
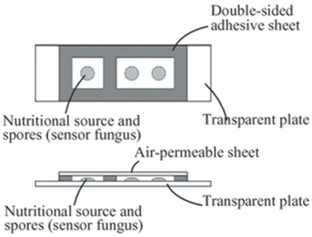
Atmosphere 13 01272 i001
Source: Abe [52]
Table 4. Profile of respondents.
Whole<15 Years≥15 YearsSig.Dry SeasonRainy SeasonSig.
n = 599n = 101n = 497n = 333n = 266
Personal attributesAgeYears (mean)36.36.942.40.00035.936.90.617
DurationYears (mean)26.422.926.80.03628.323.60.005
Gender (%)Male/Female45.8/53.552.3/47.744.7/54.50.02045.1/53.646.7/53.30.824
Income (US$) (%)<15027.923.128.80.07634.918.80.984
150–45056.360.055.748.367.0
450–75010.39.210.48.812.2
>7505.57.75.18.02.0
Occupation (%)Government0.9 1.10.0820.9
Private18.9 21.618.9
Entrepreneur15.5 18.315.5
Student20.181.610.620.1
Housewife26.9 31.126.9
Retired6.5 7.76.5
Other10.518.49.210.5
Worked for a year or more in dusty job (%)39.9 39.90.43929.149.00.001
Exposed to gas or chemical fumes in work(%)19.7 19.70.61616.922.30.299
BehaviorWindow opening in bedroomHours
(Average)
9.08.39.10.4248.69.60.234
Window opening in living roomHours
(Average)
12.113.511.80.30113.89.00.000
Smoking behavior (%) Active 39.738.535.9 32.349.70.000
Passive 13.630.815.4 13.913.20.018
Non-smoker46.730.848.7 53.837.1
Frequency of cleaning rooms (%)Every day90.892.690.50.63087.396.60.057
Several times per week5.32.55.87.91.0
Every week0.81.20.71.20.0
2–3 times per month1.72.51.52.70.0
Once per month or less1.51.21.50.92.5
Frequency of cleaning bathroom (%)Every day63.272.762.30.11862.264.00.060
Several times per week25.927.325.820.530.0
Every week8.6 9.512.85.4
2–3 times per month1.1 1.22.6
Once per month or less1.1 1.21.90.5
HealthAsthma(%)13.815.713.50.87813.8
Hay fever(%)30.820.733.00.19930.8
Eczema(%)13.510.914.10.43313.5
Allergy(%)13.69.414.40.46813.6
None(%)55.261.049.5 55.2
Disease(%)18.01.821.60.00018.0
SBS(%)4.30.05.20.1484.3
Stress(mean: 0 = no stress, 10 = very stressful)1.50.41.80.0001.5
Table 5. Overview of building attributes, interior sources, and perceived indoor air quality levels.
Whole<15 Years≥15 YearsSig. Dry SeasonRainy SeasonSig.
n = 599n = 101n = 498n = 333n = 266
Building attributesBuilding ageAverage age (years)40.739.740.80.26439.041.90.305
No. of windows in master bedroom (%)024.820.925.60.33929.916.80.630
151.658.250.348.057.1
>123.620.924.122.026.1
No. of windows in living room (%)032.134.431.70.14137.622.50.000
138.346.936.641.632.4
>129.618.831.720.443.0
HVAC system (%)AC6.78.76.40.7894.710.60.015
Fan in bedroom65.766.765.6 65.7
Ceiling/stand fan47.345.747.70.12547.3
Exhaust fan17.927.319.70.06217.9
Number of furniture in living room (%)04.32.04.80.9754.3
1–586.288.285.786.2
>59.69.89.59.6
Number of furniture in bedroom (%)01.12.20.90.5741.1
1–590.684.491.990.6
>58.213.37.28.2
Vehicle frequency (%)Constantly22.7 22.70.01313.031.90.000
Frequency46.0 46.056.739.3
Seldom29.1 29.127.927.4
Never2.2 2.2 2.31.5
DampnessVisual mold(%)49.864.047.30.03955.939.20.000
Mite(%)17.923.816.90.93319.915.00.110
Water leakage(%)53.758.452.80.34450.259.90.033
Smell/Odor(%)47.857.546.10.09839.860.60.000
Humidity (%)0–3: (rather) dry21.619.422.00.04521.422.10.544
4–6: neutral46.643.147.244.350.3
7–10: (rather) humid31.737.530.834.327.7
Perceived IAQIAQ (%)0–3: (rather) clean38.234.738.70.37435.642.30.937
4–6: neutral46.146.745.947.144.4
7–10: (rather) dirty15.818.715.317.313.3
OAQ (%)0–3: (rather) clean30.224.031.20.68228.033.80.391
4–6: neutral50.457.349.249.751.5
7–10: (rather) dirty19.212.019.322.09.1
Annoyance from outdoor air pollution (%)0–3: not annoyed 63.8 63.80.68957.669.40.326
4–6: neutral26.0 26.034.318.7
7–10: annoyed10.1 10.18.111.9
Table 6. Associations between (a) water leakage and mold growth, and (b) mold growth and persistent cough for all samples.
(a)
Water LeakageMold GrowthSig.
YesNo
Yes160 (60.6%)104 (39.4%)0.000
No98 (39.2%)152 (60.8%)
(b)
Mold GrowthPersistent CoughSig.
No SymptomsHave a Symptom of Had ItSickness
Yes166 (77.2%)46 (21.3%)3 (1.4%)0.696
No155 (73.5%)49 (23.2%)7 (3.3%)
Table 7. Associations between smoking habits and persistent cough among 15 years old and over.
GenderSmoking HabitsPersistent CoughSig.
No SymptomsHave a Symptom or Had ItSickness
MaleActive53 (76.8%)16 (23.2%)0 (0%)0.775
Passive10 (71.4%)4 (28.6%)0 (0%)0.437
None22 (81.5%)5 (18.5%)0 (0%)-
FemaleActive23 (76.7%)7 (23.3%)0 (0%)0.703
Passive19 (70.4%)8 (29.6%)0 (0%)0.891
None68 (75.6%)22 (24.4%)0 (0%)-
Publisher’s Note: MDPI stays neutral with regard to jurisdictional claims in published maps and institutional affiliations.

