Article

The Sensitivity of Vegetation Dynamics to Climate Change across the Tibetan Plateau

1
School of Life Sciences, Sun Yat-sen University, Guangzhou 510275, China
2
Department of International International Tourism Management, School of International Economics Management, Beijing Technology and Business University, Beijing 100048, China
3
Synthesis Research Centre of Chinese Ecosystem Research Network, Key Laboratory of Ecosystem Network Observation and Modelling, Institute of Geographic Sciences and Natural Resources Research, Chinese Academy of Sciences, Beijing 100101, China
4
Chengdu Institute of Biology, Chinese Academy of Sciences, Chengdu 610059, China
*
Author to whom correspondence should be addressed.
These authors contributed equally to this work.
Atmosphere 2022, 13(7), 1112; https://doi.org/10.3390/atmos13071112
Submission received: 14 June 2022 / Revised: 11 July 2022 / Accepted: 12 July 2022 / Published: 14 July 2022
(This article belongs to the Special Issue Vegetation and Climate Relationships)

Abstract

:
Vegetation dynamics are key processes which present the ecology system’s response to climate change. However, vegetation sensitivity to climate change remains controversial. This study redefined vegetation sensitivity to precipitation (VSP) and vegetation sensitivity to temperature (VST) by the coefficient of determination (R2) obtained by a linear regression analysis between climate and the normalized difference vegetation index (NDVI), as well as by using an analysis of variance to explore the significant differences between them in different seasons from 1982 to 2013, and exploring the general changed rules of VSP/VST on a timescale. Moreover, the variations in VSP and VST across the Tibetan Plateau were plotted by regression analysis. Finally, we used structural equation modeling (SEM) to verify the hypothesis that the respondence of VSP and VST to the NDVI was regulated by the hydrothermal conditions. Our results showed that: (1) the annual VSP increased in both spring and winter (R2 = 0.32, p < 0.001; R2 = 0.25, p < 0.001, respectively), while the annual VST decreased in summer (R2 = 0.21, p < 0.001); (2) the threshold conditions of seasonal VSP and seasonal VST were captured in the 4–12 mm range (monthly precipitation) and at 0 °C (monthly average temperature), respectively; (3) the SEM demonstrated that climate change has significant direct effects on VSP only in spring and winter and on VST only in summer (path coefficient of −0.554, 0.478, and −0.428, respectively). In summary, our findings highlighted that climate change under these threshold conditions would lead to a variation in the sensitivity of the NDVI to seasonal precipitation and temperature.

1. Introduction

The vegetation community is the main component of ecosystems [1]. As far as we know, vegetation dynamics, taken as a barometer of global ecological change, are mainly affected by climatic factors [2]. Climate change affects vegetation dynamics by altering vegetation phenology, plant community composition, and biogeochemical cycles [3,4,5]. Therefore, for sustainable development, it is crucial to assess how the vegetation dynamics respond to climate change [6,7,8].
Current climate change is characterized as a continuous rise in temperature and frequent extreme precipitation, and the varying rules of vegetation productivity are mainly attributed to the temporal distribution of precipitation and temperature [9,10,11] because of the excellent match between soil nutrient availability and the temporal variability of the hydrothermal environment [12,13,14,15]. Previous studies have demonstrated that the increased annual precipitation significantly limited the growth of shrub grassland in the Tibetan Plateau [16]. Meanwhile, studies in Inner Mongolia have shown that the seasonal distribution of precipitation has directly led to the inter-annual fluctuation in grassland community productivity [17]. However, beyond that, vegetation dynamics are also governed by temperature change [18]; to a certain extent, the increased mean annual temperature could satisfy the heat supply required by the normal growth of plants, and it has also changed the microclimate environment of the plant community, thus directly or indirectly affecting the growth and development of plants and biomass production [19,20,21].
On a large scale, satellite observations have been applied to the quantitative description of vegetation growth patterns already [22,23], and the normalized difference vegetation index (NDVI) based on the global vegetation index has been routinely used to monitor vegetation growth at a global scale [24]. The peak NDVI value synthetically reflects the photosynthetic activity of plants under current environmental conditions [25,26]. Hence, the NDVI could be used to explore the response of vegetation sensitivity to the spatial pattern of hydrothermal conditions and inter-annual variations on a spatiotemporal scale [27]. For example, Piao et al. [28] considered that the NDVI in arid and semi-arid areas of Western China showed an upward trend due to the change in climate from warm-dry to warm-wet during 1982 to 1999. Similarly, from 1982 to 2011, the average annual NDVI of China also increased by about 0.0006 [29]. However, another study showed a continuous downward trend of NDVI with climate change in Northeast China [30]. Others have noted that the responses of vegetation dynamics to climate change are related to the vegetation region [31].
The Tibetan Plateau is highly sensitive to climate change [32,33,34]. Numerous studies have noted the significant influence of the inter-annual variability of precipitation on community composition and that vegetation production is sensitive to the timing and size of precipitation inputs [35,36,37]; increased precipitation variance will also affect the aboveground net primary production (ANPP). In contrast, Hsu et al. [1] hold that the ANPP is approximately 40 times more sensitive to mean precipitation than to the inter-annual variance in precipitation. As for the variation in temperature, Fu et al. [38] found that the sensitivity of phenology to warming has declined significantly as temperatures have increased over the past three decades, and it may be beneficial to the vegetation as it reduces the risk of late spring frost damage by avoiding the premature unfolding of leaves. All of these studies have attempted to decompose and assess the sensitivity of vegetation productivity to changes in climate variables [39], improving our understanding of climate–vegetation relationships; nevertheless, the annual variation in vegetation sensitivity to temperature and precipitation, as well as the relationships between the NDVI and seasonal patterns of temperature and precipitation [40,41] have not been quantified.
Therefore, to better manage grassland ecosystems under global climate change, long-term time series of grassland NDVI and climate (1982–2013) were used to analyze the dynamic effect of climate on the NDVI in the Tibetan Plateau and hypothesize that the respondence of VSP and VST to the NDVI is regulated by the hydrothermal conditions. Specifically, the objectives of our study were to: (1) reveal the temporal variation in vegetation sensitivity to precipitation (VSP) and temperature (VST); (2) quantify the hydrothermal threshold conditions between vegetation sensitivity and climate change.

2. Materials and Methods
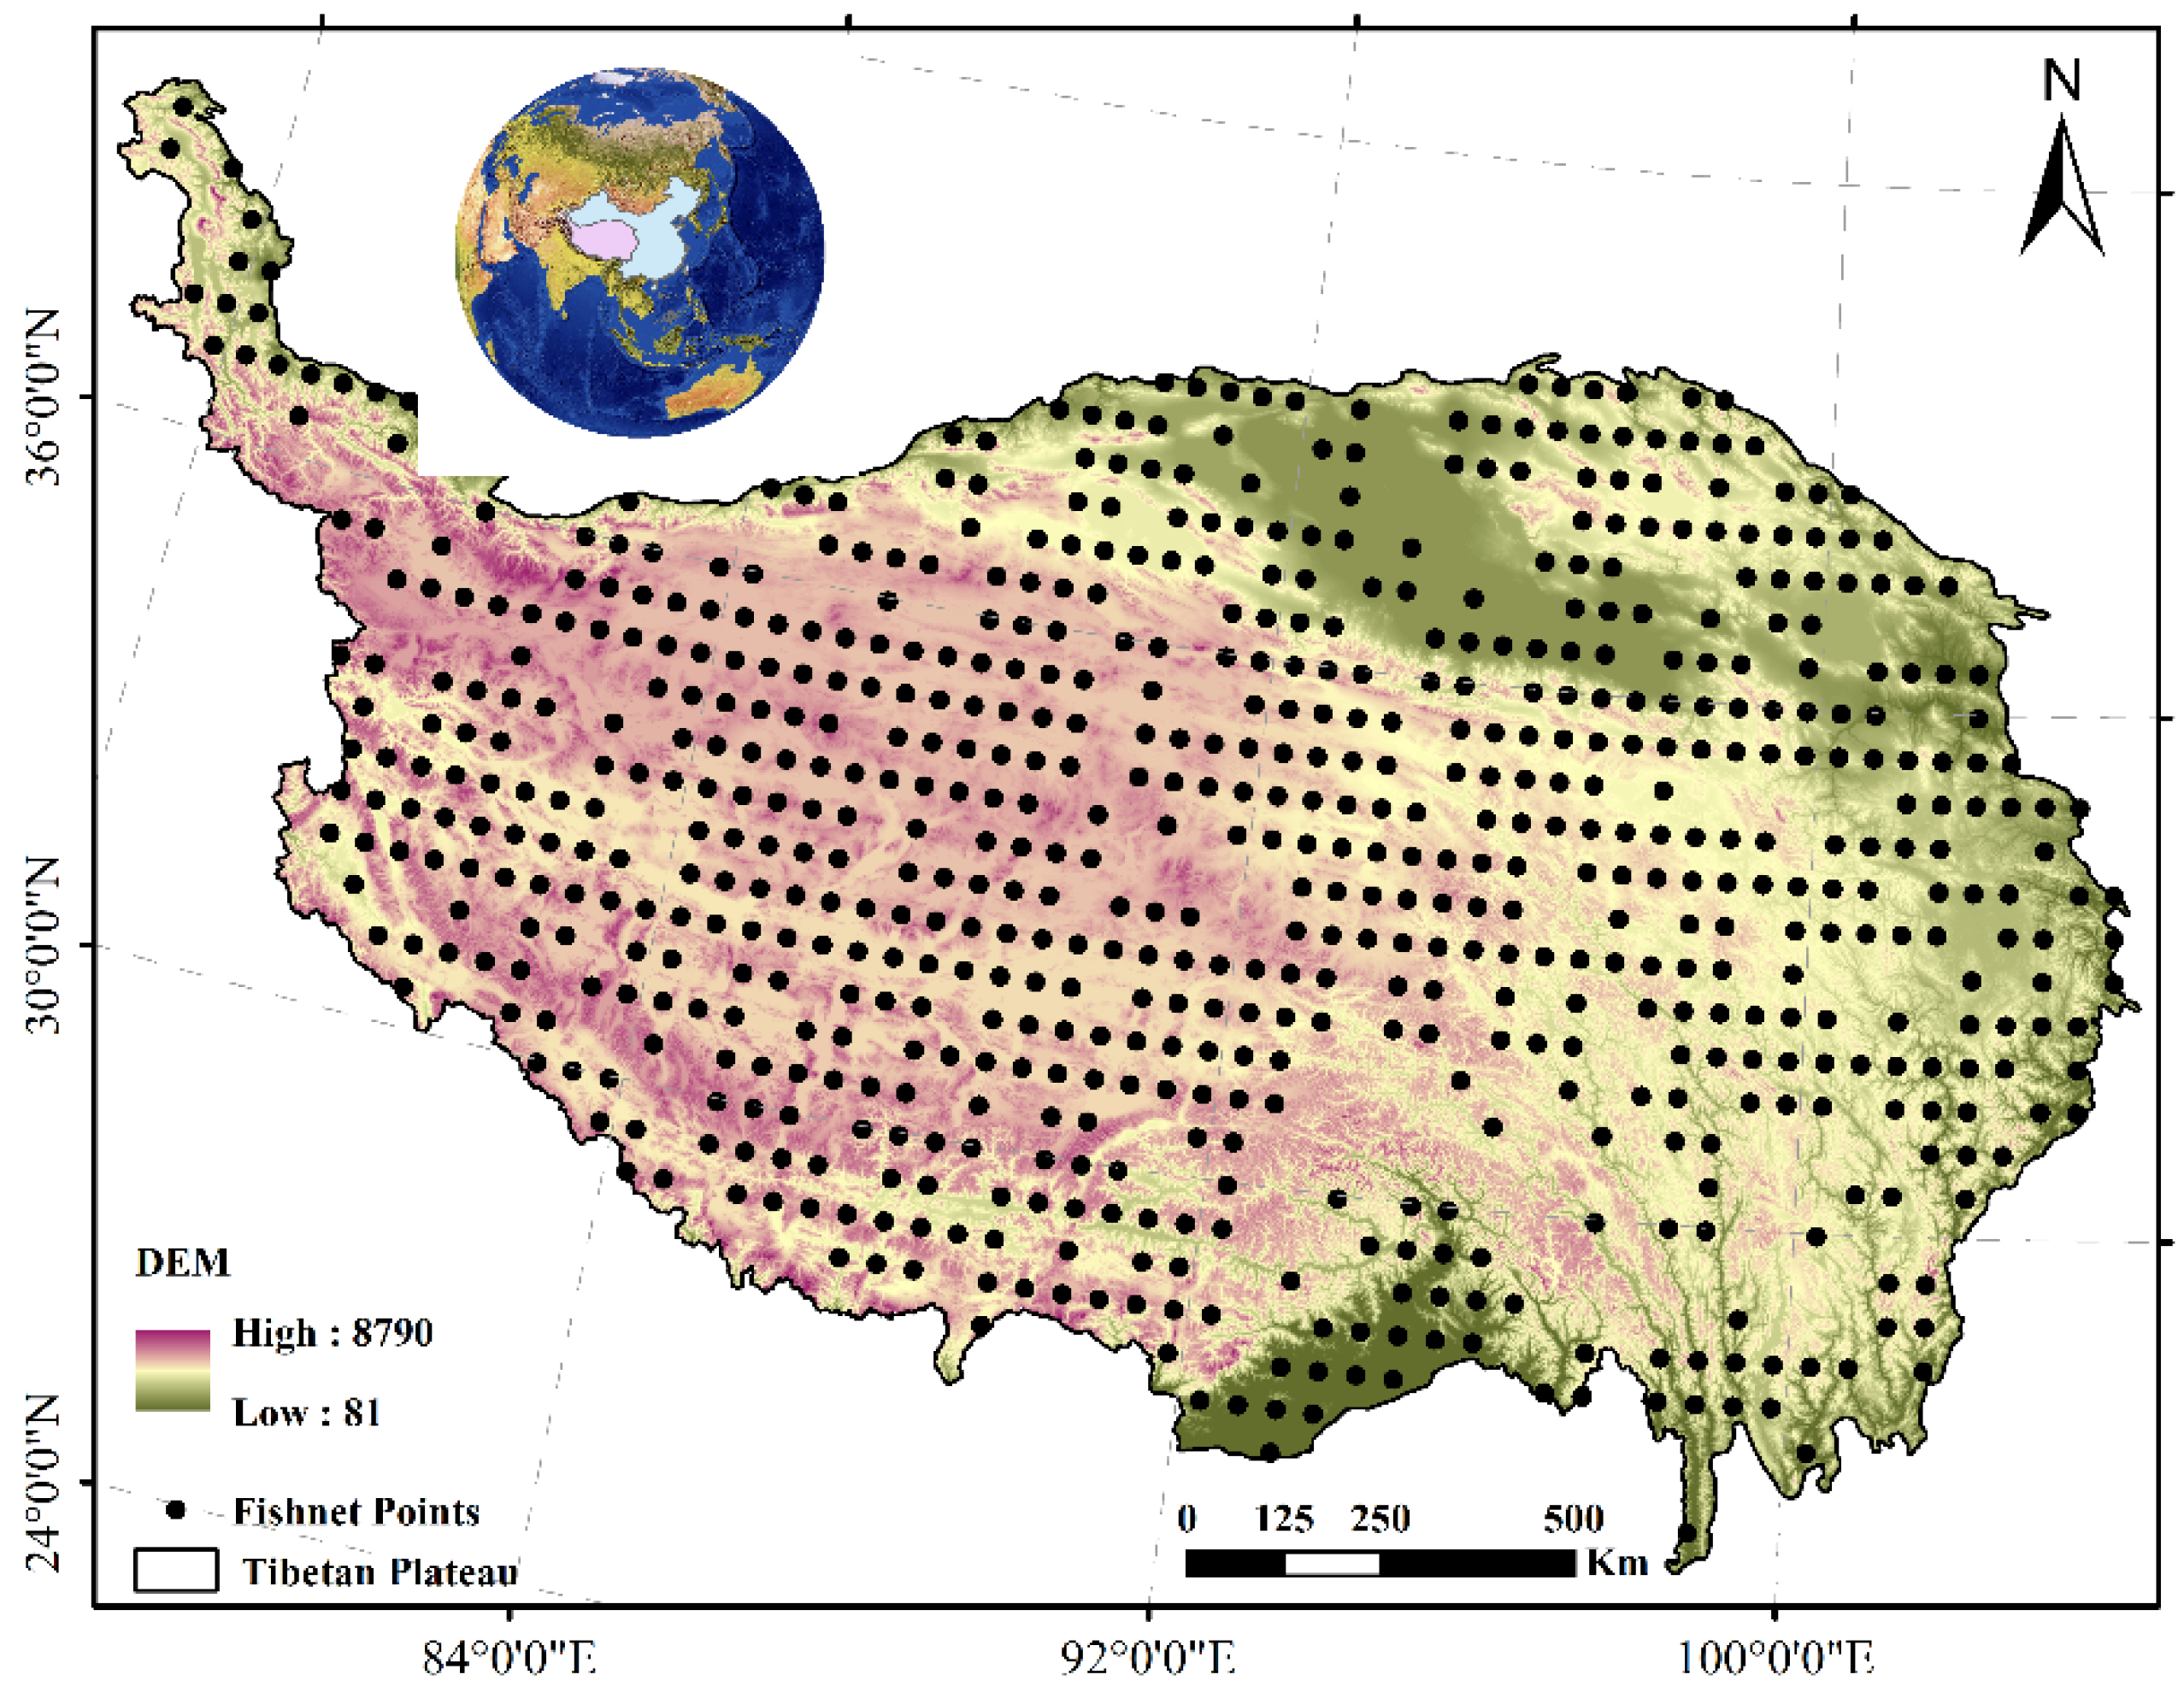
2.1. Study Area

The Tibetan Plateau (26°00′–39°47′ N, 73°19′–104°47′ E), located in southwestern China (Figure 1), is the highest and most extensive plateau in the world, with an average altitude exceeding 4000 m [42]. The typical continental plateau climate is characterized by low temperatures and limited precipitation; the winter is long, cold, and windy, whereas the summer is cold and rainy, with frequent hail [43]. The temperature and precipitation have distinct regional distribution patterns in this area, with a mean annual air temperature (MAT) ranging from −15 to 20 °C and mean annual precipitation (MAP) ranging from 50 to 700 mm from the northwest to the southeast [44]. More than 63.5% of the area of the Tibetan Plateau is covered by alpine desert steppe, alpine steppe, and alpine meadow. Alpine grassland is the dominant ecosystem on the plateau, and the vegetation is alpine meadow (dominated by Kobresia and Poa species) and alpine steppe (dominated by Stipa purpurea and Stipa subsessiliflora) [45]. The other vegetation types on the Tibetan Plateau include forest, shrub, and wetland.

2.2. Normalized Difference Vegetation Index Data

The longest time series (1982–2013) GIMMS NDVI3g dataset, with a spatial resolution of 0.083°, were compiled by merging segments (data strips) during a half-month period using the maximum value composites (MVC) method. It was obtained from the AVHRR instrument onboard the NOAA satellite series 7, 9, 11, 14, 16, and 17 [26] and downloaded from ECOCAST (https://ecocast.arc.nasa.gov (accessed on 6 February 2022)). These data were corrected, including calibration, view geometry, and volcanic aerosols, and verified with a stable desert control point [46]. Meanwhile, the annual 24 NDVI raster database was processed in ArcGIS 10.2 (ESRI, Inc., Redlands, CA, USA) to obtain the maximum NDVI value every year.

2.3. Meteorological Records

Daily climate data (1982–2013) were collected from the Meteorology Information Centre of the Chinese National Bureau of Meteorology (http://data.cma.cn (accessed on 26 February 2022)) [26]. The primary climatic elements of temperature and precipitation were included, and the daily temperature and precipitation were processed to obtain the climate factors every year (annual mean temperature and annual mean precipitation) and for spring (March–May), summer (June–August), autumn (September–November), and winter (December–February). Moreover, the climatic raster database was spatially interpolated using ANUSPLIN 4.2 (Centre for Resource and Environmental Studies, Australian National University, Canberra) [47,48], and resampled with a resolution of 8 km. ANUSPLIN is a suite of FORTRAN programs that employs thin plate smoothing splines fitted to develop continuous climatic surfaces with elevation and noisy weather station data [49].

2.4. Calculation of Vegetation Sensitivity (R2)

Over the Tibetan Plateau, fishnet points (30 rows × 60 columns) were established with ArcGIS 10.2 software (ESRI, Inc., Redlands, CA, USA), and non-vegetated land such as lakes and snowy mountains were removed by the digital land-use dataset (vector) at a scale of 1:100,000 developed by the Resources and Environment Data Centre, Chinese Academy of Sciences (CAS) [50,51]. Meanwhile, the values of temperature, precipitation, and the NDVI in these fishnet points were extracted from the climate and NDVI raster points, respectively. Then, a linear regression analysis of the climate and NDVI was used to reflect the sensitivity (R2) of the climate on the NDVI [52]. The sensitivity of the climate on the NDVI can be defined as Equation (1); a similar method was used to obtain the sensitivity between seasonal climate and the NDVI:
R 2 = i = 1 n y i 2 i = 1 n y i Y i 2 i = 1 n y i 2
where y i is the actual value of the NDVI and Y i is the fitted value of the NDVI.

2.5. Sensitivity Analysis

We used an analysis of variance (ANOVA) in R (Psych package) to explore the significant differences in VSP (and VST) in different seasons collected from 1982 to 2013. Then, the changed rules of VSP (and VST) in different seasons on a timescale were analyzed. Meanwhile, over the Tibetan Plateau, a regression analysis was performed between seasonal VSP/VST and seasonal mean precipitation/temperature from 1982 to 2013. Finally, we introduced a dummy variable (an increasing time sequence) for climate change referring to the annual increased precipitation and temperature and used structural equation modeling (SEM) to verify the hypothesis that the variations in VSP and VST are regulated by certain hydrothermal conditions. Structural equation modeling (SEM) is a multivariate technique that involves computer algorithms and statistics; it has been used in recent studies to explicitly evaluate the causal relationships among multiple interacting variables [53]. We used it to test the direct and indirect effects on the variations in VSP and VST and to describe the hypothetical causal relationships [54]. By selecting the appropriate variables and models based on certain statistical criteria [55], the standard estimate results express the influence on the seasonal VSP (and VST) using a path coefficient generated by the AMOS statistical tool (17.0.2, Amos Development Corporation, Crawfordville, FL, USA).

3. Results

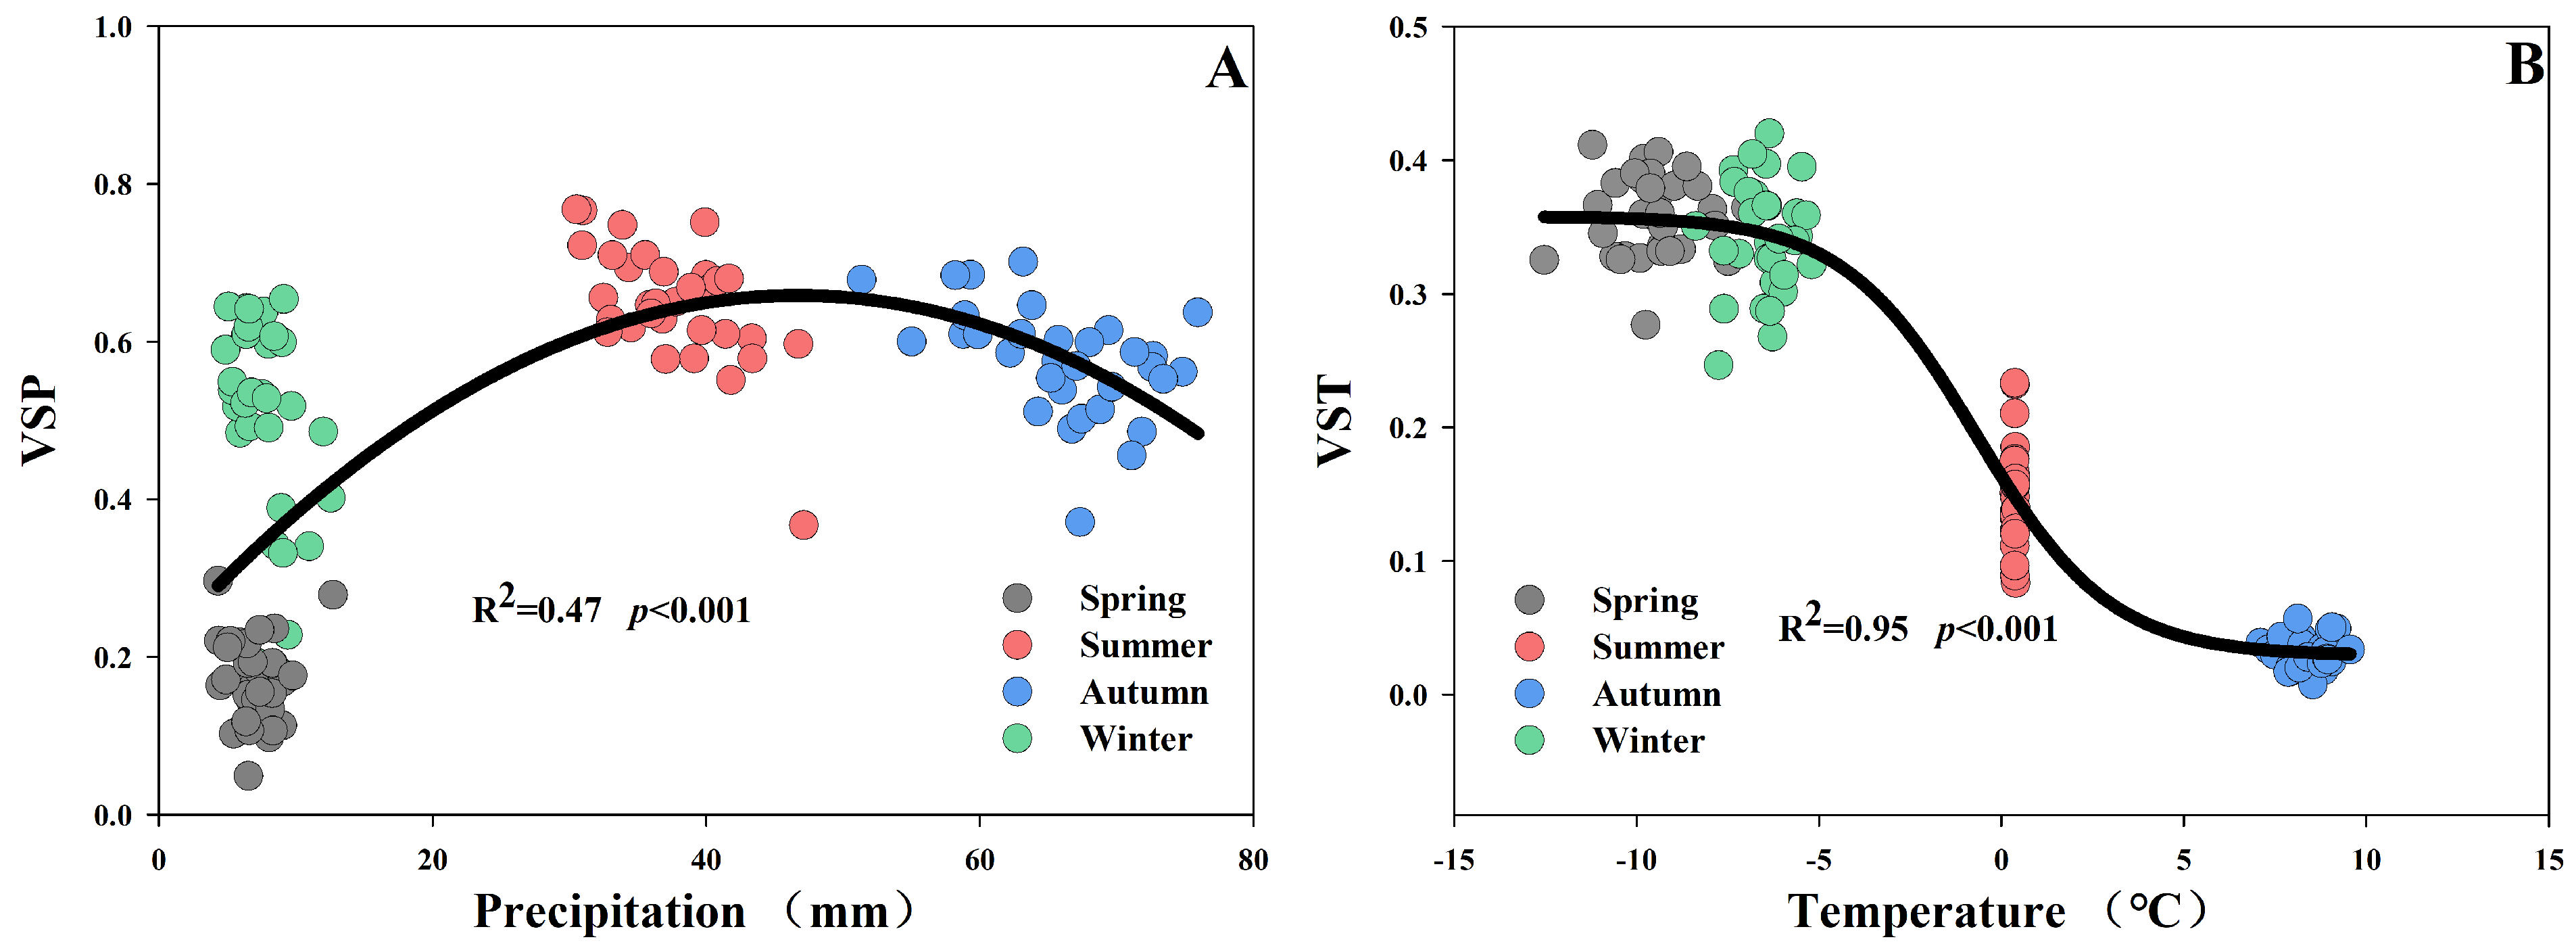
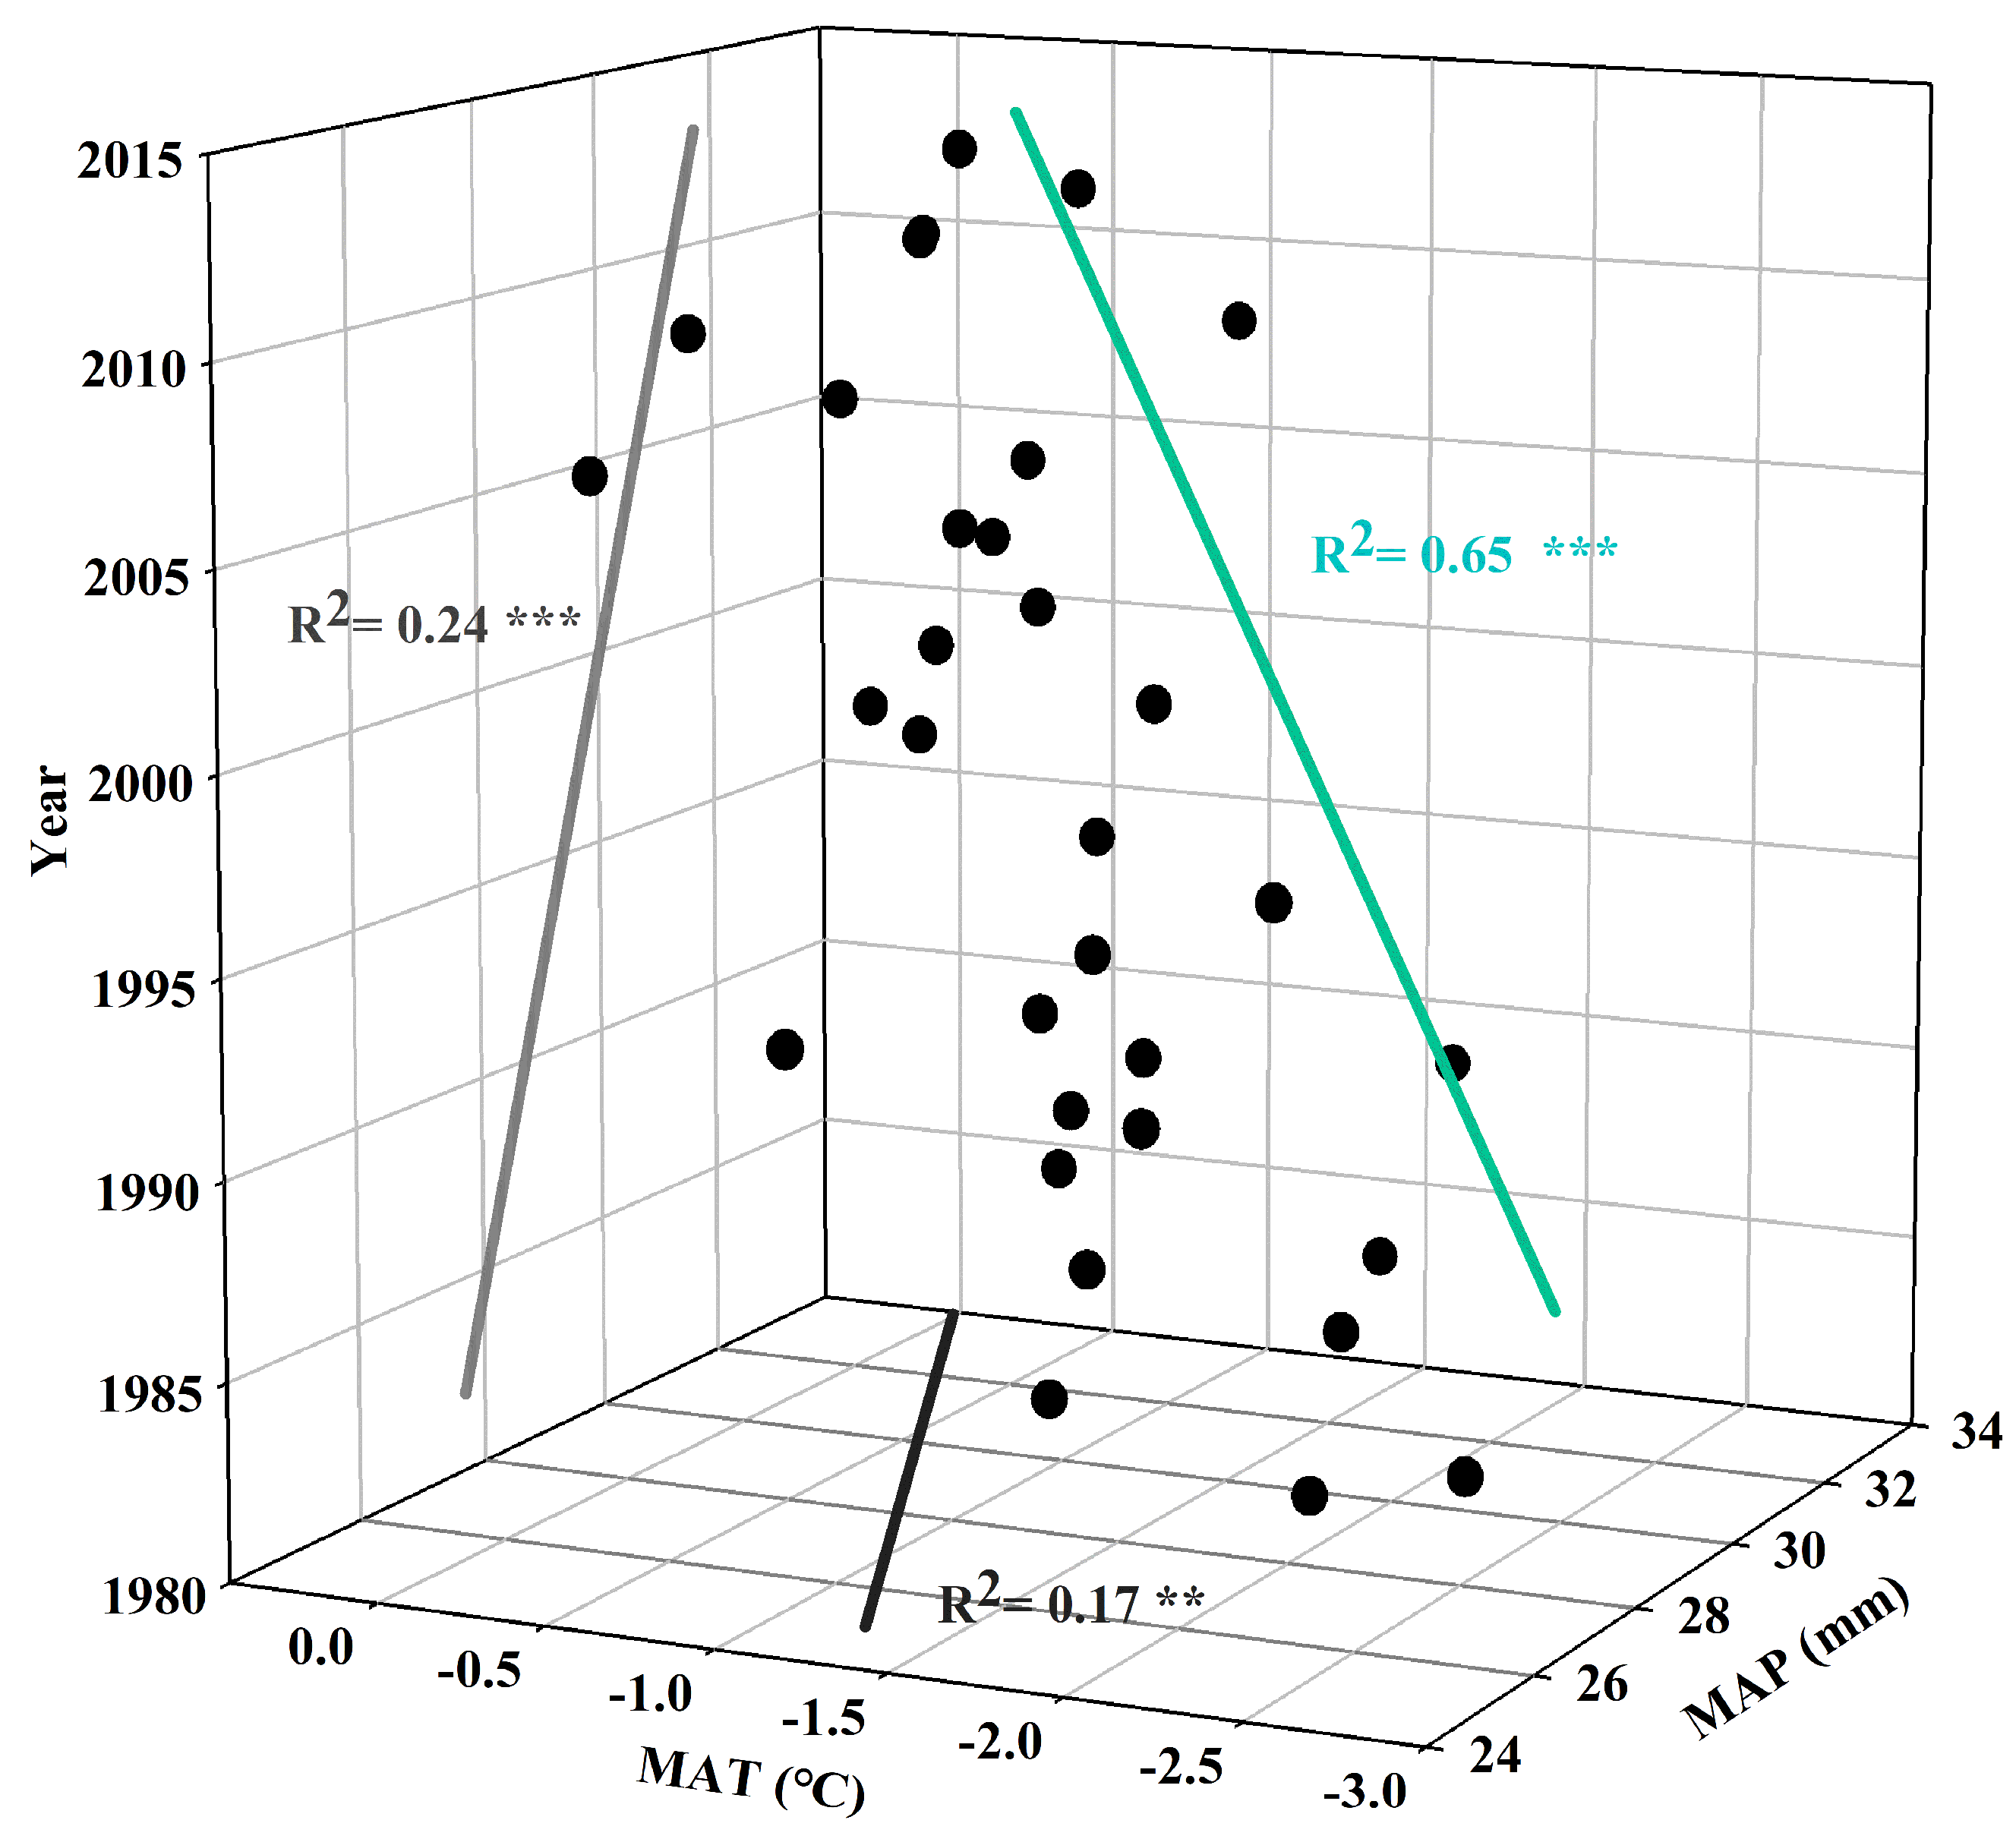
3.1. Relationships of NDVI with MAT and MAP

The regression analysis demonstrated that the NDVI over the Tibetan Plateau was positively correlated with the MAP and MAT. A similar phenomenon was found from 1982 to 2013 (Table 1) where the NDVI exhibited positive correlations with MAP (and MAT). In addition, the VSP ranged from 0.51 to 0.71 (Table 1), which was higher than the VST (0.20–0.29), indicating that the vegetation was more sensitive to MAP than MAT over the Tibetan Plateau.

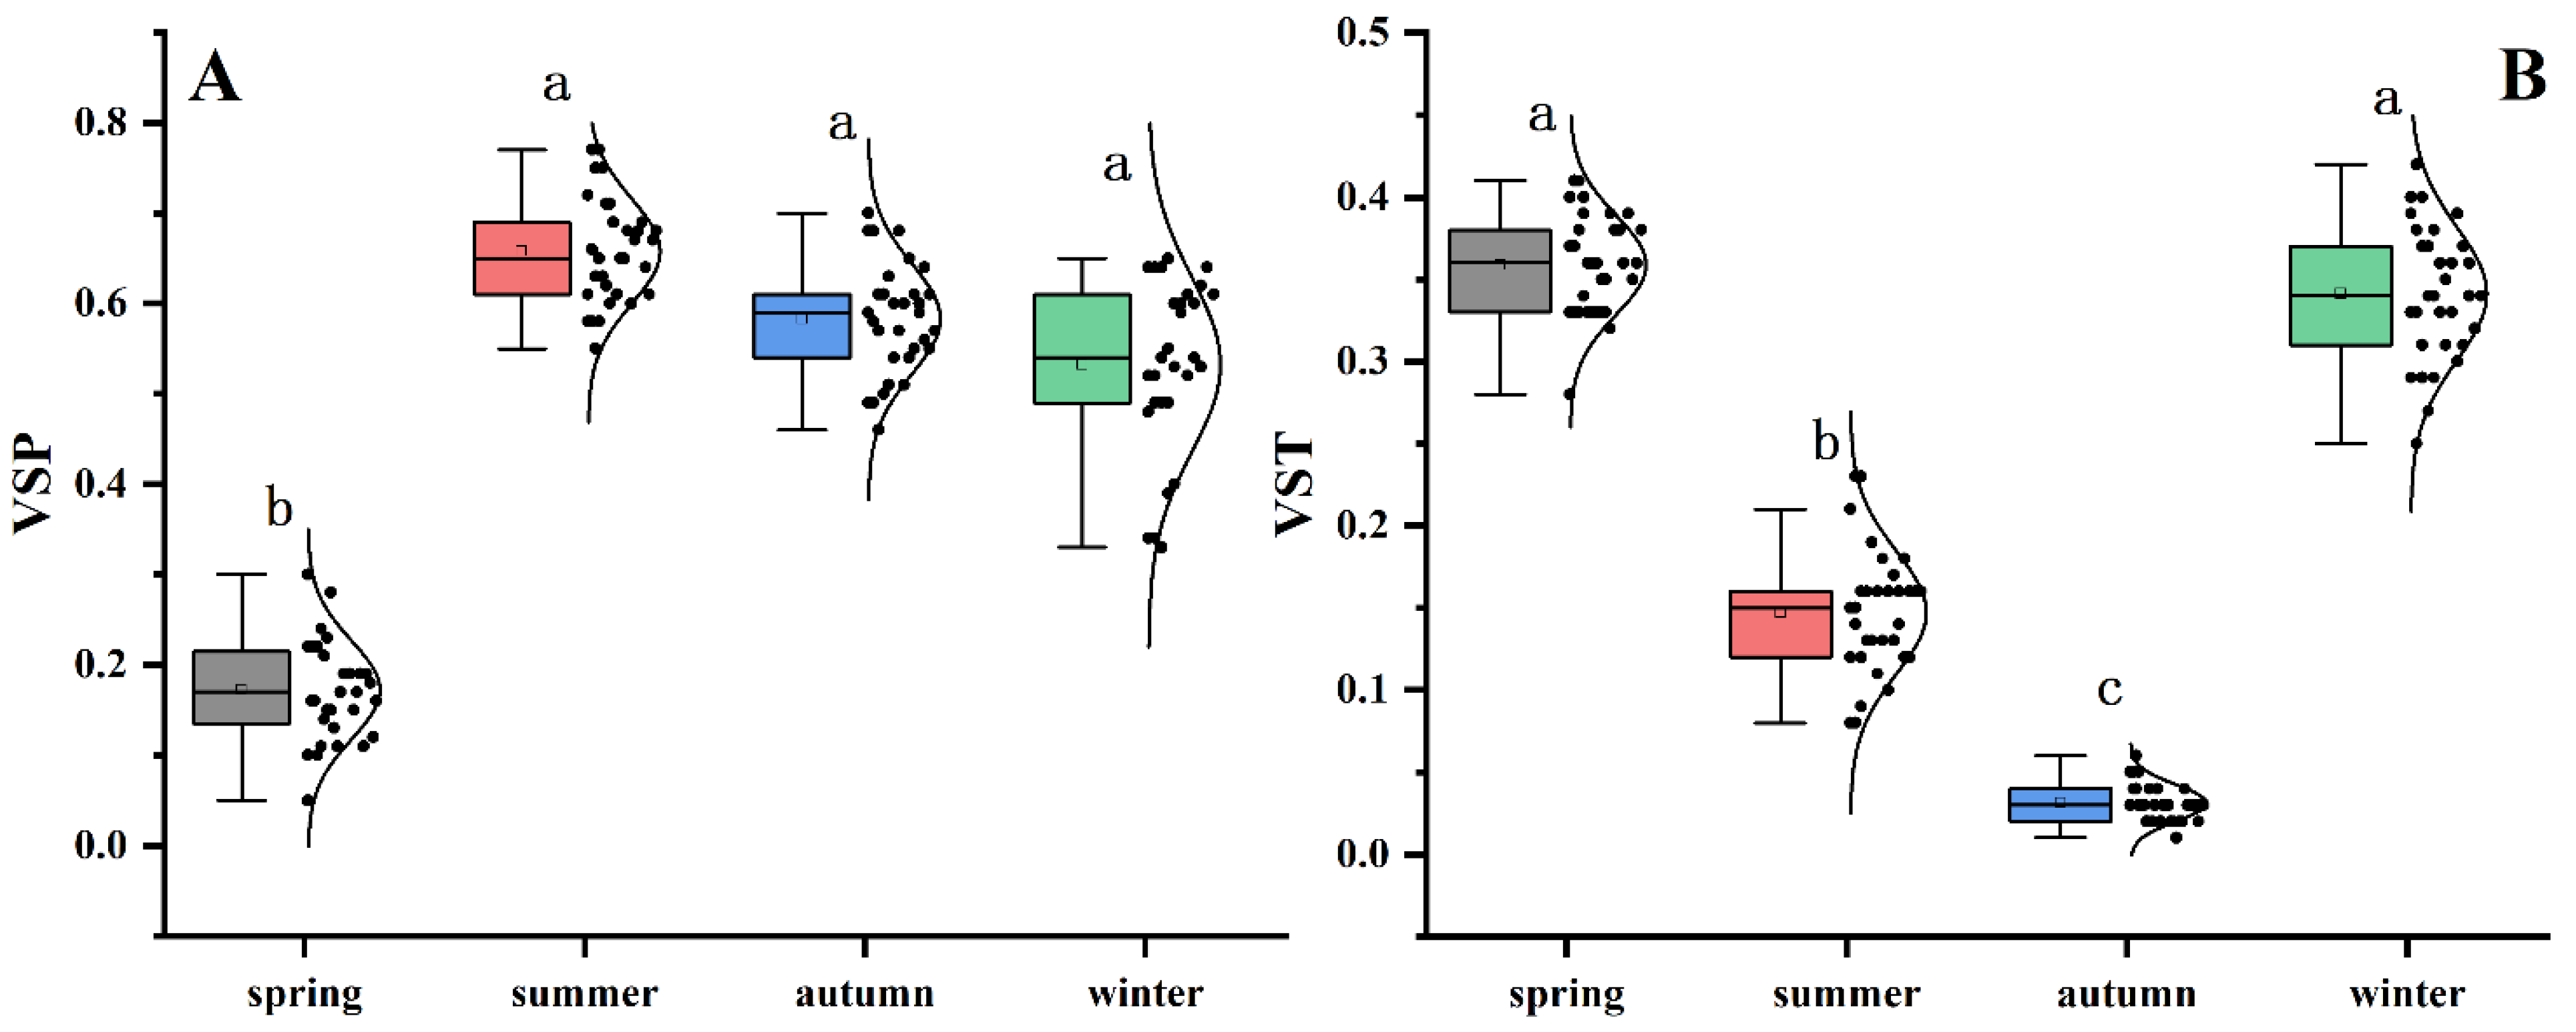
3.2. Seasonal Sensitivity between NDVI and Climate Records

VSP (and VST) showed remarkable differences among the different seasons (Table 1 and Figure 2). The maximum VSP was presented in summer, followed by autumn, winter, and spring. All of the VSP values in summer, autumn, and winter were greater than 0.5, while it was less than 0.25 in spring. Meanwhile, the peak value of VST was found in spring, followed by winter, summer, and autumn.
According to Figure 3, the sensitivity of the NDVI to MAT and MAP fluctuated from 1982 to 2013 and showed non-significant changes (Figure 3A,B). However, both showed seasonal variations; specifically, VSP in spring (y = 0.003x − 6.37, R2 = 0.32, p < 0.001) and winter (y = 0.007x − 13.68, R2 = 0.25, p < 0.001) increased with the time series (from 1982 to 2013) (Figure 3C). VST presented a significant decreasing trend from 1982 to 2013 only in summer (y = −0.002x + 3.75, R2 = 0.21, p < 0.001) (Figure 3D). In addition, both VSP and VST exhibited non-significant variations in other seasons from 1982 to 2013.
On the spatial scale, the regression analysis showed a quadratic curve relationship between the precipitation and VSP (y = −0.0002x2 + 0.02x + 0.21, R2 = 0.47, p < 0.001) (Figure 4A), indicating that when the values of precipitation are approximately 48 mm (summer and autumn) the VSP will be maximized, but the change rate is minimal. This differs from the relationship between temperature and VST, where VST decreased significantly with the increased temperature ( y = 0.03 + 0.33 1 + e x + 0.67   1.83 , R2 = 0.95, p < 0.001). Interestingly, the change rate of VST sharply decreased when it exceeded the critical threshold (0 °C, summer) (Figure 4B).

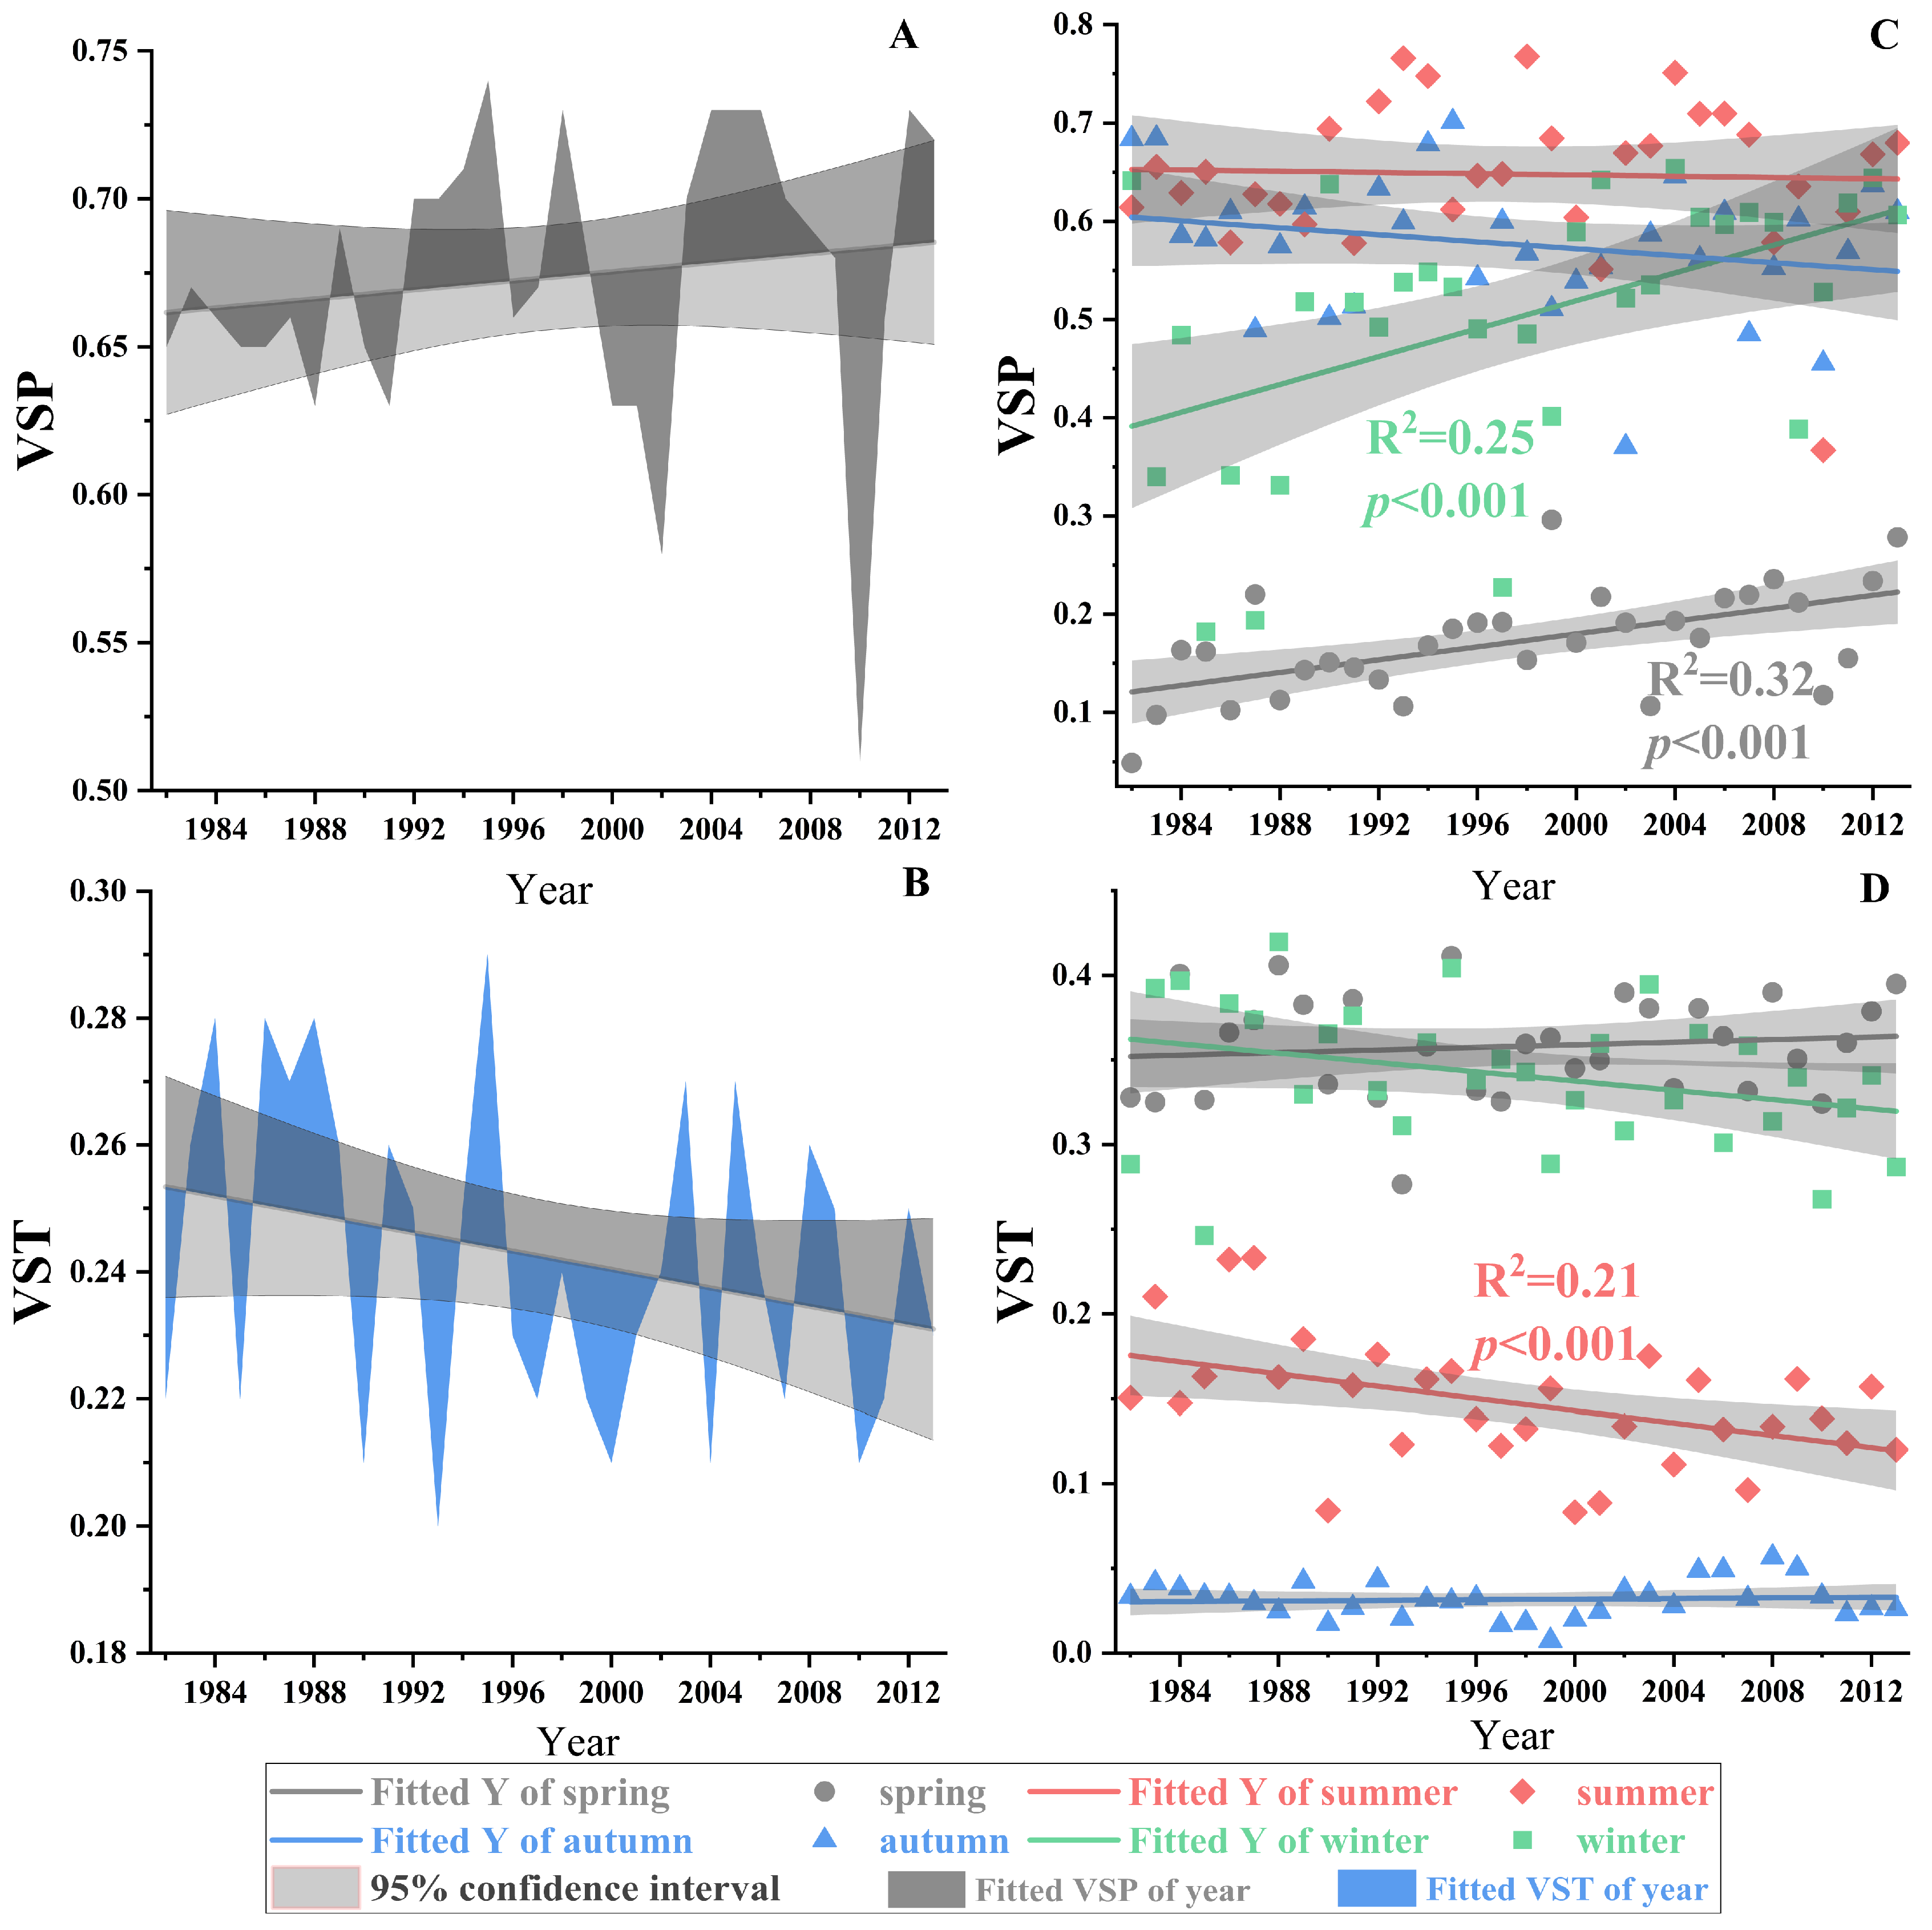
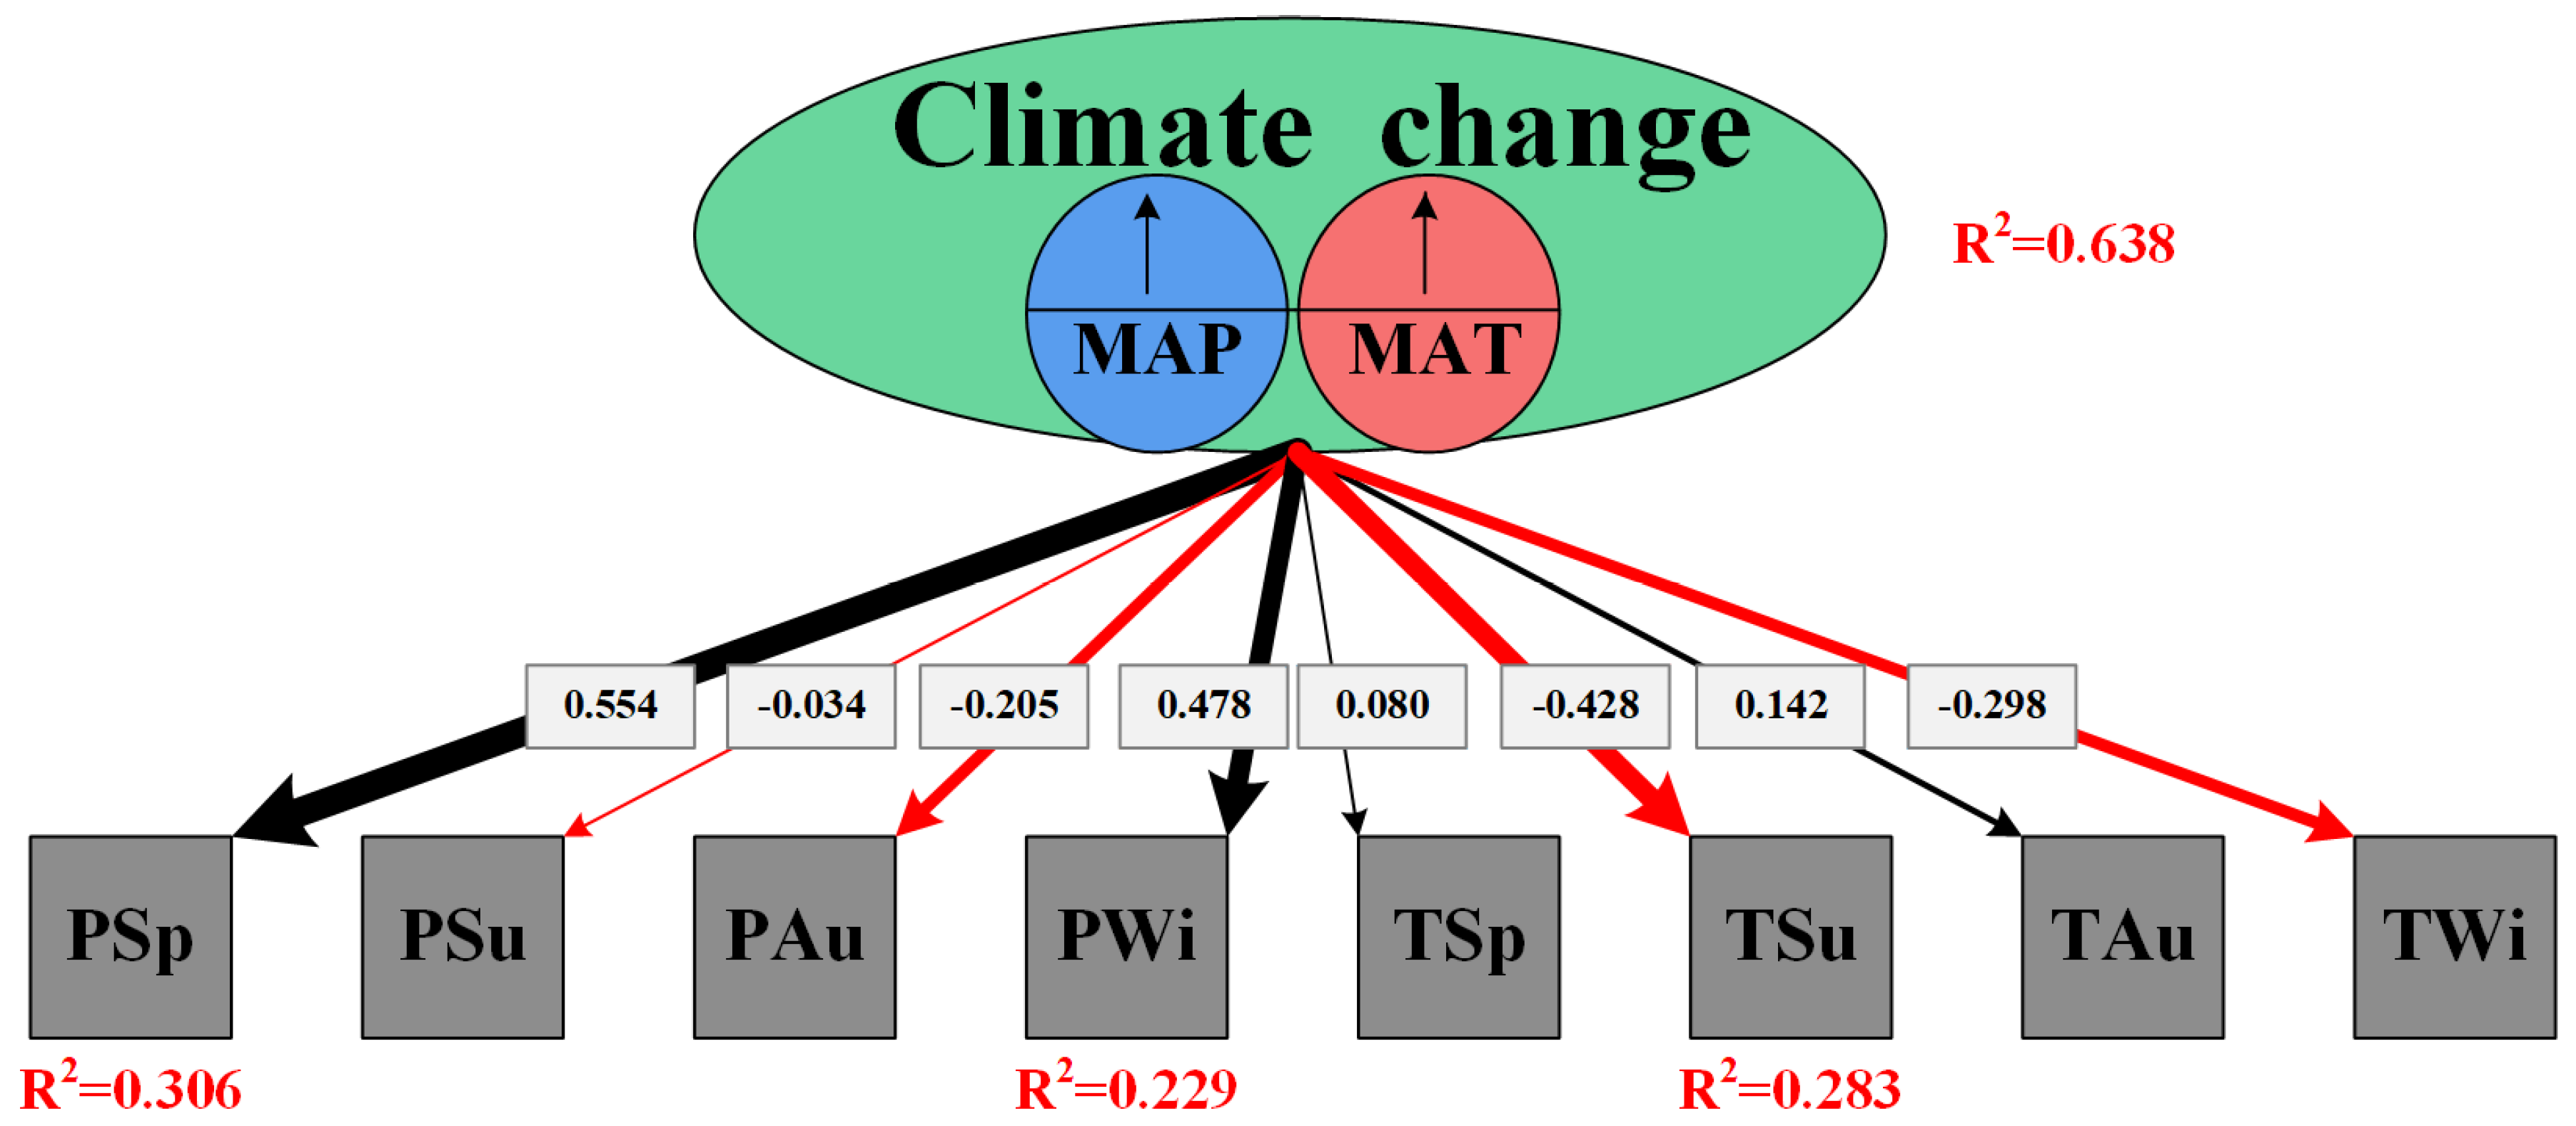
3.3. Climate Change and Its Effect on Seasonal VSP and VST

As illustrated in Figure 5, from 1982 to 2013, MAP increased slowly by 13% (y = 0.11x − 183.95, R2 = 0.24, p < 0.001) over the 32 years. However, MAT increased dramatically by 79% (y = 0.06x − 116.17, R2 = 0.65, p < 0.001). It is noted that both MAP and MAT exhibited a positive correlation from 1982 to 2013 (R2 = 0.17, p < 0.05).
The SEM explained 30.6% of the variation in VSP in spring (PSp), 22.9% of the variation in VSP in winter (PWi), and 28.3% of the variation in VST in summer (TSu) across the Tibetan Plateau (Figure 6). Table 2 shows a summary of the direct, indirect, and total effects of the variables. Dramatic climate changes were strongly associated with increased PSp and PWi, which indicated that PSp and PWi could be well explained by annual increasing precipitation and temperature (climate change) with R-squared values of 0.306 and 0.229, respectively. Despite significant bivariate relationships among MAP, MAT, and PSp or PWi being found, the results mostly demonstrated the indirect positive effects on PSp or PWi. The rank of total effects on them, exhibiting the same decreasing order, was as follows: climate change, MAT, and MAP (Table 2). Meanwhile, negative effects of climate change on TSu were observed, which tells us that TSu might be well illuminated by climate change (R2 = 0.283). In addition, MAP and MAT only had indirect negative effects on TSu through climate change. The total effects on TSu were decreased in order of climate change, MAT, and MAP (Table 2).

4. Discussion

This study redefined the sensitivity index between climate and the NDVI by the coefficient of determination (R2) obtained by a linear regression analysis. It found that vegetation sensitivity to precipitation (VSP) increased in spring and winter, while vegetation sensitivity to temperature (VST) decreased in summer. In fact, R2 is often used to study the influence of climate on vegetation dynamics. For example, it has been used to analyze the effects between the NDVI and climate, and reflect the effect of the climate on net primary production [52,55]. In addition, compared with the previous calculation method of VSP and VST by least squares [1,38], the spatial heterogeneity of VSP and VST was reduced in the updated method because it fragmented the space by dividing the Tibetan Plateau into many small plots, on average, to discuss the sensitivity of vegetation to precipitation and temperature. On a timescale, the findings showed that there were no significant variations in the sensitivity of the NDVI to MAT and MAP from 1982 to 2013. Similarly, this phenomenon has been mentioned in previous studies, such as Hsu et al. [1] who found that changes in the inter-annual variability of precipitation had negligible effects on the mean ANPP. On the contrary, Li et al. [55] highlighted that the NDVI is adaptable to the significant increase in temperature but is sensitive to the decrease in precipitation on the Inner Mongolia Plateau, possibly due to regional differences. In addition, VST and VSP in the different seasons showed significant dynamic change at the scale of space–time (Figure 3 and Figure 4).
More precisely, the VSP in spring and winter showed a significant increase from 1982 to 2013 (Figure 3C). The single-hump relationship between VSP and precipitation (Figure 4A) demonstrated that VSP ascended first and then descended with increased precipitation. Interestingly, the precipitation in spring and winter was distributed only at the edge of the hump, whereas the precipitation in summer and autumn was distributed at the hump. That is, if there is an inter-annual change in precipitation, there will be a significant fluctuation in VSP in spring and winter, whereas the VSP in summer and autumn will fluctuate less (Figure 4A). Numerous studies have also indicated that vegetation is sensitive to precipitation in spring and winter [39]. However, the single-hump relationship between VSP and precipitation in those studies was an inverted hump, which may be caused by the quality of the remote-sensing image and different data-processing methods [56,57,58,59]. In fact, it is easy to understand in terms of the supply–demand relationship between water resources and plants, especially in dry and cold environments (e.g., spring and winter), where precipitation is unquestionably the main limiting factor for plant growth [60,61,62], and a slight increase in precipitation will lead to a significant change in VSP. Nevertheless, increasing precipitation does not necessarily promote growth in VSP when precipitation reaches a certain amount (e.g., summer and autumn). In contrast, the sensitivity of vegetation to precipitation showed a slightly decreased trend because of the negative effect of soil leaching on the positive relationship between precipitation and vegetation [63,64].
For VST, a sigmoidal model was found between VST and temperature (Figure 4B). Overall, VST decreased with increased temperature, but the change rate of VST was far different across the temperature gradient. When the temperature was around 0 °C (summer), the change rate of VST was the largest; a small fluctuation of temperature would lead to a plummet or soar in VST. However, when the temperature was outside that range (spring, winter, and autumn), there would be little fluctuation in VST with a variation in temperature. The reason is probably that summer is the pivotal growing season for alpine plants on the Tibetan Plateau [65,66], and strong evidence has demonstrated that warming induced an earlier start of the growing season [67,68,69], delayed the end of the growing season [70,71,72], and enhanced biomass accumulation [73,74,75,76,77,78]. In addition, the fluctuation in temperature at 0 °C, which led to a large amount of water to condense; water condensation might significantly promote the growth of aboveground biomass, reduce the root-to-shoot ratio, and enhance the accumulation of photosynthetic products in whole plant leaves [79,80]. It was only the uncoordinated changes between the rapidly increased aboveground biomass and the slight fluctuation in temperature that led to the extreme decline in VST in summer. In summary, variations around the critical threshold for the hydrothermal environment (monthly precipitation: 4–12 mm; monthly average temperature: 0 °C) resulted in variations in seasonal VST and seasonal VSP. However, the lagged response period of vegetation to hydrothermal environments is generally only two months [81,82]; consequently, when the average temperature and precipitation span a long time, although the average temperature and precipitation are near the threshold conditions, their variation will not cause significant dynamics in VSP and VST. That is why the annual VSP and VST during 1982–2013 did not change significantly with the MAP and MAT, varying around 25–34 mm and −2.5–0.0 °C, respectively.
Additionally, the result of SEM also proved that climate change can only regulate VSP and VST under limited hydrothermal conditions. It showed that climate change had positive effects on PSp and PWi (path coefficients = 0.554 and 0.478, respectively), and a negative effect on TSu with a path coefficient of −0.428 (Figure 6), but for any other dependent variable the effect of climate change on them is not significant (Table 2). It means that with the exception of the monthly precipitation range of 4–12 mm and monthly average temperatures around 0 °C, annual increasing precipitation and temperature under other conditions do not cause significant changes in the VSP and VST. Even if there is an interaction between precipitation and temperature [60,83,84,85] and impaction from other climate factors, such as solar radiation and carbon dioxide concentrations [72,86,87,88,89], it will not change as climate change refers to an increasing time sequence.

5. Conclusions

Climate change will alter the sensitivity of the NDVI to seasonal precipitation and seasonal temperature. Our analysis quantified these changes and indicated that the sensitivity of the NDVI to seasonal precipitation showed a significant increase in spring and winter, while there was a significant decreasing trend in the sensitivity of the NDVI to seasonal temperature in summer. Our sensitivity analysis also quantified the critical threshold conditions of these changes, and pointed out that the threshold conditions of seasonal VSP and seasonal VST were captured in the 4–12 mm range (monthly precipitation) and 0 °C (monthly average temperature), respectively. This study highlighted that climate change under these threshold conditions would lead to a variation in the sensitivity of the NDVI to seasonal precipitation and seasonal temperature. Therefore, more attention should be paid to the mechanism of plant physiological changes under hydrothermal threshold conditions in future studies.

Author Contributions

B.L. and Q.T. jointly designed the study and wrote the thesis. Y.Z., T.Z. (Tao Zeng) and T.Z. (Ting Zhou) participated in the process of discussion, editing, and revision. All authors have read and agreed to the published version of the manuscript.

Funding

This research was funded by the Guangdong Basic and Applied Basic Research Foundation (2020A1515011265), the Special Foundation for National Science and Technology Basic Resources Investigation of China (2019FY202300), the Project “Value Realization of Nature Conservation Areas” (Forestry Administration of Guangdong Province), and the Hongda Zhang Scientific Research Fund, Sun Yat-Sen University.

Data Availability Statement

Not applicable.

Acknowledgments

The authors would like to thank the anonymous reviewers for providing invaluable comments on the original manuscript and Yanping Zhang for her support of his work.

Conflicts of Interest

The authors declare no conflict of interest.

References

  1. Hsu, J.S.; Powell, J.; Adler, P.B. Sensitivity of mean annual primary production to precipitation. Glob. Chang. Biol. 2012, 18, 2246–2255. [Google Scholar] [CrossRef]
  2. Tian, H.; Cao, C.; Wei, C.; Bao, S.; Yang, B.; Myneni, R.B. Response of vegetation activity dynamic to climatic change and ecological restoration programs in Inner Mongolia from 2000 to 2012. Ecol. Eng. 2015, 82, 276–289. [Google Scholar] [CrossRef]
  3. Ru, J.; Zhou, Y.; Hui, D.; Zheng, M.; Wan, S. Shifts of growing-season precipitation peaks decrease soil respiration in a semiarid grassland. Glob. Chang. Biol. 2018, 24, 1001–1011. [Google Scholar] [CrossRef]
  4. Radu, D.D.; Duval, T.P. Precipitation frequency alters peatland ecosystem structure and co2 exchange: Contrasting effects on moss, sedge, and shrub communities. Glob. Chang. Biol. 2018, 24, 2051–2065. [Google Scholar] [CrossRef] [PubMed]
  5. Siepielski, A.M.; Morrissey, M.B.; Buoro, M.; Carlson, S.M.; Caruso, C.M.; Clegg, S.M.; Coulson, T.; DiBattista, J.; Gotanda, K.M.; Francis, C.D.; et al. Precipitation drives global variation in natural selection. Science 2017, 355, 959–962. [Google Scholar] [CrossRef] [PubMed] [Green Version]
  6. Asner, G.P.; Elmore, A.J.; Olander, L.P.; Martin, R.E.; Harris, A.T. Grazing systems, ecosystem responses, and global change. Annu. Rev. Environ. Resour. 2004, 29, 261–299. [Google Scholar] [CrossRef]
  7. Seddon, A.W.; Macias-Fauria, M.; Long, P.R.; Benz, D.; Willis, K.J. Sensitivity of global terrestrial ecosystems to climate variability. Nature 2016, 531, 229–232. [Google Scholar] [CrossRef] [Green Version]
  8. Smith, M.D.; Wilcox, K.R.; Power, S.A.; Tissue, D.T.; Knapp, A.K. Assessing community and ecosystem sensitivity to climate change—Toward a more comparative approach. J. Veg. Sci. 2017, 28, 235–237. [Google Scholar] [CrossRef] [Green Version]
  9. Knapp, A.K.; Beier, C.B.; David, D.; Classen, A.T.; Luo, Y.; Reichstein, M.; Smith, M.D.; Smith, S.D.; Bell, J.E.; Fay, P.A.; et al. Consequences of More Extreme Precipitation Regimes for Terrestrial Ecosystems. Bioscience 2008, 58, 811–821. [Google Scholar] [CrossRef]
  10. Guo, Q.; Hu, Z.; Li, S.; Li, X.; Sun, X.; Yu, G. Spatial variations in aboveground net primary productivity along a climate gradient in Eurasian temperate grassland: Effects of mean annual precipitation and its seasonal distribution. Glob. Chang. Biol. 2012, 18, 3624–3631. [Google Scholar] [CrossRef]
  11. Mariano, D.A.; Santos, C.A.C.D.; Wardlow, B.D.; Anderson, M.C.; Schiltmeyer, A.V.; Tadesse, T.; Svoboda, M.D. Use of remote sensing indicators to assess effects of drought and human-induced land degradation on ecosystem health in Northeastern Brazil. Remote Sens. Environ. 2018, 213, 129–143. [Google Scholar] [CrossRef]
  12. Craine, J.M.; Nippert, J.B.; Elmore, A.J.; Skibbe, A.M.; Hutchinson, S.L.; Brunsell, N.A. Timing of climate variability and grassland productivity. Proc. Natl. Acad. Sci. USA 2012, 109, 3401–3405. [Google Scholar] [CrossRef] [PubMed] [Green Version]
  13. Heisler-White, J.L.; Knapp, A.K.; Kelly, E.F. Increasing precipitation event size increases aboveground net primary productivity in a semi-arid grassland. Oecologia 2008, 158, 129–140. [Google Scholar] [CrossRef]
  14. Knapp, A.K.; Fay, P.A.; Blair, J.M.; Collins, S.L.; Smith, M.D.; Carlisle, J.D.; Harper, C.W.; Danner, B.T.; Lett, M.S.; Mccarron, J.K. Rainfall variability, carbon cycling, and plant species diversity in a mesic grassland. Science 2002, 298, 2202–2205. [Google Scholar] [CrossRef] [PubMed] [Green Version]
  15. Nippert, J.B.; Knapp, A.K.; Briggs, J.M. Intra-annual rainfall variability and grassland productivity: Can the past predict the future? Plant Ecol. 2006, 184, 65–74. [Google Scholar] [CrossRef]
  16. Wang, Z.P.; Zhang, X.Z.; He, Y.T.; Li, M.; Shi, P.L.; Zu, J.X.; Niu, B. Responses of normalized difference vegetation index (NDVI) to precipitation changes on the grassland of Tibetan Plateau from 2000 to 2015. Chin. J. Appl. Ecol. 2018, 29, 75–83. [Google Scholar]
  17. Bai, Y. Influence of seasonal distribution of precipitation on primary productivity of Stipa krylovii community. Chin. J. Plant Ecol. 1999, 23, 155–160. [Google Scholar]
  18. Zuidema, G.; Born, G.J.V.D.; Alcamo, J.; Kreileman, G.J.J. Simulating changes in global land cover as affected by economic and climatic factors. Water Air Soil Pollut. 1994, 76, 163–198. [Google Scholar] [CrossRef]
  19. Cui, L.; Wang, L.; Singh, R.P.; Lai, Z.; Jiang, L.; Yao, R. Association analysis between spatiotemporal variation of vegetation greenness and precipitation/temperature in the Yangtze River Basin (China). Environ. Sci. Pollut. Res. 2018, 25, 21867–21878. [Google Scholar] [CrossRef]
  20. Aerts, R.; Cornelissen, J.H.C.; Dorrepaal, E. Plant Performance in a Warmer World: General Responses of Plants from Cold, Northern Biomes and the Importance of Winter and Spring Events. Plant Ecol. 2006, 182, 65–77. [Google Scholar]
  21. Cui, Y. Preliminary Estimation of the Realistic Optimum Temperature for Vegetation Growth in China. Environ. Manag. 2013, 52, 151–162. [Google Scholar] [CrossRef] [PubMed]
  22. Justice, C.O.; Hiernaux, P.H.Y. Monitoring the grasslands of the Sahel using NOAA AVHRR data: Niger 1983. Int. J. Remote Sens. 1986, 7, 1475–1497. [Google Scholar] [CrossRef]
  23. Menenti, M.; Azzali, S.; Verhoef, W.; Swol, R.V. Mapping agroecological zones and time lag in vegetation growth by means of fourier analysis of time series of NDVI images. Adv. Space Res. 1993, 13, 233–237. [Google Scholar] [CrossRef]
  24. Burgess, D.W.; Lewis, P.; Jpal, M. Topographic effects in AVHRR NDVI data. Remote Sens. Environ. 1995, 54, 223–232. [Google Scholar] [CrossRef]
  25. Rafique, R.; Zhao, F.; Jong, R.D.; Zeng, N.; Asrar, G.R. Global and Regional Variability and Change in Terrestrial Ecosystems Net Primary Production and NDVI: A Model-Data Comparison. Remote Sens. 2016, 8, 177. [Google Scholar] [CrossRef] [Green Version]
  26. Wang, J.; Zhou, T.; Peng, P. Phenology Response to Climatic Dynamic across China’s Grasslands from 1985 to 2010. ISPRS Int. J. Geo-Inf. 2018, 7, 290. [Google Scholar] [CrossRef] [Green Version]
  27. Hu, G.Y.; Dong, Z.B.; Lu, J.F.; Yan, C.Z. Driving forces of land use and land cover change (LUCC) in the Zoige Wetland, Qinghai-Tibetan Plateau. Sci. Cold Arid Reg. 2012, 4, 422–430. [Google Scholar]
  28. Piao, S.L.; Fang, J.Y.; Zhou, L.M.; Guo, Q.H.; Henderson, M.; Ji, W.; Li, Y.; Tao, S. Interannual variations of monthly and seasonal normalized difference vegetation index (NDVI) in China from 1982 to 1999. J. Geophys. Res. Atmos. 2003, 108, 4401. [Google Scholar] [CrossRef]
  29. Xu, G.; Zhang, H.F.; Chen, B.Z.; Zhang, H.R.; Innes, J.L.; Wang, G.Y.; Yan, J.W.; Zheng, Y.H.; Zhu, Z.C.; Myneni, R.B. Changes in Vegetation Growth Dynamics and Relations with Climate over China’s Landmass from 1982 to 2011. Remote Sens. 2014, 6, 3263–3283. [Google Scholar] [CrossRef] [Green Version]
  30. Yuan, W.; Wu, S.Y.; Hou, S.G.; Xu, Z.W.; Lu, H.Y. Normalized Difference Vegetation Index-based assessment of climate change impact on vegetation growth in the humid-arid transition zone in northern China during 1982–2013. Int. J. Clim. 2019, 39, 5583–5598. [Google Scholar] [CrossRef]
  31. Kirilenko, A.P.; Solomon, A.M. Modeling dynamic vegetation response to rapid climate change using bioclimatic classification. Clim. Change 1998, 38, 15–49. [Google Scholar] [CrossRef]
  32. Liu, B.; Sun, J.; Liu, M.; Zeng, T.; Zhu, J. The aridity index governs the variation of vegetation characteristics in alpine grassland, Northern Tibet Plateau. PeerJ 2019, 7, e7272. [Google Scholar] [CrossRef] [PubMed]
  33. Kang, S.; Xu, Y.; You, Q.; Flügel, W.A.; Pepin, N.; Yao, T. Review of climate and cryospheric change in the Tibetan Plateau. Environ. Res. Lett. 2010, 5, 15101. [Google Scholar] [CrossRef]
  34. Wang, X.; Du, Z.; Shen, Y. Land use change and its driving forces on the Tibetan Plateau during 1990–2000. Catena 2008, 72, 56–66. [Google Scholar] [CrossRef]
  35. Fay, P.A.; Carlisle, J.D.; Knapp, A.K.; Blair, J.M.; Collins, S.L. Productivity responses to altered rainfall patterns in a C4-dominated grassland. Oecologia 2003, 137, 245–251. [Google Scholar] [CrossRef]
  36. Heislerwhite, J.L.; Blair, J.M.; Kelly, E.F.; Harmoney, K.; Knapp, A.K. Contingent productivity responses to more extreme rainfall regimes across a grassland biome. Glob. Chang. Biol. 2010, 15, 2894–2904. [Google Scholar] [CrossRef]
  37. Swemmer, A.; Knapp, A.; Snyman, H. Intra-seasonal precipitation patterns and above-ground productivity in three perennial grasslands. J. Ecol. 2007, 95, 780–788. [Google Scholar] [CrossRef]
  38. Fu, Y.H.; Zhao, H.F.; Piao, S.L.; Marc, P.; Peng, S.S.; Zhou, G.Y.; Philippe, C.; Huang, M.T.; Annette, M.; Josep, P.; et al. Declining global warming effects on the phenology of spring leaf unfolding. Nature 2015, 526, 104–107. [Google Scholar] [CrossRef] [Green Version]
  39. Li, M.; Wu, J.S.; Song, C.Q.; He, Y.T.; Niu, B.; Fu, G.; Tarolli, P.; Tietjen, B.; Zhang, X.Z. Temporal Variability of Precipitation and Biomass of Alpine Grasslands on the Northern Tibetan Plateau. Remote Sens. 2019, 11, 360. [Google Scholar] [CrossRef] [Green Version]
  40. Yu, H.Y.; Xu, J.C.; Okuto, E.; Luedeling, E. Seasonal Response of Grasslands to Climate Change on the Tibetan Plateau. PLoS ONE 2012, 7, e49230. [Google Scholar]
  41. Potter, C.S.; Brooks, V. Global analysis of empirical relations between annual climate and seasonality of NDVI. Int. J. Remote Sens. 1998, 19, 2921–2948. [Google Scholar] [CrossRef]
  42. Sun, J.; Zhou, T.; Liu, M.; Chen, Y.; Shang, H.; Zhu, L.; Shedayi, A.A.; Yu, H.; Cheng, G.; Liu, G.; et al. Linkages of the dynamics of glaciers and lakes with the climate elements over the Tibetan Plateau. Earth-Sci. Rev. 2018, 185, 308–324. [Google Scholar] [CrossRef]
  43. Sun, J.; Qin, X.J.; Yang, J. The response of vegetation dynamics of the different alpine grassland types to temperature and precipitation on the Tibetan Plateau. Environ. Monit. Assess. 2016, 188, 20–22. [Google Scholar] [CrossRef] [PubMed] [Green Version]
  44. Sun, J.; Liu, B.Y.; You, Y.; Li, W.P.; Liu, M.; Shang, H.; He, J.S. Solar radiation regulates the leaf nitrogen and phosphorus stoichiometry across alpine meadows of the Tibetan Plateau. Agric. For. Meteorol. 2019, 271, 92–101. [Google Scholar] [CrossRef]
  45. Sun, J.; Cheng, G.W.; Li, W.P.; Sha, Y.K.; Yang, Y.C. On the variation of NDVI with the principal climatic elements in the Tibetan Plateau. Remote Sens. 2013, 5, 1894–1911. [Google Scholar] [CrossRef] [Green Version]
  46. Zhang, G.L.; Zhang, Y.; Dong, J.; Xiao, X.M. Green-up dates in the Tibetan Plateau have continuously advanced from 1982 to 2011. Proc. Natl. Acad. Sci. USA 2013, 110, 4309–4314. [Google Scholar] [CrossRef] [Green Version]
  47. Hutchinson, M.F. Interpolating mean rainfall using thin plate smoothing splines. Int. J. Geogr. Inf. Syst. 1995, 9, 385–403. [Google Scholar] [CrossRef]
  48. Hutchinson, M.F. ANUSPLIN version 4.2 User Guide. In Centre for Resource and Environmental Studies; Australian National University: Canberra, Australia, 2001. [Google Scholar]
  49. McKenney, D.W.; Pedlar, J.H.; Papadopol, P.; Hutchinson, M.F. The development of 1901–2000 historical monthly climate models for Canada and the United States. Agric. For. Meteorol. 2006, 138, 69–81. [Google Scholar] [CrossRef]
  50. Gu, S.X.; Xu, X.; Liu, S.Z. Analysis on the spatio-temporal changes of sustainable land use in Tibet. Wuhan Univ. J. Nat. Sci. 2006, 11, 937–944. [Google Scholar]
  51. Liu, J.Y.; Liu, M.L.; Tian, H.Q.; Zhuang, D.F.; Zhang, Z.X.; Zhang, W.; Tang, X.M.; Deng, X.Z. Spatial and temporal patterns of China’s cropland during 1990–2000: An analysis based on Landsat TM data. Remote Sens. Environ. 2005, 98, 442–456. [Google Scholar] [CrossRef]
  52. Cui, J.; Wang, Y.; Zhou, T.; Jiang, L.; Qi, Q. Temperature Mediates the Dynamic of MODIS NPP in Alpine Grassland on the Tibetan Plateau, 2001–2019. Remote Sens. 2022, 14, 2401. [Google Scholar] [CrossRef]
  53. Sun, J.; Ma, B.B.; Lu, X.Y. Grazing enhances soil nutrient effects: Trade-offs between aboveground and belowground biomass in alpine grasslands of the Tibetan Plateau. Land Degrad. Dev. 2017, 29, 337–348. [Google Scholar] [CrossRef]
  54. Fan, Y.; Chen, J.Q.; Shirkey, G.; John, R.; Wu, S.R.; Park, H.; Shao, C.L. Applications of structural equation modeling (SEM) in ecological studies: An updated review. Ecol. Process 2016, 5, 19. [Google Scholar] [CrossRef] [Green Version]
  55. Li, Y.; Wu, D.; Yang, L.; Zhou, T. Declining Effect of Precipitation on the Normalized Difference Vegetation Index of Grasslands in the Inner Mongolian Plateau, 1982–2010. Appl. Sci. 2021, 11, 8766. [Google Scholar] [CrossRef]
  56. Gao, Q.; Li, Y.; Wan, Y.; Lin, E.; Sheng, W.; Yang, K. Remote sensing monitoring the spatiotemporal changes of alpine grassland coverage in the Northern Tibet. Proc. SPIE—Int. Soc. Opt. Eng. 2006, 6298, 2982–2991. [Google Scholar]
  57. Kong, B.; Yu, H.; Du, R.; Wang, Q. Quantitative Estimation of Biomass of Alpine Grasslands Using Hyperspectral Remote Sensing. Rangel. Ecol. Manag. 2019, 72, 336–346. [Google Scholar] [CrossRef]
  58. Li, L.L.; Fan, J.R.; Chen, Y. The relationship analysis of vegetation cover, rainfall and land surface temperature based on remote sensing in Tibet, China. IOP Conf. Ser. Earth Environ. Sci. 2014, 17, 012034. [Google Scholar]
  59. Liang, T.; Feng, Q.; Yu, H.; Huang, X.; Lin, H.; An, S.; Ren, J. Dynamics of natural vegetation on the Tibetan Plateau from past to future using a comprehensive and sequential classification system and remote sensing data. Grassl. Sci. 2012, 58, 208–220. [Google Scholar] [CrossRef]
  60. Sun, J.; Qin, X.J. Precipitation and temperature regulate the seasonal changes of NDVI across the Tibetan Plateau. Environ. Earth Sci. 2016, 75, 291. [Google Scholar] [CrossRef]
  61. Wu, J.B.; Hong, J.T.; Wang, X.D.; Sun, J.; Lu, X.Y.; Fan, J.H.; Cai, Y.J. Biomass partitioning and its relationship with the environmental factors at the alpine steppe in Northern Tibet. PLoS ONE 2013, 8, e81986. [Google Scholar] [CrossRef]
  62. Sun, J.; Cheng, G.; Li, W. Meta-analysis of relationships between environmental factors and aboveground biomass in the alpine grassland on the Tibetan Plateau. Biogeosciences 2013, 10, 1707–1715. [Google Scholar] [CrossRef] [Green Version]
  63. Esmeijer-Liu, A.J.; Aerts, R.; Kürschner, W.M.; Bobbink, R.; Lotter, A.F.; Verhoeven, J.T.A. Nitrogen enrichment lowers Betula pendula green and yellow leaf stoichiometry irrespective of effects of elevated carbon dioxide. Plant Soil 2009, 316, 311–322. [Google Scholar] [CrossRef] [Green Version]
  64. Ni, J.; Zhang, X.S.; Scurlock, J.M.O. Synthesis and analysis of biomass and net primary productivity in Chinese forests. Ann. For. Sci. 2001, 58, 351–384. [Google Scholar] [CrossRef]
  65. Ding, M.J.; Zhang, Y.L.; Sun, X.M.; Liu, L.S.; Wang, Z.F.; Bai, W.Q. Spatiotemporal variation in alpine grassland phenology in the Qinghai-Tibetan Plateau from 1999 to 2009. Chin. Sci. Bull. 2013, 58, 396–405. [Google Scholar] [CrossRef] [Green Version]
  66. Dong, M.Y.; Jiang, Y.; Zheng, C.T.; Zhang, D.Y. Trends in the thermal growing season throughout the Tibetan Plateau during 1960―2009. Agric. For. Meteorol. 2012, 166–167, 201–206. [Google Scholar] [CrossRef]
  67. Cleland, E.E.; Chuine, I.; Menzel, A.; Mooney, H.A.; Schwartz, M.D. Shifting plant phenology in response to global change. Trends Ecol. Evol. 2007, 22, 357–365. [Google Scholar] [CrossRef] [PubMed]
  68. Gian-Reto, W.; Eric, P.; Peter, C.; Annette, M.; Camille, P.; Beebee, T.J.C.; Jean-Marc, F.; Ove, H.G.; Franz, B. Ecological responses to recent climate change. Nature 2002, 416, 389–395. [Google Scholar]
  69. Menzel, A.; Sparks, T.; Estrella, N.; Koch, E.; Aasa, A.; Aha, R.; Alm-Kubler, K.; Bissolli, P.; Braslavska, O.; Briede, A. European phenological response to climate change matches the warming pattern. Glob. Chang. Biol. 2006, 12, 1969–1976. [Google Scholar] [CrossRef]
  70. Garonna, I.; De, J.R.; de Wit, A.J.; Mücher, C.A.; Schmid, B.; Schaepman, M.E. Strong contribution of autumn phenology to changes in satellite-derived growing season length estimates across Europe (1982–2011). Glob. Chang. Biol. 2015, 20, 3457–3470. [Google Scholar] [CrossRef]
  71. Gonsamo, A. Circumpolar vegetation dynamics product for global change study. Remote Sens. Environ. 2016, 182, 13–26. [Google Scholar] [CrossRef] [Green Version]
  72. Gonsamo, A.; Chen, J.M.; Ooi, Y.W. Peak season plant activity shift towards spring is reflected by increasing carbon uptake by extra-tropical ecosystems. Glob. Chang. Biol. 2017, 24, 2117–2128. [Google Scholar] [CrossRef] [PubMed]
  73. Forkel, M.; Carvalhais, N.; Rödenbeck, C.; Keeling, R.; Heimann, M.; Thonicke, K.; Zaehle, S.; Reichstein, M. Enhanced seasonal CO2 exchange caused by amplified plant productivity in northern ecosystems. Science 2016, 351, 696. [Google Scholar] [CrossRef] [PubMed] [Green Version]
  74. Gonsamo, A.; D’Odorico, P.; Chen, J.M.; Wu, C.; Buchmann, N. Changes in vegetation phenology are not reflected in atmospheric CO2 and 13C/12C seasonality. Glob. Chang. Biol. 2017, 23, 4029–4044. [Google Scholar] [CrossRef]
  75. Graven, H.D.; Keeling, R.F.; Piper, S.C.; Patra, P.K.; Stephens, B.B.; Wofsy, S.C.; Welp, L.R.; Sweeney, C.; Tans, P.P.; Kelley, J.J. Enhanced seasonal exchange of CO2 by northern ecosystems since 1960. Science 2013, 341, 1085–1089. [Google Scholar] [CrossRef] [PubMed] [Green Version]
  76. Keeling, C.D. Atmospheric CO2 and 13CO2 Exchange with the Terrestrial Biosphere and Oceans from 1978 to 2000: Observations and Carbon Cycle Implications. In A History of Atmospheric CO2 and Its Effects on Plants, Animals, and Ecosystems; Springer: New York, NY, USA, 2005; Volume 177, pp. 83–113. [Google Scholar]
  77. Keenan, T.F.; Gray, J.; Friedl, M.A.; Toomey, M.; Bohrer, G.; Hollinger, D.Y.; Munger, J.W.; O’Keefe, J.; Schmid, H.P.; Wing, I.S.; et al. Net carbon uptake has increased through warming-induced changes in temperate forest phenology. Nat. Clim. Chang. 2014, 4, 598–604. [Google Scholar] [CrossRef]
  78. Myneni, R.B.; Keeling, C.; Tucker, C.J.; Asrar, G.; Nemani, R.R. Increased plant growth in the northern high latitudes from 1981 to 1991. Nature 1997, 386, 698–702. [Google Scholar] [CrossRef]
  79. Zhuang, Y.L.; Zhao, W. Study on the Ecological Effects of Condensed Water on an Annual Plant in a Temperate Desert. Arid Zone Res. 2009, 26, 526–532. [Google Scholar] [CrossRef]
  80. Fang, J. An Overview on Eco-hydrological Effects of Condensation Water. J. Desert Res. 2013, 3, 275–281. [Google Scholar]
  81. Suseela, V.; Conant, R.T.; Wallenstein, M.D.; Dukes, J.S. Effects of soil moisture on the temperature sensitivity of heterotrophic respiration vary seasonally in an old-field climate change experiment. Glob. Chang. Biol. 2015, 18, 336–348. [Google Scholar] [CrossRef]
  82. Zhang, G.; Xu, X.L.; Zhou, C.; Zhang, H. Responses of grassland vegetation to climatic variations on different temporal scales in Hulun Buir Grassland in the past 30 years. J. Geogr. Sci. 2011, 21, 634–650. [Google Scholar] [CrossRef]
  83. Xu, Z.X.; Gong, T.L.; Li, J.Y. Decadal trend of climate in the Tibetan Plateau—Regional temperature and precipitation. Hydrol. Process. 2008, 22, 3056–3065. [Google Scholar] [CrossRef]
  84. Ye, J.S.; Reynolds, J.F.; Sun, G.J.; Li, F.M. Impacts of increased variability in precipitation and air temperature on net primary productivity of the Tibetan Plateau: A modeling analysis. Clim. Change 2013, 119, 321–332. [Google Scholar] [CrossRef]
  85. Zhang, X.; Duan, K.Q.; Shi, P.H.; Yang, J.H. Effect of lake surface temperature on the summer precipitation over the Tibetan Plateau. J. Mt. Sci. 2016, 13, 802–810. [Google Scholar] [CrossRef]
  86. Irvine, P.J.; Sriver, R.L.; Keller, K. Tension between reducing sea-level rise and global warming through solar-radiation management. Nat. Clim. Change 2012, 2, 97–100. [Google Scholar] [CrossRef]
  87. Ruosteenoja, K.; Räisänen, P. Seasonal Changes in Solar Radiation and Relative Humidity in Europe in Response to Global Warming. J. Clim. 2013, 26, 2467–2481. [Google Scholar] [CrossRef]
  88. Trenberth, K.E.; Fasullo, J.T. Global warming due to increasing absorbed solar radiation. Geophys. Res. Lett. 2009, 36, 157–163. [Google Scholar] [CrossRef] [Green Version]
  89. Dergachev, V.A.; Vasiliev, S.S.; Raspopov, O.M.; Jungner, H. Impact of the geomagnetic field and solar radiation on climate change. Geomagn. Aeron. 2012, 52, 959–976. [Google Scholar] [CrossRef]
Figure 1. Study area; the depth of color represents the elevation in the DEM.
Atmosphere 13 01112 g001
Figure 2. Comparison of the differences in seasonal VSP (A) and seasonal VST (B) during 1982–2013. The different letters above the error bar indicate significant differences between seasons.
Atmosphere 13 01112 g002
Figure 3. Temporal variability of VSP and VST by annual mean (A,B) and seasons (C,D). The gray, red, blue, and green points and lines represent spring, summer, autumn, and winter, respectively. The gray shaded portion of the fitting line represents the 95% confidence interval.
Atmosphere 13 01112 g003
Figure 4. Variations in VSP (A) and VST (B). The gray, red, blue, and green points represent spring, summer, autumn, and winter, respectively.
Atmosphere 13 01112 g004
Figure 5. Relationships of MAP, MAT, and years during 1982−2013. The gray, green, and black solid lines represent the fitting lines of MAP and Year, MAT and Year, and MAP and MAT, respectively. *** represents the significance at the 0.001 level; ** represents the significance at the 0.01 level.
Atmosphere 13 01112 g005
Figure 6. SEM was used to analyze the direct and indirect effects among variables in the Tibetan Plateau. The standardized total coefficients are listed on each path. The thickness of the solid arrows reflects the magnitude of the standardized SEM coefficients, the black solid line represents the positive effect, and the red solid line represents the negative effect. MAP and MAT represent the mean annual precipitation and mean annual temperature, respectively; PSp, PSu, PAu, and PWi represent vegetation sensitivity to precipitation in spring, summer, autumn, and winter, respectively; and TSp, TSu, TAu, and TWi represent vegetation sensitivity to temperature in spring, summer, autumn, and winter, respectively.
Atmosphere 13 01112 g006
Table 1. Summary information of VSP and VST during 1982-2013 by annual mean, spring, summer, autumn, and winter.
YearVSPVST
YearSpringSummerAutumnWinterYearSpringSummerAutumnWinter
19820.650.050.610.680.640.220.330.150.030.29
19830.670.100.660.680.340.260.330.210.040.39
19840.660.160.630.590.480.280.400.150.040.40
19850.650.160.650.580.180.220.330.160.030.25
19860.650.100.580.610.340.280.370.230.030.38
19870.660.220.630.490.190.270.370.230.030.37
19880.630.110.620.570.330.280.410.160.020.42
19890.690.140.600.610.520.260.380.190.040.33
19900.650.150.690.500.640.210.340.080.020.37
19910.630.150.580.510.520.260.390.160.030.38
19920.700.130.720.630.490.250.330.180.040.33
19930.700.110.770.600.540.200.280.120.020.31
19940.710.170.750.680.550.250.360.160.030.36
19950.740.190.610.700.530.290.410.170.030.40
19960.660.190.650.540.490.230.330.140.030.34
19970.670.190.650.600.230.220.330.120.020.35
19980.730.150.770.570.490.240.360.130.020.34
19990.680.300.680.510.400.220.360.160.010.29
20000.630.170.600.540.590.210.350.080.020.33
20010.630.220.550.550.640.230.350.090.020.36
20020.580.190.670.370.520.240.390.130.040.31
20030.700.110.680.590.540.270.380.180.030.39
20040.730.190.750.650.650.210.330.110.030.33
20050.730.180.710.560.600.270.380.160.050.37
20060.730.220.710.610.600.240.360.130.050.30
20070.700.220.690.490.610.220.330.100.030.36
20080.690.240.580.550.600.260.390.130.060.31
20090.680.210.640.600.390.250.350.160.050.34
20100.510.120.370.460.530.210.320.140.030.27
20110.660.160.610.570.620.220.360.120.020.32
20120.730.230.670.640.640.250.380.160.030.34
20130.720.280.680.610.610.230.400.120.030.29
Note: VSP and VST represent the vegetation sensitivity to precipitation and the vegetation sensitivity to temperature, respectively.
Table 2. Summary of the direct, indirect, and total effects of the variables (GW, MAP, MAT, PSp, PSu, PAu, PWi, TSp, TSu, TAu, and TWi) in the SEM of the Tibetan Plateau. The effects were calculated with standardized path coefficients.
precipitationVariableDirect
Effect
Indirect
Effect
Total
Effect
temperatureVariableDirect
Effect
Indirect
Effect
Total Effect
PSpTSp
MAT0.0000.4290.429MAT0.0000.0620.062
MAP0.0000.1080.108MAP0.0000.0160.016
CC0.5540.0000.554 ***CC0.0800.0000.080
PSuTSu
MAT0.000−0.027−0.027MAT0.000−0.331−0.331
MAP0.000−0.007−0.007MAP0.000−0.084−0.084
CC−0.0340.000−0.034CC−0.4280.000−0.428 **
PAuTAu
MAT0.000−0.159−0.159MAT0.0000.1100.110
MAP0.000−0.040−0.040MAP0.0000.0280.028
CC−0.2050.000−0.205CC0.1420.0000.142
PWiTWi
MAT0.0000.3700.370MAT0.000−0.231−0.231
MAP0.0000.0940.094MAP0.000−0.058−0.058
CC0.4780.0000.478 **CC−0.2980.000−0.298
Note: CC, MAP, and MAT represent climate change, mean annual precipitation, and mean annual temperature, respectively; PSp, PSu, PAu, and PWi represent vegetation sensitivity to precipitation in spring, summer, autumn, and winter, respectively; TSp, TSu, TAu, and TWi represent vegetation sensitivity to temperature in spring, summer, autumn, and winter, respectively. *** correlation is significant at the 0.001 level; ** correlation is significant at the 0.01 level.
Publisher’s Note: MDPI stays neutral with regard to jurisdictional claims in published maps and institutional affiliations.

