Abstract
In this paper, a novel typhoon intensity classification and estimation network (TICAENet) is constructed to recognize typhoon intensity. The TICAENet model is based on the LeNet-5 model, which uses weight sharing to reduce the number of training parameters, and the VGG16 model, which replaces a large convolution kernel with multiple small kernels to improve feature extraction. Satellite cloud images of typhoons over the Northwest Pacific Ocean and the South China Sea from 1995–2020 are taken as samples. The results show that the classification accuracy of this model is 10.57% higher than that of the LeNet-5 model; the classification accuracy of the TICAENet model is 97.12%, with a classification precision of 97.00% for tropical storms, severe tropical storms and super typhoons. The mean absolute error (MAE) and root mean square error (RMSE) of the samples estimation in 2019 are 4.78 m/s and 6.11 m/s, and the estimation accuracy are 18.98% and 20.65% higher than that of the statistical method, respectively. Additionally, the model takes less memory and runs faster due to the weight sharing and multiple small kernels. The results show that the proposed model performs better than other methods. In general, the proposed model can be used to accurately classify typhoon intensity and estimate the maximum wind speed by extracting features from geostationary meteorological satellite images.
1. Introduction
Typhoons are one of the most destructive natural disasters in coastal areas of China and have a great impact on economic development, navigation safety, infrastructure construction and people’s lives and properties in coastal areas. Tropical cyclones and the heavy rains that accompany them are among the deadliest and most destructive disasters on Earth, especially in coastal areas [1,2]. More than seven typhoons strike the southeast coast of China each year according to the China Meteorological Administration (CMA). Among them, typhoons Nina and LeKima caused extensive economic loss and affected millions of people [3,4,5]. It is of great significance to classify and estimate typhoon intensity accurately to ensure the safety of both people and property. According to geostationary satellite imagery analysis, different typhoon levels have different cloud features, which can be used to help recognize typhoon intensity [6]. For research on typhoon intensity recognition, there are subjective empirical methods and numerical simulation methods. Subjective experience methods are affected by the nature of the typhoon. Numerical models are more efficient and systematic than subjective empirical methods in terms of calculations, and numerical models account for the influence of typhoon parameters on identification. However, numerical models are limited in predicting some extreme events due to the data collection and processing times [6,7]. Therefore, there is a critical need to establish a high-precision typhoon intensity recognition model to study typhoons.
Recently, as a result of continuous breakthroughs in image processing and deep learning applications, many scholars have introduced recognition systems and deep learning models into different disciplines. For example, Duan et al. [8] compared four ML methods, i.e., random forest (RF), support vector machine (SVM), convolutional neural network (CNN) and residual neural network (ResNN) in classifying the signals obtained from the recorded seismic dataset. Liu et al. [9] developed a software system for big data management, which fulfills the tasks of collecting, transmitting, classifying, screening, managing and analyzing, based on more than 80,000 sets of standard geo-material physico -mechanical data. Some progress has also been made in identifying satellite cloud images using different cloud cluster features [10,11]. Zhou et al. [12] accurately identified the eye and cloud wall of typhoons and used the GC-LSTM model to accurately recognize and predict typhoon intensity. Zhao et al. [13] proposed a real-time typhoon eye detection method based on deep learning with satellite cloud images, which provided important data for detecting real typhoon information. Wang et al. [14] designed several models with different inputs and parameters and found that their CNN models were robust when estimating the TC intensity from geostationary satellite images. Zhang et al. [15] proposed a novel tropical cyclone intensity classification and estimation model using infrared geostationary satellite images from the Northwest Pacific Ocean basin and a cascading deep convolutional neural network. Rüttgers et al. [16] used past satellite images to generate one-step images. Nevertheless, there are existing issues in terms of low feature extraction of tropical depressions, tropical storms or severe tropical storms and poor recognition accuracy that need to be addressed [12,15,17].
In terms of visual computing, the core challenges include the acquisition, processing, analysis and rendering of visual information (mainly images and video) [18]. Shallow neural networks have problems such as poor feature extraction and classification ability, while deep neural networks have problems such as difficult development and long training times [19,20]. Shallow neural network can meet some current requirements, but it may not be effective in identifying satellite cloud images. Given enough time, deep neural networks may have better results, but waste computational resources. The most straightforward way to improve network performance is to increase the network depth, which increases the number of parameters and the difficulty in developing the network. In addition, the network becomes more prone to overfitting, and the demand for computing resources increases significantly. Recently, much research has been carried out to improve algorithms. Simonyan et al. [21] found that by using a 3 × 3 convolution kernel and increasing the network depth to 16–19 weight layers, they could achieve a significant improvement over existing network framework. He et al. [22] proposed a simpler and more accurate residual learning framework to address the problem of gradient disappearance caused by deep networks. Tan et al. [23] proposed a new mixed depthwise convolution (MixConv) model that naturally combines multiple kernel sizes into a single convolution and improves the accuracy and efficiency of existing Mobile Nets for both ImageNet classification and COCO object detection. Szegedy et al. [24] found that by using smaller filters to extract local features, such as replacing a 5 × 5 convolution kernel with the superposition of two 3 × 3 convolution kernels, the computational efficiency could be improved. However, few studies have determined how many small convolution kernels are necessary to replace large kernels to improve the computational efficiency and recognition accuracy.
Here, we focus on solving two problems, the poor feature extraction of satellite cloud images and the elaboration of a novel model to improve algorithms. The model was trained and validated using 25 years of typhoon sample images. The results indicated that the model can be used to extract relatively complex information from satellite cloud images and accurately identify and estimate typhoon intensity, especially for tropical depressions, tropical storms and severe tropical storms.
The remainder of this paper is organized as follows. In Section 2, we briefly describe the data sources and preprocessing, and introduce the method. In Section 3, first, we choose the optimal convolutional kernel by comparing various convolutional kernel performances according to LeNet-5 model characteristics. Next, we build a new framework based on the advantages of the VGG16 model and elaborate a series of models based on the new framework. Then, we compare various model performances and present typhoon intensity classification and estimation effects. Finally, the conclusions are presented in Section 4.
2. Data and Methods
2.1. Data
In the experiment, satellite images of typhoons in the Northwest Pacific Ocean and the South China Sea from 1995–2020 were examined. The cloud images were provided by Kochi University (http://weather.is.kochi-u.ac.jp/, accessed on 1 November 2021) and received from the Japan Meteorological Business Support Center (JMBSC). The best tropical cyclone track data for the experiment were from the China Meteorological Administration (CMA), which was used to locate the typhoon and cut the satellite cloud images at the corresponding time (https://tcdata.typhoon.org.cn/zjljsjj_zlhq.html, accessed on 1 November 2021). The wind-speed label of the satellite cloud image at each moment is the typhoon wind speed from CMA. Satellite cloud images are of the Earth’s cloud cover and landmark features as seen from top to bottom by meteorological satellites. One of the satellites was Himawari8, which has a visual light field of view of 0.5–1 m, a time resolution of 10 min and a spatial resolution of 500 m. The Himawari8 satellite doubles the imaging resolution and shortens the time required for global observations, which allows for capturing real-time images and accurately identifying typhoon intensity [25,26].
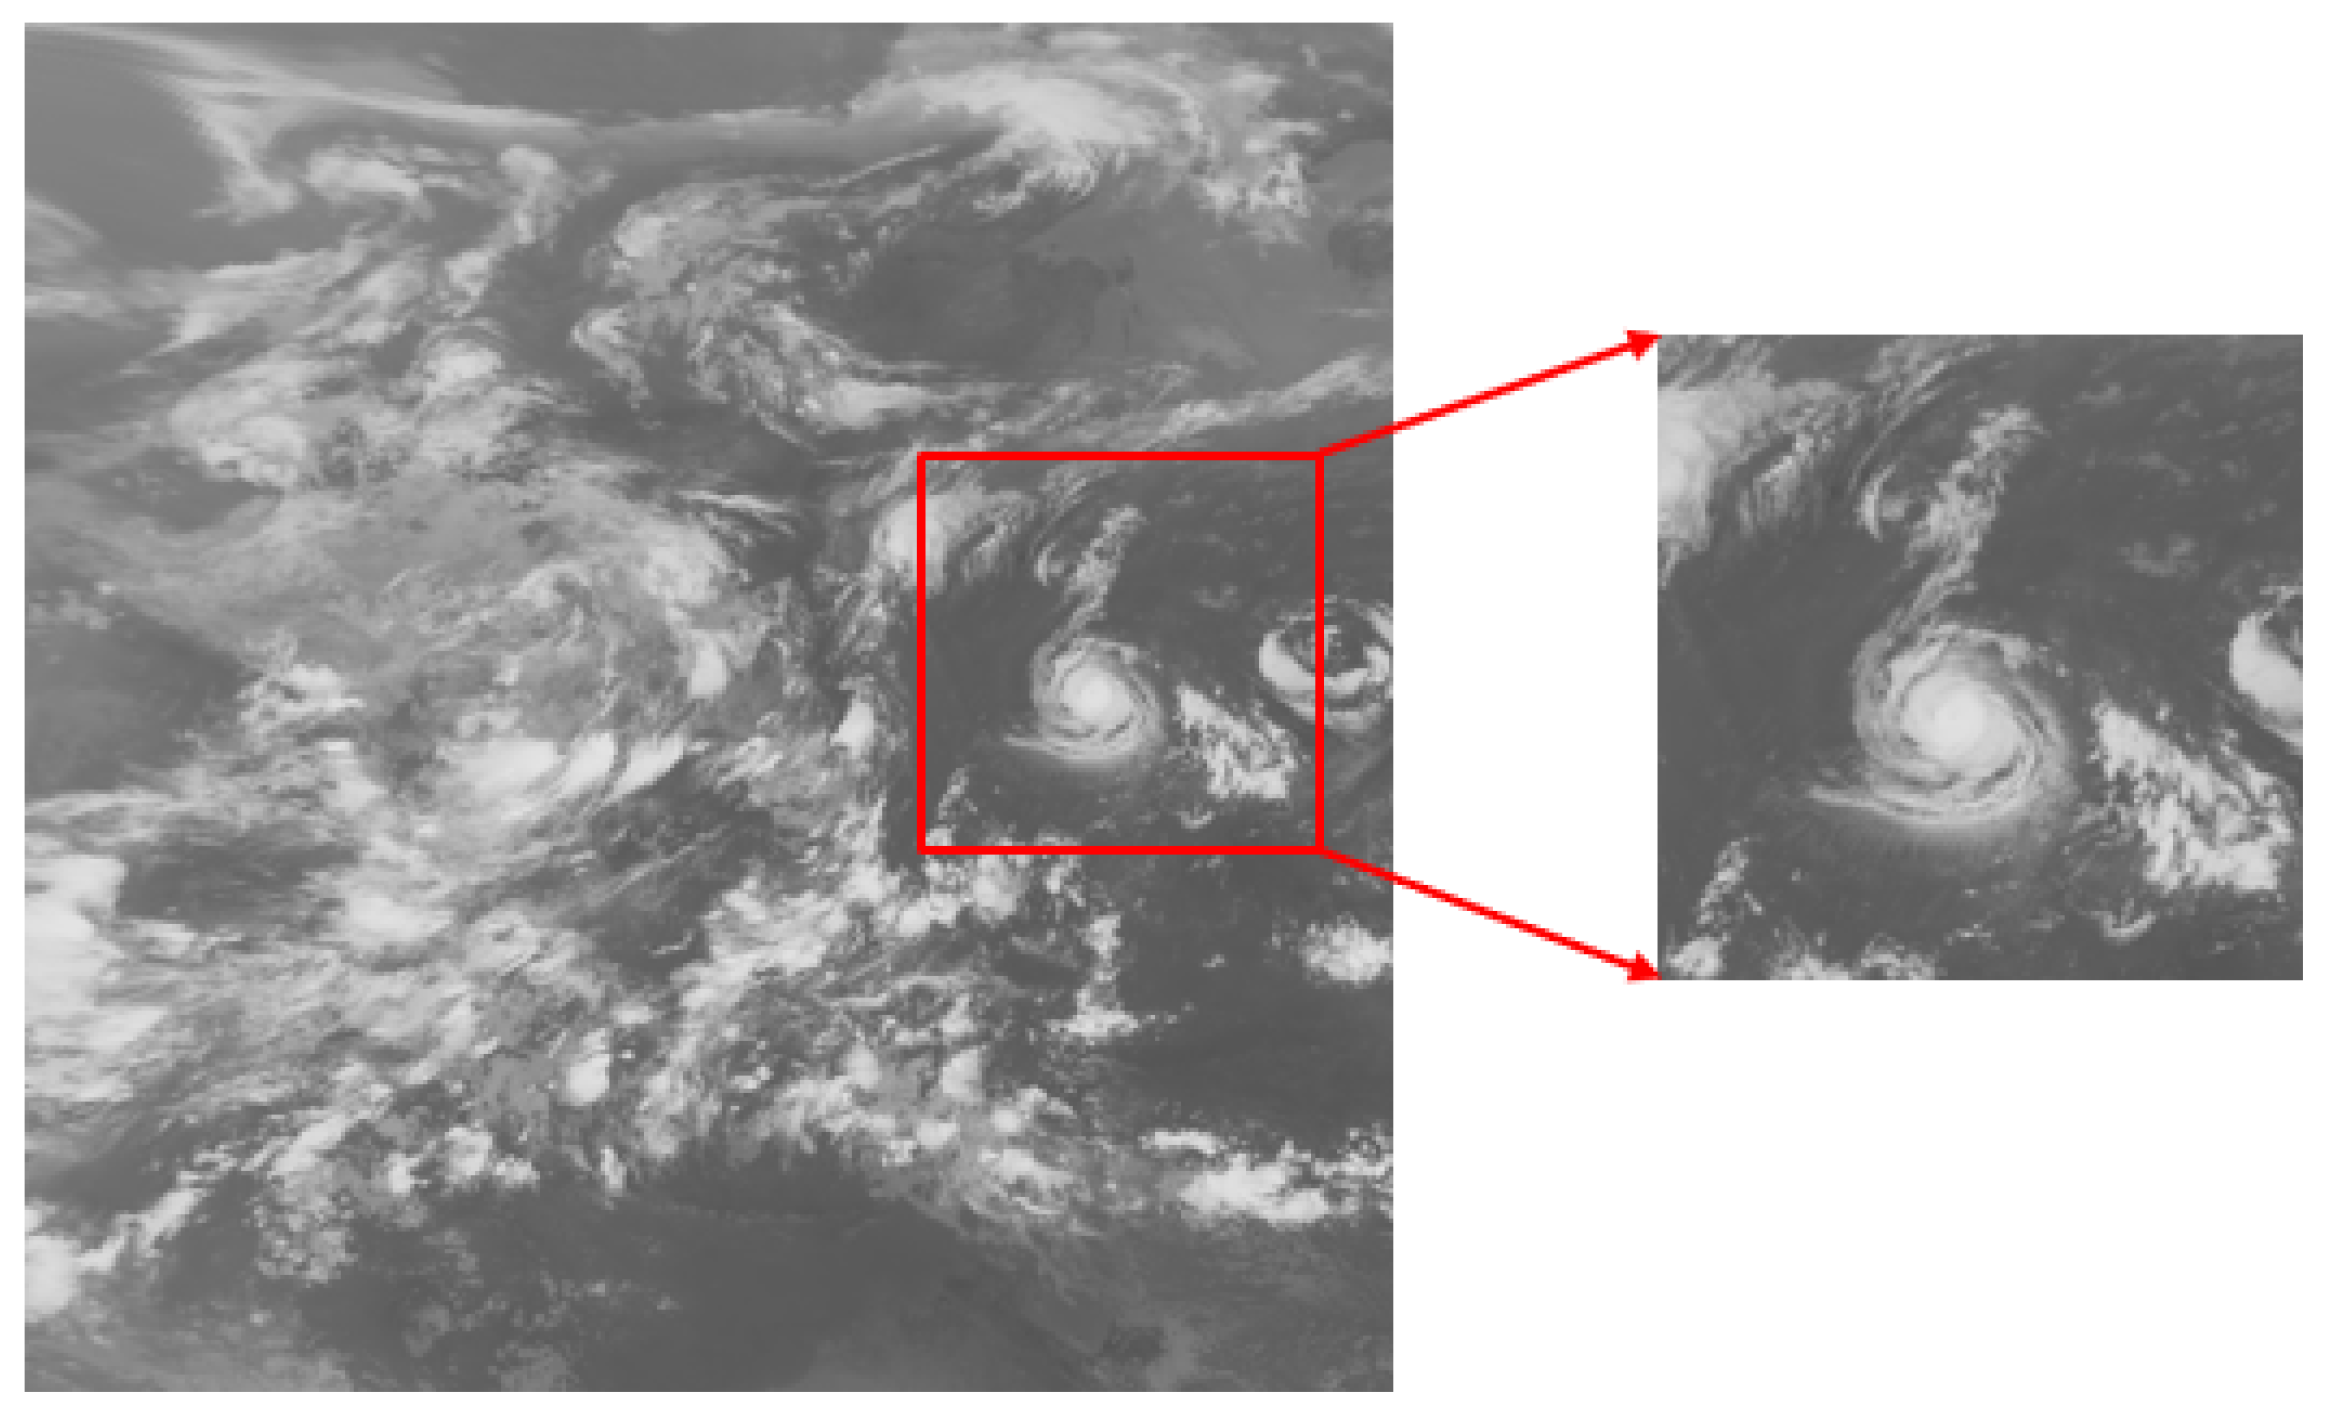
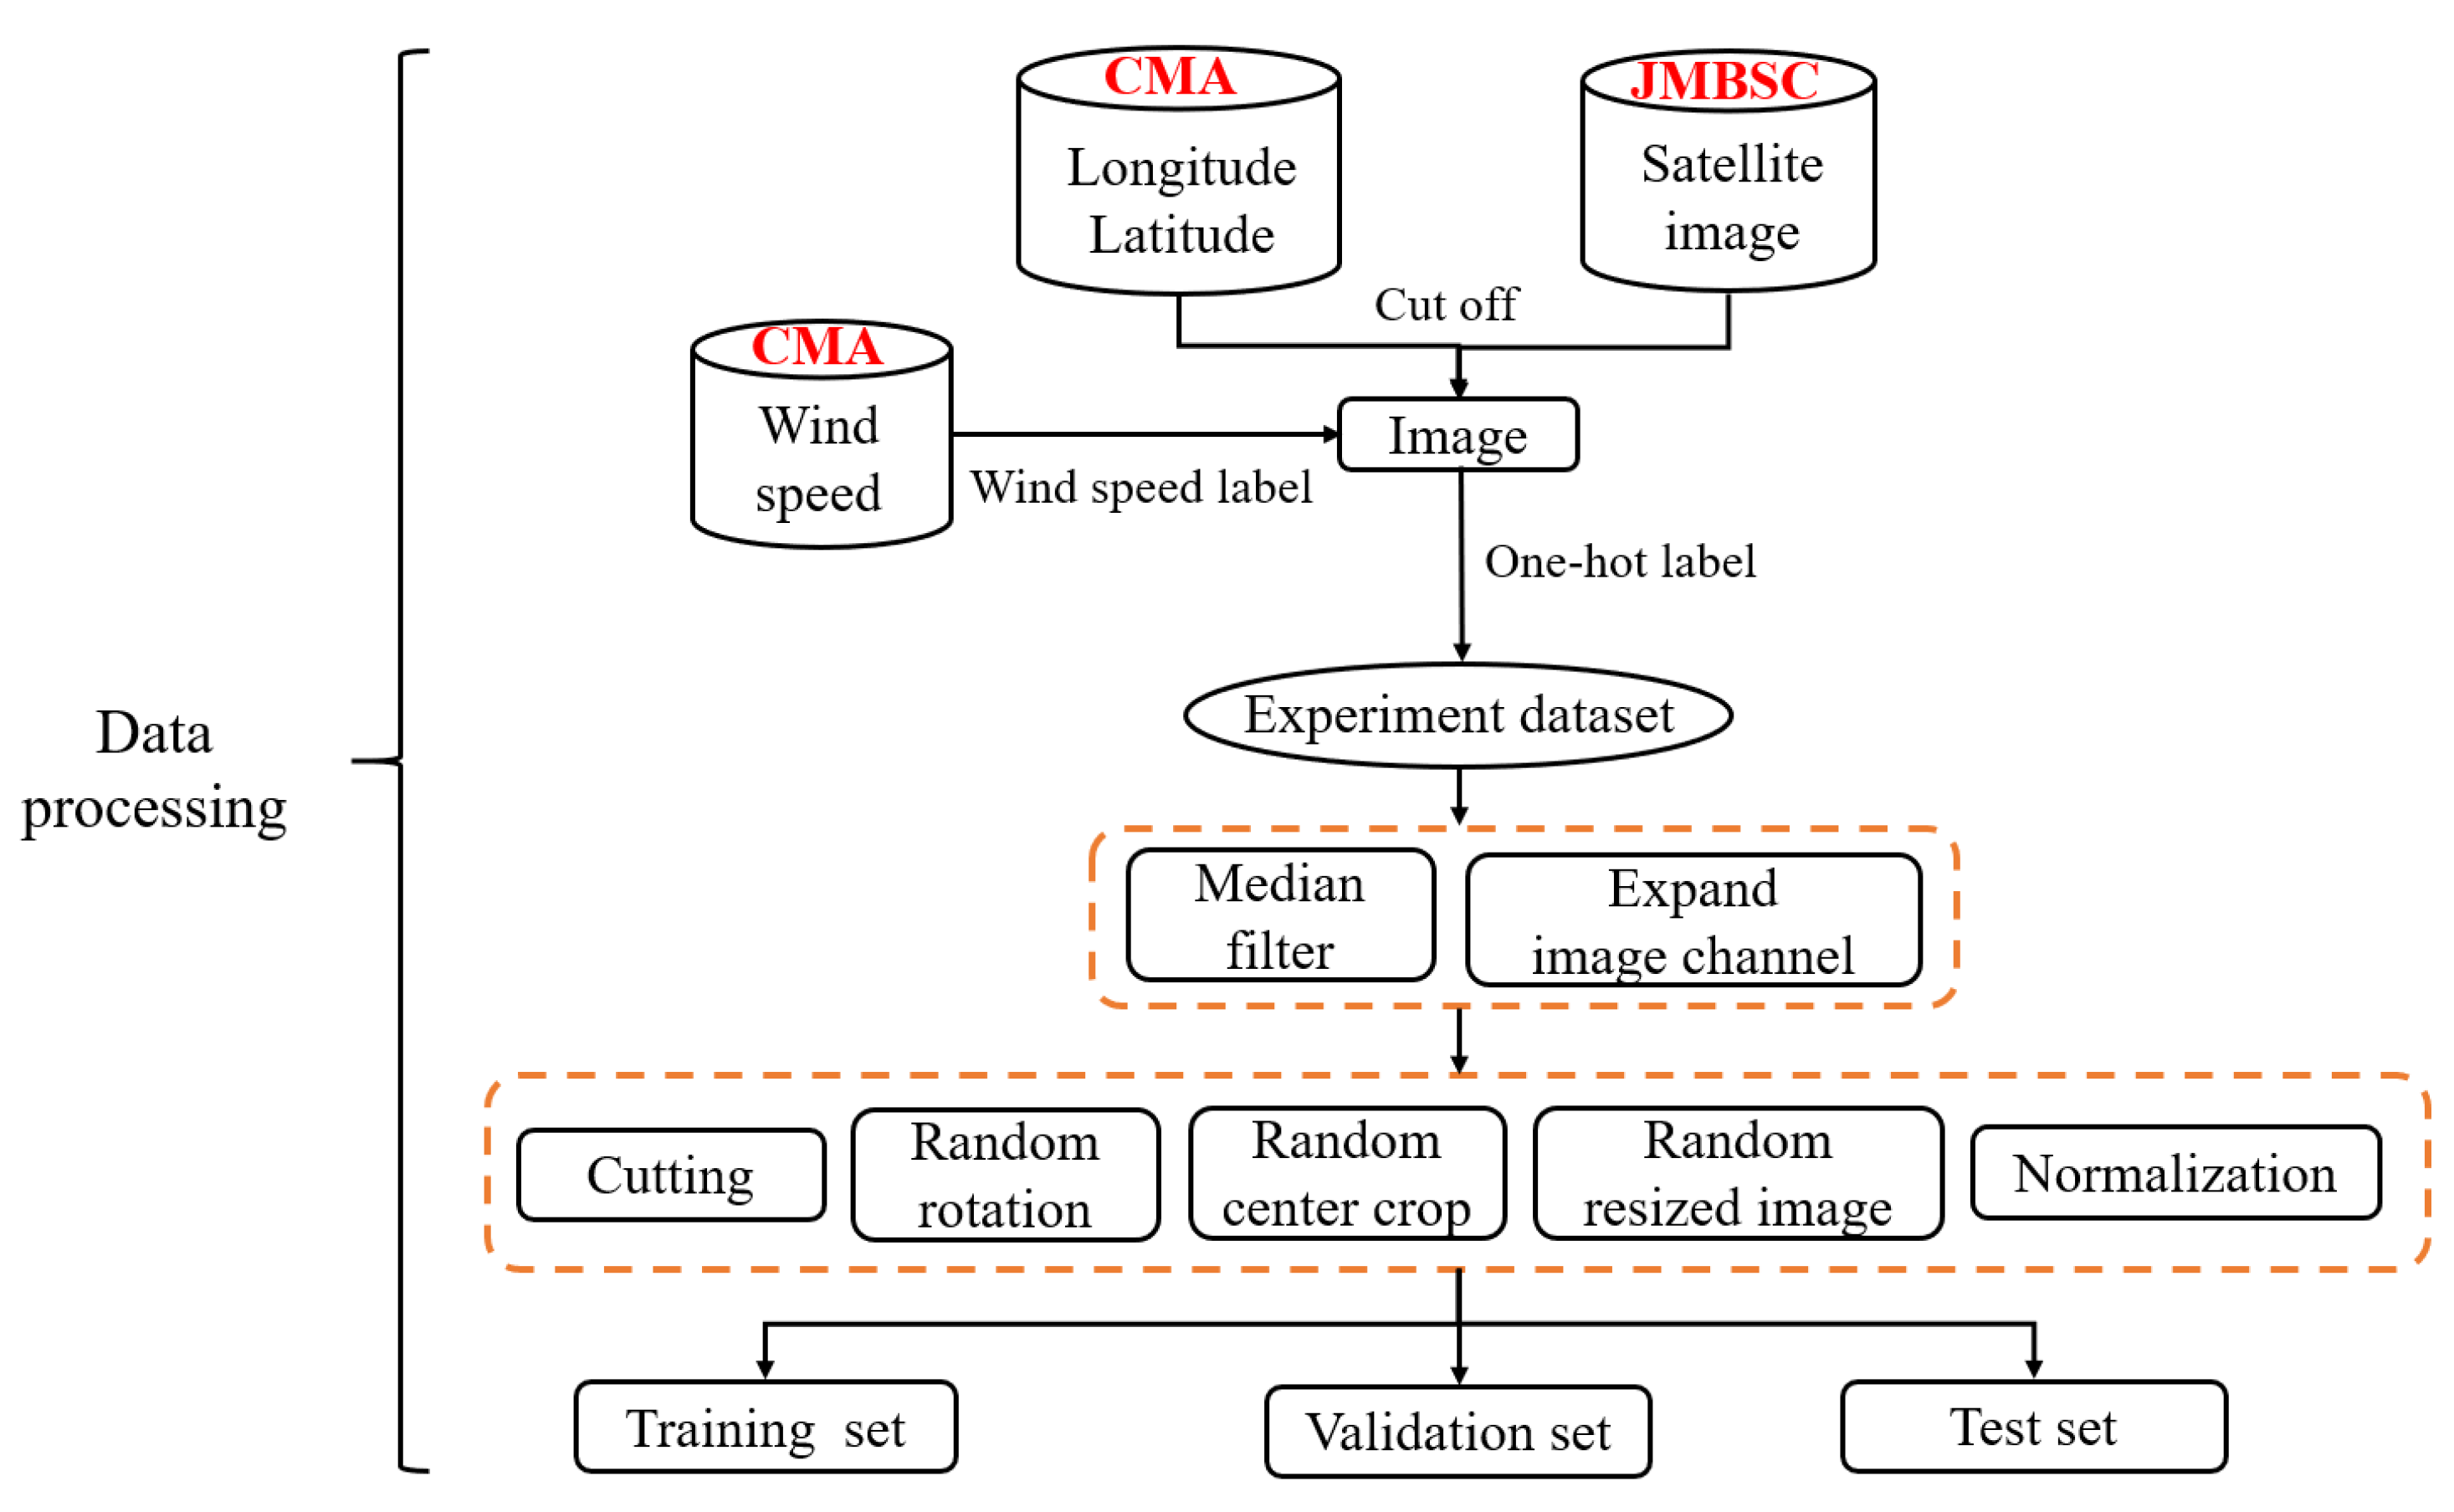
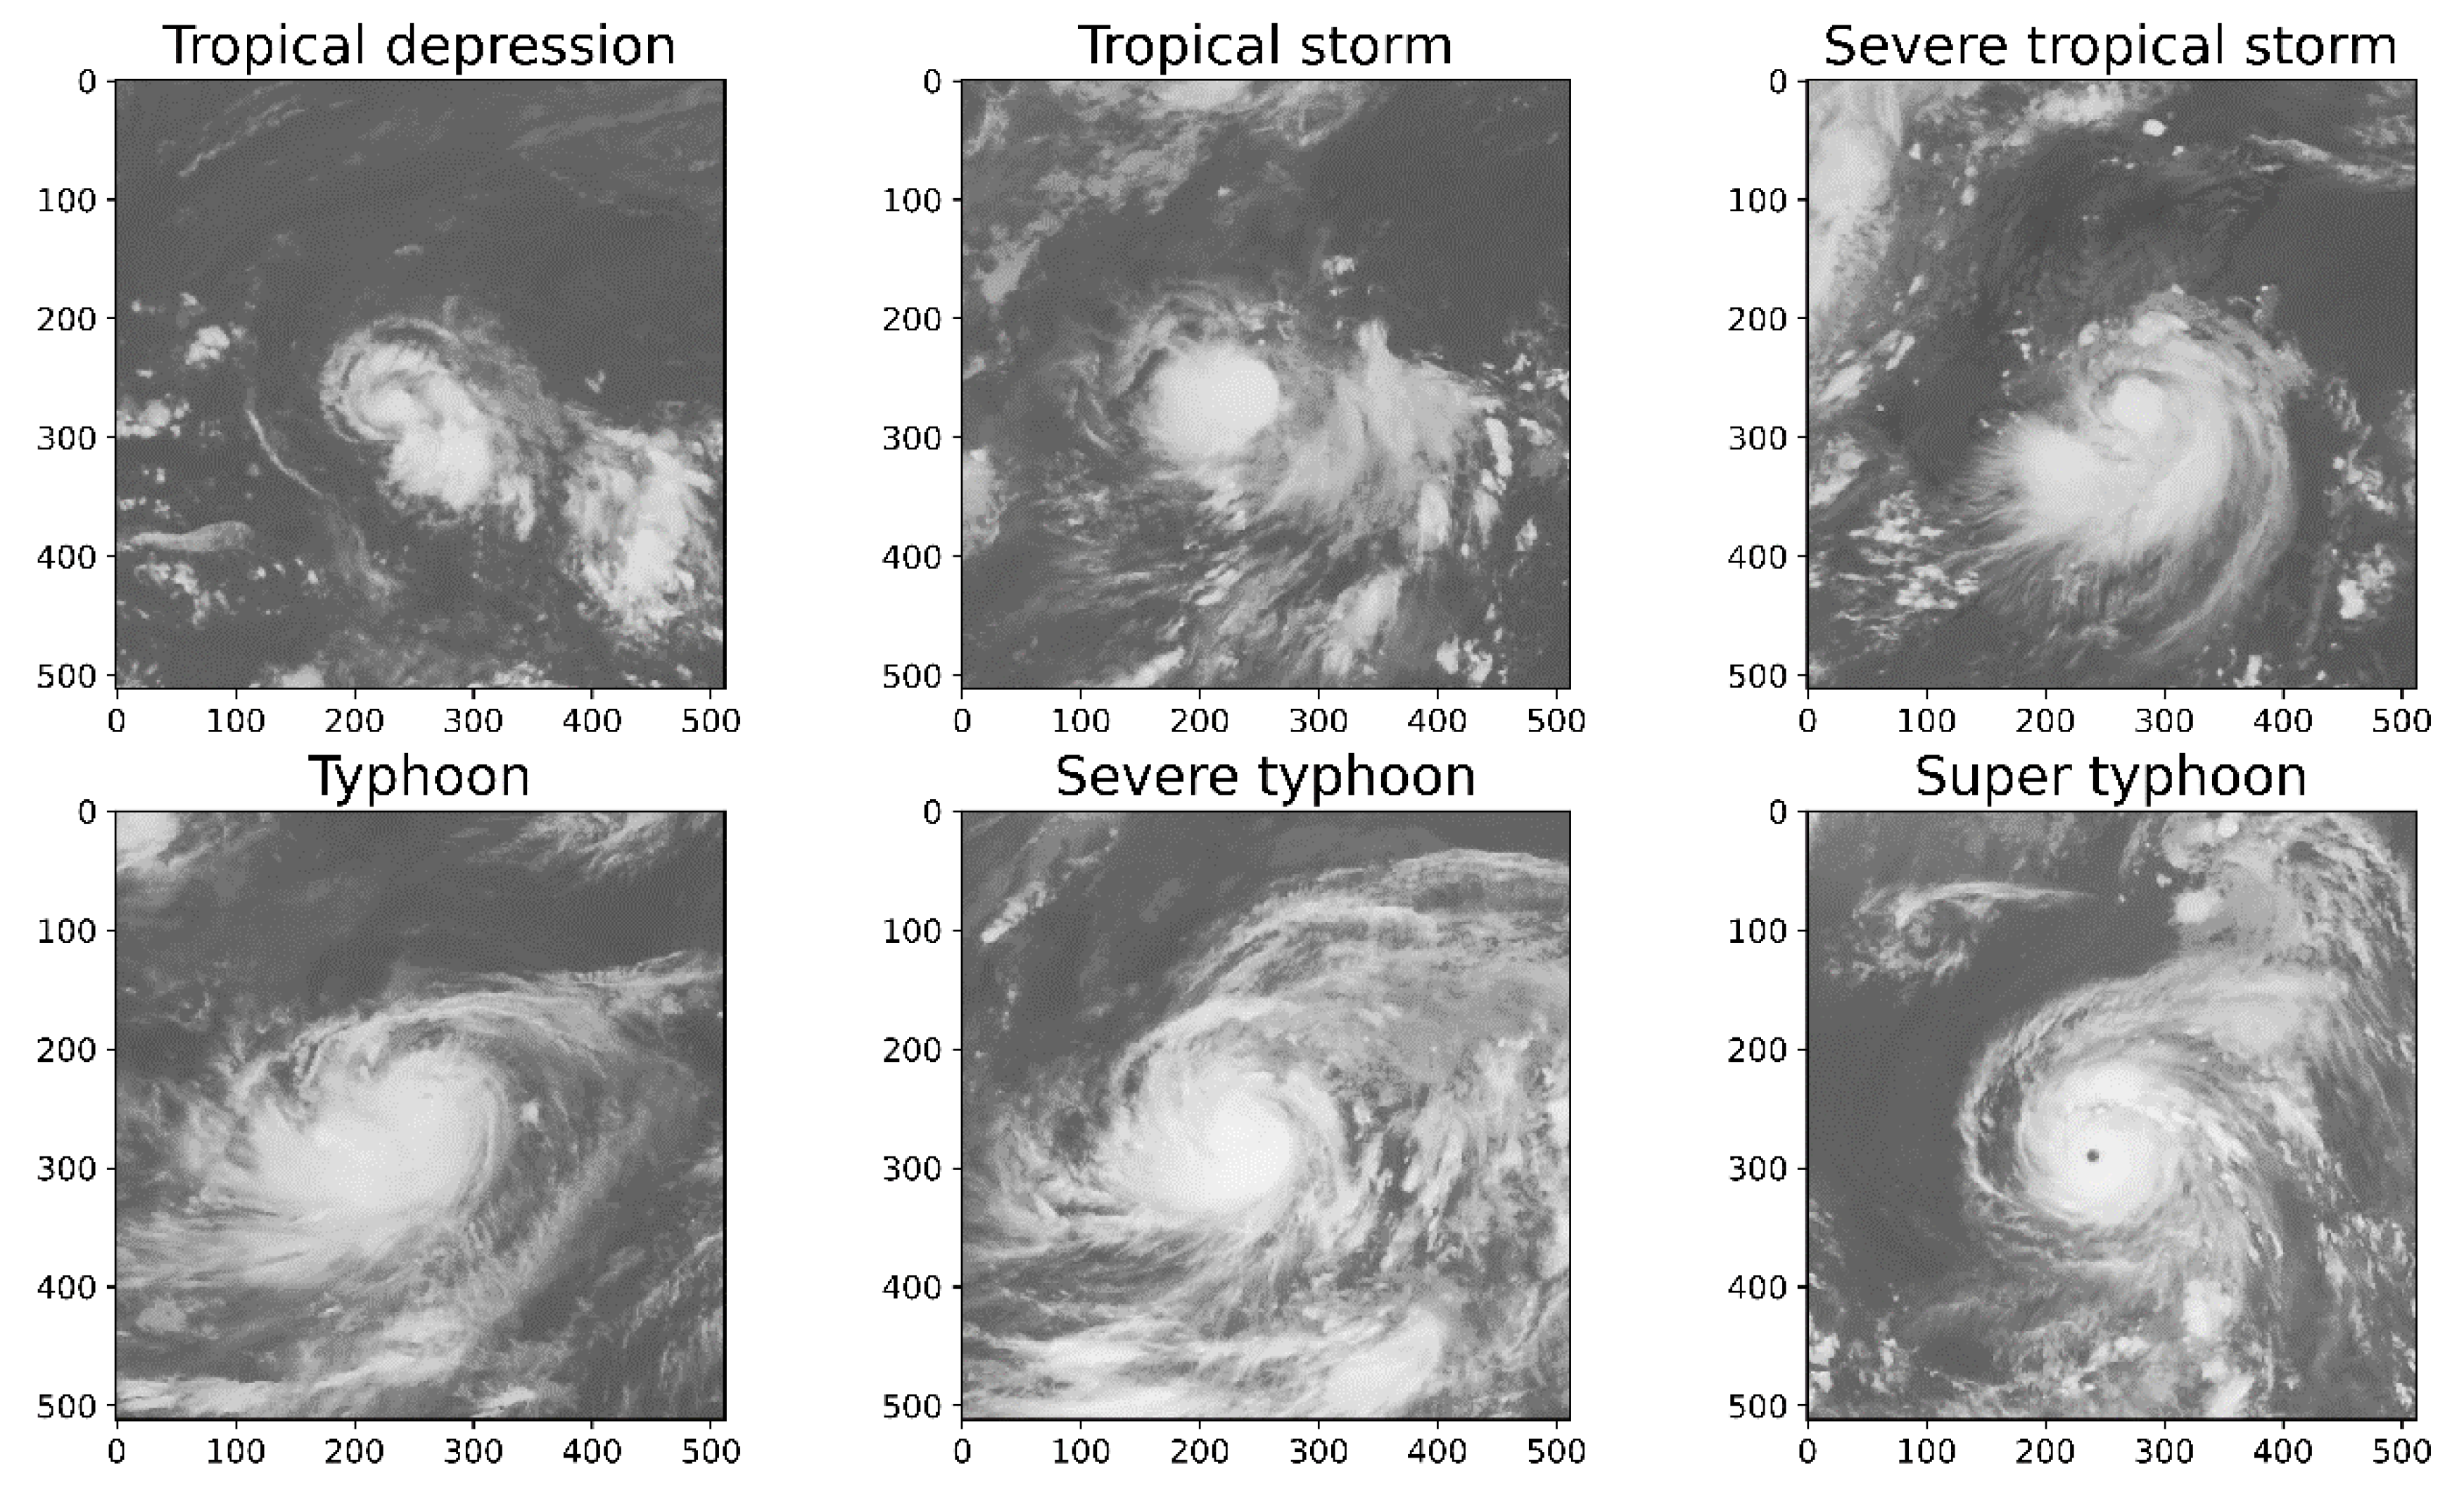
Satellite cloud image processing: First, a pixel size of 512 × 512 was selected for the input information based on the longitude and latitude of the typhoon, as shown in Figure 1. The typhoon wind-speed data from CMA are used as the images’ wind speed label. Next, the median filter was used to remove noise from the infrared image while effectively retaining the edge information. Afterward, the satellite cloud images were enhanced to obtain more reliable experimental data. The images are single channel images that have been expanded to three channels to facilitate the subsequent model verification. Then, the number of images was increased through data expansion methods such as cutting, random rotation and offset. All images were normalized to speed the convergence of the neural network training. Finally, a total of 13,200 cloud images were randomly divided into a training set with 7920 images, a validation set with 2640 images and a test set of 2640 images. There was no overlap between the satellite cloud images of the test set and the verification set. The detailed dataset processing is shown in Figure 2. The dataset was coded with one-hot, and the real label of each sample was also a one-hot label. The typhoon intensity classification standards are based on the National Standard of Tropical Cyclone Classification (GB/T 19201-2006), and one-hot labels are shown in Table 1. Each category of satellite cloud images is shown in Figure 3.

Figure 1.
The original satellite cloud image and cut-out image of the strong typhoon Jelawat from JMBSC.
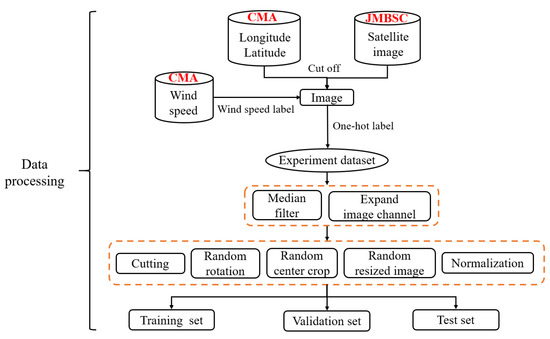
Figure 2.
Details of dataset processing.

Table 1.
Typhoon intensity standard level and one-hot label.
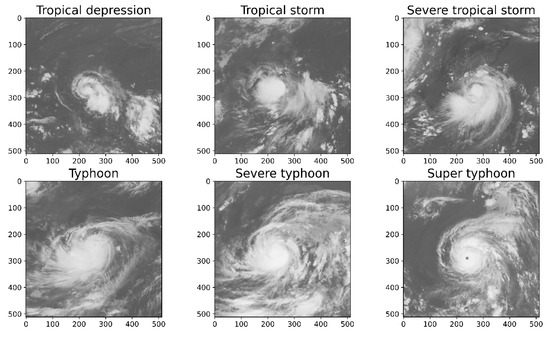
Figure 3.
Meteorological satellite cloud image samples after cutting based on the typhoon location for six TC categories.
This experimental model was based on MobaXterm, and the processor was the computing node of PARATERA HPC CLOUD. The hardware configuration was a 2-channel 16 core, E5-2680V3@ 2.5 GHz, 64 GB memory, using the open-source Keras deep learning framework.
2.2. Methods
2.2.1. Construction of the Models
The detailed experimental steps are as follows. First, the network topology architecture of the LeNet-5 model was used in the framework with five convolution layers, five pooling layers and three fully connected layers. When using the LeNet-5 model, image matching is incorporated into the network topology architecture and shared weight is used to reduce the number of training parameters, resulting in a simpler and more adaptable network structure. This model can be used to obtain an effective representation of the original image, allowing the identification of the visual rules directly from the original pixels without too much preprocessing. If a larger convolution kernel is used, more information may be lost, and typhoon intensity cannot be accurately identified. We used 2 × 2, 3 × 3, 5 × 5 and 7 × 7 convolution kernels to determine the optimal kernel size based on this framework. These models are named Ty2-CNN Ty3-CNN, Ty5-CNN, and Ty7-CNN. See Appendix A for a detailed introduction of the LeNet-5 model.
Then, based on the advantages of the VGG16 model, we built a new framework combining two-layer convolution and one-layer pooling with one-layer convolution and one-layer pooling. See Appendix B for a detailed introduction of the VGG16 model. The VGG16 model uses multiple smaller convolution kernels (3 × 3) to replace the larger convolution kernel on a layer to reduce the number of parameters, perform nonlinear mapping, and increase the fitting and expression ability of the network. The size of the receptive field obtained by two 3 × 3 convolution kernel stacks is equivalent to that of a 5 × 5 convolution kernel [21]. In line with the discovery that using smaller filters to extract local features can improve the computational efficiency, a series of hybrid convolution models, typhoon intensity classification networks (TICAENets), were developed to determine the best combination and achieve better recognition performance.
2.2.2. Model Parameters
Stochastic gradient descent (SGD) optimizer:
where is the parameter to be updated, is the gradient update direction, is the position of the step , is the step length, is the stochastic gradient, and .
Cross-entropy loss function, which is also known as the log loss:
where is the output of the previous layer, and is the prediction output of the model in the cross-entropy loss function.
The predicted output represents the probability that the current sample label is 1 and is defined as follows in Equation (4):
The probability of the current sample tag being 0 is defined using Equation (5):
Equations (4) and (5) were substituted into Equation (6).
The loss function for a single sample is defined as Equation (9):
If the loss function of N samples is calculated and N losses are superimposed, the cross-entropy loss function of N samples can be defined by Equation (10):
2.2.3. Model Evaluation Index
Accuracy: The proportion of all correctly judged results in the total observed values of the classification model, as defined in Equation (11):
where is the true positive, which indicates that the real category of the sample is positive and the model recognition result is positive; is the false negative, which indicates that the real category of the sample is positive and the model recognition result is negative; is the false positive, which indicates that the real category of the sample is negative and the model recognition result is positive; and is the true negative, which indicates that the real category of the sample is negative and the model recognition result is negative.
Precision: The proportion of all outcomes where the model prediction is positive, as defined in Equation (12):
Sensitivity/Recall: In all outcomes where the true value is positive, the model predicts the proportion of pairs, as shown in Equation (13):
F1 Score: The F1 score integrates the precision and sensitivity output results, as shown in Equation (14):
Mean absolute error (MAE):
Root mean square error (RMSE):
where and represent the probability, and V and represent corresponding wind speed of category a and b, respectively. is the wind speed corresponding to the image, and represents the typhoon intensity estimated by the model; is the number of samples.
3. Results
3.1. Different Performances with Various Convolution Kernel Sizes
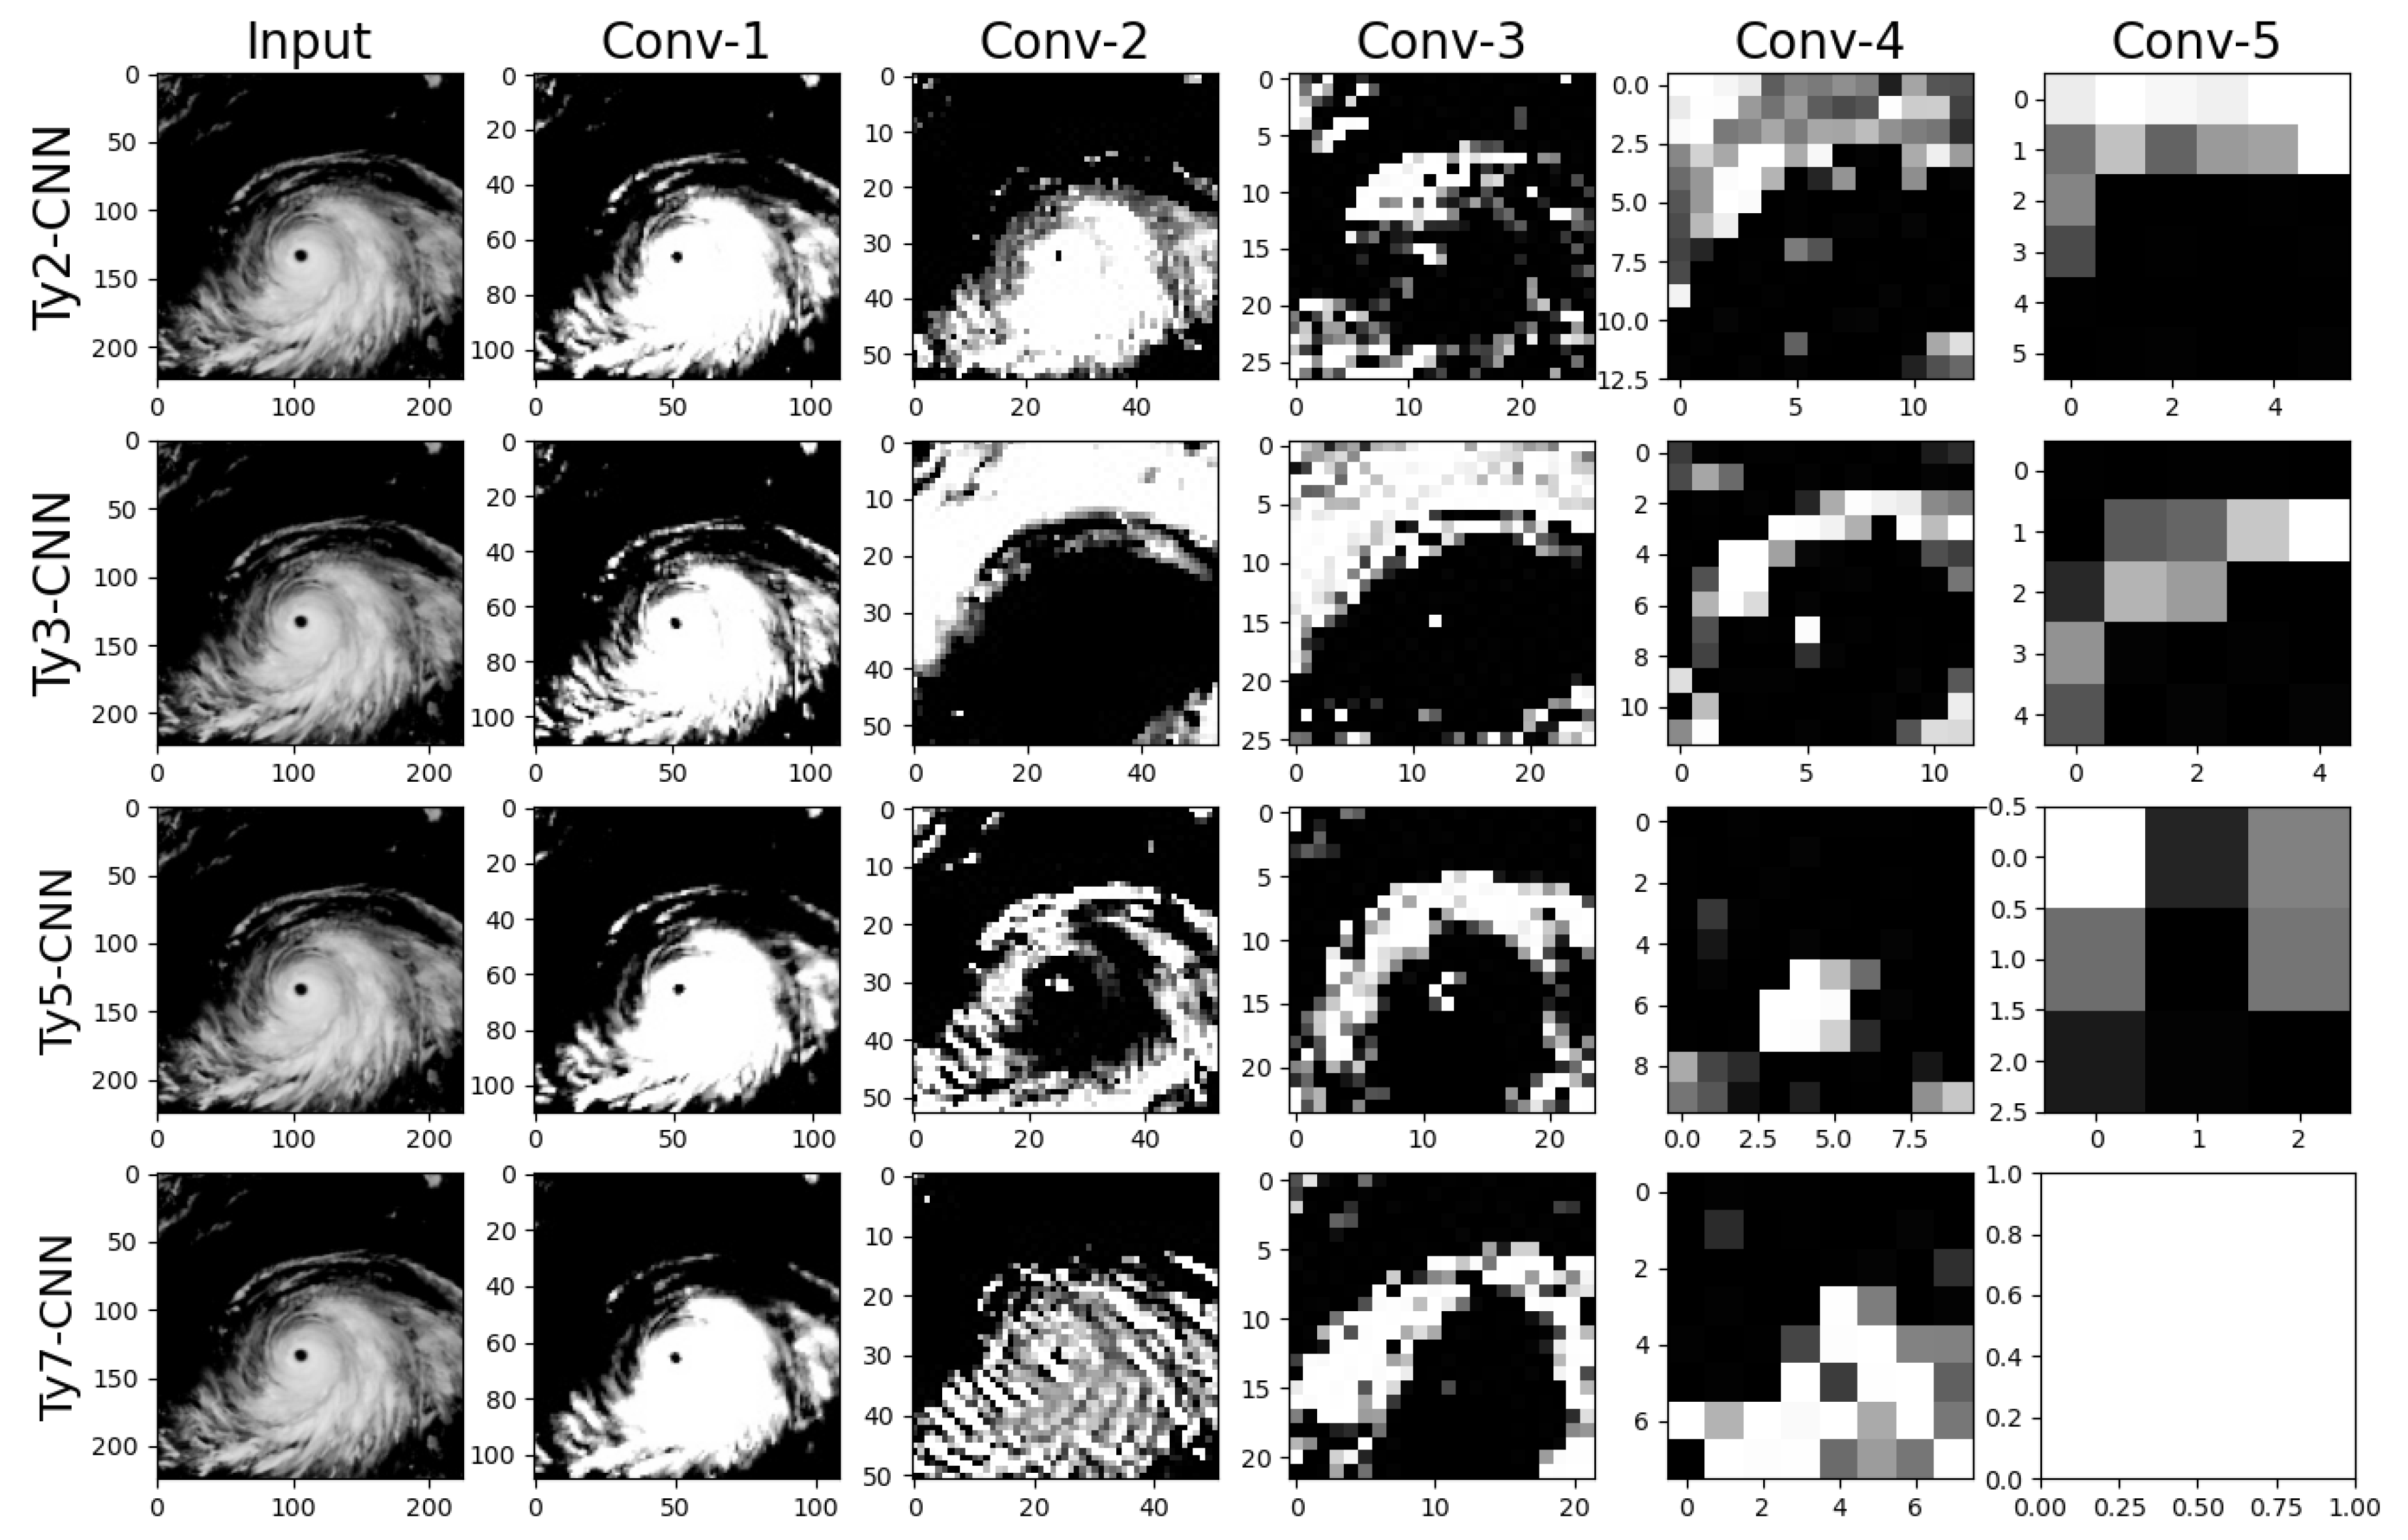
Based on the advantages of LeNet-5, we used the framework with five convolution layers to elaborate a series of models by using various convolution kernel sizes, named Ty2-CNN, Ty3-CNN, Ty5-CNN, and Ty7-CNN. The feature extraction results using these models are shown in Figure 4. The Ty2-CNN model was inefficient in extracting the typhoon features in Conv-3. The Ty5-CNN model retained complete cloud information, including typhoon eyes, cloud walls and dense cloud areas, in Conv-3, and the consistency between the subsampling image and the input image was higher than that of the other kernels. Overall, the 5 × 5 convolution kernel extracted satellite cloud image information more effectively than the other kernels. This result is consistent with that of Zhou et al. [12], who found that the 5 × 5 convolution kernel had an obvious feature extraction effect for satellite cloud image characteristics.
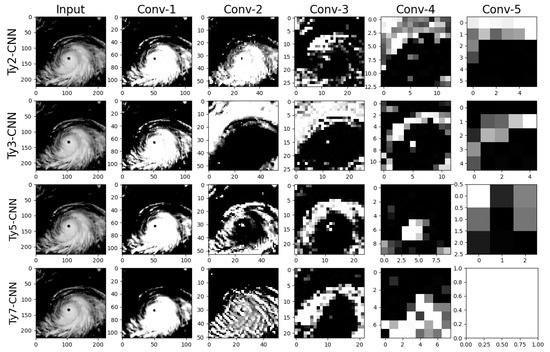
Figure 4.
Feature extraction results of different convolution kernels for a super typhoon.
The validation and test set accuracy of each model, together with the LeNet-5 model, are shown in Table 2. On the test dataset, the accuracy rate of LeNet-5 was 86.55%. When the model used the 7 × 7 convolution kernel, the model accuracy rate was 91.63%; when the model used the 5 × 5 convolution kernel, the model accuracy rate was 95.27%. The overall model accuracy on the test set was lower than that on the validation set. The Ty5-CNN model had better recognition performance than the other kernels. This also validated the above conclusions that the 5 × 5 convolution kernel can extract satellite cloud image information more effectively than the other kernels.
Table 2.
Comparison of model accuracy with different kernel sizes.
3.2. Establishment of a Set of Models and Comparative Analysis of the Results
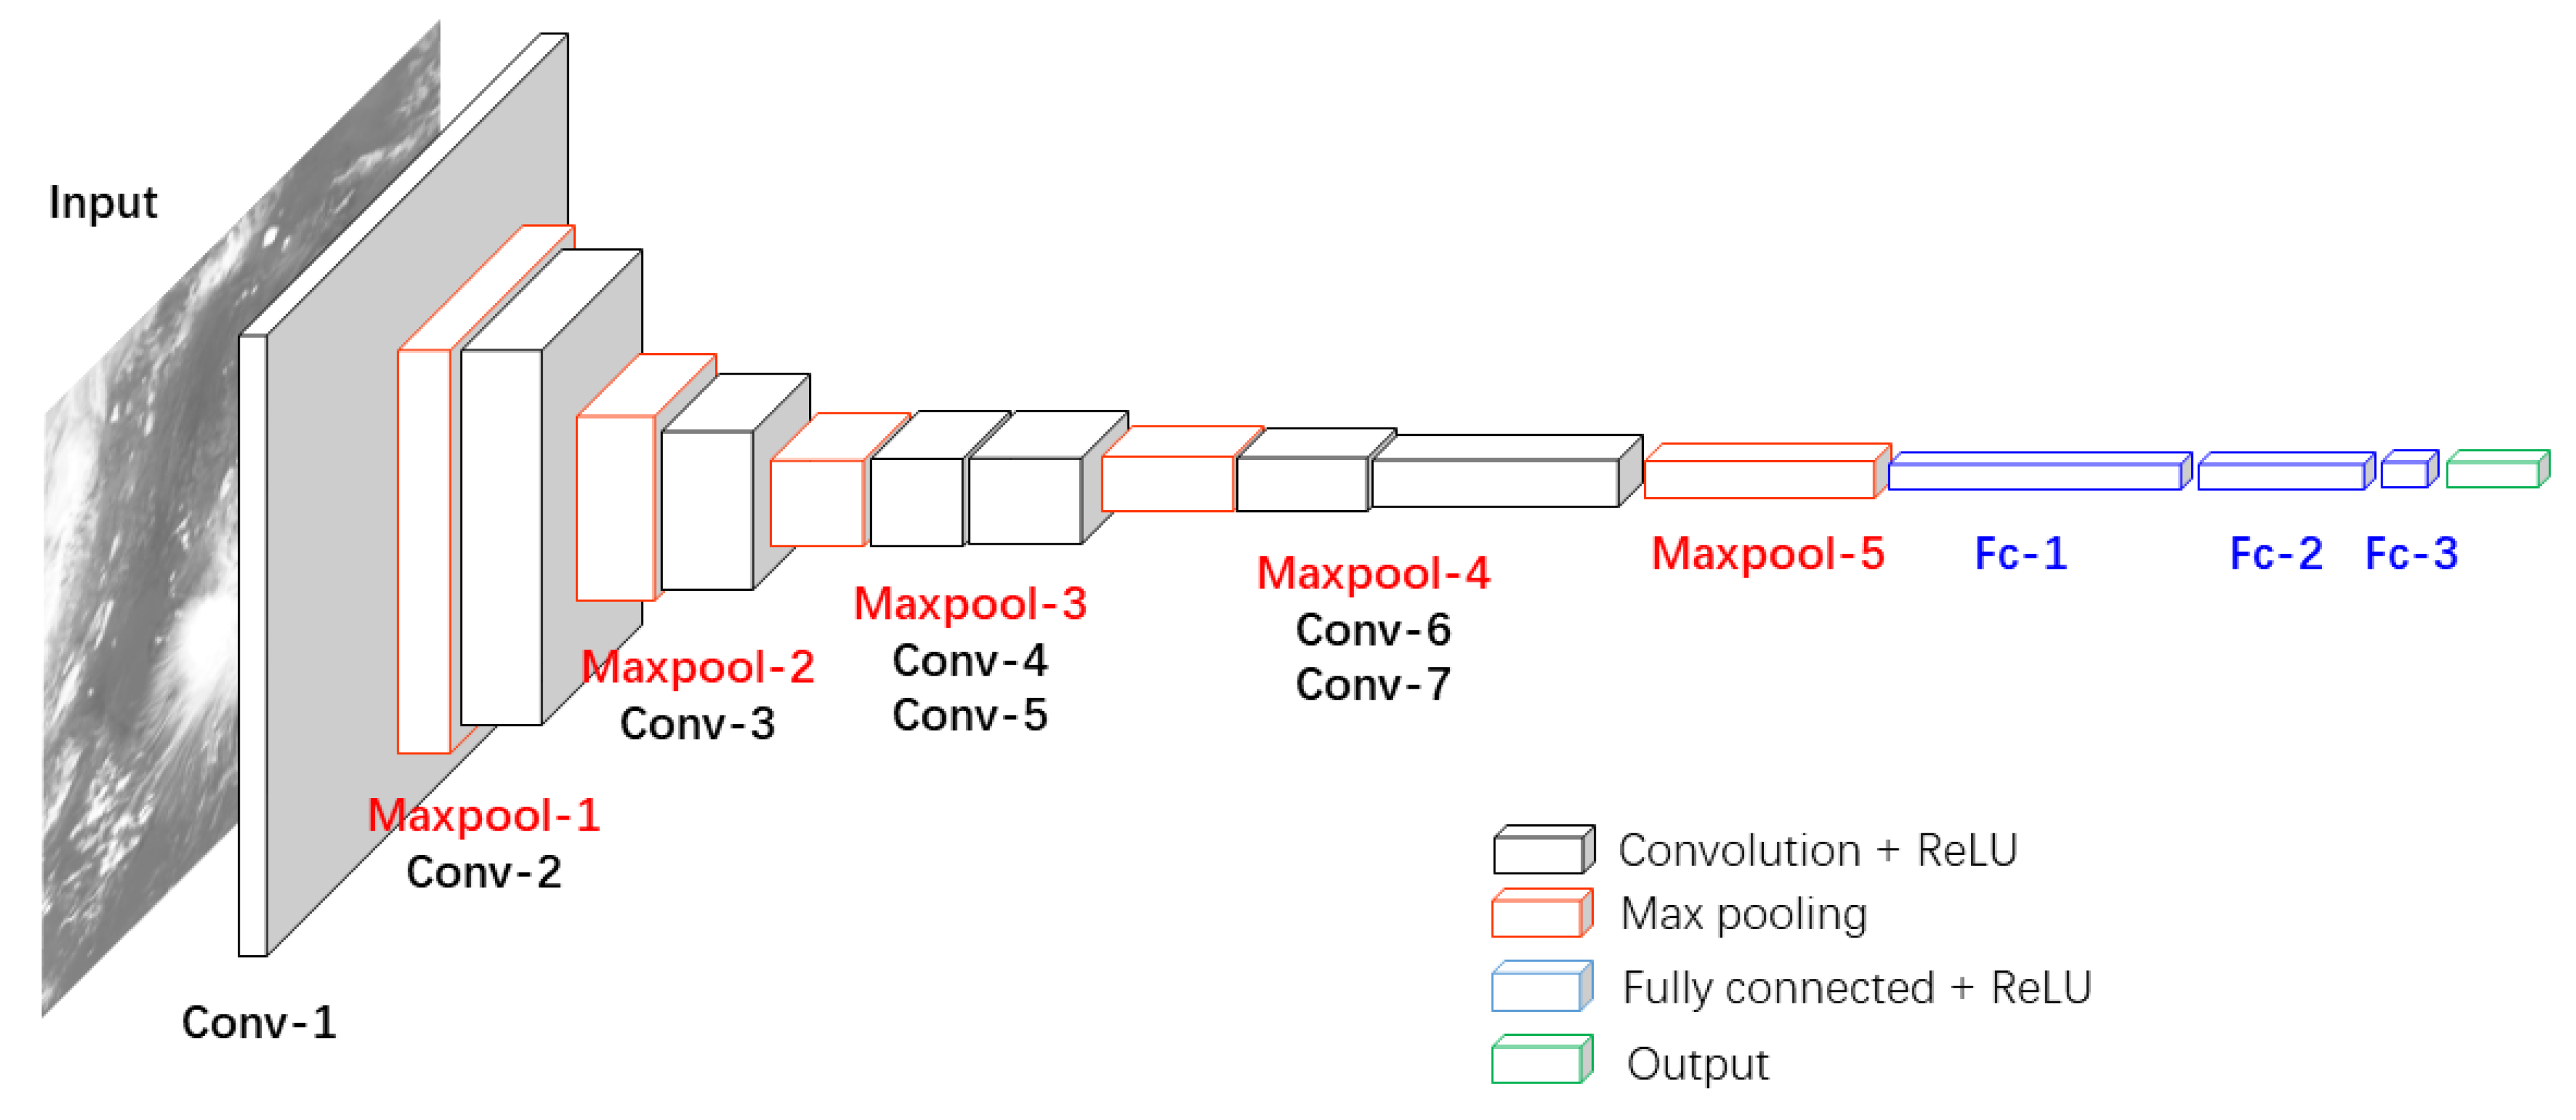
Some small convolution kernels were used to increase the receptive field, maximizing the mapping area between the feature image obtained and the previous feature image, reducing the feature loss and retaining the image information [21,24]. Two 3 × 3 convolution kernels were used in place of the 5 × 5 convolution kernel in the Ty5-CNN model based on the characteristics of the VGG16 model. A series of hybrid convolution model typhoon intensity classification and estimation networks (TICAENets) named Ty1-TICAENet, Ty2-TICAENet, Ty3-TICAENet, Ty4-TICAENet and Ty5-TICAENet were successfully utilized by combining two-layer convolution and one-layer pooling with one-layer convolution and one-layer pooling in different ways. The convolution kernel parameters of those models are shown in Table 3. The Ty1-TICAENet model used two 3 × 3 convolution kernels in Conv-5, and the Ty2-TICAENet model used two 3 × 3 convolution kernels in Conv-4 and Conv-5. The network depth of the framework was larger than that of the LeNet-5 model and lower than that of the VGG16 model, which reduced the number of model training parameters and the memory footprint. Only the detailed structure of the Ty2-TICAENet network model is shown in this paper, as shown in Table 4. The overall architecture of the proposed model is shown in Figure 5.
Table 3.
Convolution kernel parameters of various models.
Table 4.
Network structure of the Ty2-TICAENet model.
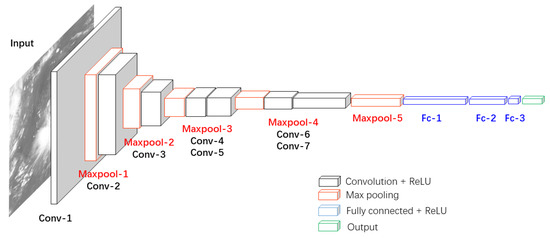
Figure 5.
The overall architecture of the Ty2-TICAENet.
Table 5 compares the proposed model parameters with other existing models, including LeNet-5, VGG16 and AlexNet. Params means the number of major network parameters and memory means the required memory. The term Flops (floating point operations) refers to floating point operations performed by the network. MemR + W indicates that the sum of the size read from memory and written to memory while the network is running. The proposed model has relatively smaller params, Flops and MemR + W, which means that the model requires less memory and runs faster when compared with VGG16 and AlexNet. It has smaller values of Params, Flops and MemR + W(MB) than LeNet-5, but almost the same memory. The model floating-point calculations are smaller and the size read from memory and written to memory is smaller.
Table 5.
Comparison different model parameters.
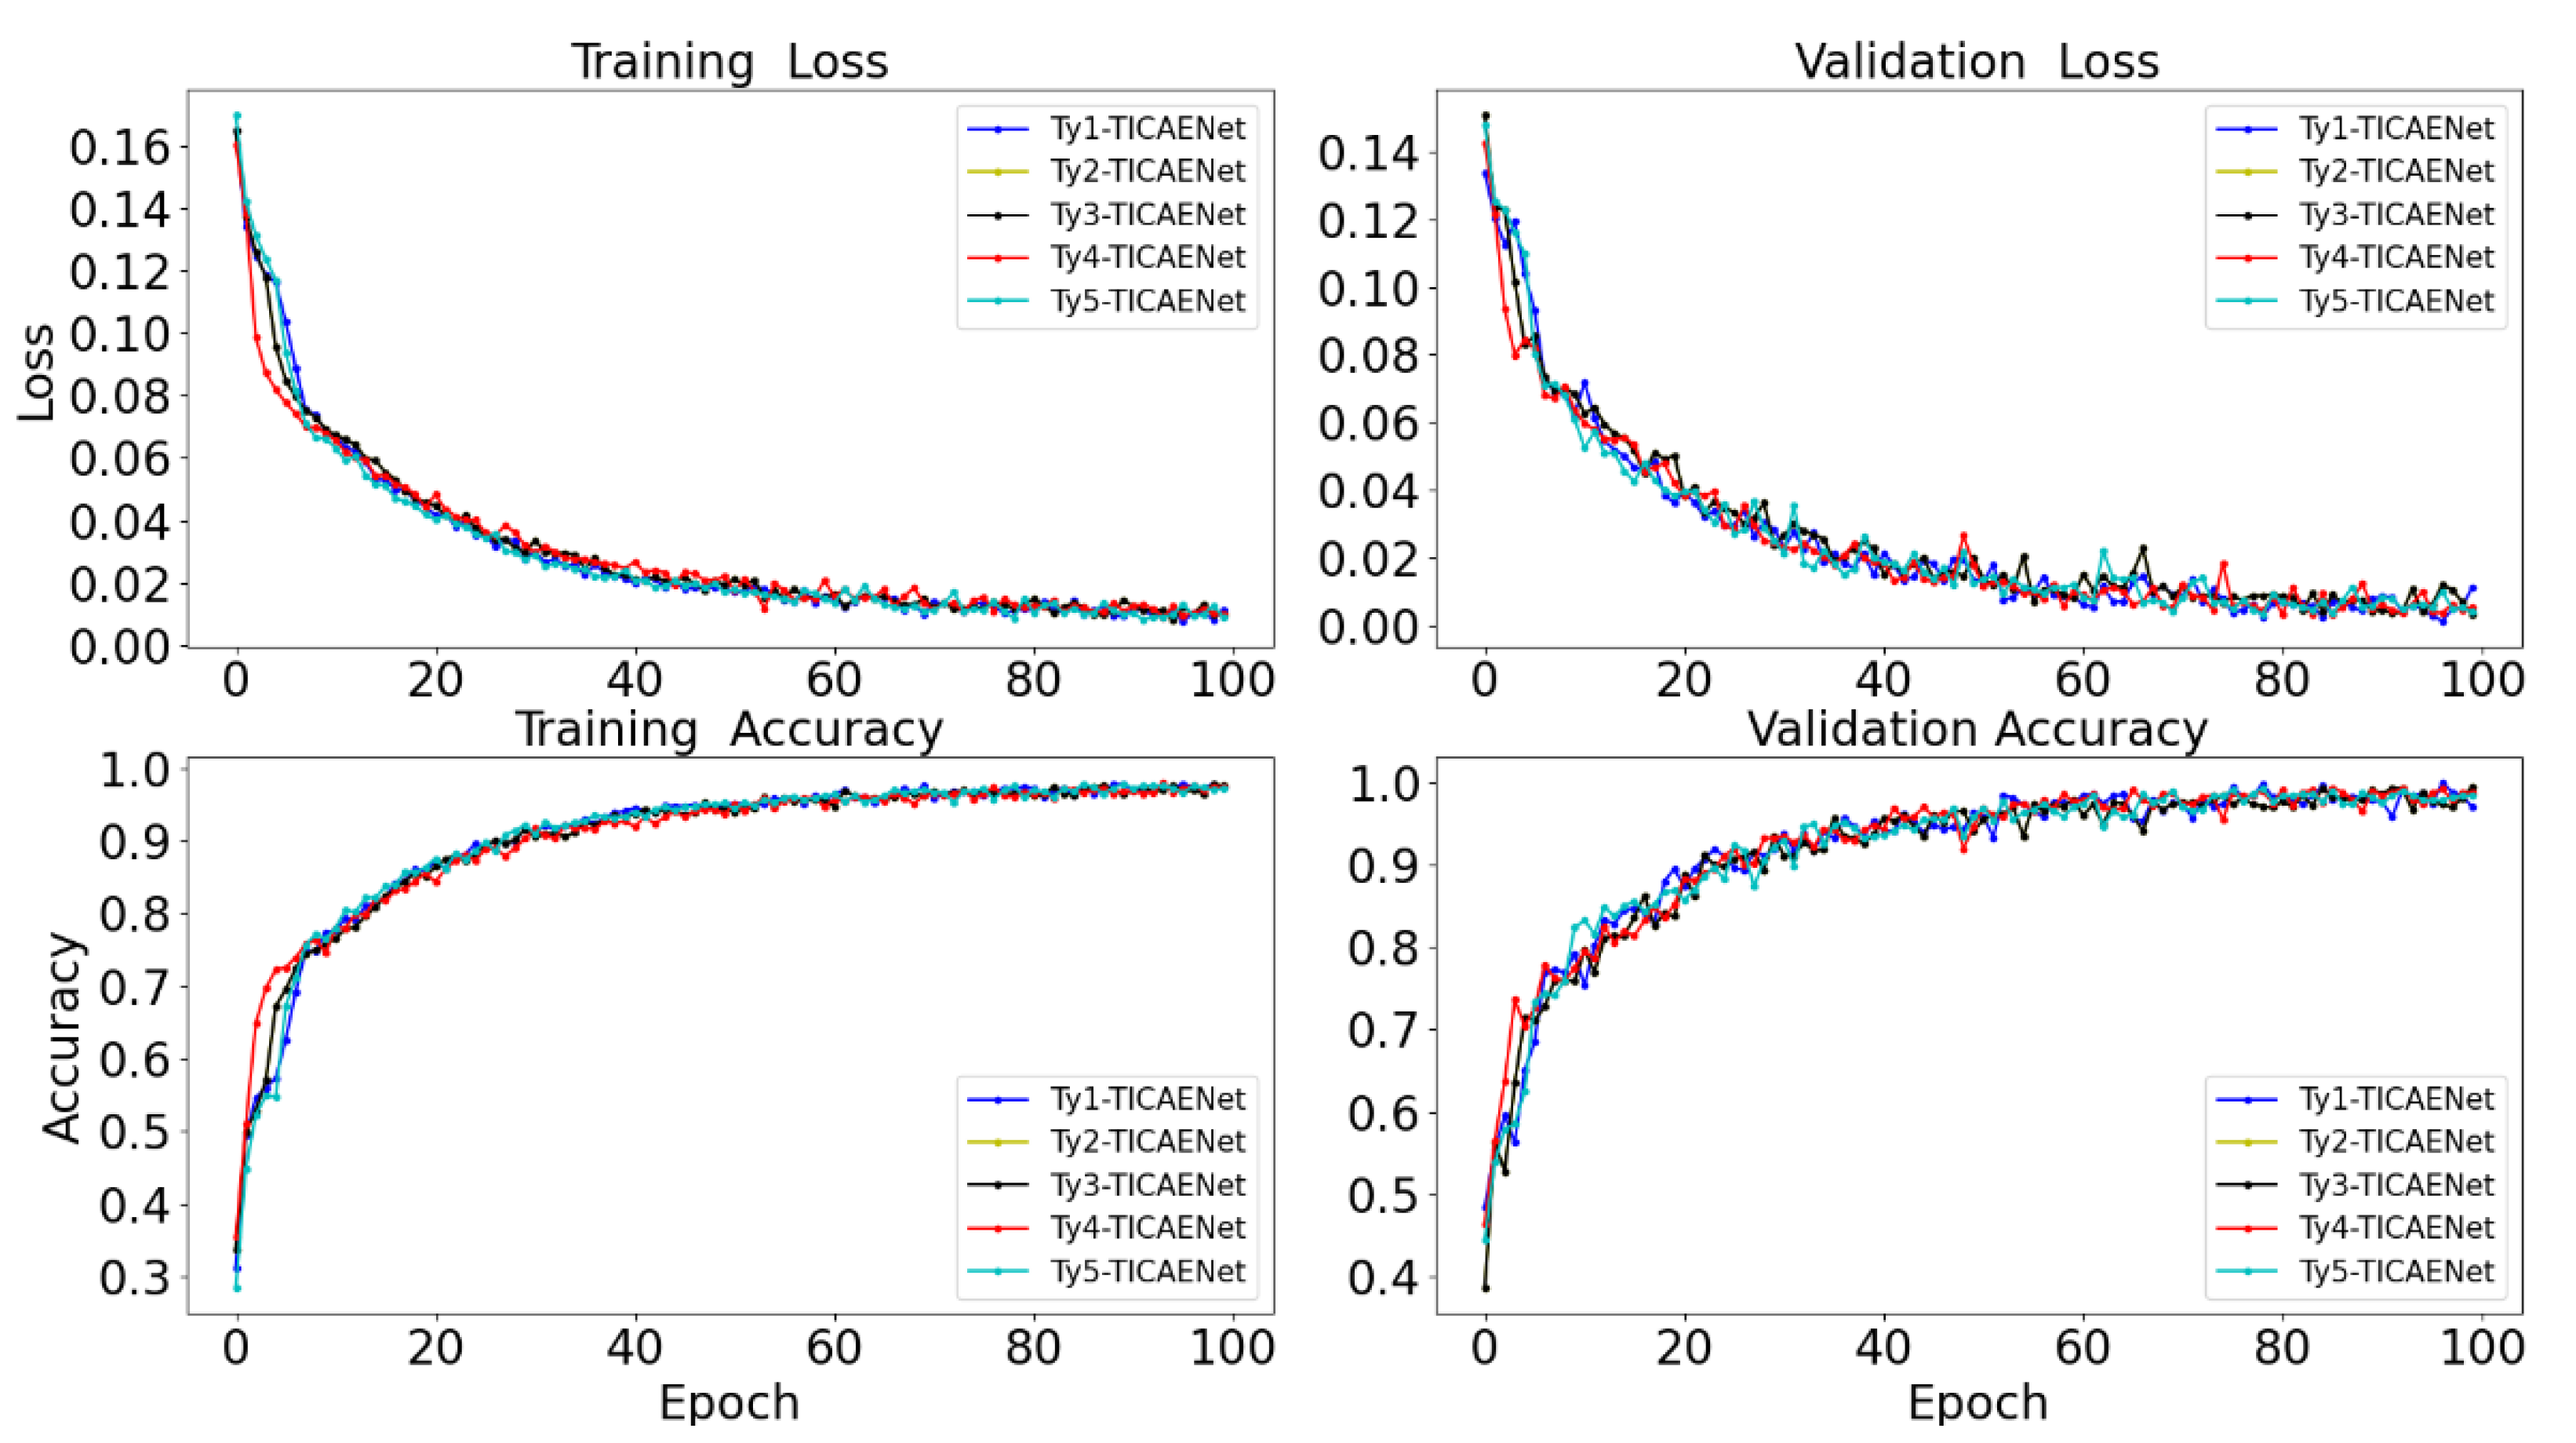
The model training and validation set curves are shown in Figure 6. At the beginning of training, the loss value of the model decreased, and the accuracy of the model increased greatly. After a certain learning time, the loss and accuracy tended to stabilize, indicating that all the models were stable. To further validate the results, the five models were compared in terms of accuracy, precision, sensitivity/recall and F1 score.
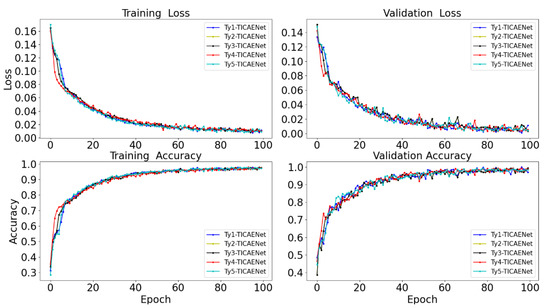
Figure 6.
Model training accuracy curves and loss value curves.
The results of the different models are shown in Table 6. All the new models had better accuracies, precisions and sensitivities than the LeNet-5 model. The Ty4-TICAENet model had better recognition performance than the Ty3-TICAENet model, and the Ty2-TICAENet model had the best recognition performance, with an accuracy, precision and sensitivity of 97.12%, 97.13% and 97.12%, respectively. Compared with the LeNet-5 model, the accuracy and sensitivity of the Ty2-TICAENet model were improved by 10.57%. Compared with the Ty-VGG16 model, the model was improved by 1.89%. Based on this result, we can conclude that using two 3 × 3 convolution kernels to replace a 5 × 5 convolution kernel improves the classification accuracy. However, the effect of two 3 × 3 convolution kernels differs from the effect of one 5 × 5 convolution kernel in other ways. Better performance can be obtained by replacing large convolution kernels with small kernels in the optimal combination. In this paper, the VGG16 transfer learning model named Ty-VGG16 was used for comparison with other model results.
Table 6.
Accuracy, precision and sensitivity for six TC categories using various models.
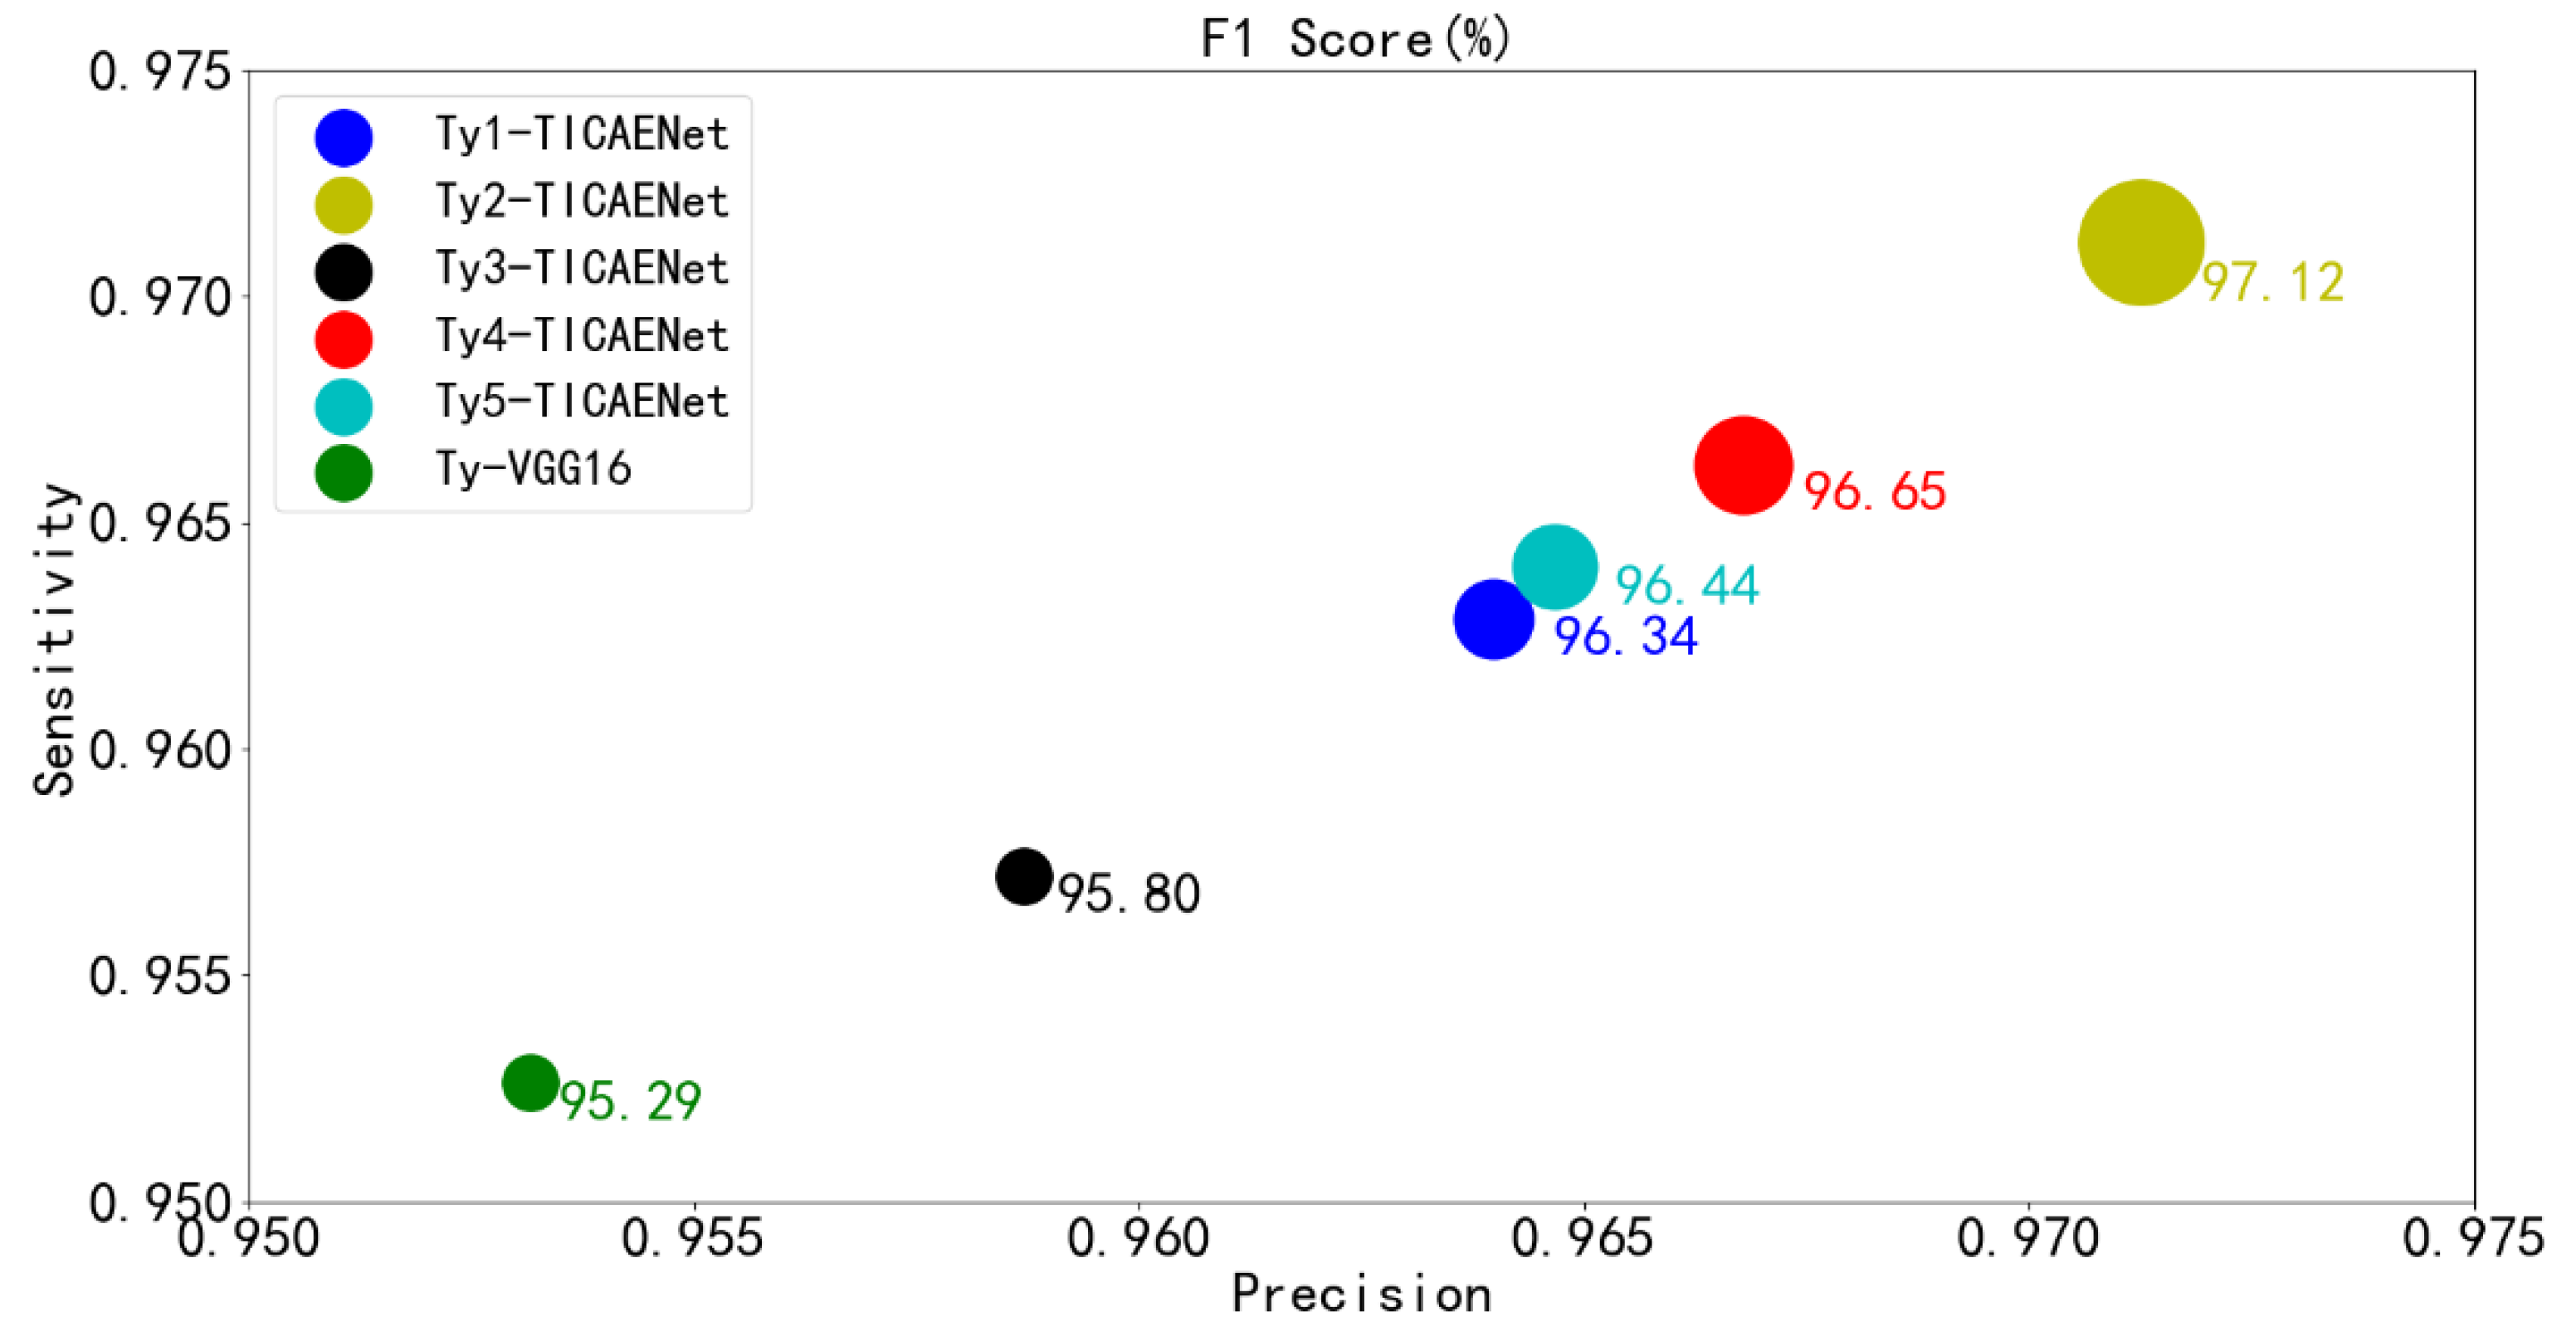
Figure 7 shows the F1 scores of the different models. If the abscissa and the ordinate of the round approach 1, the model has better precision. If the value of the round is larger, the model obtains better output. Because the LeNet-5 model’s precision, sensitivity and F1 score were all less than 0.87, the LeNet-5 model’s indicators are not displayed. The Ty4-TICAENet model had better recognition performance than the Ty3-TICAENet model. The Ty2-TICAENet model had the highest recognition accuracy rate. This indicates that replacing large convolution kernels with smaller convolution kernels does not further improve model performance. The framework replaced two large convolutional kernels with four small convolutional kernels and achieved better performance in Conv-4 and Conv-5. The Ty2-TICAENet model was named the TICAENet model.
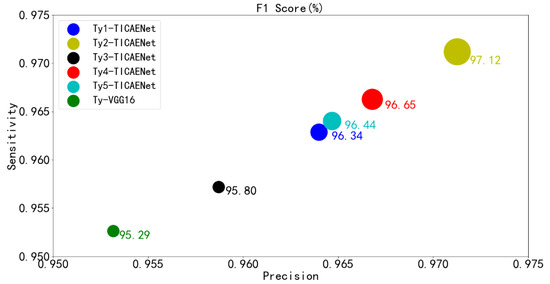
Figure 7.
Different model F1 scores for the six TC categories.
3.3. Classification of Typhoon Intensity by Using the TICAENet Model
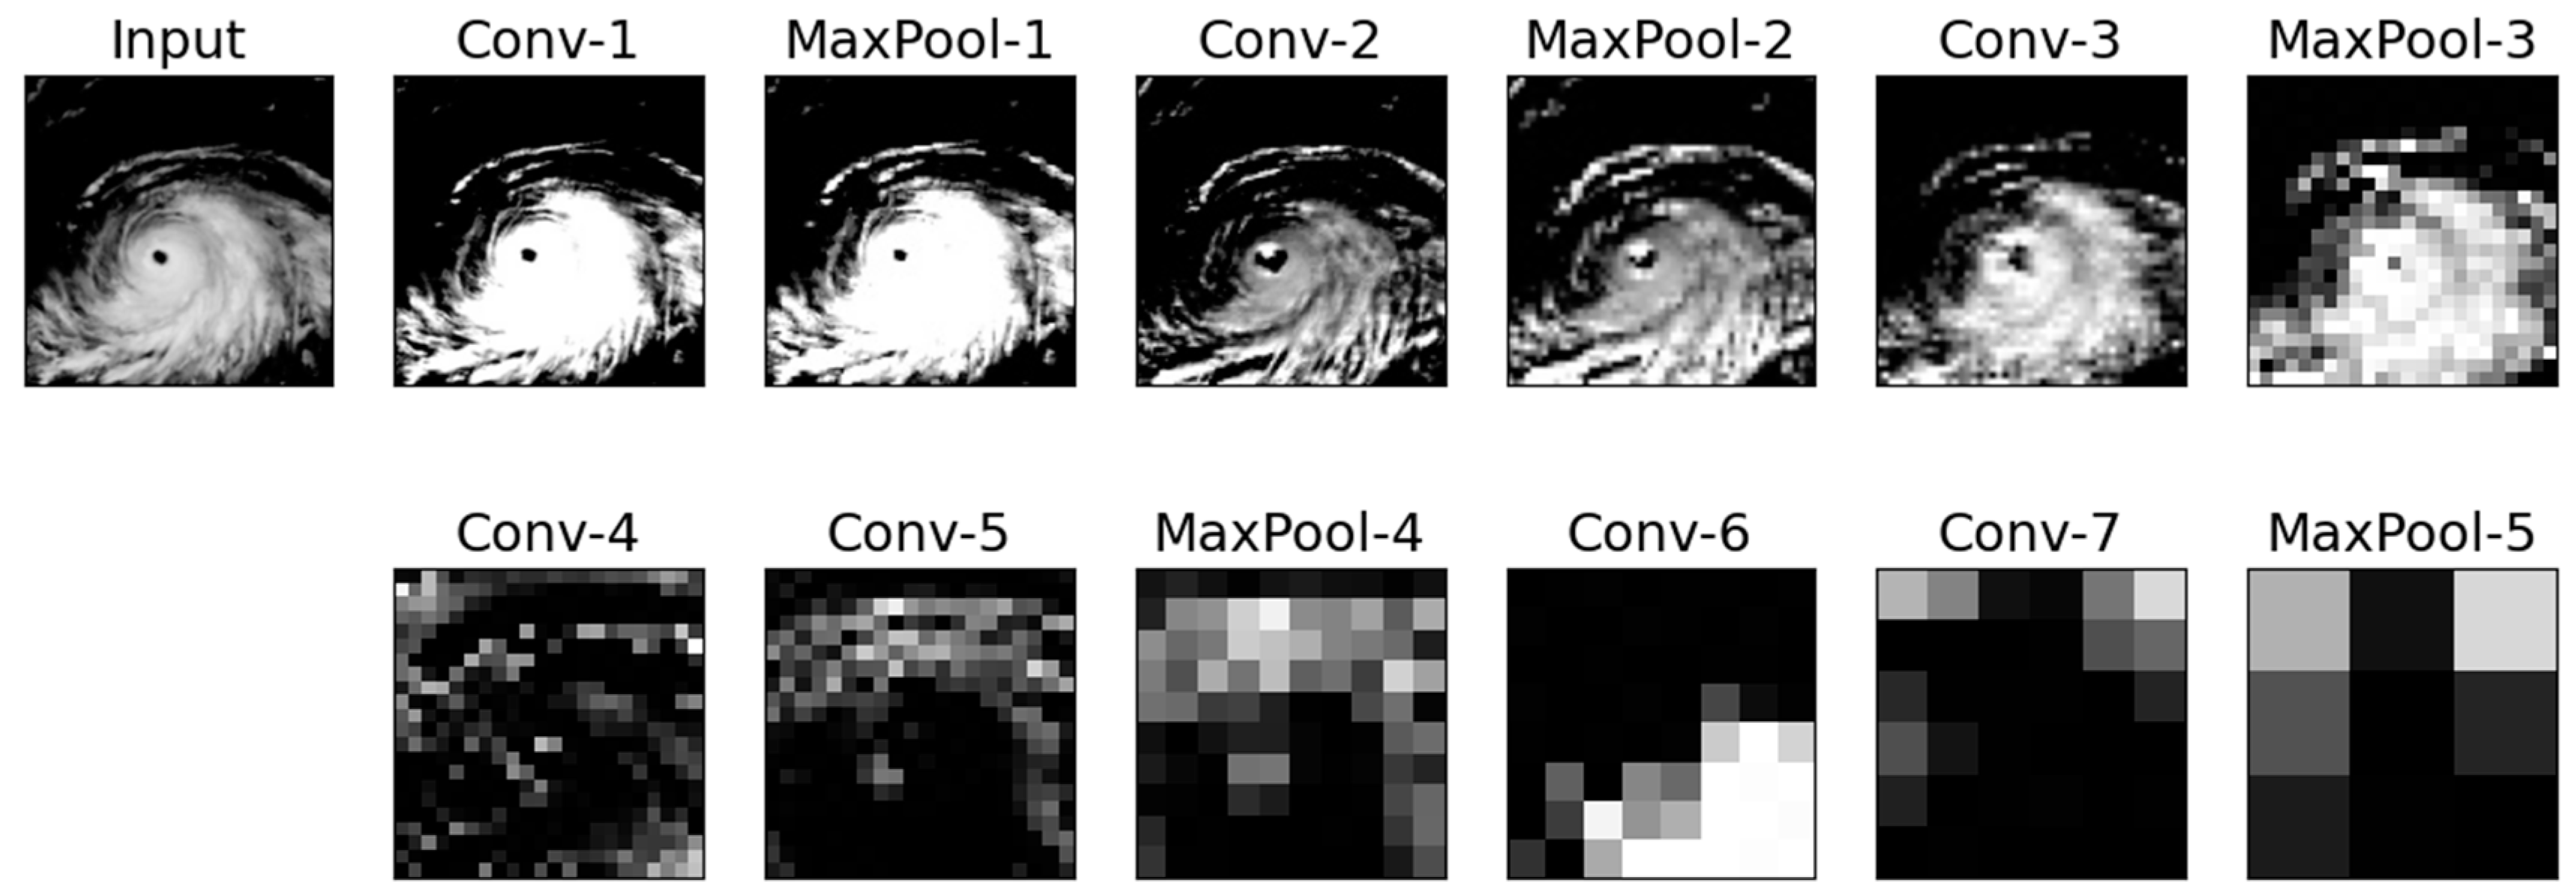
Figure 8 illustrates the learned abstract features in TICAENet. After maxpool-5 subsampling, the model can efficiently extract the typhoon eyes, cloud walls and dense cloud area features, indicating that the TICAENet model has a high processing efficiency for satellite cloud images. After maxpool-5, the TICAENet model inputs the image to the fully connected layer, and the result is output by the sigmoid function.
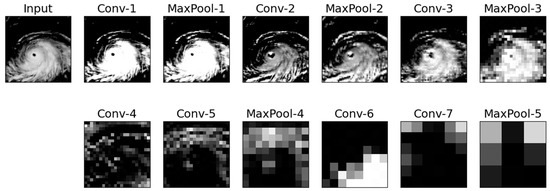
Figure 8.
Learned abstract features after subsampling in the TICAENet model.
A confusion matrix, which was used to analyze the classification reliability of the different typhoon intensities, is an important indicator for judging the results of the model. Table 7 shows the confusion matrix of the TICAENet model. The classification precision of the TICAENet model for each typhoon intensity reached 96.60%. The classification precision for tropical storms, severe tropical storms and super typhoons reached 97.10%. The recognition accuracy of tropical storms was the lowest, which may be due to the lack of specific cloud structures during typhoon formation. Additionally, tropical storms are loosely structured and can have diverse forms. When a typhoon forms, it has a distinct eye area and spiral cloud band, which can be better extracted from satellite cloud image features to identify the intensity of the typhoon.
Table 7.
Confusion matrix of the test samples for the TICAENet model.
Table 8 displays the proposed model’s results for the various typhoon intensities of 241 samples from 2019. Compared with the other typhoon intensities, the severe tropical storm samples, based on the MAE value of 0.4 and the RMSE of 0.1, achieved the best estimation effect when this model was utilized. The model’s ability to estimate strength essentially reached the level of a business reference. The model performs the worst on tropical depression and tropical storm samples, which may be due to a lack of specific cloud structures during typhoon formation.
Table 8.
Analysis of the typhoon intensity estimation of satellite cloud images acquired in 2019.
Table 9 shows a comparison of typhoon intensity prediction results based on the proposed model and other methods. The typhoon intensity estimation MAE is 4.78 m/s and RMSE is 6.11 m/s. In detail, the proposed model achieved better performance with improvements of 18.98% and 20.65% when compared to the statistical method. In comparison to the results using DAVT (deviation-angle variance technique), K-nearest-neighbors algorithm and linear regression of IR features, TICAENet is more useful for estimating intensity, and the estimation accuracy is 8.26%, 6.43% and 10.01% larger, respectively. The TICAENet model has high research value and application prospects for typhoon intensity estimation. Therefore, the model in this paper is more advantageous. In summary, the TICAENet model developed can reliably recognize and estimate typhoon intensity.
Table 9.
Comparison of intensity estimates among various methods.
4. Discussion and Conclusions
With the development of deep learning, many scholars use it as a tool in the field of marine meteorology to realize the classification and recognition of satellite cloud images. The core challenge of visual computing is the acquisition, processing, analysis and presentation of visual information, primarily images and video. At present, deep learning has low accuracy in the identification of typhoon intensity and tropical depression, and it is difficult to extract cloud image features. Studies have shown that feature information can be better extracted by using smaller convolution kernels instead of a larger convolution kernel. However, few studies have determined how many small convolution kernels are needed to replace large ones to improve computational efficiency and recognition accuracy. Therefore, it is critical to develop an accurate model for identifying and evaluating typhoon intensity.
In this paper, we first used the framework of five convolution layers with the network topology architecture of the LeNet-5 model to elaborate a series of models by using various convolution kernel sizes. The 5 × 5 convolution kernel extracted satellite cloud image information more effectively than the other kernels. Then, based on the characteristics of the VGG16 model and replacing a 5 × 5 convolution kernel with two 3 × 3 convolution kernels, we built a new framework combining two-layer convolution and one-layer pooling with one-layer convolution and one-layer pooling. A series of hybrid convolution models were successively adopted to determine the best combination and achieve better recognition performance by combining the advantages of the LeNet-5 model with the VGG16 model. These models had an appropriate network depth and efficiently processed these problems based on satellite images of the Northwest Pacific Ocean and the South China Sea. The experimental results showed that the TICAENet model had better recognition performance, and it can efficiently extract sensitive features such as typhoon eyes, cloud belts and dense cloud areas. The model indicators showed that the accuracy, precision, sensitivity and F1 score of the TICAENet model were 97.12%, 97.13%, 97.12% and 97.12%, respectively, which are higher than those of the other models. Compared with the LeNet-5 model, the accuracy and sensitivity of the model were improved by 10.57%. On the basis of the TICAENet model, the maximum probability linear estimation method was used to achieve a quantitative estimation of the typhoon wind speed, with an MAE of 4.78 m/s and RMSE of 6.11 m/s. The estimation accuracy is 18.98% and 20.65% higher than that of the statistical method respectively. Compared with DAVT, K-nearest-neighbors algorithm and linear regression of IR features, TICAENet is more useful for estimating intensity, and its estimation accuracy is 8.26%, 6.43% and 10.01% higher respectively. The model takes less memory and runs faster. It indicates that the TICAENet model has high research value and application prospects for typhoon intensity estimation. Therefore, it is suggested from this study that the TICAENet model is better for identifying typhoon intensity using satellite images, providing a solid basis for relevant organizations to make decisions and laying the foundation for subsequent typhoon intensity classification, identification and prediction.
Although we performed many experiments with various models, there were some deficiencies due to the limitations of objective factors: (1) the experiment lacked an analysis of actual typhoon detection cases; (2) actual application analysis with a large amount of data is not involved. In the future, we will continue in-depth research in these two areas. Additionally, to further improve the model performance, we will focus on combining an RNN (recurrent neural network) with the model and adjust the network model.
Author Contributions
S.J.: data acquisition; data analysis; data interpretation; study design; writing—original draft; L.T.: writing—review and editing. All authors have read and agreed to the published version of the manuscript.
Funding
This research was supported by the National Natural Science Foundation of China (41905066), Key Special Project for Introduced Talents Team of Southern Marine Science and Engineering Guangdong Laboratory (Guangzhou) (GML2019ZD0306), and the Independent Research Project Program of State Key Laboratory of Tropical Oceanography (LTOZZ2004).
Institutional Review Board Statement
Not applicable.
Informed Consent Statement
Not applicable.
Data Availability Statement
The best tropical cyclone track data for the experiment are downloaded from the website of the China Meteorological Administration (CMA) (https://tcdata.typhoon.org.cn/zjljsjj_zlhq.html, accessed on 1 November 2021). The cloud images are provided by Kochi University (http://weather.is.kochi-u.ac.jp/, accessed on 1 November 2021) and received from the Japan Meteorological Business Support Center (JMBSC).
Conflicts of Interest
The authors declare no conflict of interest.
Appendix A
The LeNet-5 model is a feedforward neural network that can quickly respond to nearby coverage networks through artificial neurons and rapidly respond to data. Local join and weight sharing are used to extract features from the original data to construct dense and complete feature vectors [32]. The specific structure of the LeNet-5 model is shown in Figure A1. Each layer contains trainable parameters and multiple feature graphs. Each feature graph extracts a feature of the input through a filter, and each feature graph has multiple neurons [33]. There have been many studies focused on improving LeNet-5 algorithms. For example, Fan et al. [34] monitored haze through images by adjusting the parameters and structure of the classical LeNet-5 Model. Zhang et al. [35] proposed the TSR algorithm, which was based on an improved LeNet-5 algorithm, for situations when traditional computer vision recognition technology cannot meet real-time requirements.
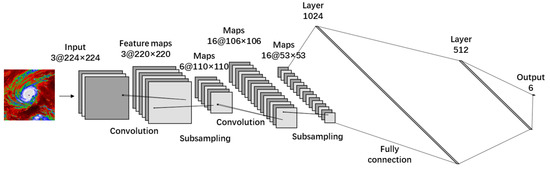
Figure A1.
The overall structure of the LeNet-5 model.
Figure A1.
The overall structure of the LeNet-5 model.

Appendix B
The VGG16 convolutional neural network is a network structure proposed by the Oxford University Computer Vision Laboratory as part of the 2014 ILSVRC (ImageNet Large Scale Visual Recognition Challenge) competition. To solve ImageNet’s 1000 class image localization and classification task, Simonyan et al. [21] analyzed six networks in terms of the influence of deep learning on the model, and the experimental result showed that a model with 16 layers had a better effect. The combination of several small convolution kernels in the VGG16 model has a better effect than the use of large convolution kernels. The structure of the VGG16 model is shown in Figure A2. Krinitskiy et al. [36] developed a novel MC detection method based on a deep convolutional neural network (DCNN) with the VGG16 model. Hridayami et al. [37] studied and proposed a fish recognition method based on the VGG16 deep convolutional neural network.
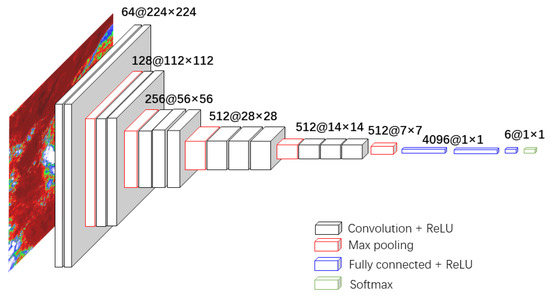
Figure A2.
The overall structure of the VGG16 model.
Figure A2.
The overall structure of the VGG16 model.

References
- Emmanuel, K. Increasing destructiveness of tropical cyclones over the past 30 years. Nature 2005, 436, 686–688. [Google Scholar] [CrossRef] [PubMed]
- Patricola, C.M.; Wehner, M.F. Anthropogenic influences on major tropical cyclone events. Nature 2018, 563, 339–346. [Google Scholar] [CrossRef] [PubMed] [Green Version]
- Chen, L.L.; Tseng, C.H.; Shih, Y.H. Climate-related economic losses in Taiwan. Int. J. Glob. Warm. 2017, 11, 449–463. [Google Scholar] [CrossRef]
- Qi, W.; Yong, B.; Gourley, J.J. Monitoring the super typhoon lekima by GPM-based near-real-time satellite precipitation estimates. J. Hydrol. 2021, 603, 126968. [Google Scholar] [CrossRef]
- Yang, L.; Liu, M.; Smith, J.A.; Tian, F. Typhoon Nina and the August 1975 Flood over Central China. J. Hydrometeorol. 2017, 18, 451–472. [Google Scholar] [CrossRef]
- Chen, S.T. Probabilistic forecasting of coastal wave height during typhoon warning period using machine learning methods. J. Hydroinform. 2019, 21, 343–358. [Google Scholar] [CrossRef]
- Chang, H.K.; Liou, J.C.; Liu, S.J.; Liaw, S.R. Simulated wave-driven ANN model for typhoon waves. Adv. Eng. Softw. 2011, 42, 25–34. [Google Scholar] [CrossRef]
- Duan, Y.; Shen, Y.R.; Canbulat, I.; Luo, X.; Si, G.Y. Classification of clustered micro-seismic events in a coal mine using machine learning. J. Rock Mech. Geotech. Eng. 2021, 13, 1256–1273. [Google Scholar] [CrossRef]
- Liu, D.; Liu, H.; Wu, Y.; Zhang, W.; Wang, Y.; Santosh, M. Characterization of geo-material parameters: Gene concept and big data approach in geotechnical engineering. Geosyst. Geoenviron. 2022, 1, 100003. [Google Scholar] [CrossRef]
- Ma, W.; Wu, X.; Chen, X.; Bao, C. Satellite Cloud Maps’ Features of Typhoon Formation. Mar. Forecast. 2000, 17, 1–10. [Google Scholar]
- Su, X. Using Deep Learning Model for Meteorological Satellite Cloud Image Prediction. AGU Fall Meet. Abstr. 2017, 2017, IN13B-0064. [Google Scholar]
- Zhou, J.; Xiang, J.; Huang, S. Classification and Prediction of Typhoon Levels by Satellite Cloud Pictures through GC-LSTM Deep Learning Model. Sensors 2020, 20, 5132. [Google Scholar] [CrossRef]
- Zhao, L.; Chen, Y.; Sheng, V.S. A real-time typhoon eye detection method based on deep learning for meteorological information forensics. J. Real Time Image Process. 2020, 17, 95–102. [Google Scholar] [CrossRef]
- Wang, C.; Zheng, G.; Li, X.; Xu, Q.; Liu, B.; Zhang, J. Tropical cyclone intensity estimation from geostationary satellite imagery using deep convolutional neural networks. IEEE Trans. Geosci. Remote Sens. 2021, 60, 4101416. [Google Scholar] [CrossRef]
- Zhang, C.J.; Wang, X.J.; Ma, L.M.; Lu, X.Q. Tropical cyclone intensity classification and estimation using infrared satellite images with deep learning. IEEE J. Sel. Top. Appl. Earth Obs. Remote Sens. 2021, 14, 2070–2086. [Google Scholar] [CrossRef]
- Rüttgers, M.; Lee, S.; You, D. Typhoon track prediction using satellite images in a Generative Adversarial Network. arXiv 2018, arXiv:1808.05382. [Google Scholar] [CrossRef]
- Zou, G.; Qian, H.; Zheng, Z.; Huang, D.; Liu, Z. Classification of Typhoon Grade Based on Satellite Cloud Image and Deep Learning. Remote Sens. Inf. 2019, 34, 1–6. [Google Scholar]
- Zhang, W.; Phoon, K.-K. Editorial for Advances and applications of deep learning and soft computing in geotechnical underground engineering. J. Rock Mech. Geotech. Eng. 2022, 14, 671–673. [Google Scholar] [CrossRef]
- Srivastava, R.K.; Greff, K.; Schmidhuber, J. Training very deep networks. In Advances in Neural Information Processing Systems 28, Proceedings of the 29th Annual Conference on Neural Information Processing Systems, Montreal, QC, Canada, 7–12 December 2015; Cortes, C., Lee, D.D., Garnett, R., Lawrence, D.N., Sugiyama, M., Eds.; Curran Associates, Inc.: Red Hook, NY, USA, 2015. [Google Scholar]
- Wang, G.; Gong, J. Facial expression recognition based on improved LeNet-5 CNN. In Proceedings of the IEEE 31st Chinese Control and Decision Conference (CCDC), Nanchang, China, 3–5 June 2019; pp. 5655–5660. [Google Scholar]
- Simonyan, K.; Zisserman, A. Very deep convolutional networks for large-scale image recognition. arXiv 2014, arXiv:1409.1556. [Google Scholar]
- He, K.; Zhang, X.; Ren, S.; Sun, J. Deep Residual Learning for Image Recognition. In Proceedings of the IEEE Conference on Computer Vision and Pattern Recognition (CVPR), Las Vegas, NV, USA, 27–30 June 2016; pp. 770–778. [Google Scholar]
- Tan, M.; Le, Q.V. Mixconv: Mixed depthwise convolutional kernels. arXiv 2019, arXiv:1907.09595. [Google Scholar]
- Szegedy, C.; Vanhoucke, V.; Ioffe, S.; Shlens, J.; Wojna, Z. Rethinking the inception architecture for computer vision. In Proceedings of the IEEE Conference on Computer Vision and Patten Recognition, Seattle, WA, USA, 27–30 June 2016. [Google Scholar]
- Ismanto, H.; Marfai, M.A. Classification Tree Analysis (Gini-Index) Smoke Detection using Himawari_8 Satellite Data Over Sumatera-Borneo Maritime Continent Sout East Asia. IOP Conf. Ser. Earth Environ. Sci. 2019, 256, 12043. [Google Scholar] [CrossRef] [Green Version]
- Kikuchi, M.; Murakami, H.; Suzuki, K.; Nagao, T.M.; Higurashi, A. Improved hourly estimates of aerosol optical thickness using spatiotemporal variability derived from Himawari-8 geostationary satellite. IEEE Trans. Geosci. Remote Sens. 2018, 56, 3442–3455. [Google Scholar] [CrossRef]
- Bankert, R.L.; Cossuth, J. Tropical Cyclone Intensity Estimation via Passive Microwave Data Features. In Proceedings of the 32rd Conference on Hurricanes and Tropical Meteorology, San Juan, Puerto Rico, 17–22 April 2016. [Google Scholar]
- Lu, X.Q.; Lei, X.T.; Yu, H.; Zhao, B.K. An objective TC intensity estimation method based on satellite data. J. Appl. Meteorol. Sci. 2014, 25, 52–58. [Google Scholar]
- Ritchie, E.A.; Valliere-Kelley, G.; Piñeros, M.F.; Tyo, J.S. Tropical cyclone intensity estimation in the north Atlantic basin using an improved deviation angle variance technique. Weather Forecast. 2012, 27, 1264–1277. [Google Scholar] [CrossRef] [Green Version]
- Fetanat, G.; Homaifar, A.; Knapp, K.R. Objective tropical cyclone intensity estimation using analogs of spatial features in satellite data. Weather Forecast. 2013, 28, 1446–1459. [Google Scholar] [CrossRef]
- Kossin, J.P.; Knapp, K.R.; Vimont, D.J.; Murnane, R.J.; Harper, B.A. A globally consistent reanalysis of hurricane variability and trends. Geophys. Res. Lett. 2007, 34, L04815. [Google Scholar] [CrossRef] [Green Version]
- LeCun, Y.; Bottou, L.; Bengio, Y.; Haffner, P. Gradient-based learning applied to document recognition. Proc. IEEE 1998, 86, 2278–2324. [Google Scholar] [CrossRef] [Green Version]
- El-Sawy, A.; EL-Bakry, H.; Loey, M. CNN for Handwritten Arabic Digits Recognition Based on LeNet-5 BT. In Proceedings of the International Conference on Advanced Intelligent Systems and Informatics 2016, Cairo, Egypt, 24–26 October 2016; Hassanien, A.E., Shaalan, K., Gaber, T., Azar, A.T., Tolba, M.F., Eds.; Springer International Publishing: Cham, Switzerland, 2017; pp. 566–575. [Google Scholar]
- Fan, Y.; Rui, X.; Poslad, S.; Zhang, G.; Yu, T.; Xu, X.; Song, X. A better way to monitor haze through image based upon the adjusted LeNet-5 CNN model. Signal Image Video Process. 2019, 14, 455–463. [Google Scholar] [CrossRef]
- Zhang, C.; Yue, X.; Wang, R.; Li, N.; Ding, Y. Study on Traffic Sign Recognition by Optimized Lenet-5 Algorithm. Int. J. Pattern Recognit. Artif. Intell. 2020, 34, 158–165. [Google Scholar] [CrossRef]
- Krinitskiy, M.; Verezemskaya, P.; Grashchenkov, K.; Tilinina, N.; Gulev, S.; Lazzara, M. Deep Convolutional Neural Networks Capabilities for Binary Classification of Polar Mesocyclones in Satellite Mosaics. Atmosphere 2018, 9, 426. [Google Scholar] [CrossRef] [Green Version]
- Hridayami, P.; Putra, K.G.D.; Wibawa, K.S. Fish Species Recognition Using VGG16 Deep Convolutional Neural Network. J. Comput. Sci. Eng. 2019, 13, 124–130. [Google Scholar] [CrossRef]
Publisher’s Note: MDPI stays neutral with regard to jurisdictional claims in published maps and institutional affiliations. |
© 2022 by the authors. Licensee MDPI, Basel, Switzerland. This article is an open access article distributed under the terms and conditions of the Creative Commons Attribution (CC BY) license (https://creativecommons.org/licenses/by/4.0/).