
Modeling Effects of Atmospheric Nitrogen Deposition on the Water Quality of the MR-SNWDP


Abstract
:1. Introduction
2. Study Areas
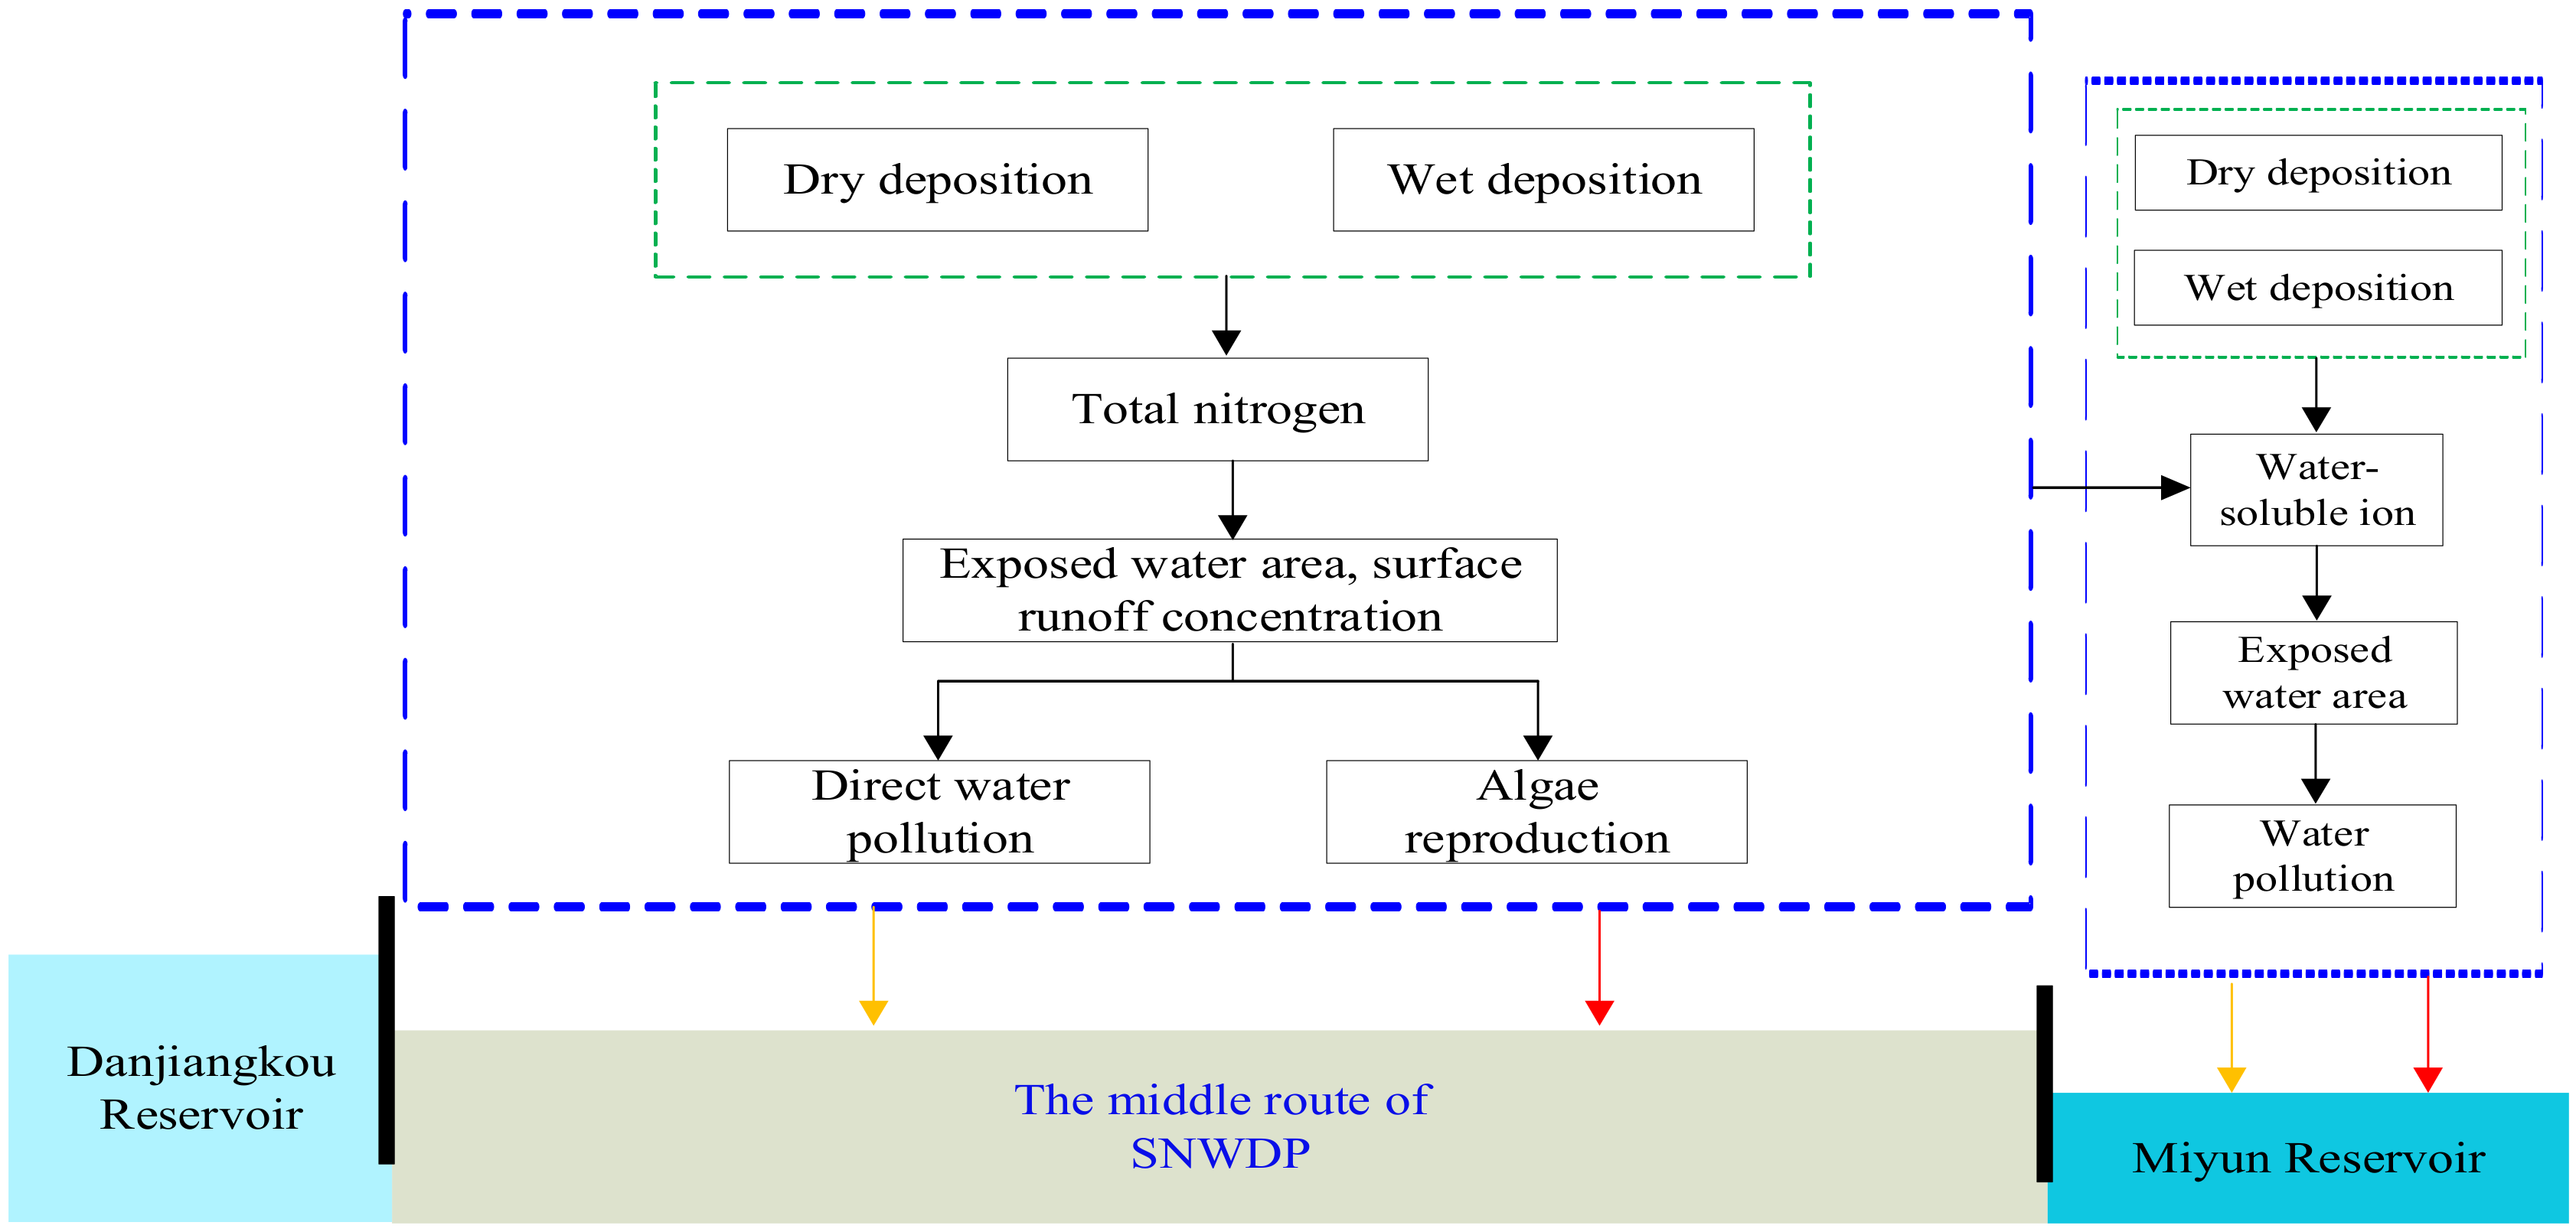
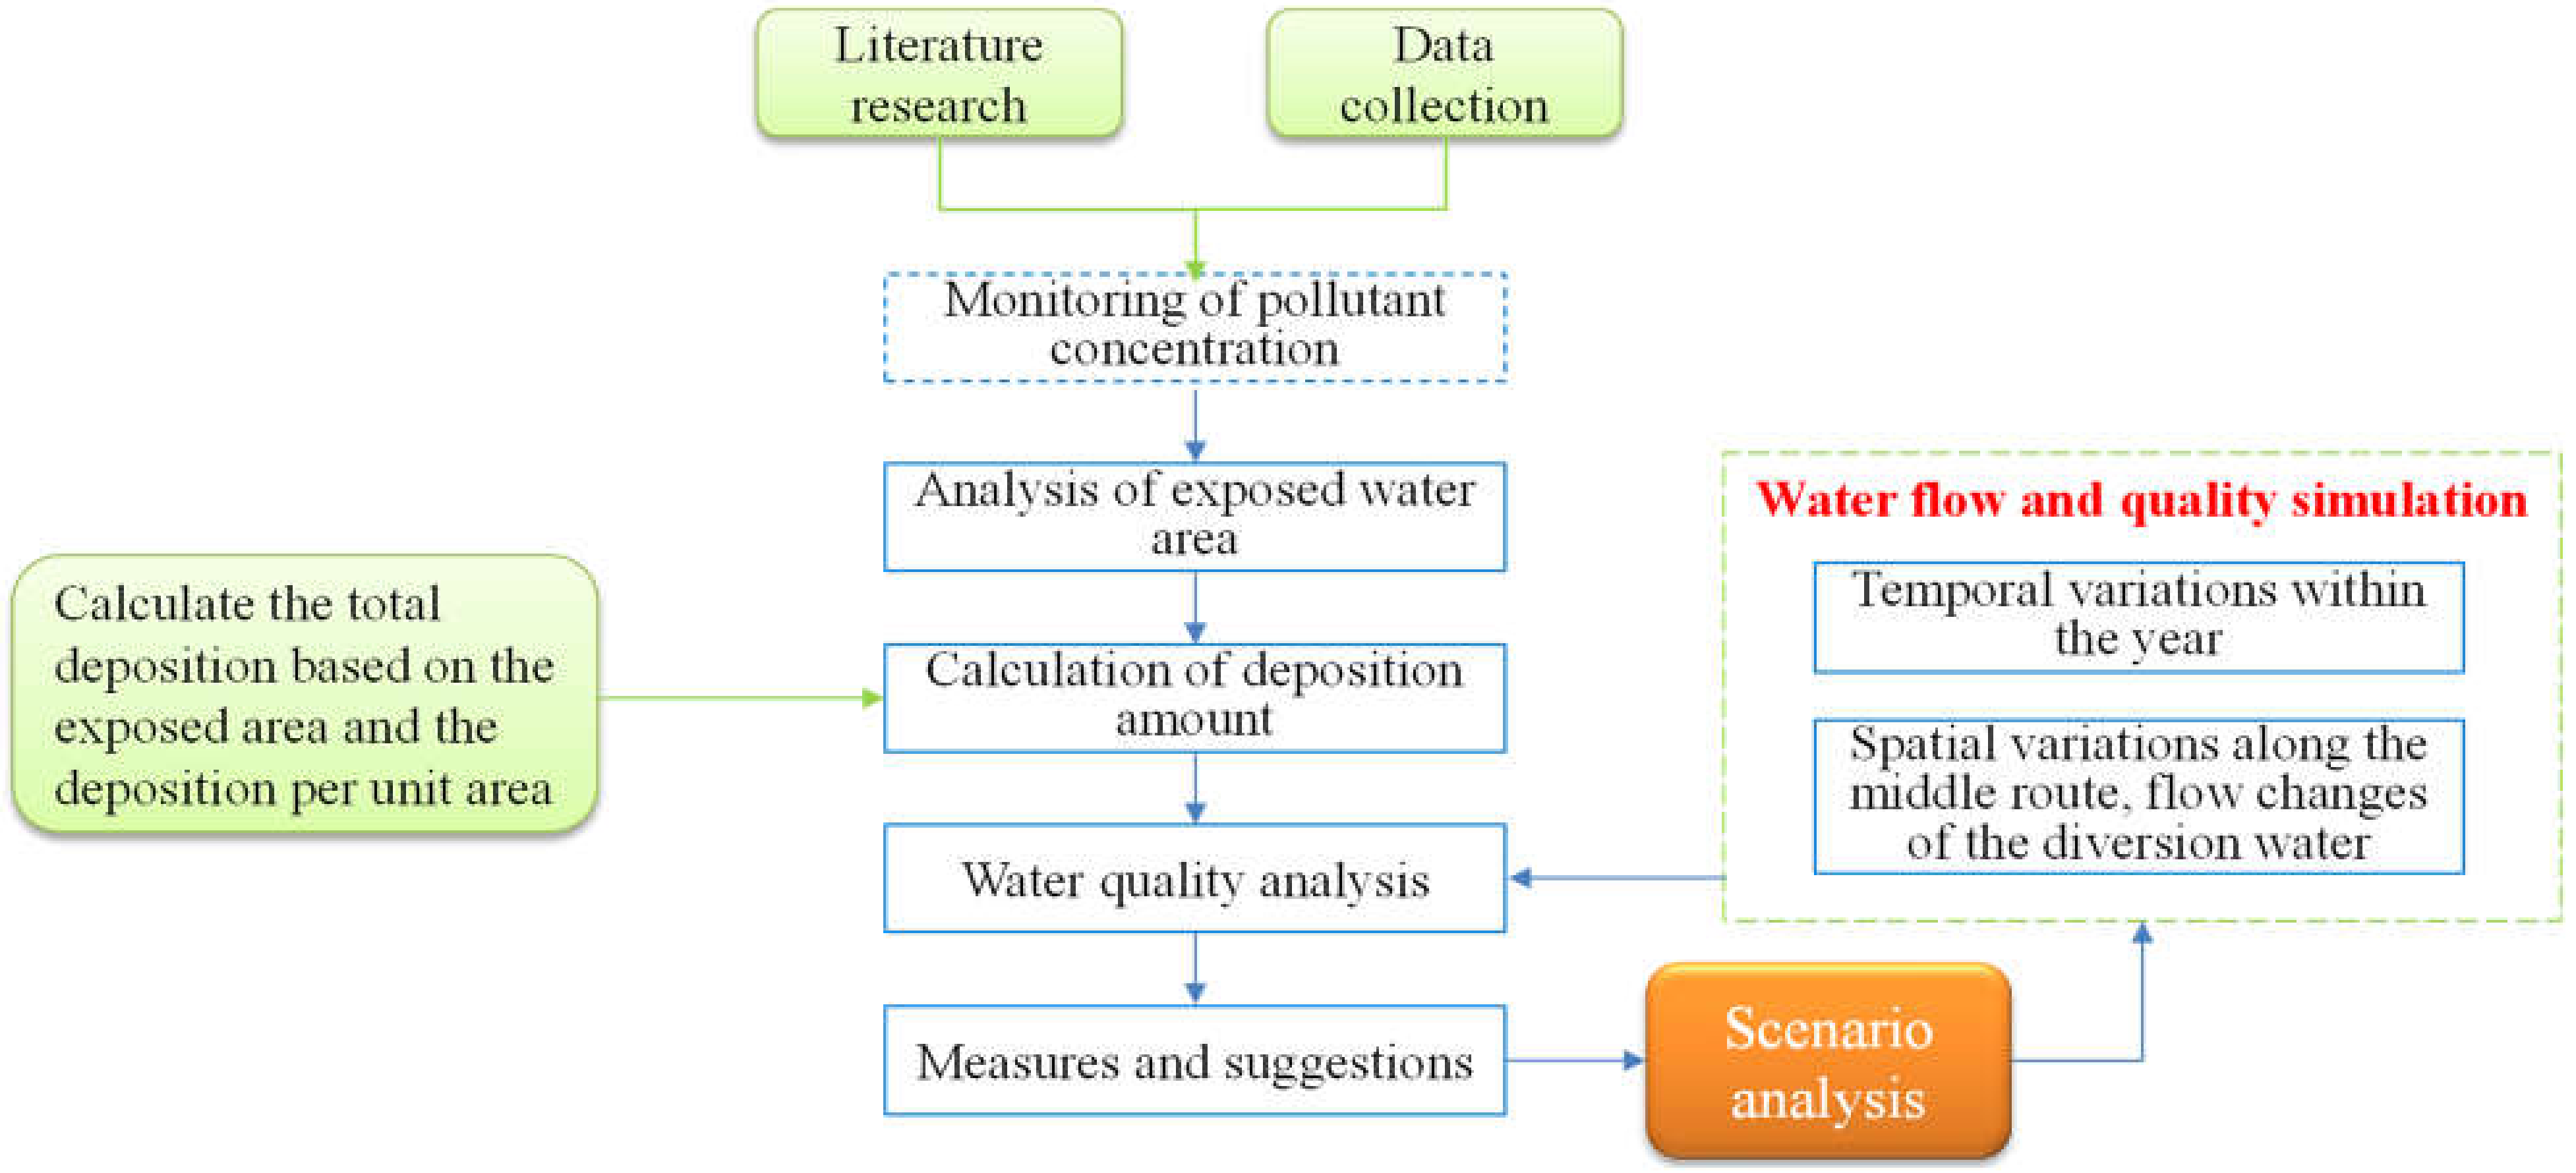
3. Methods
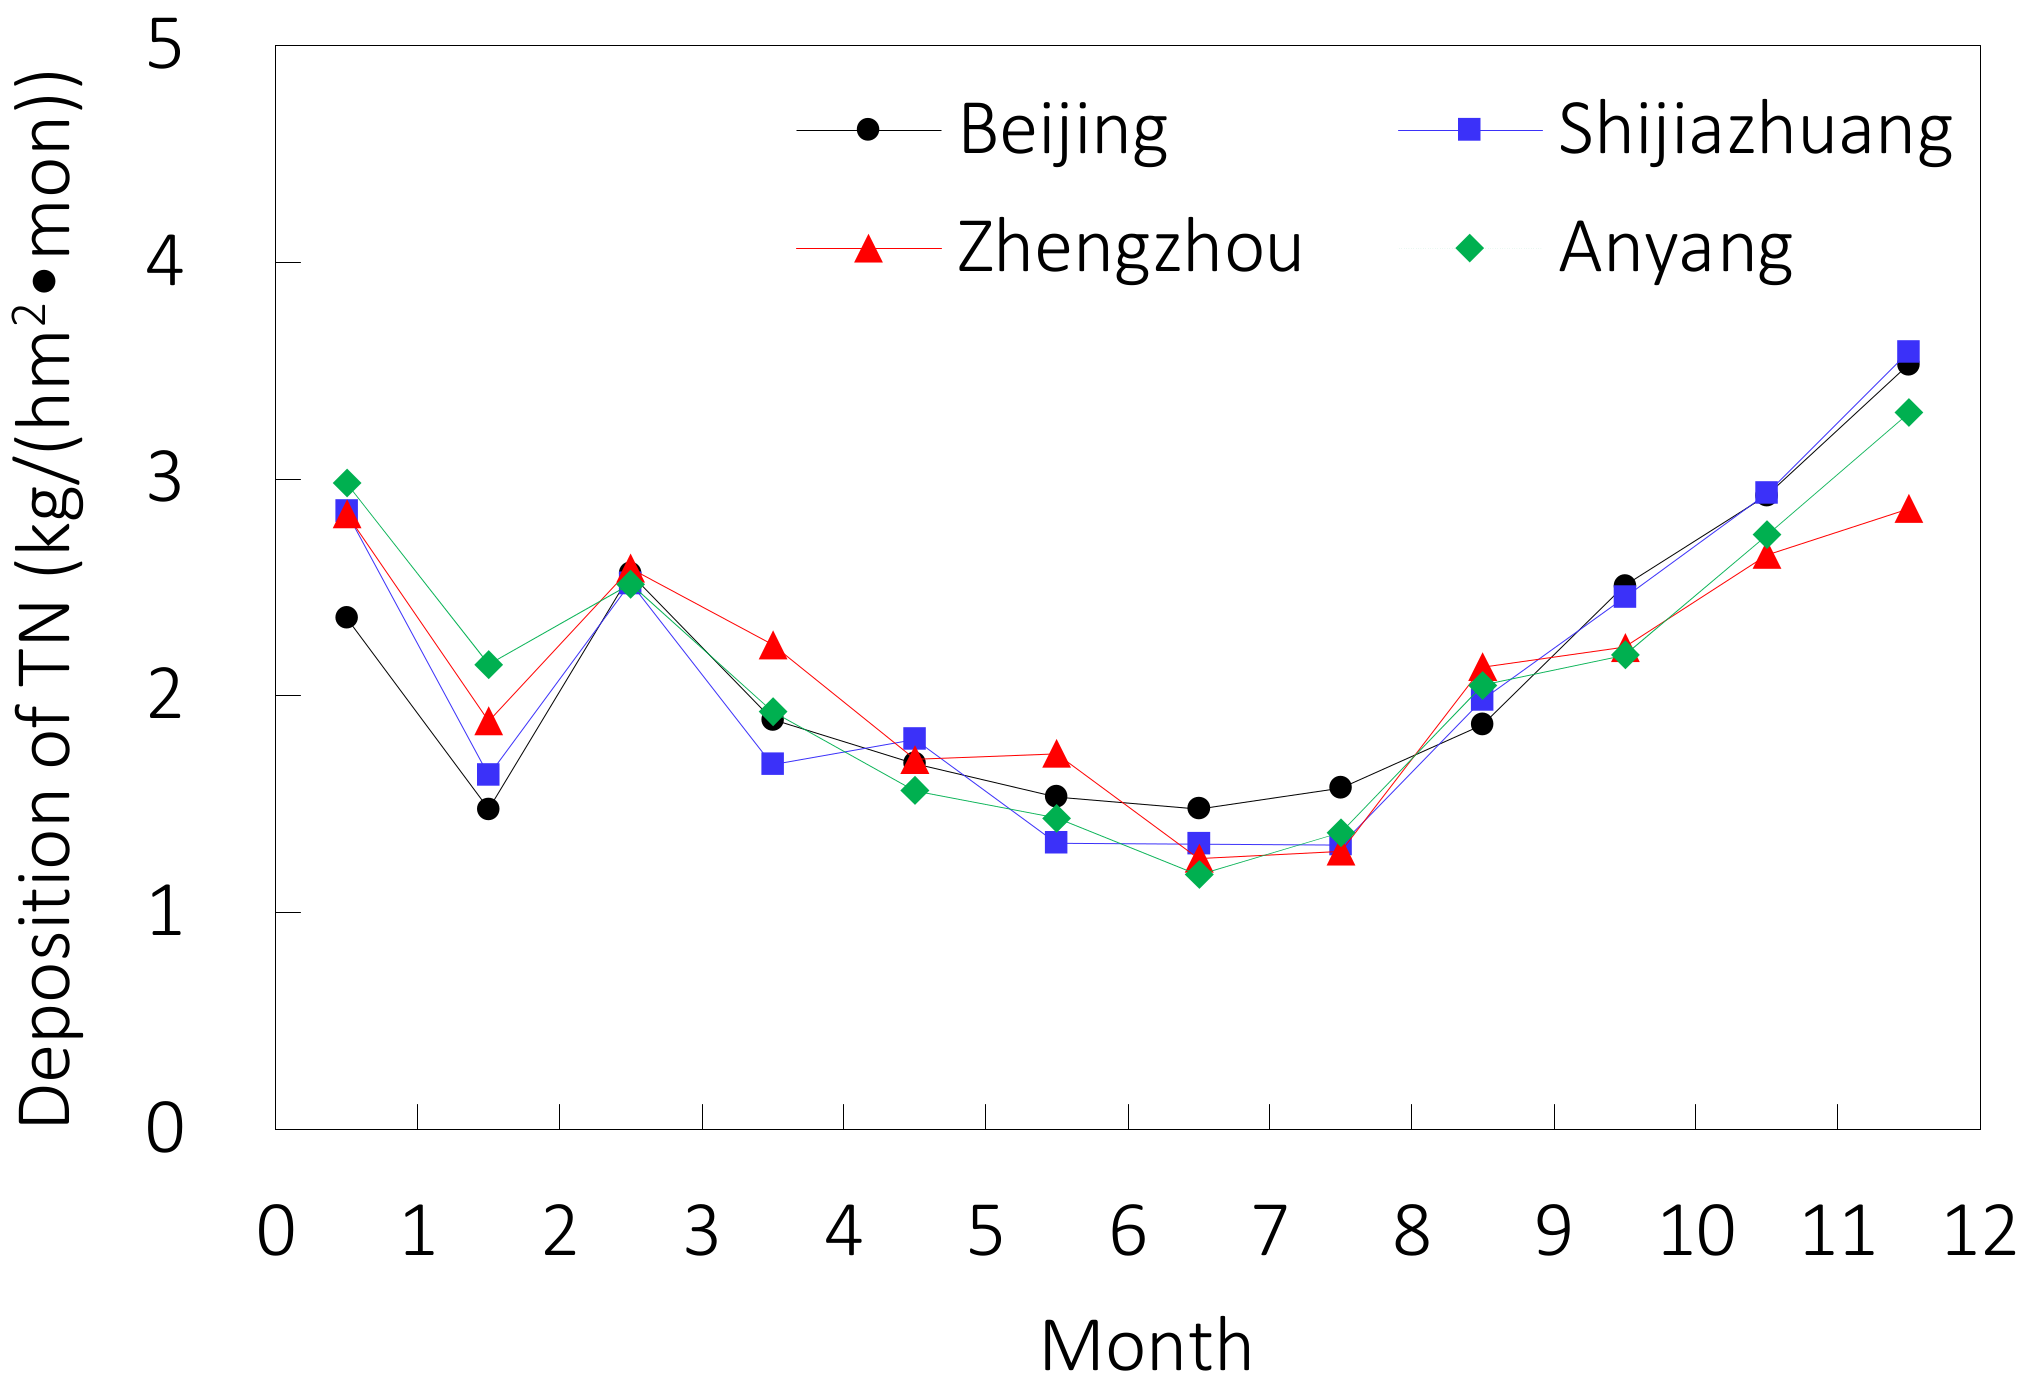
3.1. Atmospheric Deposition Model
3.1.1. Dry Deposition
3.1.2. Wet Deposition
3.2. Water Flow and Quality Model of the Middle Route
3.2.1. Water Flow Model
3.2.2. Water Quality Model
3.3. Water Flow and Quality Model of the Miyun Reservoir
3.3.1. Water Flow Model
3.3.2. Water Quality Model
4. Results
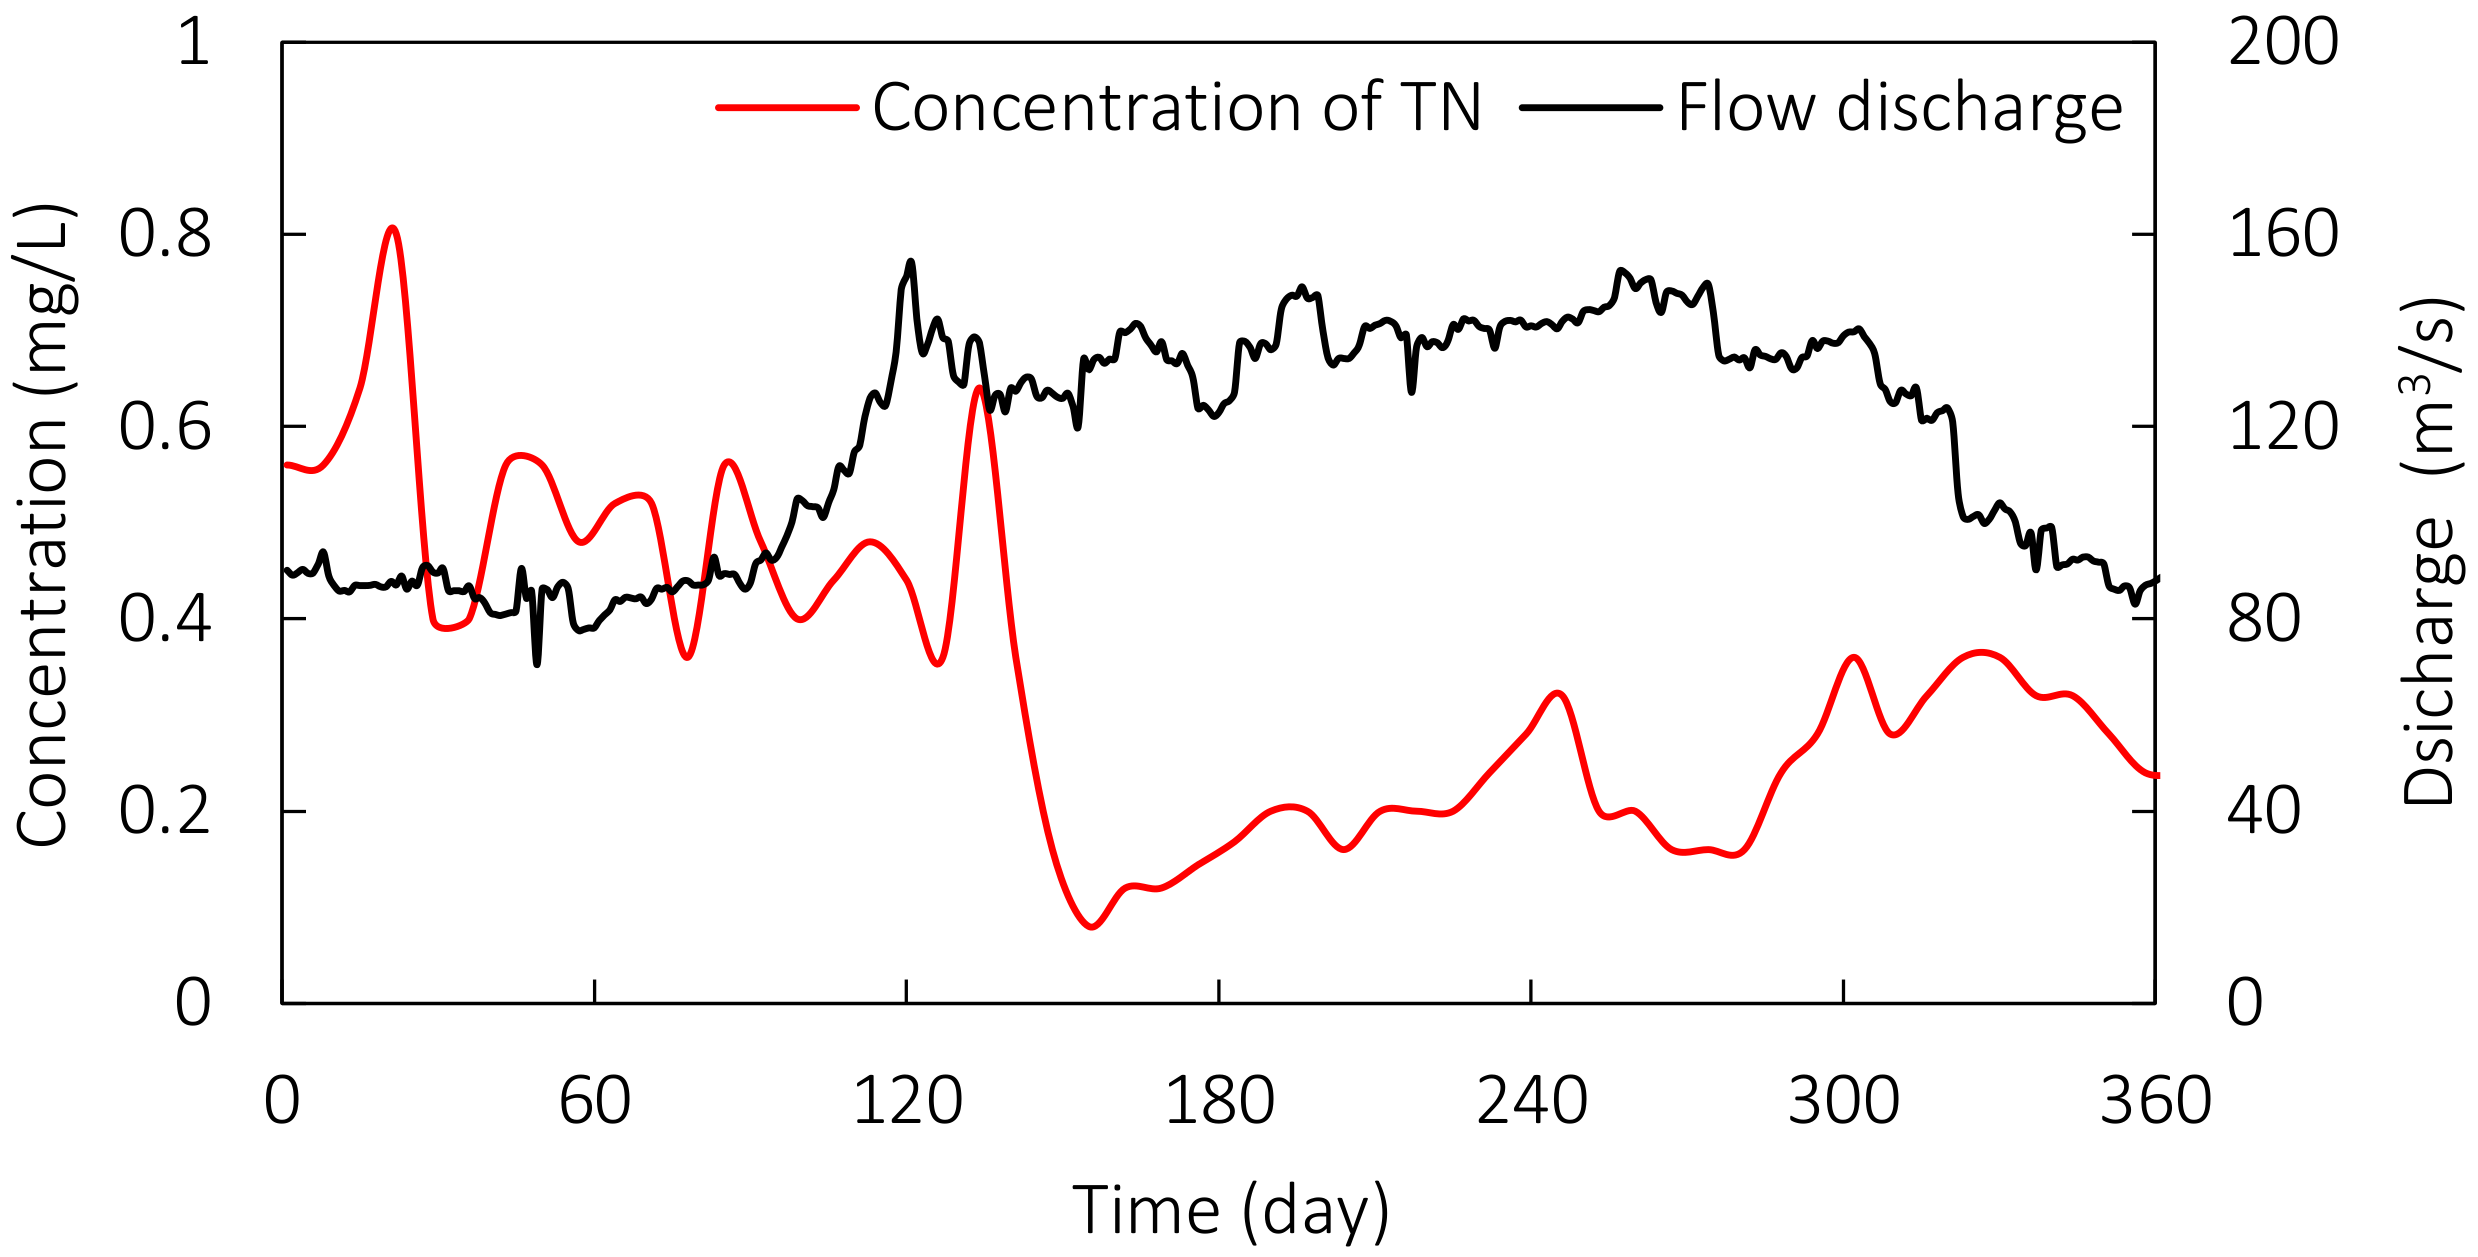
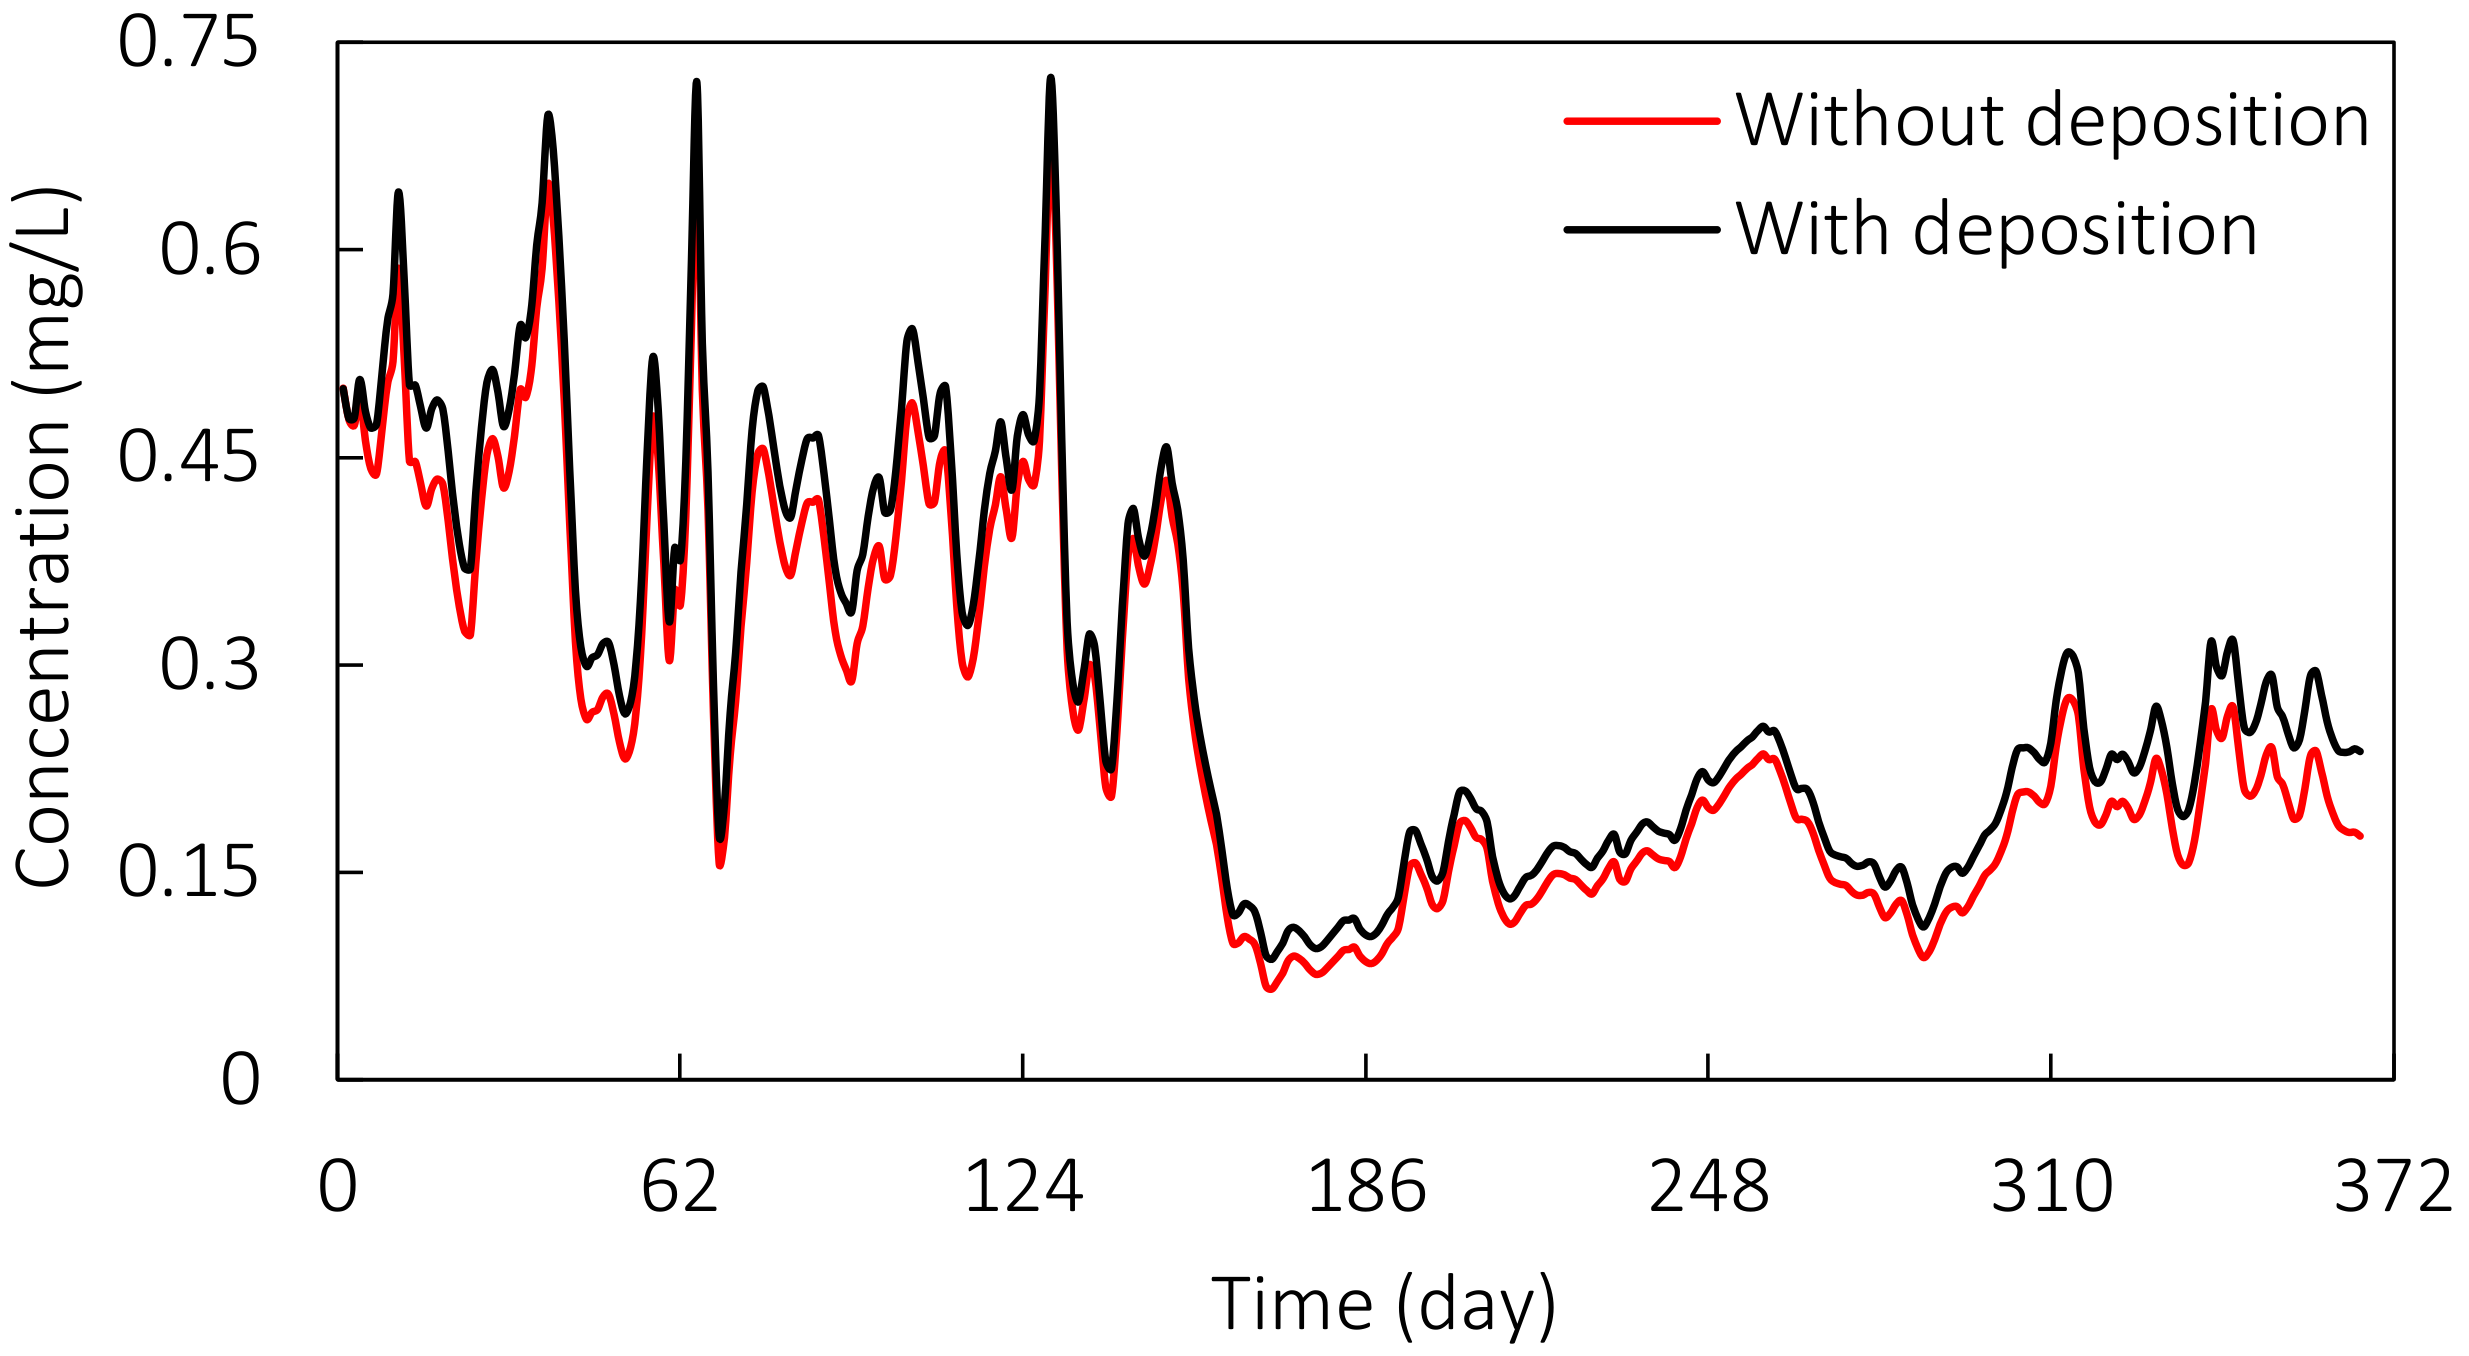
4.1. Water Quality Analysis of the Middle Route under Atmospheric Deposition
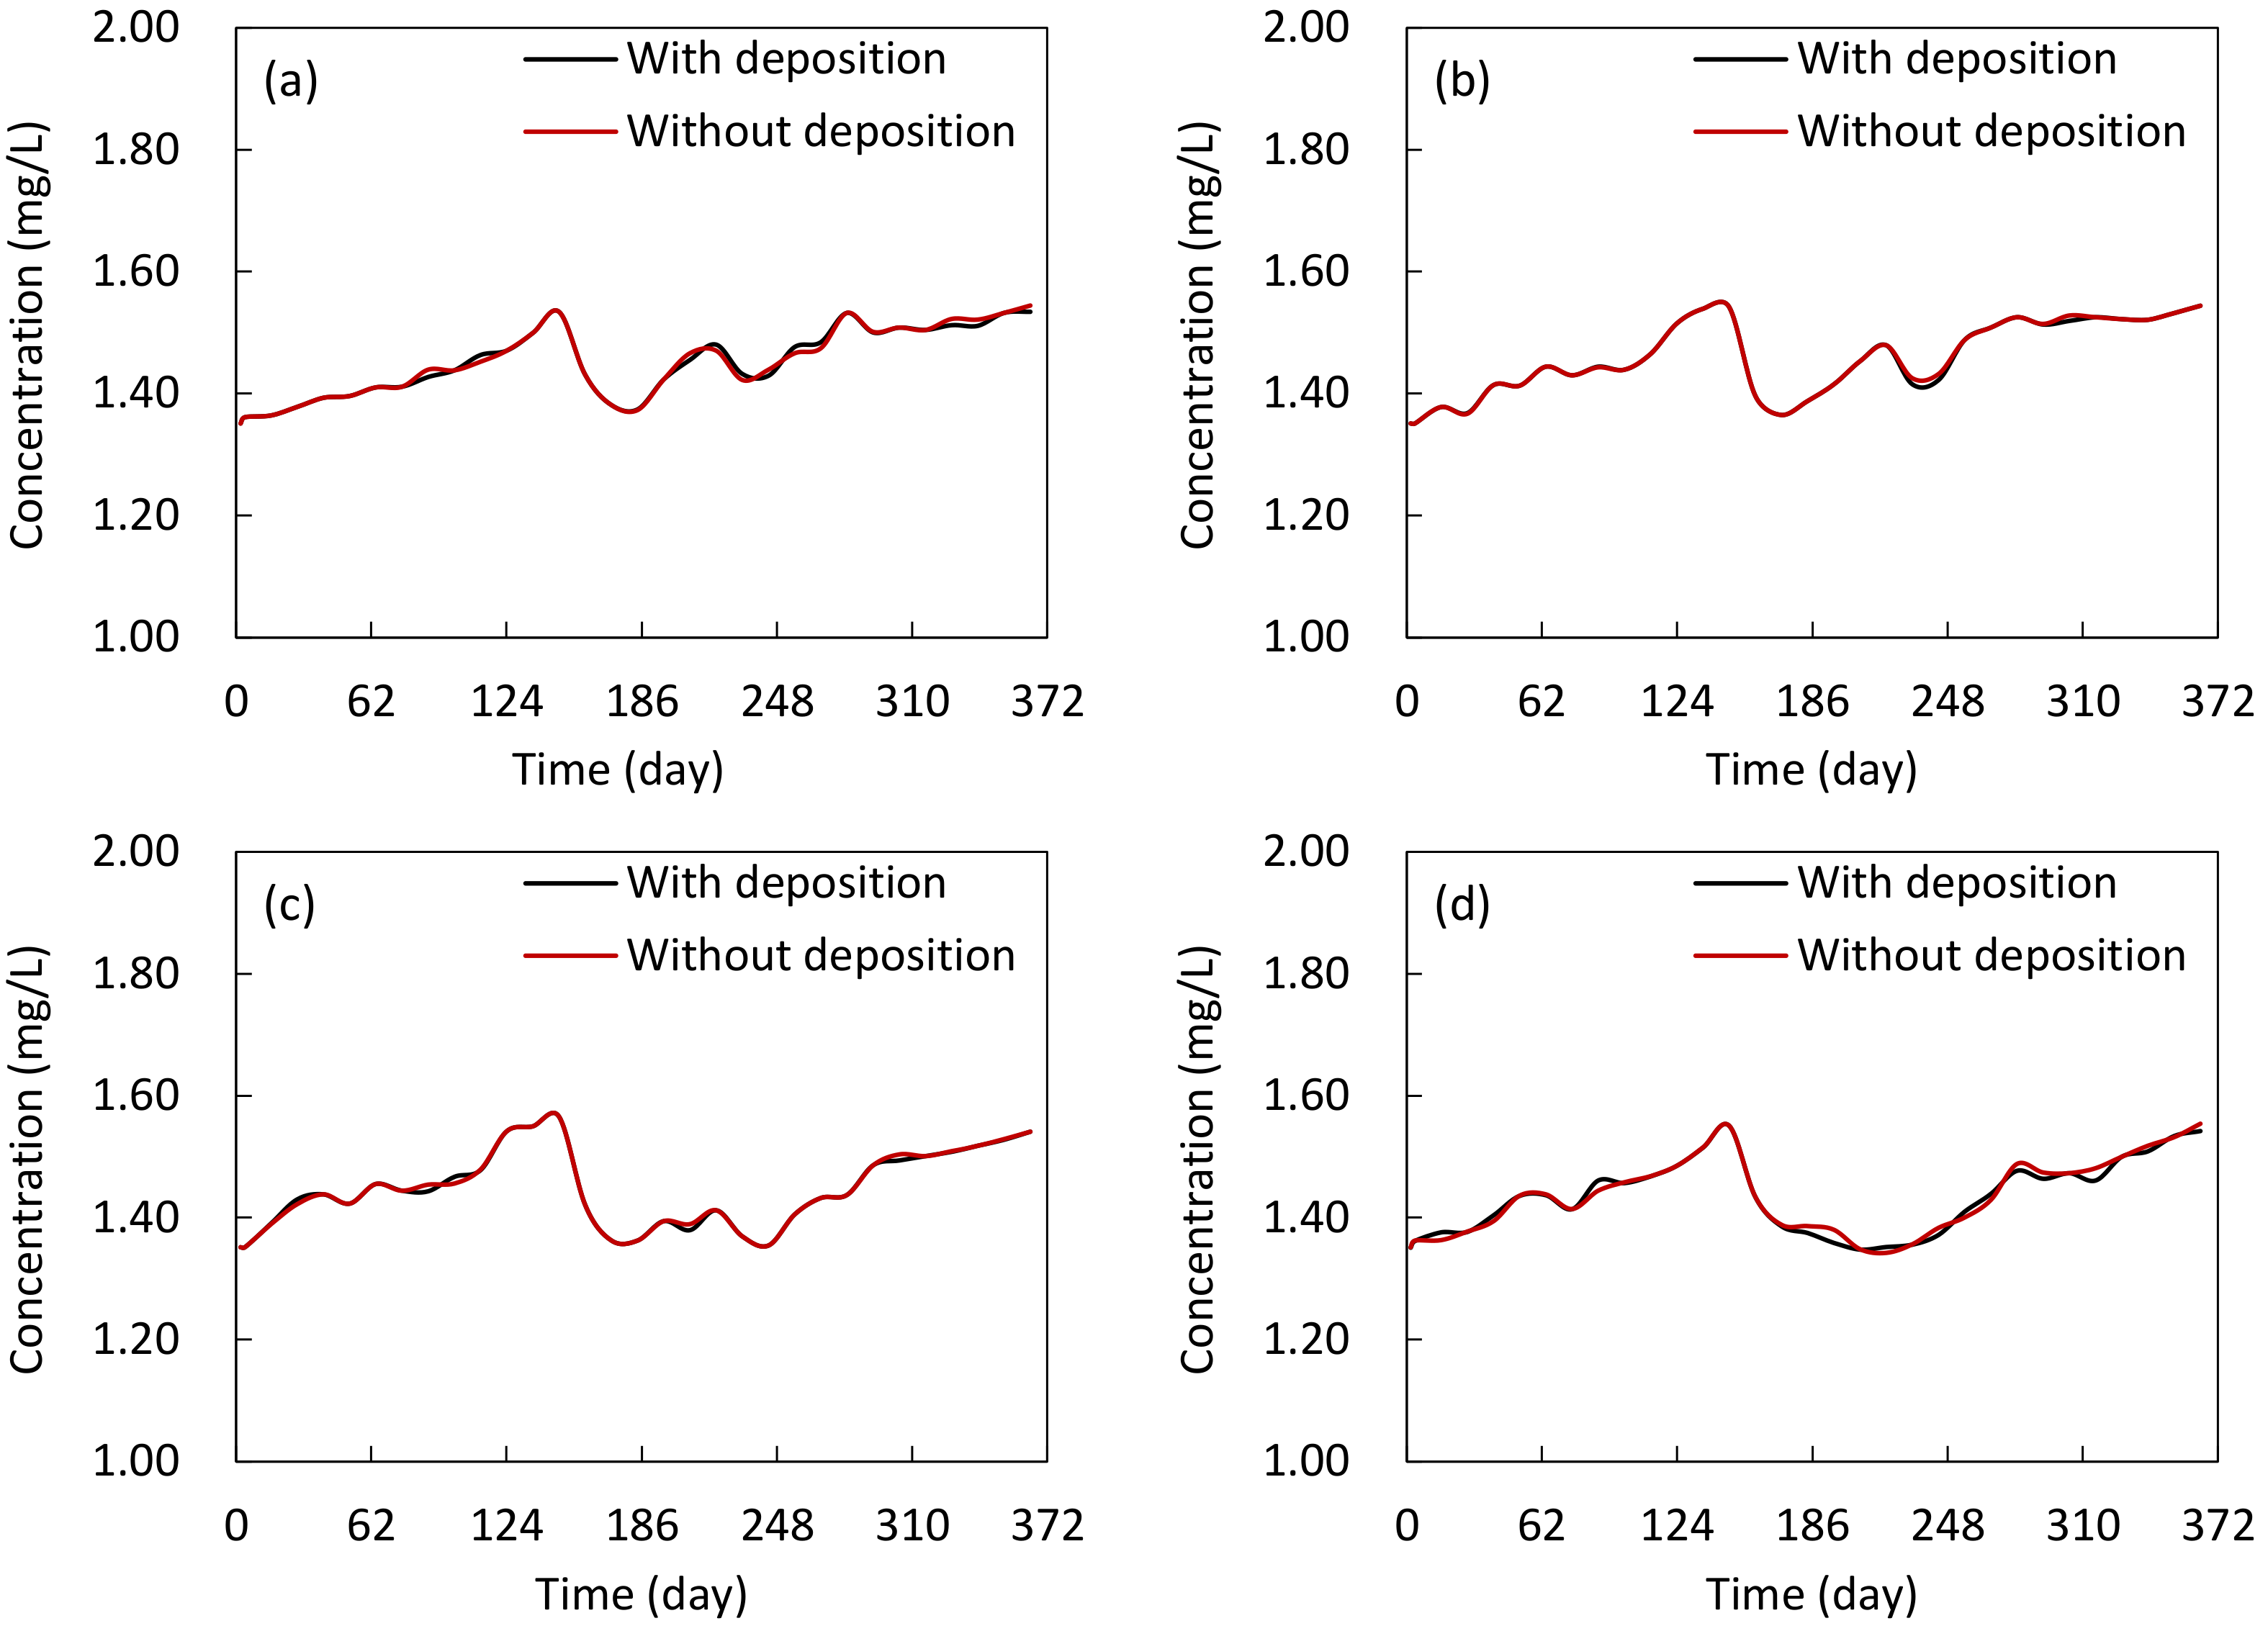
4.2. Water Quality Analysis in the Miyun Reservoir under Atmospheric Deposition
5. Discussion
6. Conclusions
Author Contributions
Funding
Acknowledgments
Conflicts of Interest
References
- Liu, W.Z.; Wang, X.Y.; Fan, Y.B. A review of atmospheric nitrogen deposition and its estimated contributions to nitrogen input of waters. Environ. Pollut. Control 2014, 36, 88–93, 101. (In Chinese) [Google Scholar] [CrossRef]
- Pan, Y.P.; Wang, Y.S.; Tang, G.Q.; Wu, D. Wet and dry deposition of atmospheric nitrogen at ten sites in Northern China. Atmos. Chem. Phys. 2012, 12, 6515–6535. [Google Scholar] [CrossRef] [Green Version]
- Wesely, M.L.; Hicks, B.B. A review of the current status of knowledge on dry deposition. Atmos. Environ. 2000, 34, 2261–2282. [Google Scholar] [CrossRef]
- Gao, Y.; Jia, Y.; Yu, G.; He, N.; Zhang, L.; Zhu, B.; Wang, Y. Anthropogenic reactive nitrogen deposition and associated nutrient limitation effect on gross primary productivity in inland water of China. J. Clean. Prod. 2019, 208, 530–540. [Google Scholar] [CrossRef]
- Liu, X.; Zhang, Y.; Han, W.; Tang, A.; Shen, J.; Cui, J.; Vitousek, P.; Erisman, J.W.; Goulding, K.W.T.; Christie, P.; et al. Enhanced nitrogen deposition over China. Nature 2013, 494, 459–462. [Google Scholar] [CrossRef]
- Liu, X.; Xu, W.; Sha, Z.; Zhang, Y.; Wen, Z.; Wang, J.; Zhang, F.; Goulding, K.W.T. A green eco-environment for sustainable development—Framework and action. Front. Agric. Sci. Eng. 2020, 7, 67–74. [Google Scholar] [CrossRef] [Green Version]
- Pan, Y.P.; Wang, Y.S.; Tang, G.Q.; Wu, D. Spatial distribution and temporal variations of atmospheric sulfur deposition in northern china: Insights into the potential acidification risks. Atmos. Chem. Phys. 2013, 13, 1675–1688. [Google Scholar] [CrossRef] [Green Version]
- Wang, Z.; Zhang, X.; Liu, L.; Cheng, M.; Xu, J. Spatial and seasonal patterns of atmospheric nitrogen deposition in North China. Atmos. Ocean. Sci. Lett. 2020, 13, 188–194. [Google Scholar] [CrossRef]
- Yu, G.; Jia, Y.; He, N.; Zhu, J.; Chen, Z.; Wang, Q.; Piao, S.; Liu, X.; He, H.; Guo, X.; et al. Stabilization of atmospheric nitrogen deposition in China over the past decade. Nat. Geosci. 2019, 12, 424–429. [Google Scholar] [CrossRef]
- Wen, Z.; Xu, W.; Li, Q.; Han, M.; Tang, A.; Zhang, Y.; Luo, X.; Shen, J.; Wang, W.; Li, K.; et al. Changes of nitrogen deposition in China from 1980 to 2018. Environ. Int. 2020, 144, 106022. [Google Scholar] [CrossRef]
- Liu, X.; Du, E. An overview of atmospheric reactive nitrogen in China from a global perspective. In Atmospheric Reactive Nitrogen in China; Springer: Singapore, 2020; pp. 1–10. [Google Scholar] [CrossRef]
- Song, H.H.; Jiang, C.M.; Yu, W.T. Basic features and monitoring methodologies of atmospheric nitrogen deposition. Chin. J. Appl. Ecol. 2014, 25, 599–610. (In Chinese) [Google Scholar] [CrossRef]
- Sabin, L.D.; Lim, J.H.; Stolzenbach, K.D.; Schiff, K.C. Contribution of trace metals from atmospheric deposition to stormwater runoff in a small impervious urban catchment. Water Res. 2005, 39, 3929–3937. [Google Scholar] [CrossRef] [PubMed]
- Yu, H.; Zhang, L.; Yan, S.; Li, H.; Xu, J. Atmospheric wet deposition characteristics of nitrogen and phosphorus nutrients in Taihu lake and contributions to the lake. Res. Environ. Sci. 2011, 24, 1210–1219. (In Chinese) [Google Scholar] [CrossRef]
- Pan, Y.P.; Zhu, X.Y.; Tian, S.L.; Wang, L.L.; Zhang, G.Z.; Zhou, Y.B.; Xu, P.; Hu, B.; Wang, Y.S. Wet deposition and scavenging ratio of air pollutants during an extreme rainstorm in the North China Plain. Atmos. Ocean. Sci. Lett. 2017, 10, 348–353. [Google Scholar] [CrossRef] [Green Version]
- Wu, Q.; Cui, S.B.; Luo, H.; Xu, L.Q. Numerical simulation of the contribution of wet atmospheric deposition to the eutrophication of river reservoir for water supply. Pearl River 2014, 35, 8–11. (In Chinese) [Google Scholar] [CrossRef]
- Yang, D.; Xu, X.; Liu, X.; Ding, G.; Xu, Q.; Cheng, X.; Chen, H.; Zhou, H.; Wang, Z.; Wang, W. Integrated sources of air-soil-water pollution in Miyun Reservoir. Sci. China Ser. D Earth Sci. 2005, 35 (Suppl. 1), 195–205. (In Chinese) [Google Scholar] [CrossRef]
- Pitois, S.; Jackson, M.H.; Wood, B.J. Sources of the Eutrophication. J. Environ. Health 2001, 64, 25–32. [Google Scholar]
- Ni, G.; Chen, T.; Zhang, T.; Tian, F.; Xie, Z.; Ma, D.; Han, Z.; Sun, F. Research on critical technologies of joint allocation and regulation of multiple sources of water resources considering the South-to-North Water Diversion. China Water Resour. 2012, S1, 56–58. (In Chinese) [Google Scholar]
- Giardina, M.; Buffa, P. A new approach for modeling dry deposition velocity of particles. Atmos. Environ. 2018, 180, 11–22. [Google Scholar] [CrossRef]
- Figgis, B.; Guo, B.; Javed, W.; Ahzi, S.; Rémond, Y. Dominant environmental parameters for dust deposition and resuspension in desert climates. Aerosol Sci. Technol. 2018, 52, 788–798. [Google Scholar] [CrossRef] [Green Version]
- Wang, J.; Zhao, J.; Lei, X.; Wang, H. New approach for point pollution source identification in rivers based on the backward probability method. Environ. Pollut. 2018, 241, 759–774. [Google Scholar] [CrossRef] [PubMed]
- Lei, X.; Zheng, H.; Shang, Y.; Wang, H. Assessing emergency regulation technology in the middle route of the South-to-North Water Diversion Project, China. Int. J. Water Resour. Dev. 2018, 34, 405–417. [Google Scholar] [CrossRef]
- Guo, R.; Li, Y.B.; Fu, G. Controlling factors of degradation coefficient on organic pollutant in river. J. Meteorol. Environ. 2008, 01, 56–59. (In Chinese) [Google Scholar] [CrossRef]
- Pan, X.; Tang, L.; Feng, J.; Liang, R.; Pu, X.; Li, R.; Li, K. Experimental Research on the Degradation Coefficient of Ammonia Nitrogen Under Different Hydrodynamic Conditions. Bull. Environ. Contam. Toxicol. 2020, 104, 288–292. [Google Scholar] [CrossRef] [PubMed]
- Hamrick, J.M.; Mills, W.B. Analysis of water temperatures in Conowingo Pond as influenced by the peach bottom atomic power plant thermal discharge. Environ. Sci. Policy 2000, 3 (Suppl. 1), 197–209. [Google Scholar] [CrossRef]
- Park, K.; Jung, H.S.; Kim, H.S.; Ahn, S.M. Three-dimensional Hydrodynamic Eutrophication Model (HEM-3D): Application to Kwang-Yang Bay, Korea. Mar. Environ. Res. 2004, 60, 171–193. [Google Scholar] [CrossRef]
- Li, D.Q.; Guo, X.; Liang, J.; Zhao, W.; Zhang, L. Multivariate statistical analysis on spatial variations of water quality of Miyun Reservoir. Wetl. Sci. 2015, 13, 27–34. [Google Scholar] [CrossRef]
- Wang, Y.; Jiang, Y.; Liao, W.; Gao, P.; Huang, X.; Wang, H.; Song, X.; Lei, X. 3-D hydro-environmental simulation of Miyun reservoir, Beijing. J. Hydro-Environ. Res. 2013, 8, 383–395. [Google Scholar] [CrossRef]


| Number of Days of Different Water Quality | ||||||
|---|---|---|---|---|---|---|
| Class I | Class II | Class III | Class IV | Class V | Total | |
| ≤0.2 mg/L | ≤0.5 mg/L | ≤1.0 mg/L | ≤1.5 mg/L | ≤2.0 mg/L | ||
| Without atmospheric deposition | 158 | 193 | 15 | 0 | 0 | 366 |
| With atmospheric deposition | 122 | 212 | 32 | 0 | 0 | 366 |
| Spring | Summer | Autumn | Winter | ||
|---|---|---|---|---|---|
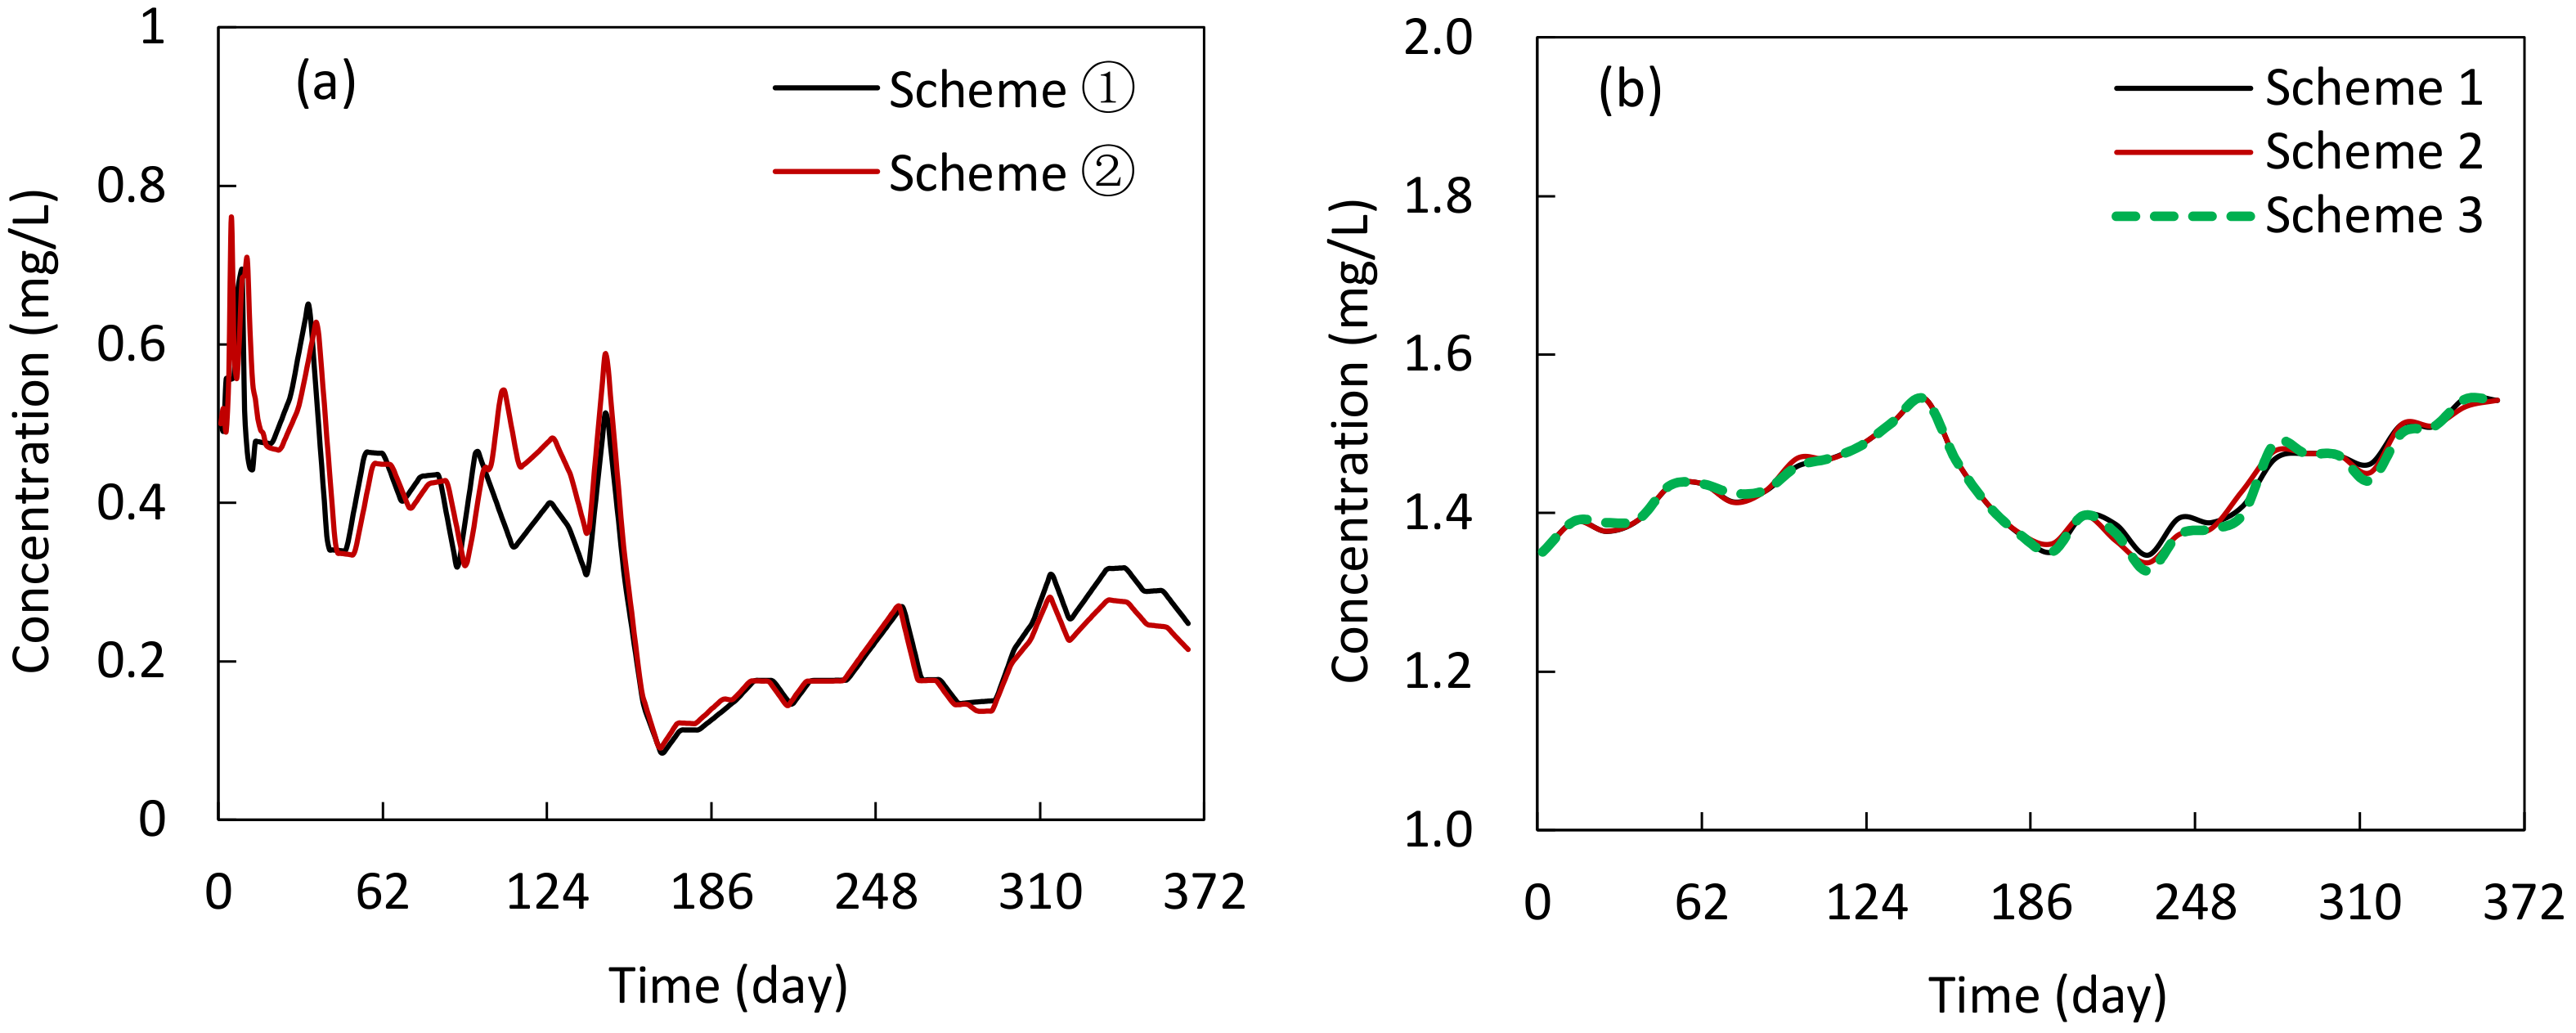
| Water diversion schemes of the middle route (m3/s) | Scheme ① | 200 | 200 | 200 | 200 |
| Scheme ② | 100 | 320 | 300 | 80 | |
| Water regulation schemes of the Miyun Reservoir (m3/s) | Scheme 1 | 10 | 10 | 10 | 10 |
| Scheme 2 | 20 | 20 | 20 | 10 | |
| Scheme 3 | 30 | 10 | 10 | 30 |
| Scheme | Number of Days of Different Water Quality and Peak Concentration (mg/L) at the Outlet of the Middle Route | Number of Days of Different Water Quality and Peak Concentration (mg/L) at Dam of Chaohe | ||||||||
|---|---|---|---|---|---|---|---|---|---|---|
| Class I | Class II | Class III | Class IV | Class V | Peak Concentration | Class I–III | Class IV | Class V | Peak Concentration | |
| ① + 1 | 120 | 222 | 24 | 0 | 0 | 0.694 | 0 | 298 | 68 | 1.554 |
| ① + 2 | 0 | 301 | 65 | 1.558 | ||||||
| ① + 3 | 0 | 299 | 67 | 1.555 | ||||||
| ② + 1 | 120 | 210 | 36 | 0 | 0 | 0.761 | 0 | 294 | 72 | 1.555 |
| ② + 2 | 0 | 296 | 70 | 1.551 | ||||||
| ② + 3 | 0 | 298 | 68 | 1.551 | ||||||
| Flow Discharge (m3/s) | Number of Days of Different Water Quality | |||||
|---|---|---|---|---|---|---|
| Class I | Class II | Class III | Class IV | Class V | Total | |
| 50 | 113 | 225 | 28 | 0 | 0 | 366 |
| 100 | 118 | 222 | 26 | 0 | 0 | 366 |
| 150 | 119 | 222 | 25 | 0 | 0 | 366 |
| 200 | 120 | 222 | 24 | 0 | 0 | 366 |
| 250 | 120 | 222 | 24 | 0 | 0 | 366 |
Publisher’s Note: MDPI stays neutral with regard to jurisdictional claims in published maps and institutional affiliations. |
© 2022 by the authors. Licensee MDPI, Basel, Switzerland. This article is an open access article distributed under the terms and conditions of the Creative Commons Attribution (CC BY) license (https://creativecommons.org/licenses/by/4.0/).
Share and Cite
Wang, J.; Cai, S.; Zhao, J. Modeling Effects of Atmospheric Nitrogen Deposition on the Water Quality of the MR-SNWDP. Atmosphere 2022, 13, 553. https://doi.org/10.3390/atmos13040553
Wang J, Cai S, Zhao J. Modeling Effects of Atmospheric Nitrogen Deposition on the Water Quality of the MR-SNWDP. Atmosphere. 2022; 13(4):553. https://doi.org/10.3390/atmos13040553
Chicago/Turabian StyleWang, Jiabiao, Siyu Cai, and Jianshi Zhao. 2022. "Modeling Effects of Atmospheric Nitrogen Deposition on the Water Quality of the MR-SNWDP" Atmosphere 13, no. 4: 553. https://doi.org/10.3390/atmos13040553
APA StyleWang, J., Cai, S., & Zhao, J. (2022). Modeling Effects of Atmospheric Nitrogen Deposition on the Water Quality of the MR-SNWDP. Atmosphere, 13(4), 553. https://doi.org/10.3390/atmos13040553