
On the Use of Benford’s Law to Assess the Quality of the Data Provided by Lightning Locating Systems

 , , , ,
  and
and 
Abstract
:1. Introduction
2. Materials and Methods
2.1. Benford’s Law
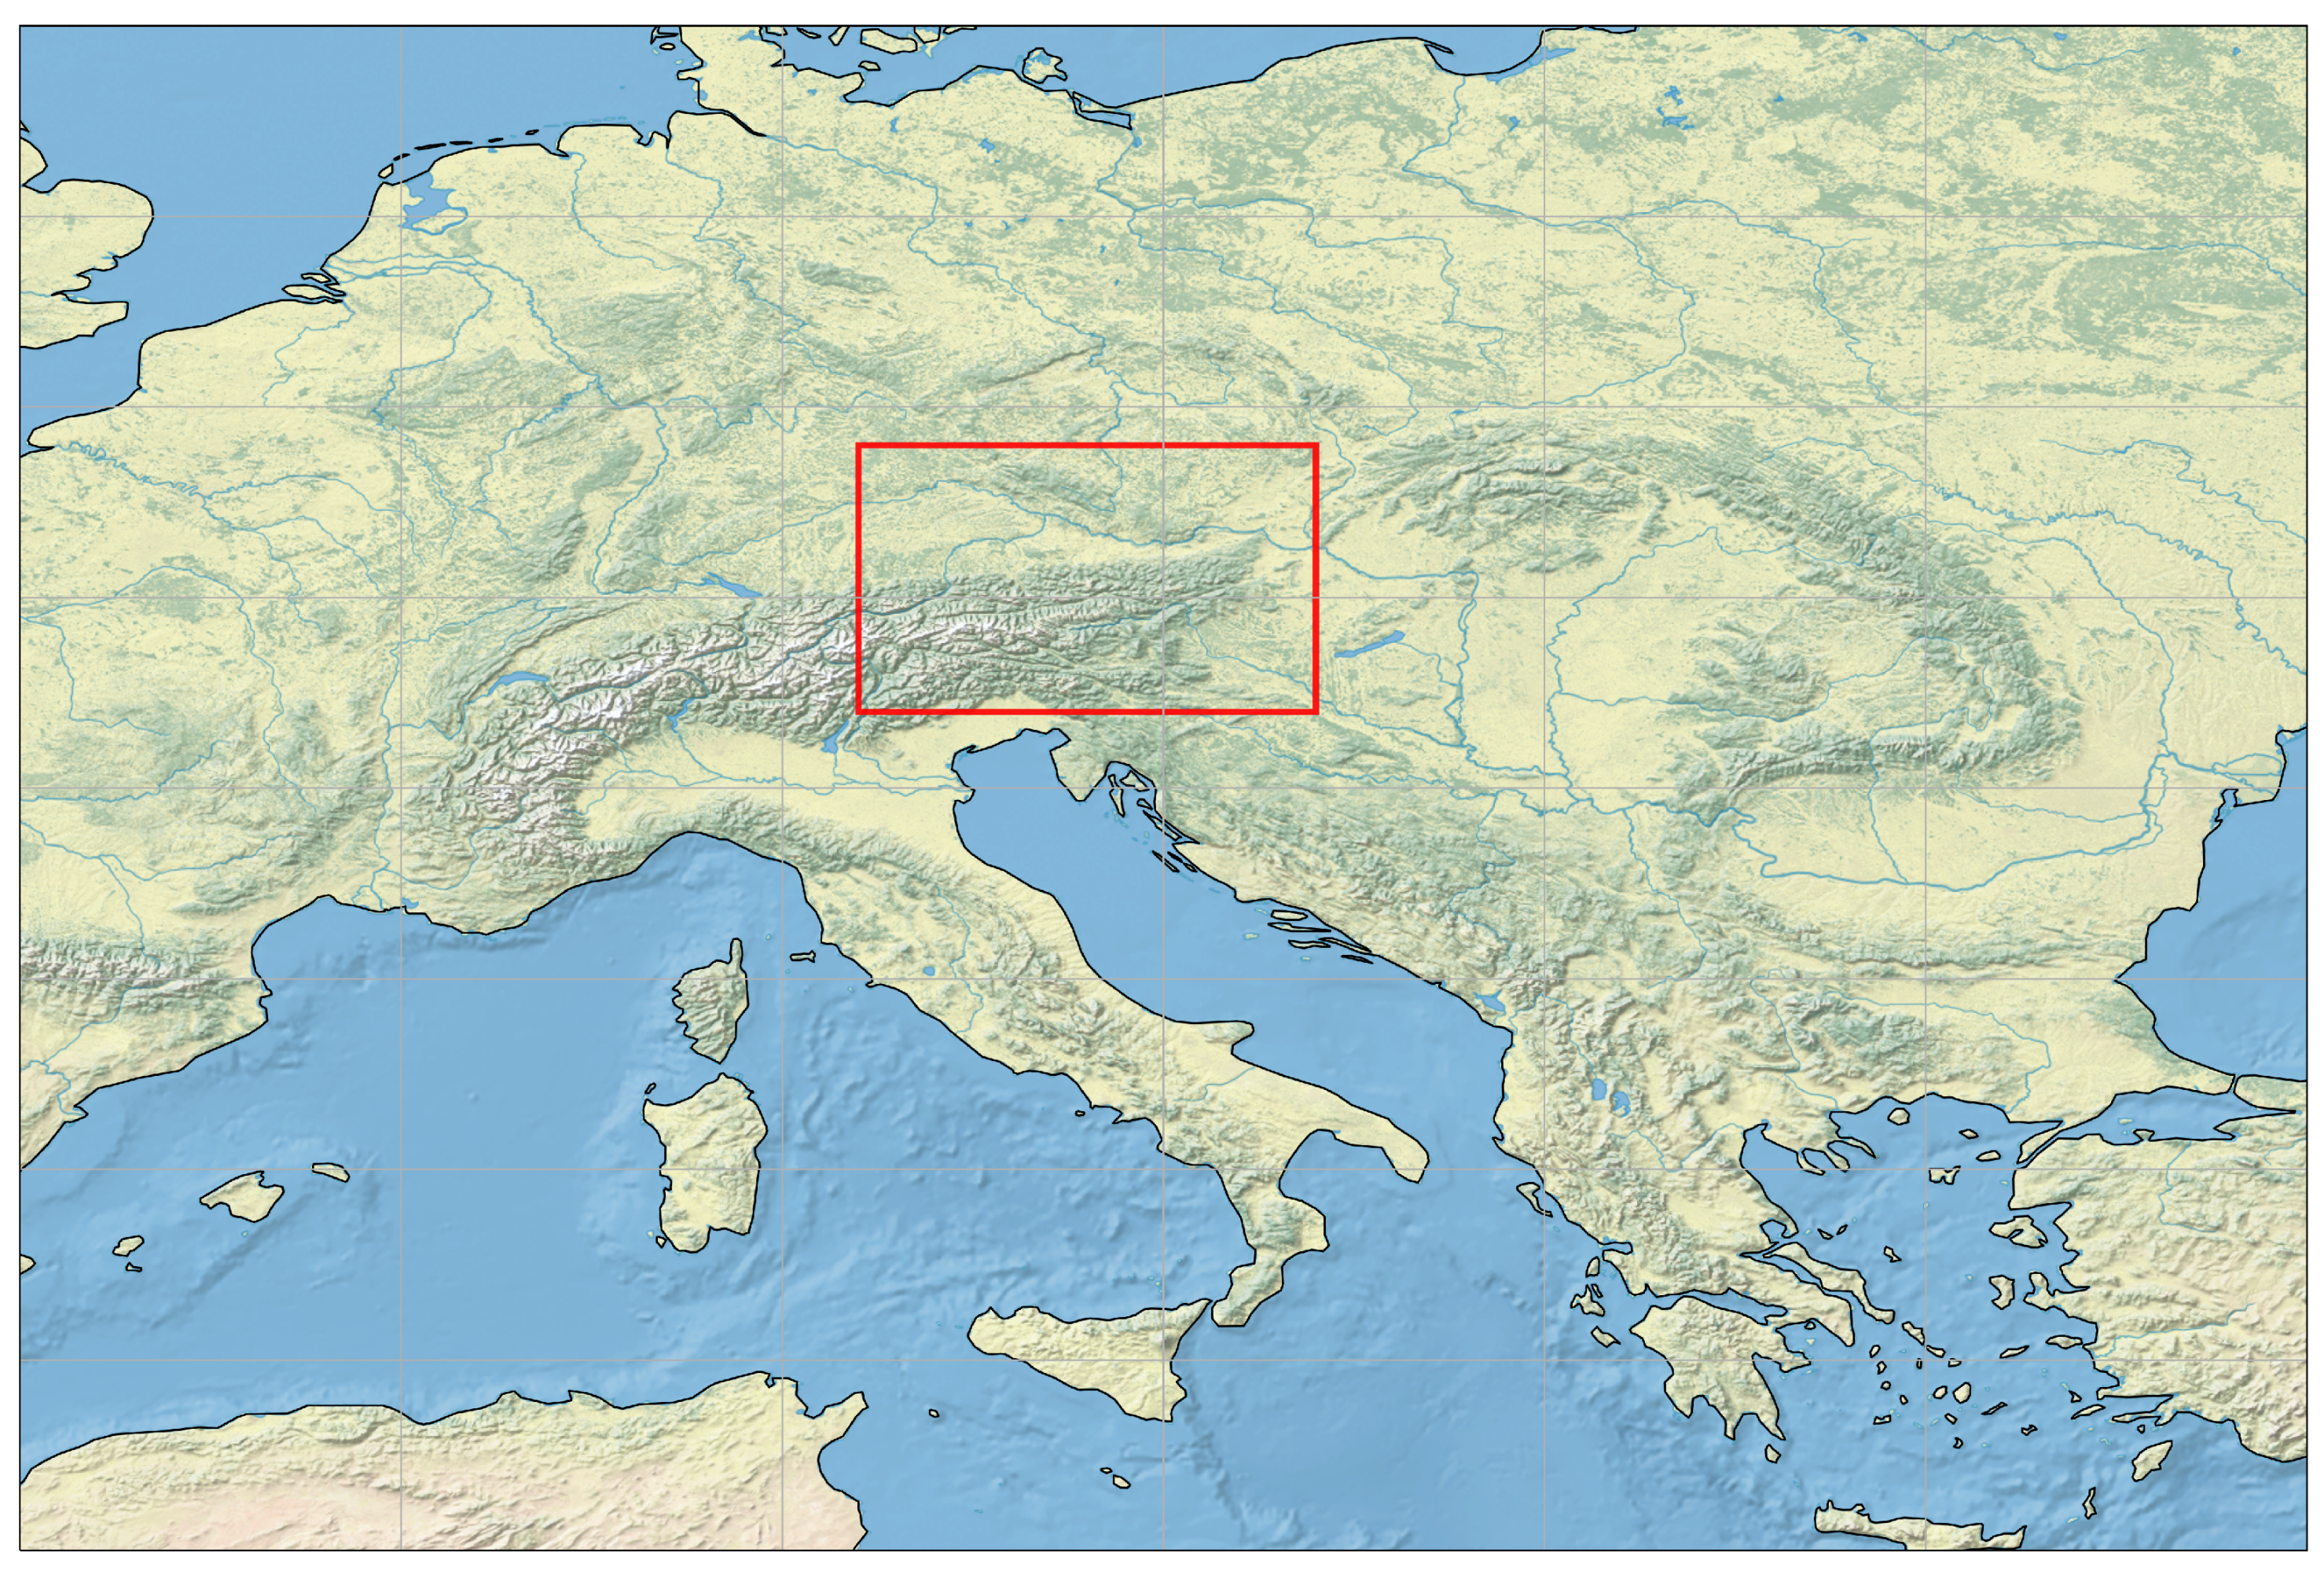
2.2. Data
2.3. Data Preprocessing
2.4. Metric
- if and only if
2.5. Code
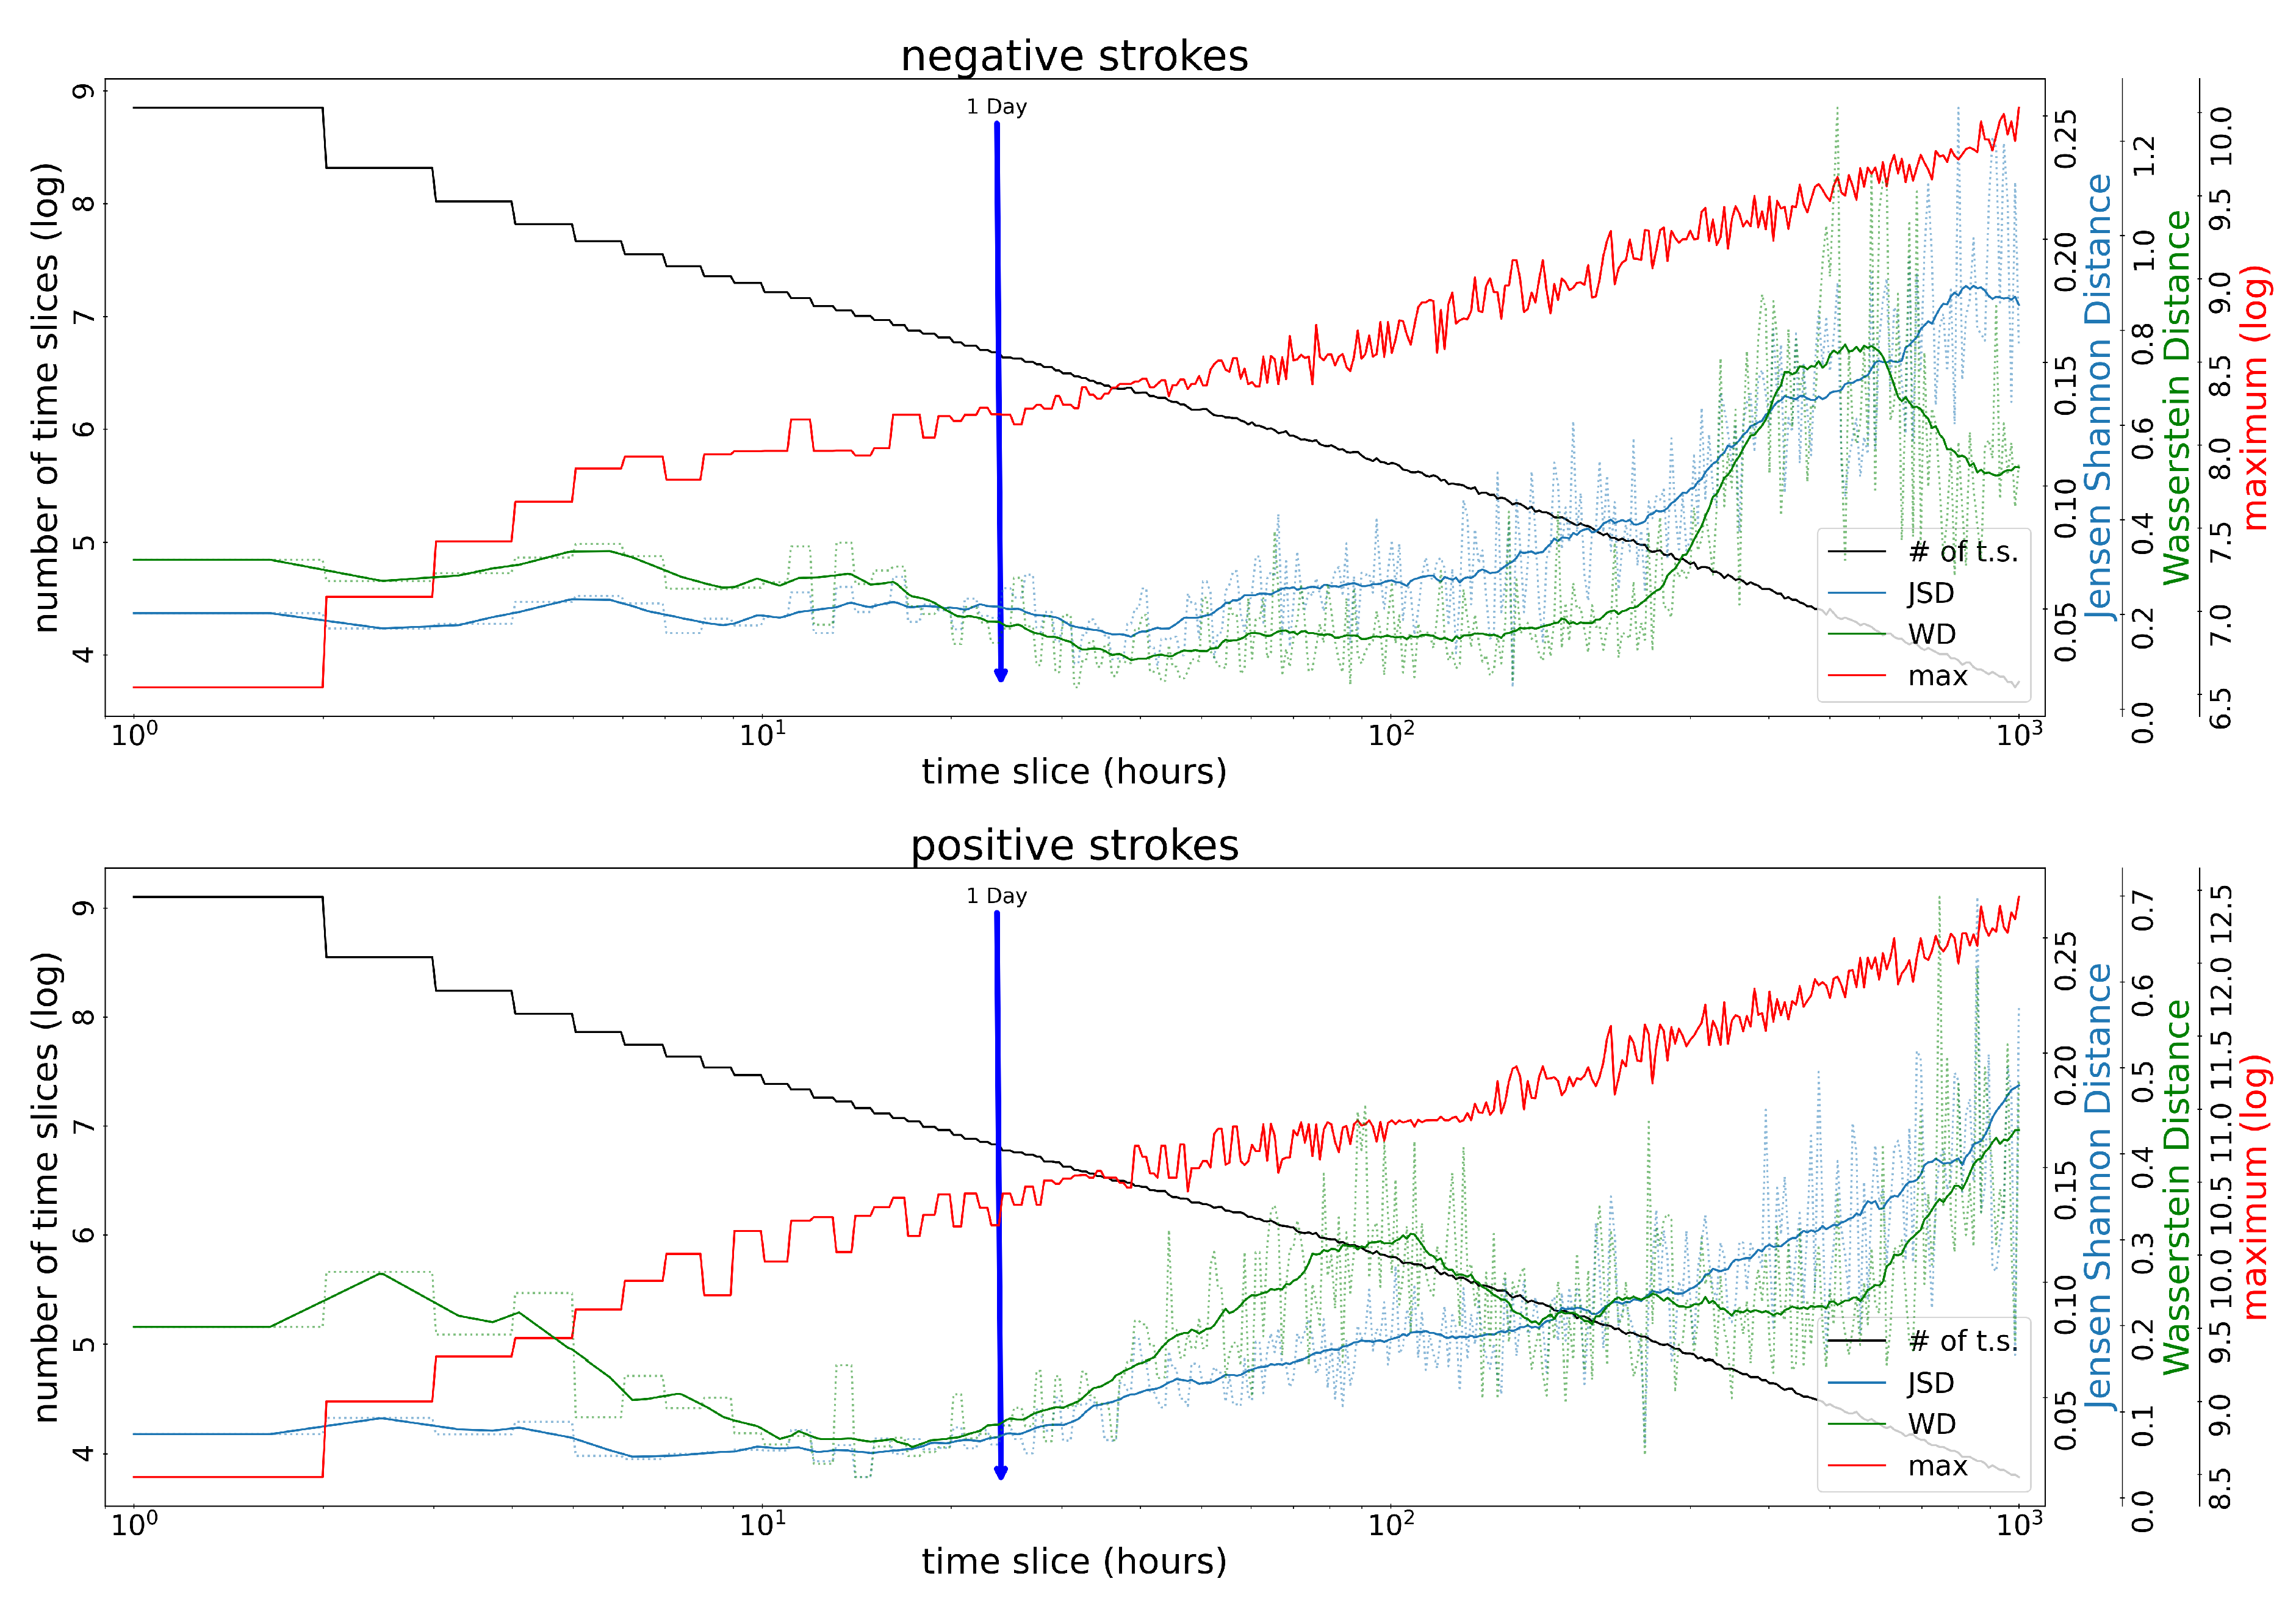
2.6. Selection of the Size of the Time Slice
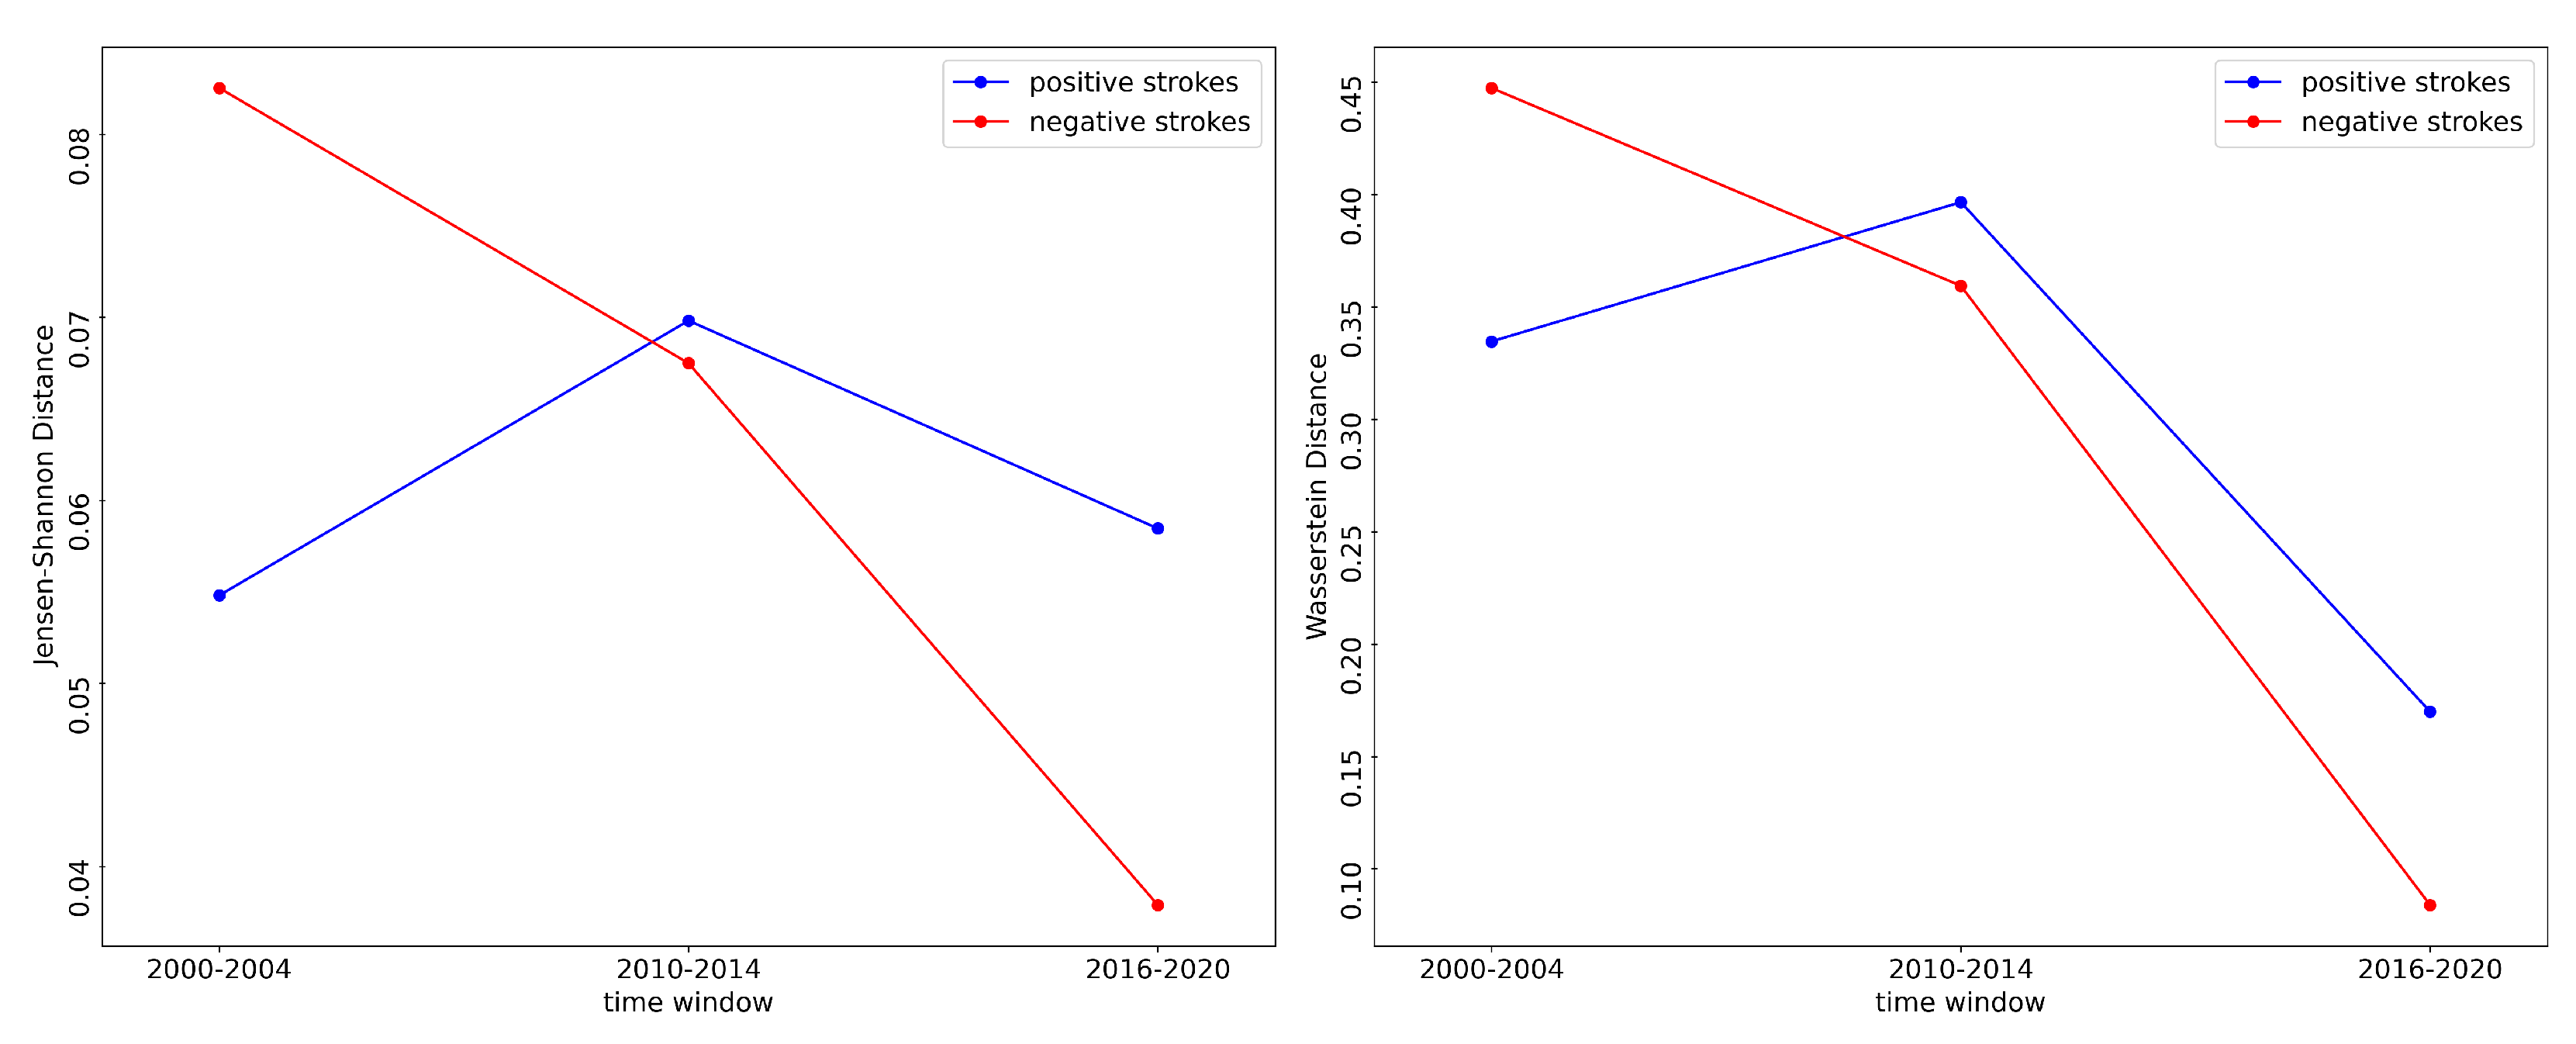
3. Results and Discussion
4. Conclusions
Author Contributions
Funding
Institutional Review Board Statement
Informed Consent Statement
Data Availability Statement
Conflicts of Interest
Abbreviations
| LLS | Lightning Locating System |
| EUCLID | European Cooperation for Lightning Detection |
References
- Cooper, M.A.; Holle, R.L. (Eds.) Current Global Estimates of Lightning Fatalities and Injuries. In Reducing Lightning Injuries Worldwide; Springer Natural Hazards, Springer International Publishing: Cham, Switzerland, 2019; pp. 65–73. [Google Scholar] [CrossRef]
- Cerveny, R.S.; Bessemoulin, P.; Burt, C.C.; Cooper, M.A.; Cunjie, Z.; Dewan, A.; Finch, J.; Holle, R.L.; Kalkstein, L.; Kruger, A.; et al. WMO Assessment of Weather and Climate Mortality Extremes: Lightning, Tropical Cyclones, Tornadoes, and Hail. Weather Clim. Soc. 2017, 9, 487–497. [Google Scholar] [CrossRef]
- Watson, A.I.; Holle, R.L.; López, R.E.; Ortiz, R.; Nicholson, J.R. Surface Wind Convergence as a Short-Term Predictor of Cloud-to-Ground Lightning at Kennedy Space Center. Weather Forecast. 1991, 6, 49–64. [Google Scholar] [CrossRef]
- Watson, A.I.; López, R.E.; Holle, R.L.; Daugherty, J.R. The Relationship of Lightning to Surface Convergence at Kennedy Space Center: A Preliminary Study. Weather Forecast. 1987, 2, 140–157. [Google Scholar] [CrossRef] [Green Version]
- Yokoyama, S.; Honjo, N.; Yasuda, Y.; Member, K. Causes of wind turbine blade damages due to lightning and future research target to get better protection measures. In Proceedings of the 2014 International Conference on Lightning Protection (ICLP), Shanghai, China, 11–18 October 2014; pp. 823–830. [Google Scholar] [CrossRef]
- Curran, E.; Holle, R.; López, R. Lightning Casualties and Damages in the United States from 1959 to 1994. J. Clim. 2000, 13, 3448–3464. [Google Scholar] [CrossRef]
- Nag, A.; Murphy, M.J.; Schulz, W.; Cummins, K.L. Lightning locating systems: Insights on characteristics and validation techniques. Earth Space Sci. 2015, 2, 65–93. [Google Scholar] [CrossRef]
- Newcomb, S. Note on the Frequency of Use of the Different Digits in Natural Numbers. Am. J. Math. 1881, 4, 39–40. [Google Scholar] [CrossRef] [Green Version]
- Formann, A.K. The Newcomb-Benford Law in Its Relation to Some Common Distributions. PLoS ONE 2010, 5, 1–13. [Google Scholar] [CrossRef] [PubMed]
- Sambridge, M.; Tkalčić, H.; Jackson, A. Benford’s law in the natural sciences. Geophys. Res. Lett. 2010, 37, L22301. [Google Scholar] [CrossRef]
- Judge, G.; Schechter, L. Detecting Problems in Survey Data Using Benford’s Law. J. Hum. Resour. 2009, 44, 1–24. [Google Scholar] [CrossRef]
- Deckert, J.; Myagkov, M.; Ordeshook, P.C. Benford’s Law and the Detection of Election Fraud. Political Anal. 2011, 19, 245–268. [Google Scholar] [CrossRef]
- Manoochehrnia, P.; Rachidi, F.; Rubinstein, M.; Schulz, W.; Diendorfer, G. Benford’s law and lightning data. In Proceedings of the 2010 30th International Conference on Lightning Protection (ICLP), Cagliari, Italy, 13–17 September 2010; pp. 1–3. [Google Scholar] [CrossRef]
- Benford, F. The Law of Anomalous Numbers. Proc. Am. Philos. Soc. 1938, 78, 551–572. [Google Scholar]
- Fewster, R.M. A Simple Explanation of Benford’s Law. Am. Stat. 2009, 63, 26–32. [Google Scholar] [CrossRef] [Green Version]
- Rakov, V.A.; Uman, M.A. Lightning: Physics and Effects; Cambridge University Press: Cambridge, UK, 2003. [Google Scholar]
- Schulz, W.; Diendorfer, G.; Pedeboy, S.; Poelman, D.R. The European lightning location system EUCLID—Part 1: Performance analysis and validation. Nat. Hazards Earth Syst. Sci. 2016, 16, 595–605. [Google Scholar] [CrossRef] [Green Version]
- Romps, D.M.; Seeley, J.T.; Vollaro, D.; Molinari, J. Projected increase in lightning strikes in the United States due to global warming. Science 2014, 346, 851–854. [Google Scholar] [CrossRef] [PubMed]


| All | Cloud-to-Ground | ||||
|---|---|---|---|---|---|
| Total Events | Cloud | Cloud-to-Ground | Positive | Negative | |
| Global Avg | 100% | 75% | 25% | 10% | 90% |
| 2000–2004 | 3,924,380 | 346,207 | 3,578,173 | 441,310 | 3,136,863 |
| (100%) | (8.82%) | (91.2%) | (12.3%) | (87.7%) | |
| 2010–2014 | 4,660,586 | 1,824,429 | 2,836,157 | 424,631 | 2,411,526 |
| (100%) | (39.1%) | (60.9%) | (15.0%) | (85.0%) | |
| 2016–2020 | 9,892,750 | 7,742,915 | 2,149,835 | 195,893 | 1,953,942 |
| (100%) | (78.3%) | (21.7%) | (9.11%) | (90.9%) | |
Publisher’s Note: MDPI stays neutral with regard to jurisdictional claims in published maps and institutional affiliations. |
© 2022 by the authors. Licensee MDPI, Basel, Switzerland. This article is an open access article distributed under the terms and conditions of the Creative Commons Attribution (CC BY) license (https://creativecommons.org/licenses/by/4.0/).
Share and Cite
Mansouri, E.; Mostajabi, A.; Schulz, W.; Diendorfer, G.; Rubinstein, M.; Rachidi, F. On the Use of Benford’s Law to Assess the Quality of the Data Provided by Lightning Locating Systems. Atmosphere 2022, 13, 552. https://doi.org/10.3390/atmos13040552
Mansouri E, Mostajabi A, Schulz W, Diendorfer G, Rubinstein M, Rachidi F. On the Use of Benford’s Law to Assess the Quality of the Data Provided by Lightning Locating Systems. Atmosphere. 2022; 13(4):552. https://doi.org/10.3390/atmos13040552
Chicago/Turabian StyleMansouri, Ehsan, Amirhosein Mostajabi, Wolfgang Schulz, Gerhard Diendorfer, Marcos Rubinstein, and Farhad Rachidi. 2022. "On the Use of Benford’s Law to Assess the Quality of the Data Provided by Lightning Locating Systems" Atmosphere 13, no. 4: 552. https://doi.org/10.3390/atmos13040552
APA StyleMansouri, E., Mostajabi, A., Schulz, W., Diendorfer, G., Rubinstein, M., & Rachidi, F. (2022). On the Use of Benford’s Law to Assess the Quality of the Data Provided by Lightning Locating Systems. Atmosphere, 13(4), 552. https://doi.org/10.3390/atmos13040552