Article

Characterization of Aerosol Pollution in Two Hungarian Cities in Winter 2009–2010

1
Laboratory for Heritage Science (HSLab), Institute for Nuclear Research (ATOMKI), Bem tér 18/c, H-4026 Debrecen, Hungary
2
Isotope Climatology and Environmental Research Centre (ICER), Institute for Nuclear Research (ATOMKI), Bem tér 18/c, H-4026 Debrecen, Hungary
*
Authors to whom correspondence should be addressed.
Atmosphere 2022, 13(4), 554; https://doi.org/10.3390/atmos13040554
Submission received: 25 February 2022 / Revised: 24 March 2022 / Accepted: 28 March 2022 / Published: 30 March 2022
(This article belongs to the Special Issue Air Quality in Hungary)

Abstract

:
In this study, atmospheric particulate matter (APM) pollution was compared in urban background sites of two cities in Hungary—namely the capital Budapest and Debrecen—by analyzing daily aerosol samples collected between 8 December 2009 and 18 March 2010. Concentration, elemental composition, including BC, and sources of fine (PM2.5) and coarse (PM2.5–10) aerosol pollution, as well as their variation due to meteorological conditions and anthropogenic activities, were determined for both cities. The average PM2.5 concentrations were 22 μg/m3 and 17 μg/m3 in Budapest and Debrecen, respectively. In the case of PM10, the mean concentration was 32 μg/m3 in Budapest and 23 μg/m3 in Debrecen. The concentration of the coarse fraction decreased significantly over the weekends compared to working days. The number of exceedances of the WHO recommended limit value for PM2.5 (15 μg/m3) were 67 in Budapest and 46 in Debrecen, which corresponds to 73% and 50% of the sampling days, respectively. At the time of the exceedances the daily average temperature was below freezing. The average PM2.5/PM10 ratio was 70% and 75% for the two sites, indicating the dominance of the fine fraction aerosol particles during the study period. Elements of natural origin (Al, Si, Ca, Ti, Mn, Fe, Ba) and chlorine were found to be dominant in the coarse fraction, while elements of anthropogenic origin (S, K, Cu, Zn, Pb) were characteristic to the fine fraction. Similar concentrations were measured in the two cities in the case of S which originates from regional transport and K which serves as a tracer for biomass combustion. Traffic-related elements were present in 2–3 times higher concentrations in Budapest. The episodic peaks in the Cl time series could be attributed to salting after snowfalls. The following sources of APM pollution were identified by using the EPA Positive Matrix Factorization (PMF) 5.0 receptor model: soil, traffic, road dust, secondary sulfate, biomass burning, and de-icing of streets. On polluted days when the PM2.5 concentration exceeded the 25 μg/m3 value the contribution of secondary sulfate, domestic heating, and traffic increased significantly compared to the average. On weekends and holidays the contribution of soil and traffic decreased. The main pollution sources and their contributions were similar to the ones in other cities in the region. Comparing our findings to results from winter 2015 it can be concluded that while the PM2.5 pollution level remained almost the same, a significant increase in the contribution of biomass burning was observed in both cities from 2010 to 2015, indicating a change of heating habits.

1. Introduction

Increasing urbanization is a global trend which can be traced in the size and number of densely built-up human settlements. According to a survey conducted by the UN in 2018, 55.3% of the world’s population was living in urban areas. By 2030, 60% of the population will reside in big cities [1,2]. The increasing amount of air pollution is an inherent part of the growing urbanization due to the continuous emissions from vehicles, factories, and daily household activities. Particulate matter (PM) is one of the most examined atmospheric pollutants. It has significant effects on local and regional air quality [3,4] visibility [5,6], and also on the global climate system [7]. In addition, high PM levels have several negative health effects, including respiratory and cardiovascular diseases and/or allergies [8,9,10,11,12]. Huge numbers of scientific works are focused on understanding the influence of natural and anthropogenic sources in the context of chemical composition of PM [4,13,14]. Source apportionment combined with dispersion modelling provides information about the contribution of local sources and pollution originating from urban and regional backgrounds and from long-range transport [15,16,17,18,19,20,21,22,23]. European studies show that the annual background PM10 and PM2.5 concentrations in continental Europe are strongly affected by the regional aerosol background [13,24]. Carbonaceous aerosols (organic matter and elemental carbon) and SIA (Secondary Inorganic Aerosols) accounted for a major fraction of PM10 and particularly for the PM2.5 in selected European cities [25]. In the case of the geographical origin of the pollution, long-range transport (LRT), regional transport (RT), and local sources (LP) are distinguished. In winter, LP and RT accounted for the majority of the pollution in most European cities. Such sources are coal combustion [26,27], wood combustion for heating and increased traffic emissions due to unfavorable winter driving conditions [28].
Recently, studies have been published about the characterization of urban particulate matter pollution in middle-eastern Europe [29,30,31,32,33,34,35,36,37,38]; however, data are still scarce and limited to short sampling periods. All these investigations show that urban aerosol pollution is a huge problem in the region, and in order to work out effective mitigation strategies we must have detailed information about the chemical composition and sources of APM pollution as well as the understanding of the effects of meteorological parameters, human activity, and regional and long-range transport. Urban background sites in Hungary were included in two regional-scale studies of PM2.5 pollution [39,40]: Budapest, Gilice tér (February–May 2015) and Debrecen, ATOMKI (2014–2015). At both sites, the APM levels were significantly higher during winters, and high pollution levels were more frequent during the heating period than in other times of the year. Other publications corresponding to Hungarian cities are restricted to short time periods with extreme pollution events [41,42,43] or do not contain chemical characterization of PM pollution [44,45].
In this study, we characterize the PM2.5 and PM10 pollution in the above mentioned cities of Hungary, Budapest, and Debrecen, during the heating period of winter 2009–2010. PM2.5 and PMcoarse samples were collected simultaneously on a daily basis in the two urban background sites. Concentration, elemental composition and sources of APM pollution were determined. The effects of different meteorological conditions and anthropogenic activities were studied. The parallel sampling made it possible to have a direct comparison between the similar UB sites situated 200 km from each other. The influence of local and regional sources was also studied. The obtained results were compared directly to the already published data.
Thus, the objective of this study is to provide quantitative data on the sources of urban aerosol pollution in the two biggest cities in Hungary in the most polluted period of a year, to identify local and regional effects which could serve as a basis to effective abatement measures.

2. Materials and Methods

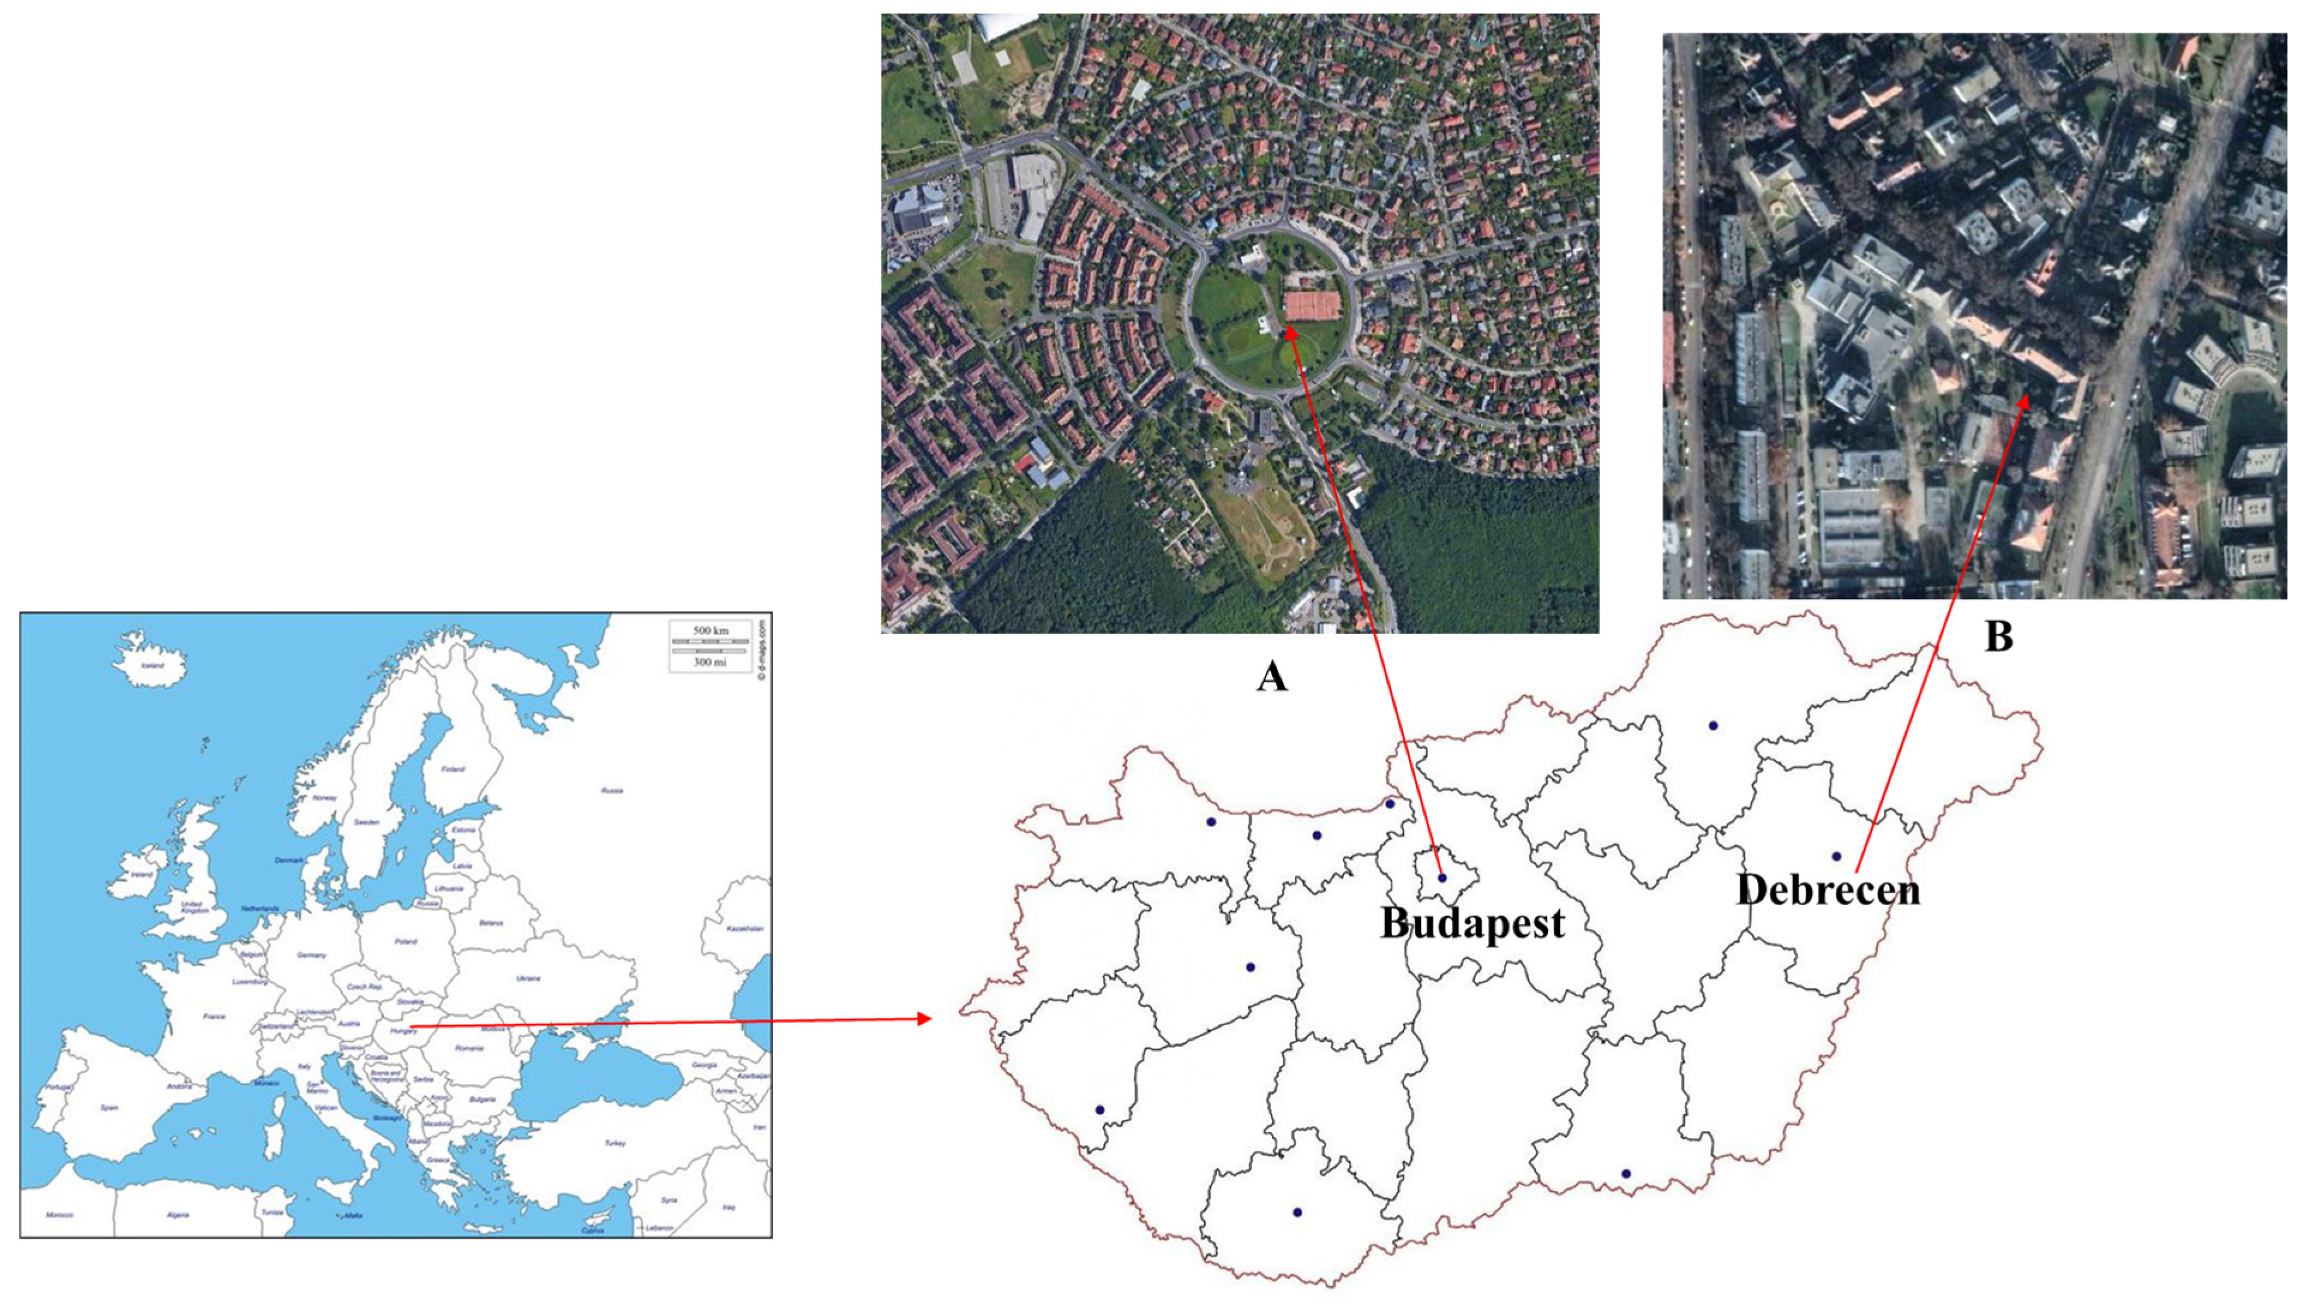
2.1. General Description of the Sampling Sites

The study was carried out in two major Hungarian cities: Budapest and Debrecen. Budapest (47°29′54″ N, 19°02′27″ W) is the capital of Hungary, the political, cultural, commercial, industrial, and transport center, and the largest and most populated city in the country. It is the ninth most populous capital of the European Union. In 2011, the population of Budapest was 1.7 million (2.5 million including suburbs). It covers an area of about 525 km2.
Debrecen (47°31′48″ N, 21°38′21″ W) is Hungary’s second largest city. It is the intellectual, cultural, economic, touristic, and transport center of the Trans-Tisza region, the seat of Hajdú-Bihar County. More than 38% of the county’s population lives in Debrecen. According to the data of the KSH (Hungarian Central Statistical Office), in 2013 its registered resident population exceeded 204,333 [46]. Debrecen is located in the Northern Great Plain, on the border of Nyírség, Hajdúhát, and Hajdúság. The Nyírség is a sandy area, sloping from north to south, its western border is at the Tócó valley. Hajdúhát, Hajdúság is a loess area, it slopes to the west [47].

2.2. Aerosol Sampling

Parallel aerosol sampling campaign was carried out between 8 December 2009 and 18 March 2010 in urban background sites in Debrecen and in Budapest. In the studied period PM2.5 and PMcoarse (particles with EAD between 2.5 and 10 μm) samples were collected separately every day in both locations.
Twenty-four hour-long aerosol samplings were performed with Ghent-type two-stage stacked filter units equipped with Nuclepore polycarbonate filters of 8 µm and 0.4 µm pore diameters [48]. The samplers were operated at a flow rate of 16–18 L/min.
For the study, sampling sites with similar characteristics were chosen. Both stations are situated in residential areas and are classified as urban/suburban background. In Debrecen, the sampling site was the garden of the Institute for Nuclear Research (ATOMKI) (Figure 1), which is situated 1.5 km from the city center. In Budapest, the samples were collected at the air quality monitoring urban background station in Gilice square in the XIII district of Budapest (Figure 1). The sampling height was 1.8–2 m in both locations. Main roads with heavy traffic are situated 100 m from both sites. In Budapest, the airport motorway and the M0 highway run 1 km East from the sampling site. Altogether, 92 PM2.5 and 92 PMcoarse samples were collected at each site.

2.3. Elemental Analysis

PM mass concentrations were determined by gravimetry using a Sartorius microbalance (6-digit). The samples were conditioned at 25 °C temperature and 55–60% relative humidity for at least 24 h in the weighing box before and after the sampling. The uncertainty of the weighing was 5%.
The elemental composition of the samples was determined by Particle Induced X-ray Emission (PIXE) analytical method [49]. PIXE is a frequently used analytical technique for the elemental characterization of aerosol samples [50,51,52]. The measurements were carried out in the PIXE chamber installed on the left 45° beamline of the 5 MV Van de Graff accelerator of ATOMKI [53]. The irradiation of the samples was performed with a H+ beam of 2 MeV energy and of 20–50 nA current. The accumulated charge was 40 μC on each sample. A Canberra type Si(Li) X-ray detector equipped with 24 μm thick mylar absorber recorded the emitted characteristic X-rays for elements with Z > 12.
The X-ray spectra have been evaluated with the PIXYKLM program package [54,55]. Blank corrections were taken into account for the calculation of concentration values. The concentration of the following elements was determined: Al, Si, P, S, Cl, K, Ca, Sc, Ti, V, Cr, Mn, Fe, Co, Ni, Cu, Zn, As, Br, Sr, Ba, and Pb. The concentration values were given in ng/m3. The uncertainty of the measurements varied between 3 to 10%, while DL was between 0.2 ng/m3 and 20 ng/m3, depending on the element.
Black carbon (BC) concentration of the samples was determined in the fine fraction using an EEL Model 43 smoke stain reflectometer [56]. Concentrations were defined in μg/m3 and the uncertainty of the measurement was 10%.
Minimum detection limits (MDL) and analytical uncertainties of the applied methods are listed in Table S1 in Supplementary Materials.

2.4. Source Apportionment by PMF

Pollution sources were identified by using the Positive Matrix Factorization (PMF) receptor model [57]. PMF is a widely used technique for source apportionment [58]. Its advantage is that it requires no a priori knowledge of source profiles and uses uncertainty to weigh all data. In this work, US EPA PMF 5.0 was applied to determine possible sources of atmospheric aerosol pollution [57,59]. PMF model is based on least-squares techniques that uses error estimates of the measured data to provide weights in the fitting process. The objective of multivariate receptor modeling is to obtain p independent factors, representing p different sources of emissions or secondary components as well as their elemental composition and the amount that they contribute to the total mass. The notation of the PMF is:
x i j   = k = 1 p g i k f k j + e i j ,
where xij is the concentration of the species j in the i-th sample, gik is the particulate mass concentration from k-th source contributing to the i-th sample, fkj is the concentration of the species j in source k, and eij is the residual (not modelled portion) associated with the j-th species concentration measured in the i-th sample. The values gik and fkj are adjusted until a minimum for the objective function Q for a given number of factors p is found:
Q = i = 1 n j = 1 m ( x i j g i k f k j σ i j ) 2 ,
where σij is the uncertainty estimate of the j-th species in the i-th sample.
In PMF uncertainties can be either observation-based or equation-based. The observation-based uncertainty file provides an estimate of the uncertainty for each species for each sample corresponding to the measured concentration of the given species in the sample. The equation-based uncertainty file provides species-specific parameters which are used to calculate the uncertainties. The uncertainty is calculated using the following equations:
(1)
If the concentration of the chemical species is less than or equal to the MDL provided:
UNC   = 5 6 ×   MDL ,
(2)
If the concentration is greater than the MDL provided:
UNC   = ( Error   fraction   ×   C ) 2 + ( 0.5 ×   MDL ) 2 ,
where C is the concentration of the chemical species, MDL is the method specific detection limit, and ’error fraction’ is the estimated measurement uncertainty of the given species.
PMF analyses were performed for the fine fraction (PM2.5) and the coarse fraction (PMcoarse) separately. In total, 92 and 90 samples collected in Budapest and Debrecen, respectively, were included in the analysis. The elements which were found to be below detection limit (MDL) for more than 50% of the samples were excluded from the analysis. An extra 10% modelling uncertainty was used. S/N (signal-to-noise) ratio and the percentage of data with concentrations below the method detection limit and missing values were used to categorize the species for the source apportionment. Variables with S/N ≤ 0.5 were set as bad, and thus were excluded from the analysis. Variables with signal-to-noise ratio between 0.5 and 1.0 were set as weak. The model runs were performed with PM mass as the total variable, as well as when it was set as the weak variable with 400% uncertainty [60]. Thus, the final validated dataset for Budapest contained 92 samples and 14 species (8 strong, 6 weak variables in the coarse fraction and 9 strong, 5 weak in the fine fraction) and 90 samples and 15 species for Debrecen (10 strong and 5 weak variables for both size fractions). In order to find the optimal solutions, the following aspects were taken into consideration: the difference between the measured and expected Q should be minimum, the solution should be stable over several runs (50 random model runs were performed), the modelled species should have normal distribution, the uncertainty-scaled residual should be between ±3, and the obtained source profiles should have physical meanings [61]. The Q/Qexp [62] was 1.4 for both the coarse and the fine fractions in Budapest and it was 1 for the coarse and 0.99 for the fine fraction in Debrecen. The correlation between modeled and real concentrations (r2 varied between 0.88 and 0.99) showed that most samples and species were well modeled, except for the weak variables (r2 was 0.3–0.87). Following this procedure in Budapest, six factors in the fine mode and five factors in the coarse fraction were found to be the optimal solution. In Debrecen, seven factors in the fine and five factors in the coarse mode were obtained. The modelling uncertainties were studied by applying classical bootstrap (BS), displacement of factor elements (DISP), and bootstrap enhanced by displacement (BS-DISP) [62]. When running the BS, the number of bootstrap runs was 100 and the minimum correlation R-value was the default 0.6 in all cases. Bootstrap results displayed that the factors were reproduced at the minimum level of 85% of the produced resamples and there were no swaps for the minimum dQ level with DISP, indicating well-defined factors. The factors were mapped in 88–100% of the bootstrap runs in the coarse and 85–100% in the fine fraction in Budapest and 99–100% for the coarse and 84–100% for the fine fraction in Debrecen. There was no unmapped factor in any case.

3. Results

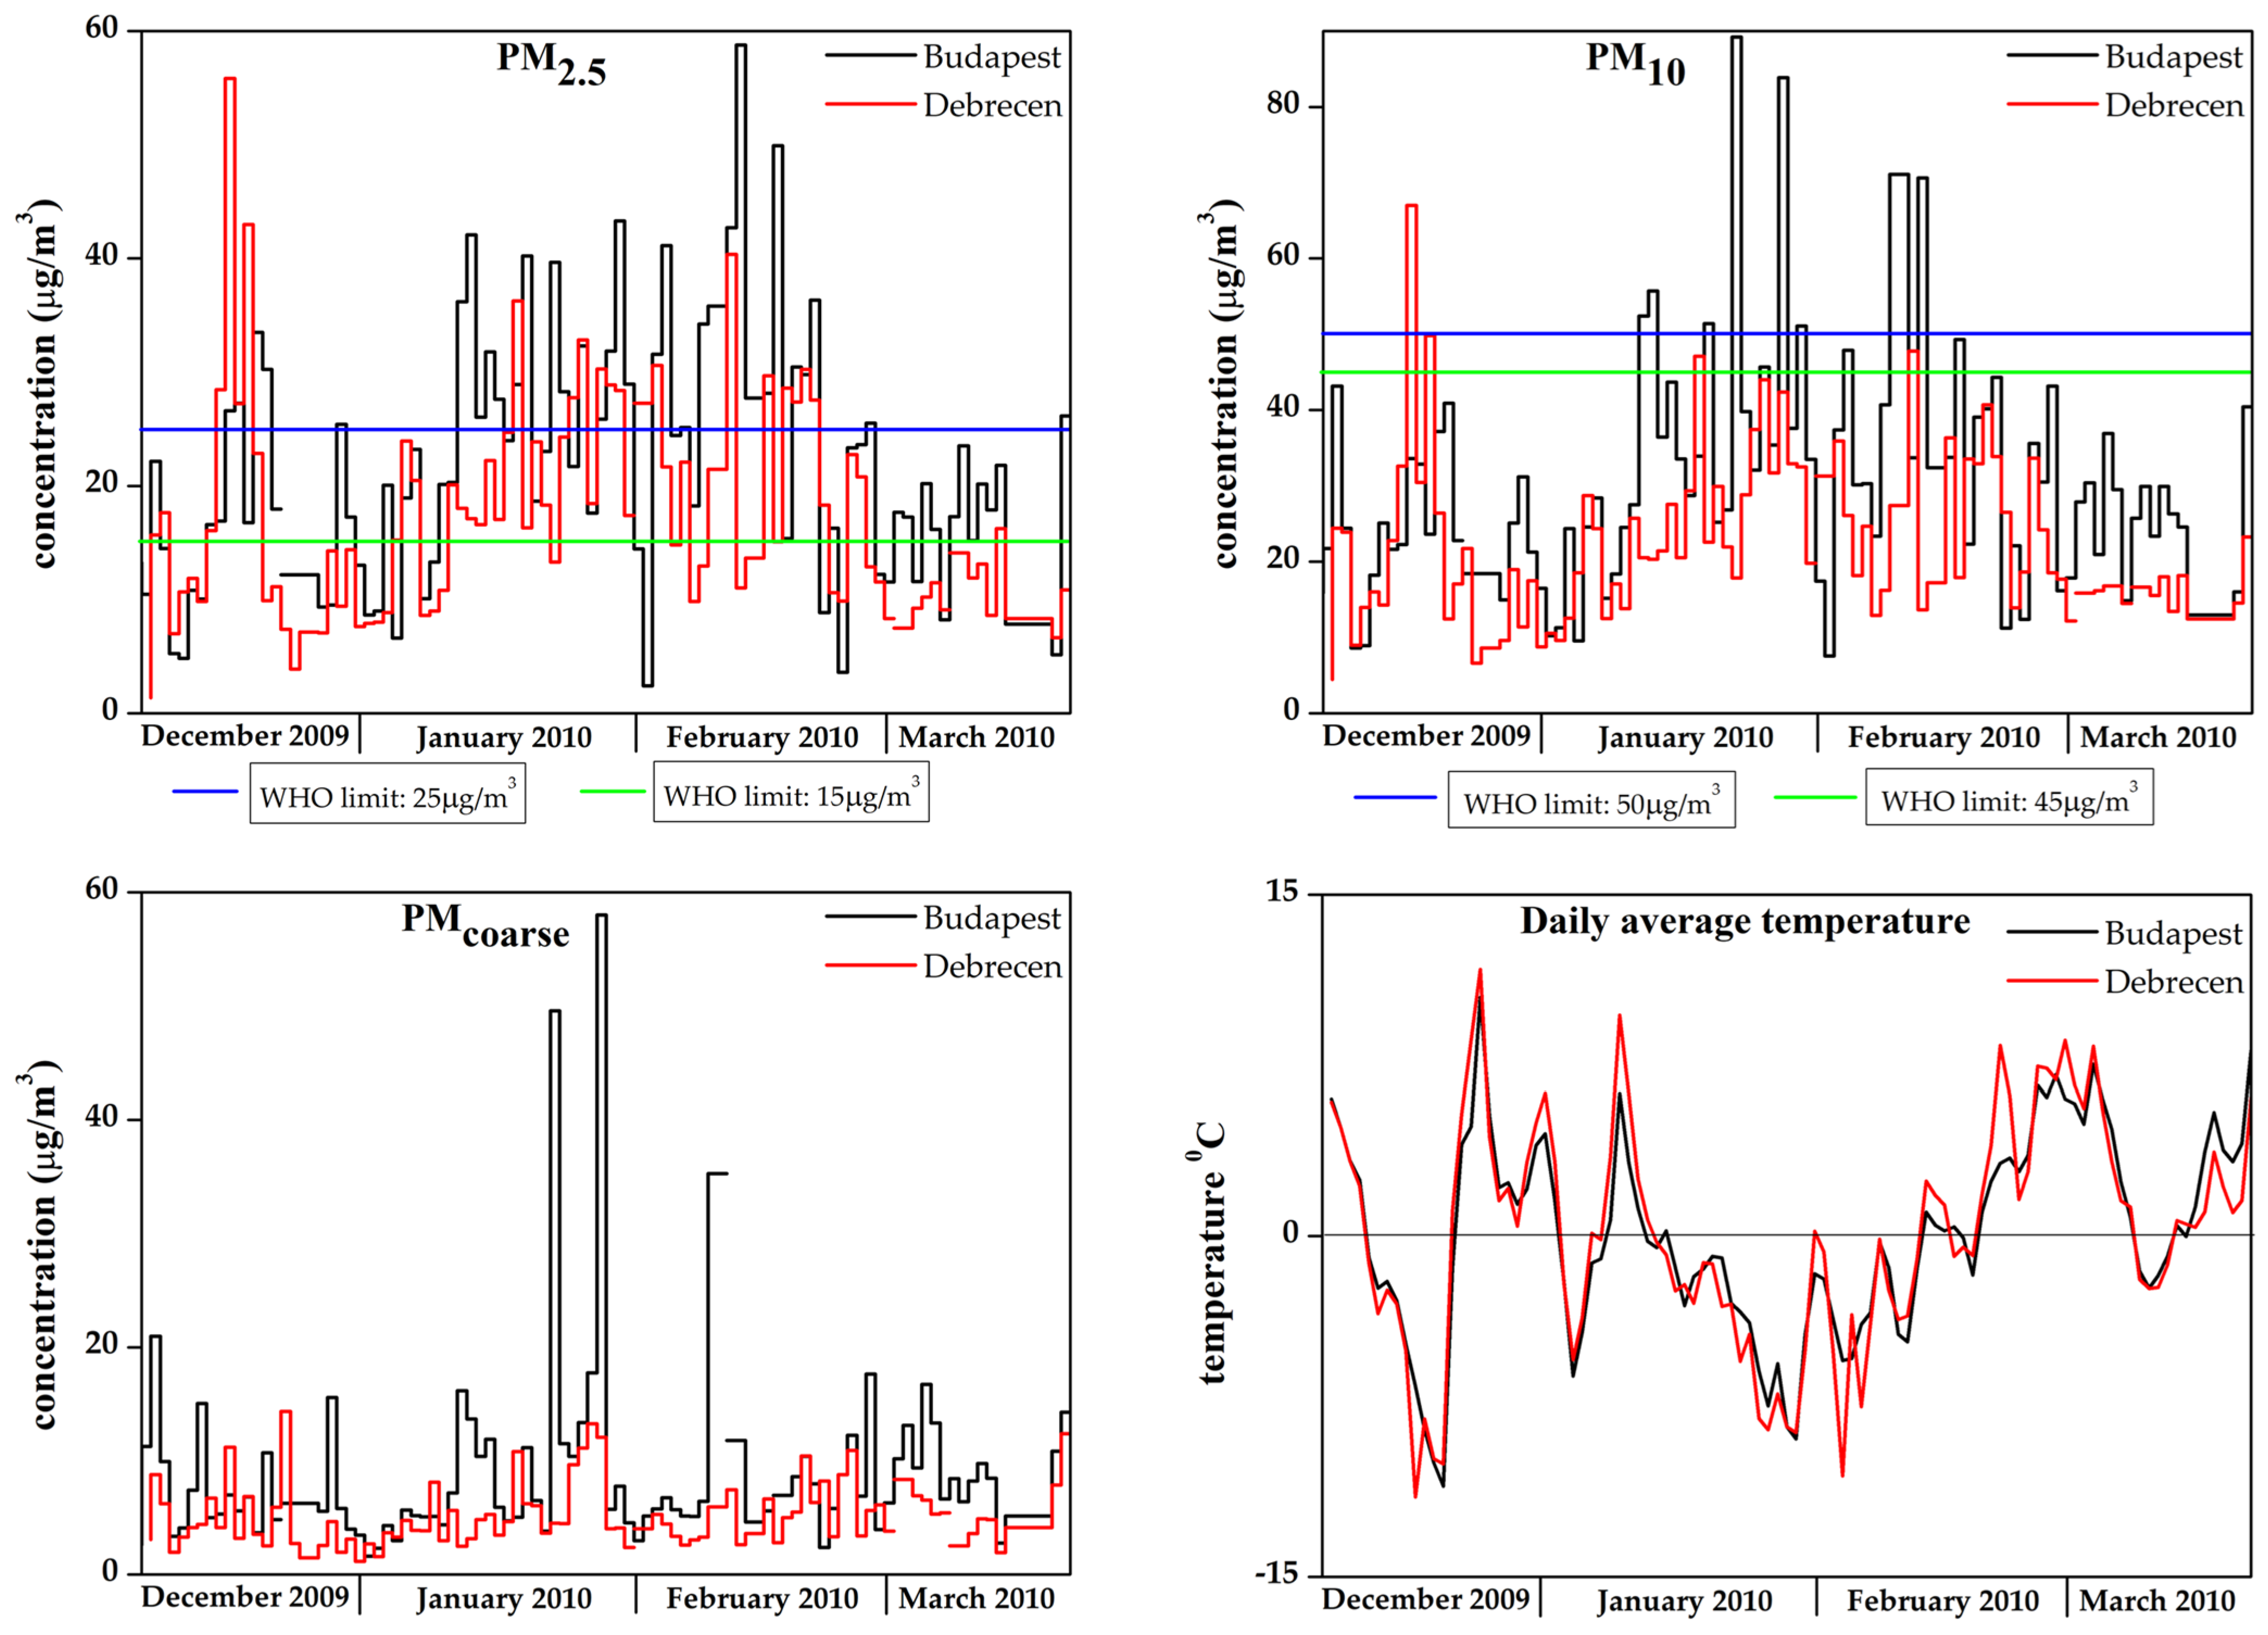
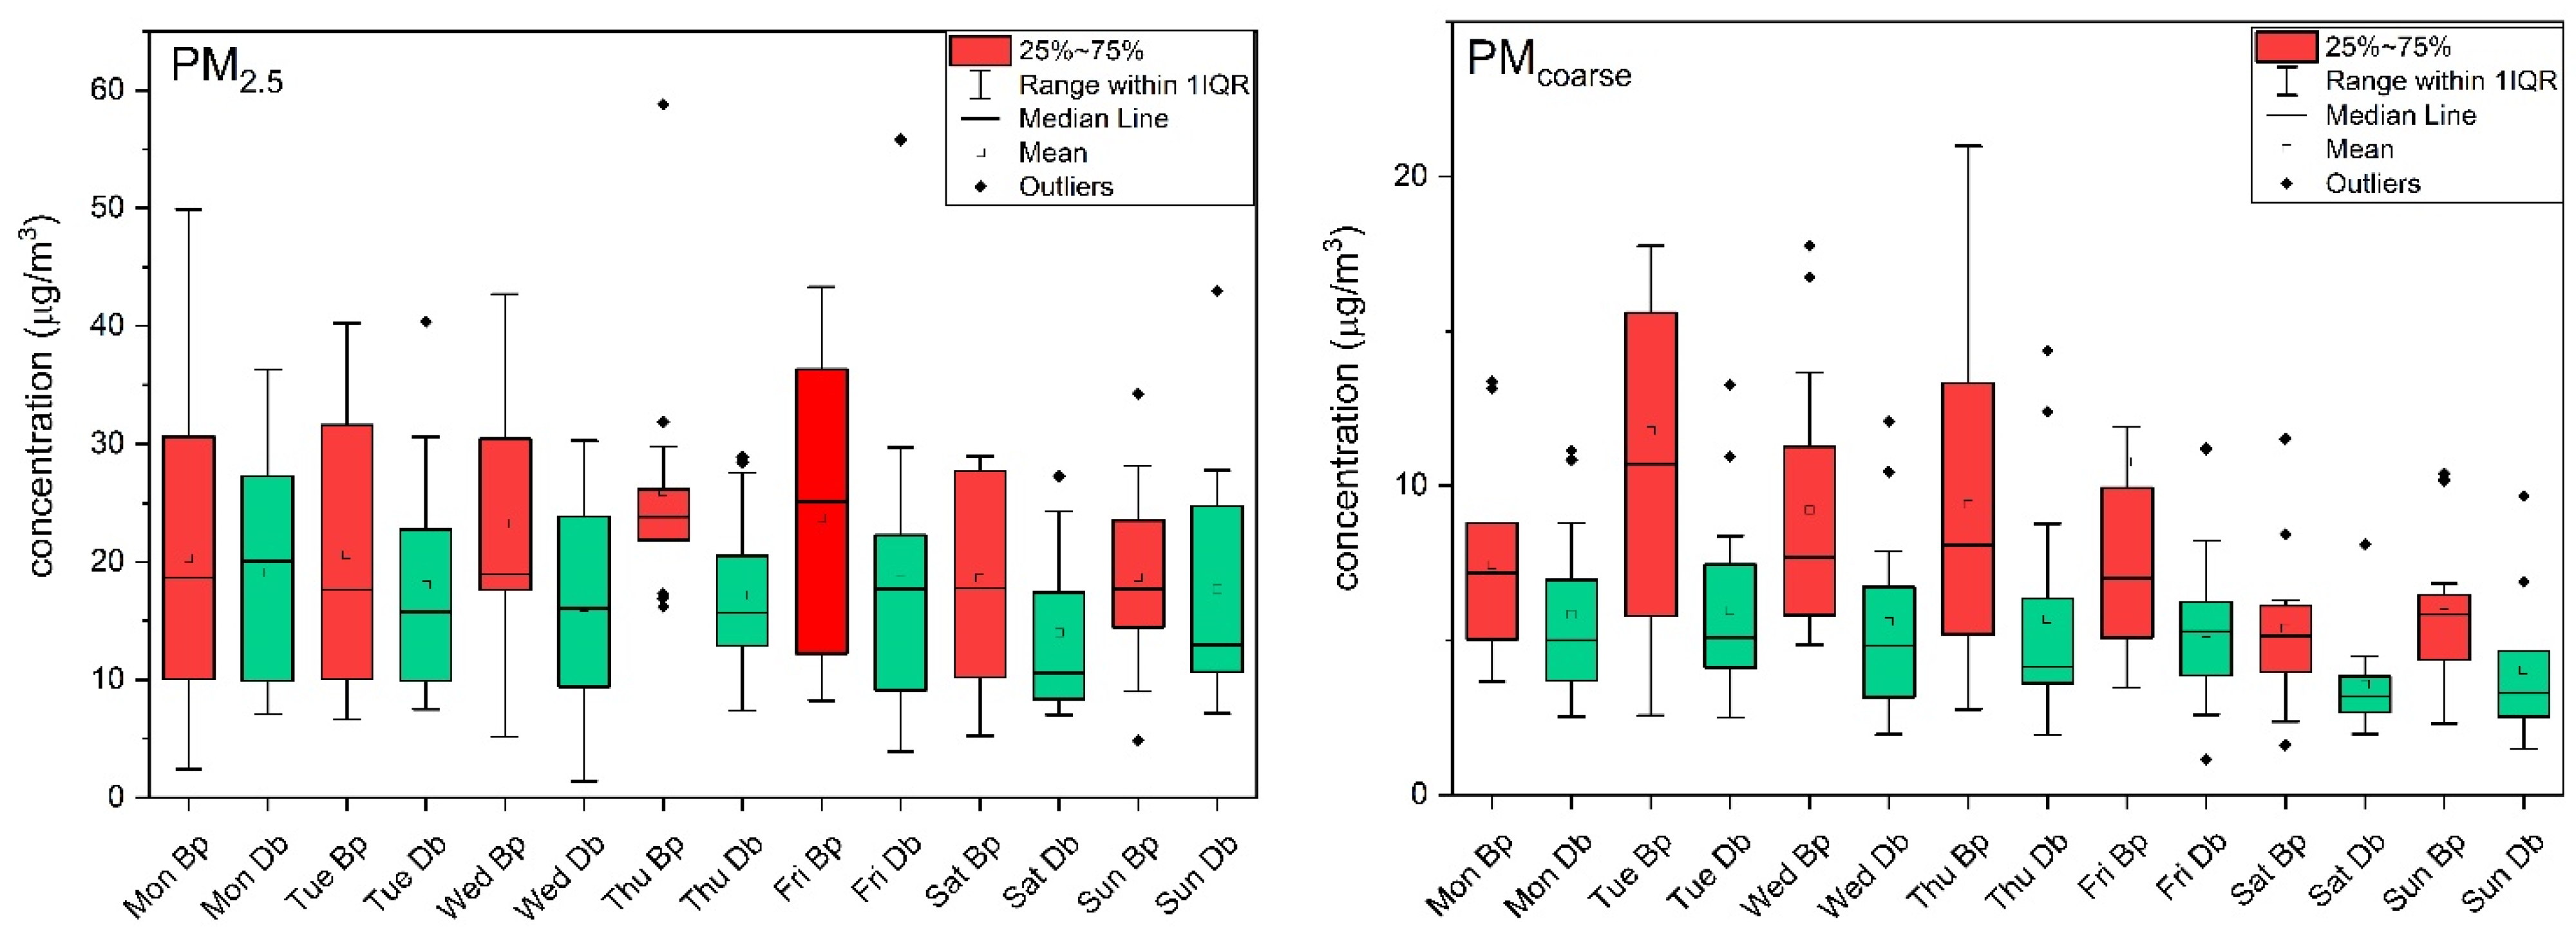
3.1. Mass Concentration

Table 1 shows the average, standard deviation, median, minimum, and maximum of PM10, PM2.5, and PMcoarse concentrations in μg/m3 and the PM2.5/PM10 ratio at the sampling locations (Budapest and Debrecen) for the whole period, which is also broken down to months.
Concentrations of PM2.5, PMcoarse, and PM10 were higher in Budapest than in Debrecen. PM2.5 concentration varied between 2–59 μg/m3 and 1–56 μg/m3 in Budapest and Debrecen, respectively. PM10 concentration was found to be between 8 and 89 μg/m3 in Budapest and 4–67 μg/m3 in Debrecen. The PM2.5/PM10 ratio was 70 and 75% on average in Budapest and Debrecen, respectively.
The monthly average PM2.5 concentrations varied between 15 and 26 μg/m3 in Budapest and 11–20 μg/m3 in Debrecen, and the highest monthly average PM2.5 was measured in February, 2010 at both sampling sites. The monthly average concentrations in the coarse fraction did not change significantly during the investigated period: it was 8–10 μg/m3 in Budapest and 5–6 μg/m3 in Debrecen. The average monthly PM2.5/PM10 ratio ranged from 60% to 74% in Budapest, while in Debrecen it ranged from 65% to 78%, and the highest contribution of PM2.5 to PM10 was in February.
Figure 2 shows the daily mass concentrations of PM2.5, PM10, and PMcoarse, supplemented by the daily average temperature for the sampling period. The measured values were compared with the 24-h limits recommended by the WHO and the EU. In the latest guidelines by the WHO [63] 15 μg/m3 is the recommended 24-h AQG limit value for PM2.5. Before 2021, this value was 25 μg/m3 [64,65]. The daily concentration of PM2.5 exceeded the 24-h AQ limit value of 25 μg/m3 34 times in Budapest and 18 times in Debrecen. In the case of the more strict value of 15 μg/m3, the number of exceedances were 46 in Debrecen, and 67 in Budapest. This means that in Debrecen, half, while in Budapest, over two thirds of the winter period could be considered polluted according to the WHO. Most exceedances occurred in January and February. Comparing the mass concentration values with the daily average temperature, it could be observed that whenever the mass concentrations exceeded the recommended limit values the daily average temperature was below 0 °C.
Figure 3 shows the average mass concentrations of PM2.5 and PMcoarse for the days of the week. In the case of PM2.5, the maximum concentration was observed on Thursdays (24 μg/m3) in Budapest. During the weekends the PM2.5 level was a bit lower compared to working days; however, this difference was not significant according to ANOVA analysis. In Debrecen, the PM2.5 concentration levels were very similar during the week, and it did not decrease significantly on weekends. In the case of the coarse fraction, the concentration was the highest in Budapest on the middle of the week (Tuesdays to Thursday). In addition, measured concentrations were 1.5–2-fold lower on weekends than on weekdays. In Debrecen on weekdays, roughly the same concentrations were obtained, while on the weekends the level of pollution of the coarse fraction decreased, although to a lesser extent than in Budapest.

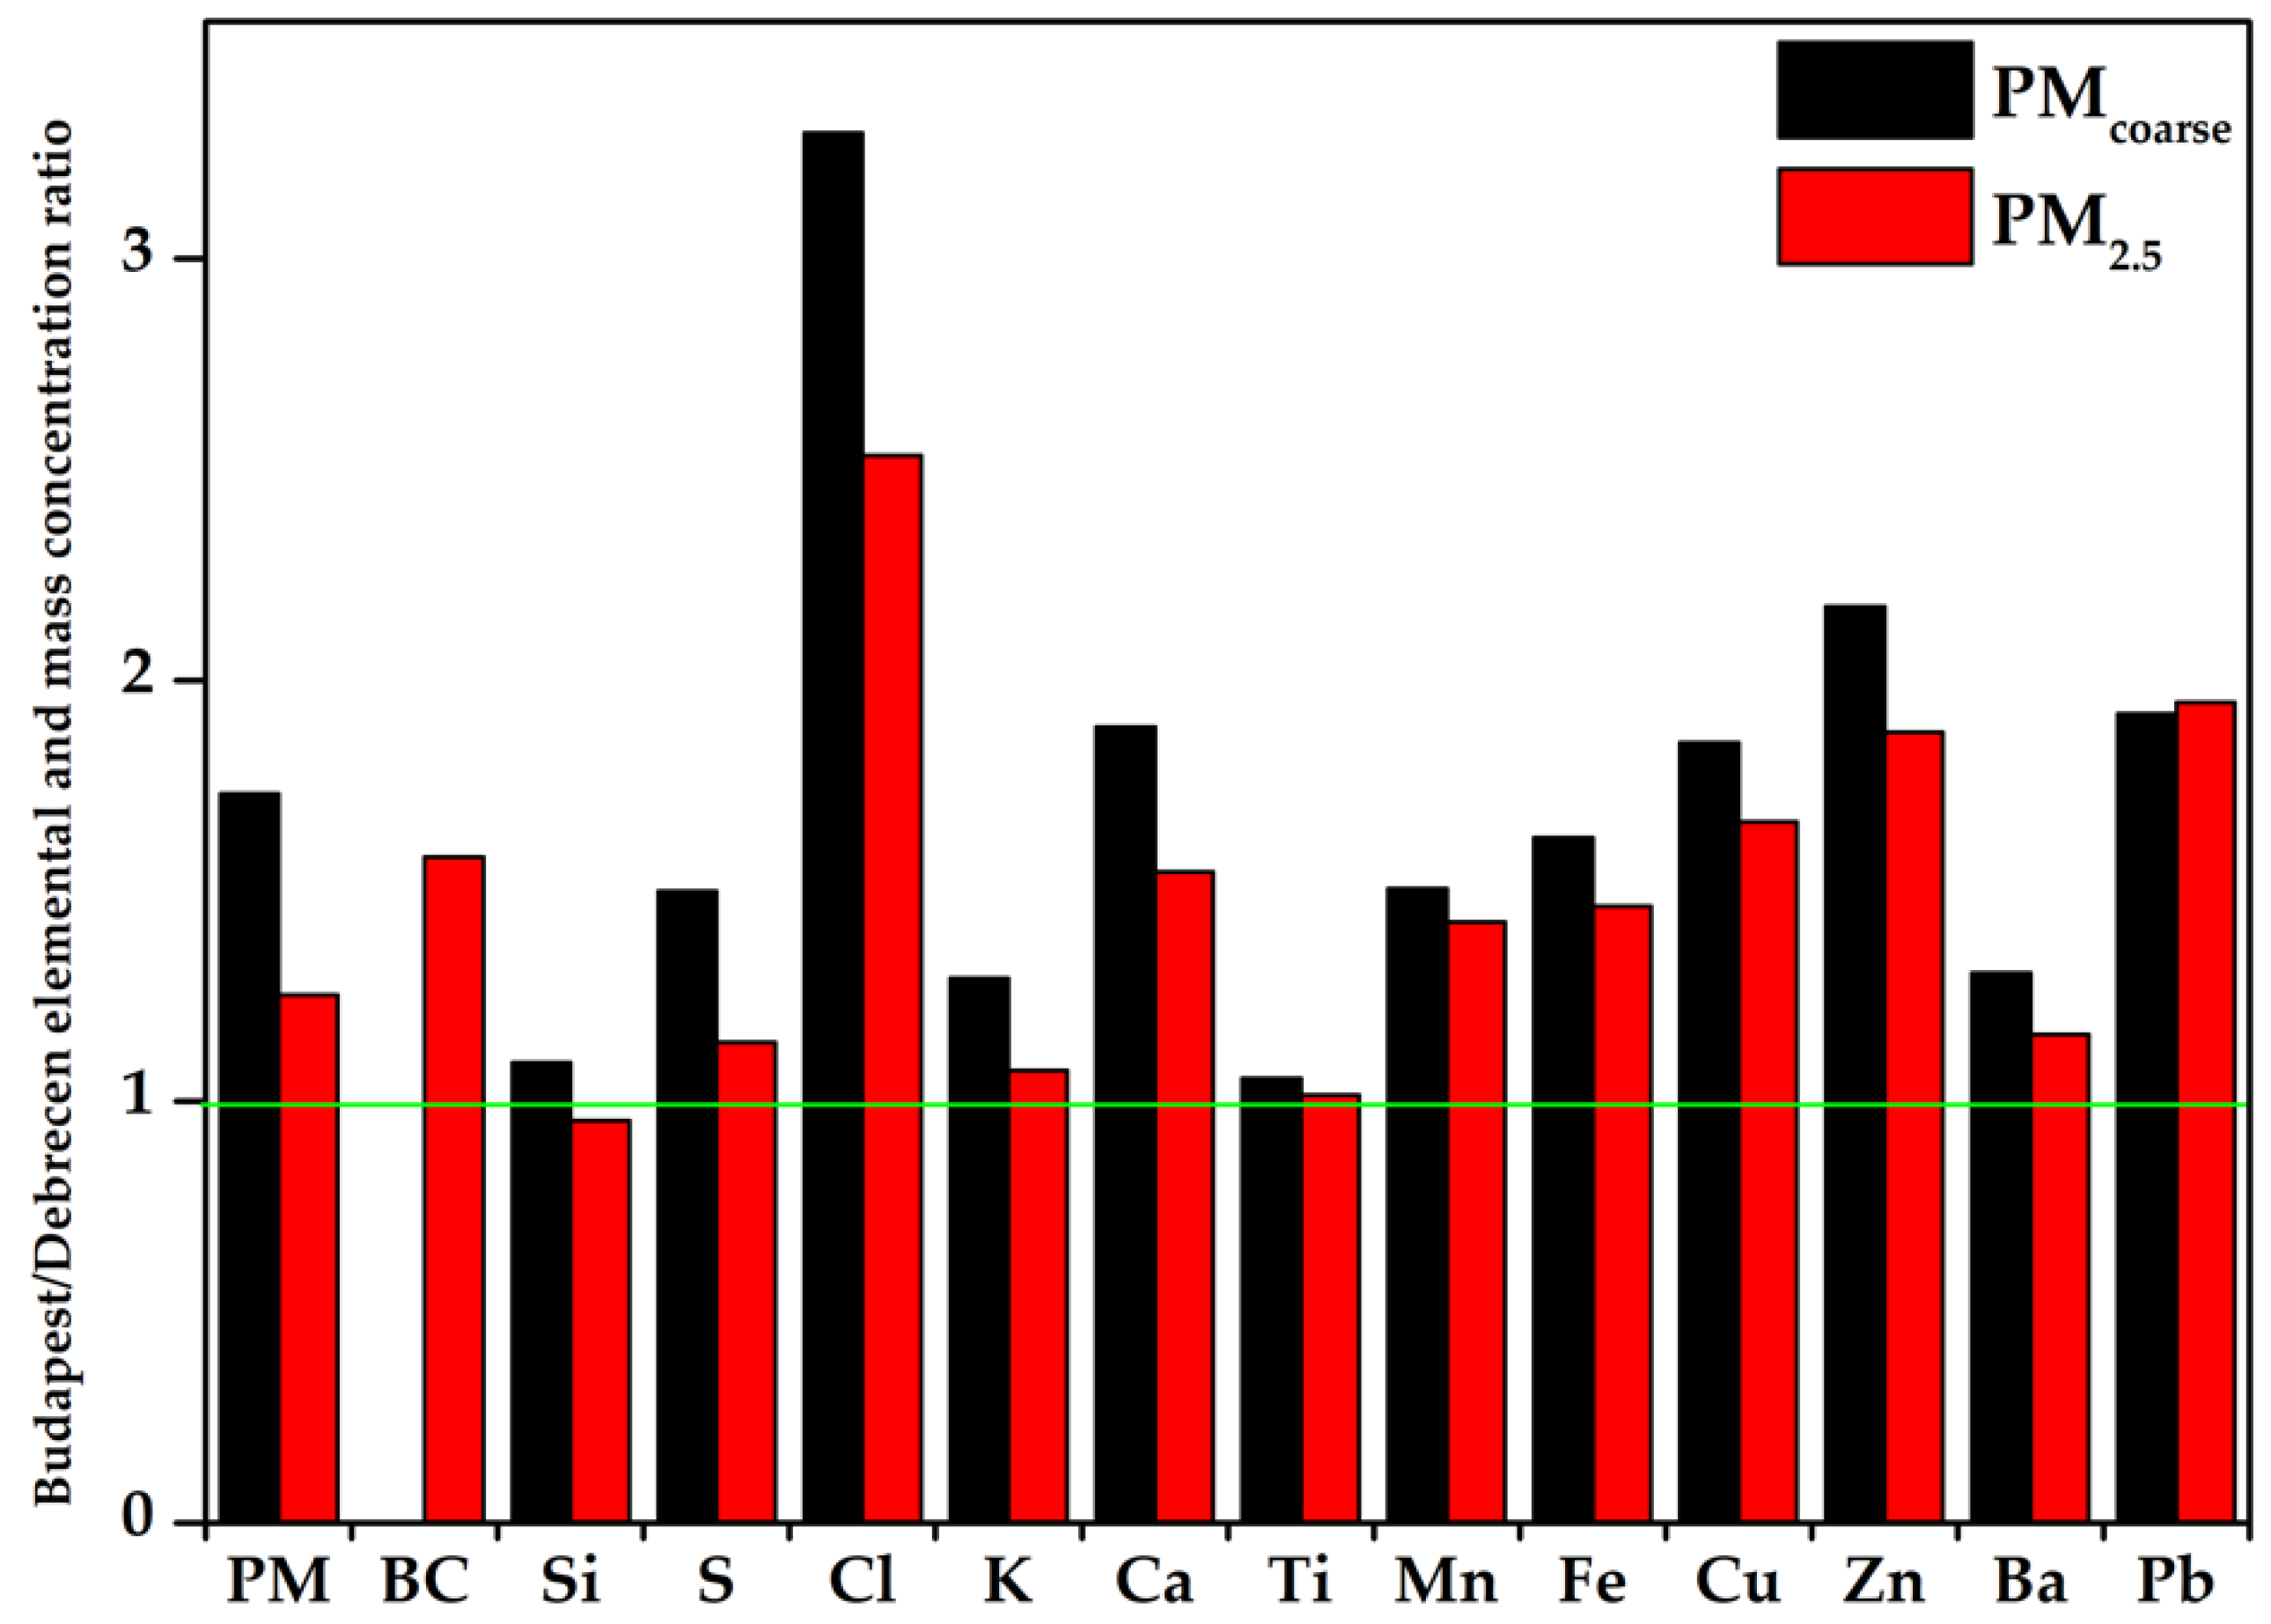
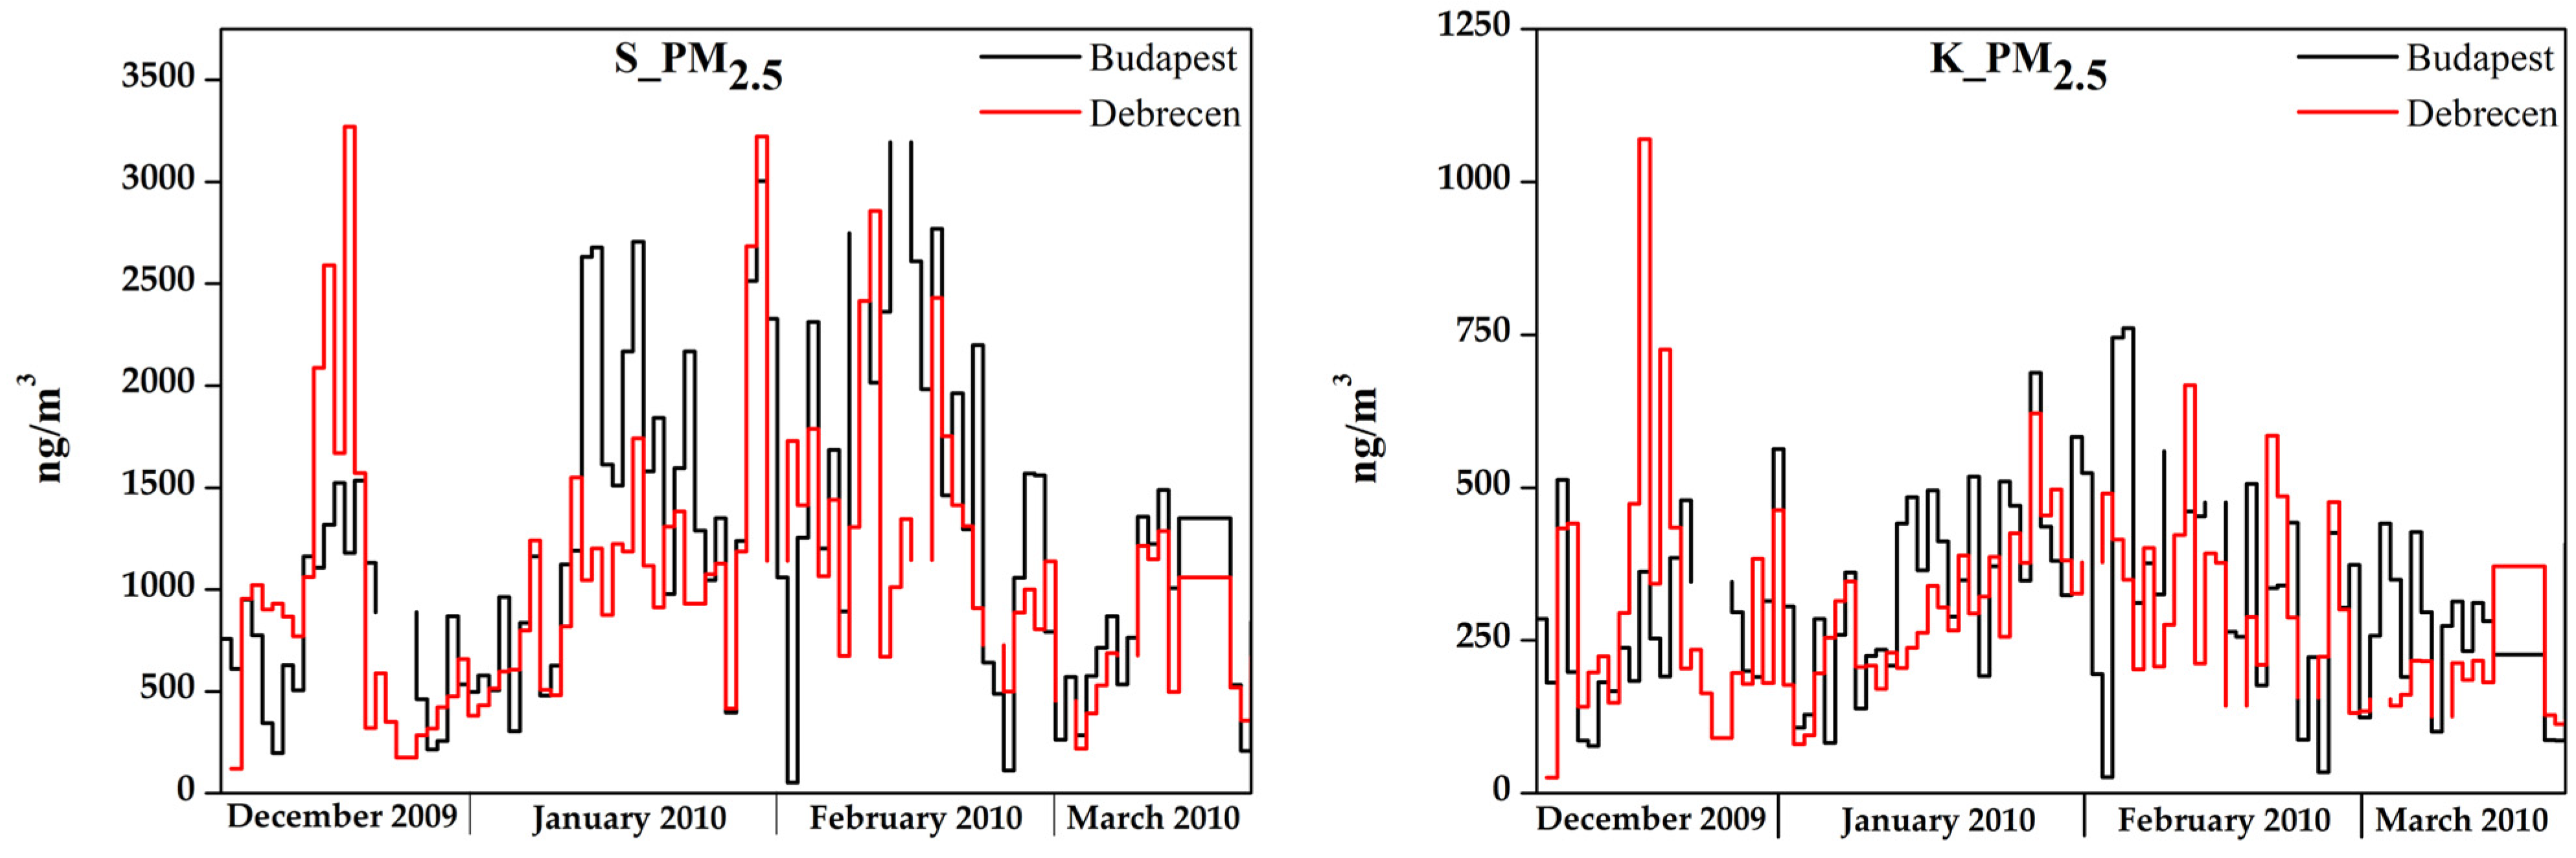
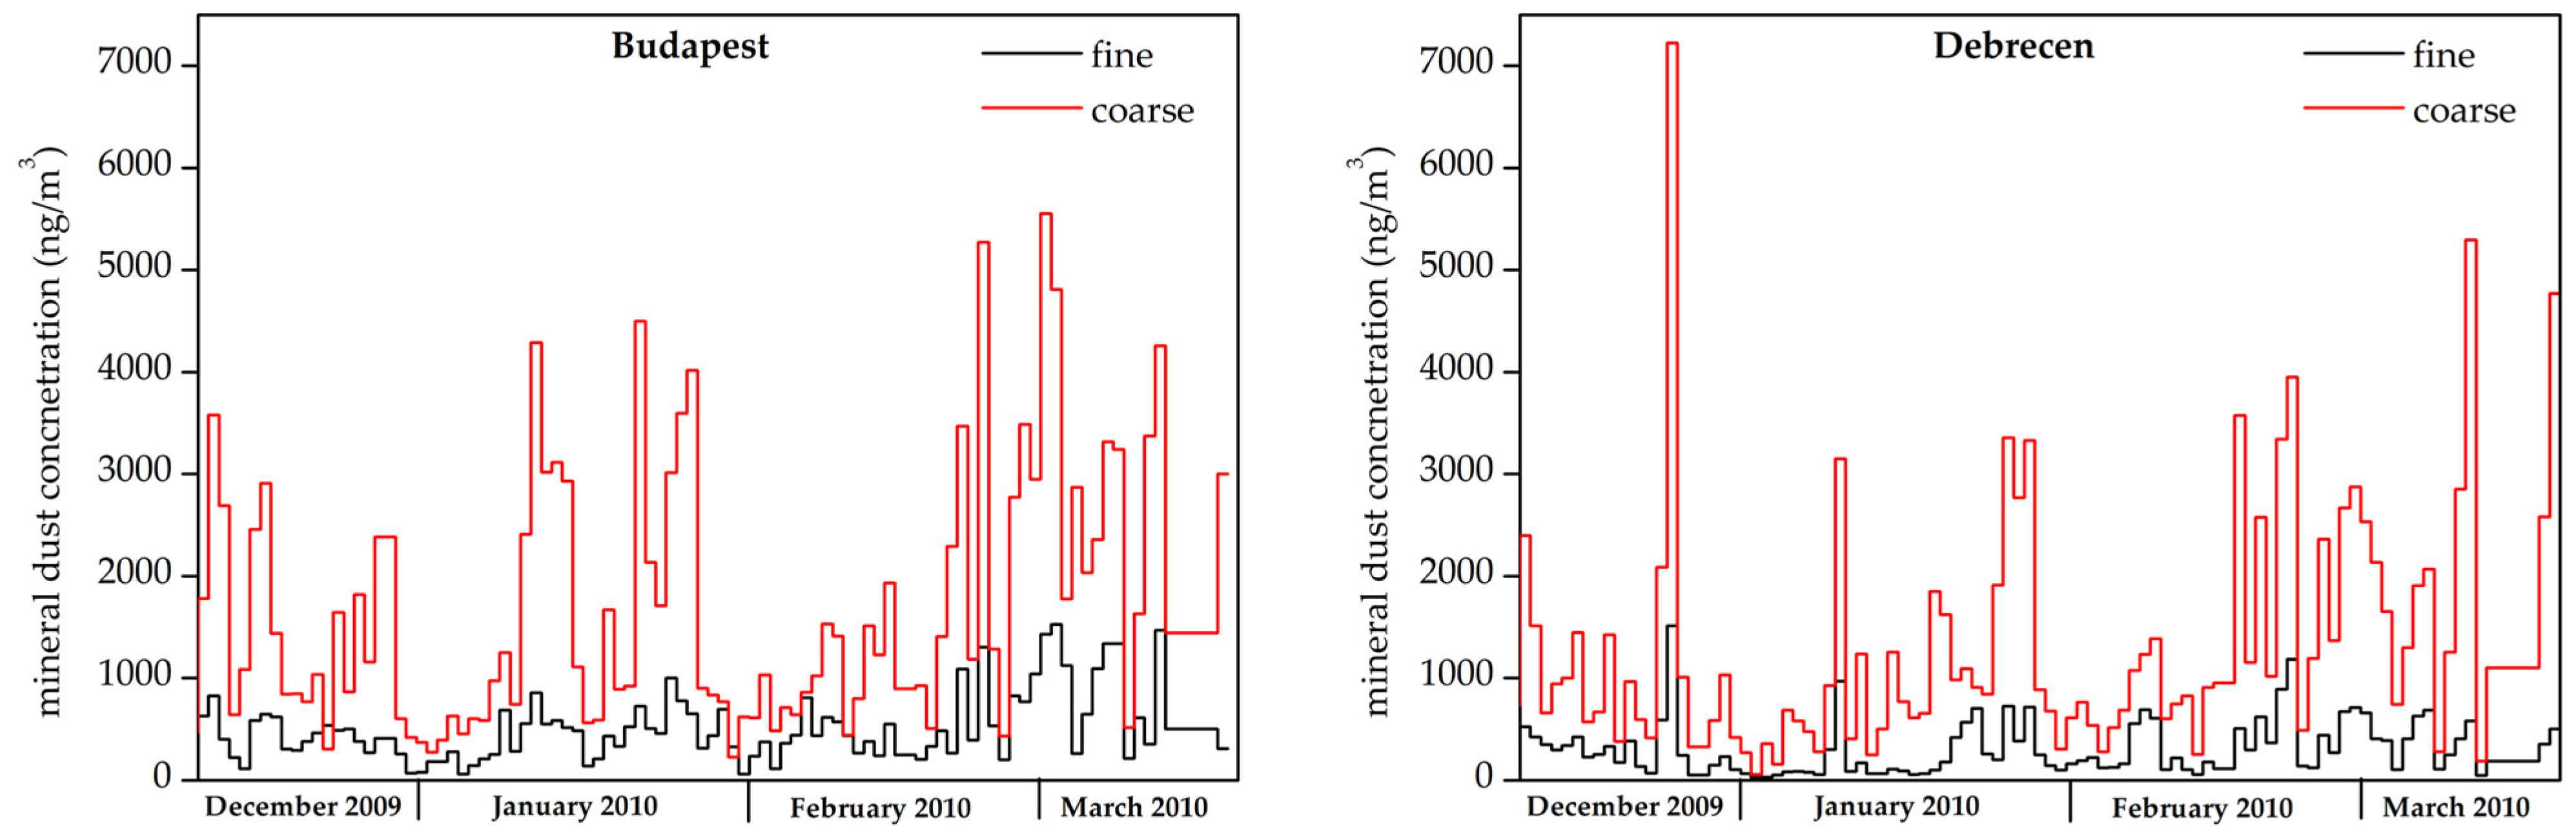
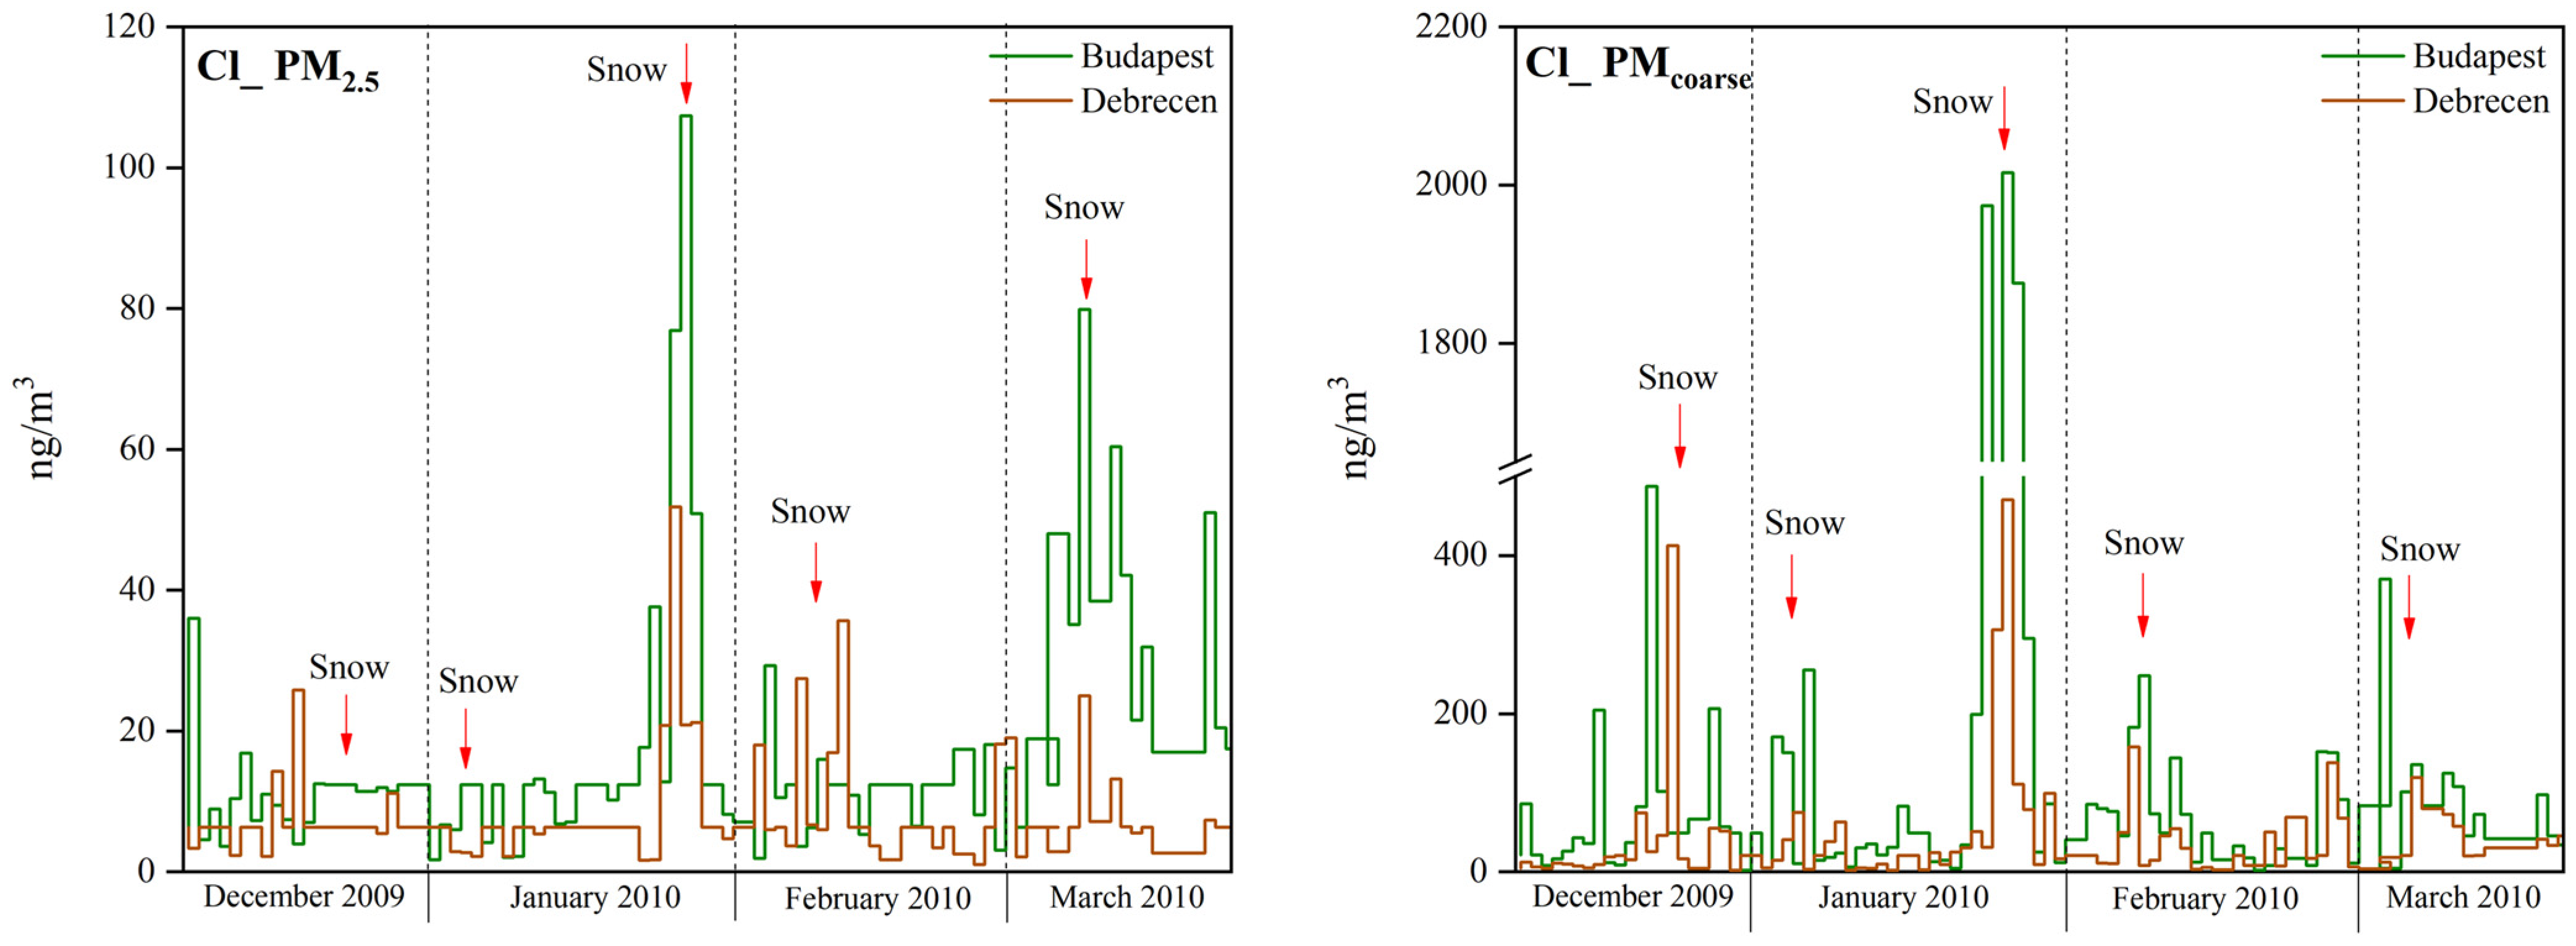
3.2. Elemental Concentration

In Table 2 and Table 3 the measured elemental concentrations, BC, and mass concentrations are presented for both sampling sites for both size fractions. Mineral dust component was calculated as follows: 1.9[Al] + 2.14[Si] + 1.4[Ca] + 1.67[Ti] + 1.44[Fe] [66] assuming that the elements occur in their common oxide form. In the fine fraction, the main components were BC, S, and K, while in the coarse fraction besides the mineral dust elements (Si, Ca, Fe), Cl and S appeared in significant amounts. In Debrecen, the contributions of BC and sulfate (SO42−) were 11% and 19% to PM2.5, respectively. In Budapest, these numbers were 15% and 17% for BC and SO42−, respectively. Mineral dust accounted for 25% in Debrecen and 19% in Budapest of PMcoarse. The contribution of sulfate in the coarse fraction was 11–12% in both sites.
In Figure 4, the Budapest/Debrecen concentration ratios are shown. As expected, the Budapest/Debrecen ratios were higher than 1 in most cases. The ratios of mineral dust elements were around 1 except for Ca and Fe, which can be explained by the different soil types [67].
In the case of S, nearly identical concentrations were measured in the fine fraction. Sulfur is usually present in the form of sulfate (SO42−) in the aerosol and it originates generally from regional transport [68]. In the coarse fraction, S typically comes from local sources associated with wood and coal combustion [68]. Larger, around twofold differences were observed between the two cities in the case of Pb, Cu, and Zn. These elements are usually of traffic origin. Similar concentrations were measured for K, which is typically a tracer of biomass burning in the fine fraction. The largest difference was observed for chlorine in both size fractions. Cl appeared episodically, and it was connected to de-icing of streets. It will be discussed in more details in the following. By studying the elemental ratios, it can be concluded that higher concentrations were measured in Budapest for elements related directly (Cu, Zn, Pb, and part of BC) or indirectly (soil-derived elements in the re-suspended dust) to traffic. While the concentrations of aerosols from regional transport were similar in the two cities the 50% more S in the coarse fraction in Budapest indicates a bigger share of coal/oil combustion in the heating mix in Budapest.
In order to identify the possible sources of the aerosol and its individual components, time series of the elemental concentrations and the relationship between the two sites were also examined. Table 4 shows correlation coefficients by Spearman correlation between the concentrations measured in Budapest and Debrecen in PM2.5 and PMcoarse fractions.
There was a moderate correlation between the two locations in case of PMs. In the fine fraction, the strongest relationship was found in the case of sulfur, which originates from regional transport. For the traffic-related elements (Pb, Zn, and Cu) there was either no connection or only a weak correlation between the two locations. For elements connected to local sources such as biomass burning and road salting, moderate or weak correlations were found. Furthermore, for the soil-derived elements (Si, Ca, Ti, and Fe) the correlation coefficient was around 0.5 and higher values were obtained in the coarse fraction.
Figure 5 shows the temporal variation of sulfur and potassium concentrations in the fine fraction. Sulfur and potassium are important components of the fine fractional aerosol. As mentioned earlier, sulfur (in the form of sulfates) in the fine fraction usually comes from regional transport [69]. Potassium can originate from many sources such as sea salt, cooking, mineral powder, coal and wood burning, fertilization, and waste incineration [70]. Receptor models (e.g., chemical mass balance—CMB, positive matrix factorization—PMF, and principal component analysis—PCA) usually identify potassium as a tracer of biomass burning and thus it can be linked to local sources [71,72,73]. Both the temporal variation and the correlation coefficients show that there was a medium-strength relationship between the two sites for these elements. In the case of S, the same origin, and for K, the similar weather conditions in the two cities explain the relatively strong relationship.
The dependence of PM2.5, PMcoarse, and elemental concentrations on local weather parameters (average temperature, wind direction, and wind speed) was also examined. There was a weak negative correlation between the temperature and the concentration of PM2.5, S, and K (r = −0.31, −0.35, and −0.22, respectively) in Budapest, while in Debrecen stronger relationships were found for these components (r = −0.57, −0.57, and −0.49, respectively). In Debrecen, there was a moderate (r = −0.4) negative relationship between BC and the daily average temperature, while in Budapest no such correlation was detected. These results also show that in the case of PM2.5, traffic at the Budapest sampling site played a more important role in the development of aerosol pollution than in Debrecen. In contrast, in Debrecen, aerosol from heating (domestic burning and thermal power plants) dominated the PM2.5 fraction in the sampling period. Wind speed had no significant effect on aerosol concentrations in any of the cities. The temporal variation of the elements related to traffic and mineral dust was mainly determined by the rhythm of working days–weekends in both cities, especially in the coarse fraction (Figure 6).
The temporal variation of Cl concentration is shown in Figure 7. In general, the elemental concentration was higher in both size fractions in Budapest. High Cl concentration values appeared episodically in both cities and these episodes occurred at the same time at the two sampling sites in most cases. Based on meteorological data, it can be stated that these episodes were related to snowfalls [74,75]. At both sites snowing was observed, usually at the same time, and all the episodic peaks in the evolution of Cl concentration in the coarse fraction could be attributed to snowfalls. Therefor the origin of Cl in the coarse fraction was most likely the salting of roads [76]. In the fine fraction, most Cl peaks could also be associated with snowfalls; however, in this case other sources could also contribute to the episodic increases in Cl concentration. In order to identify the source of Cl and the other components, receptor model calculations based on positive matrix factorization were performed using EPA PMF 5.0 model.

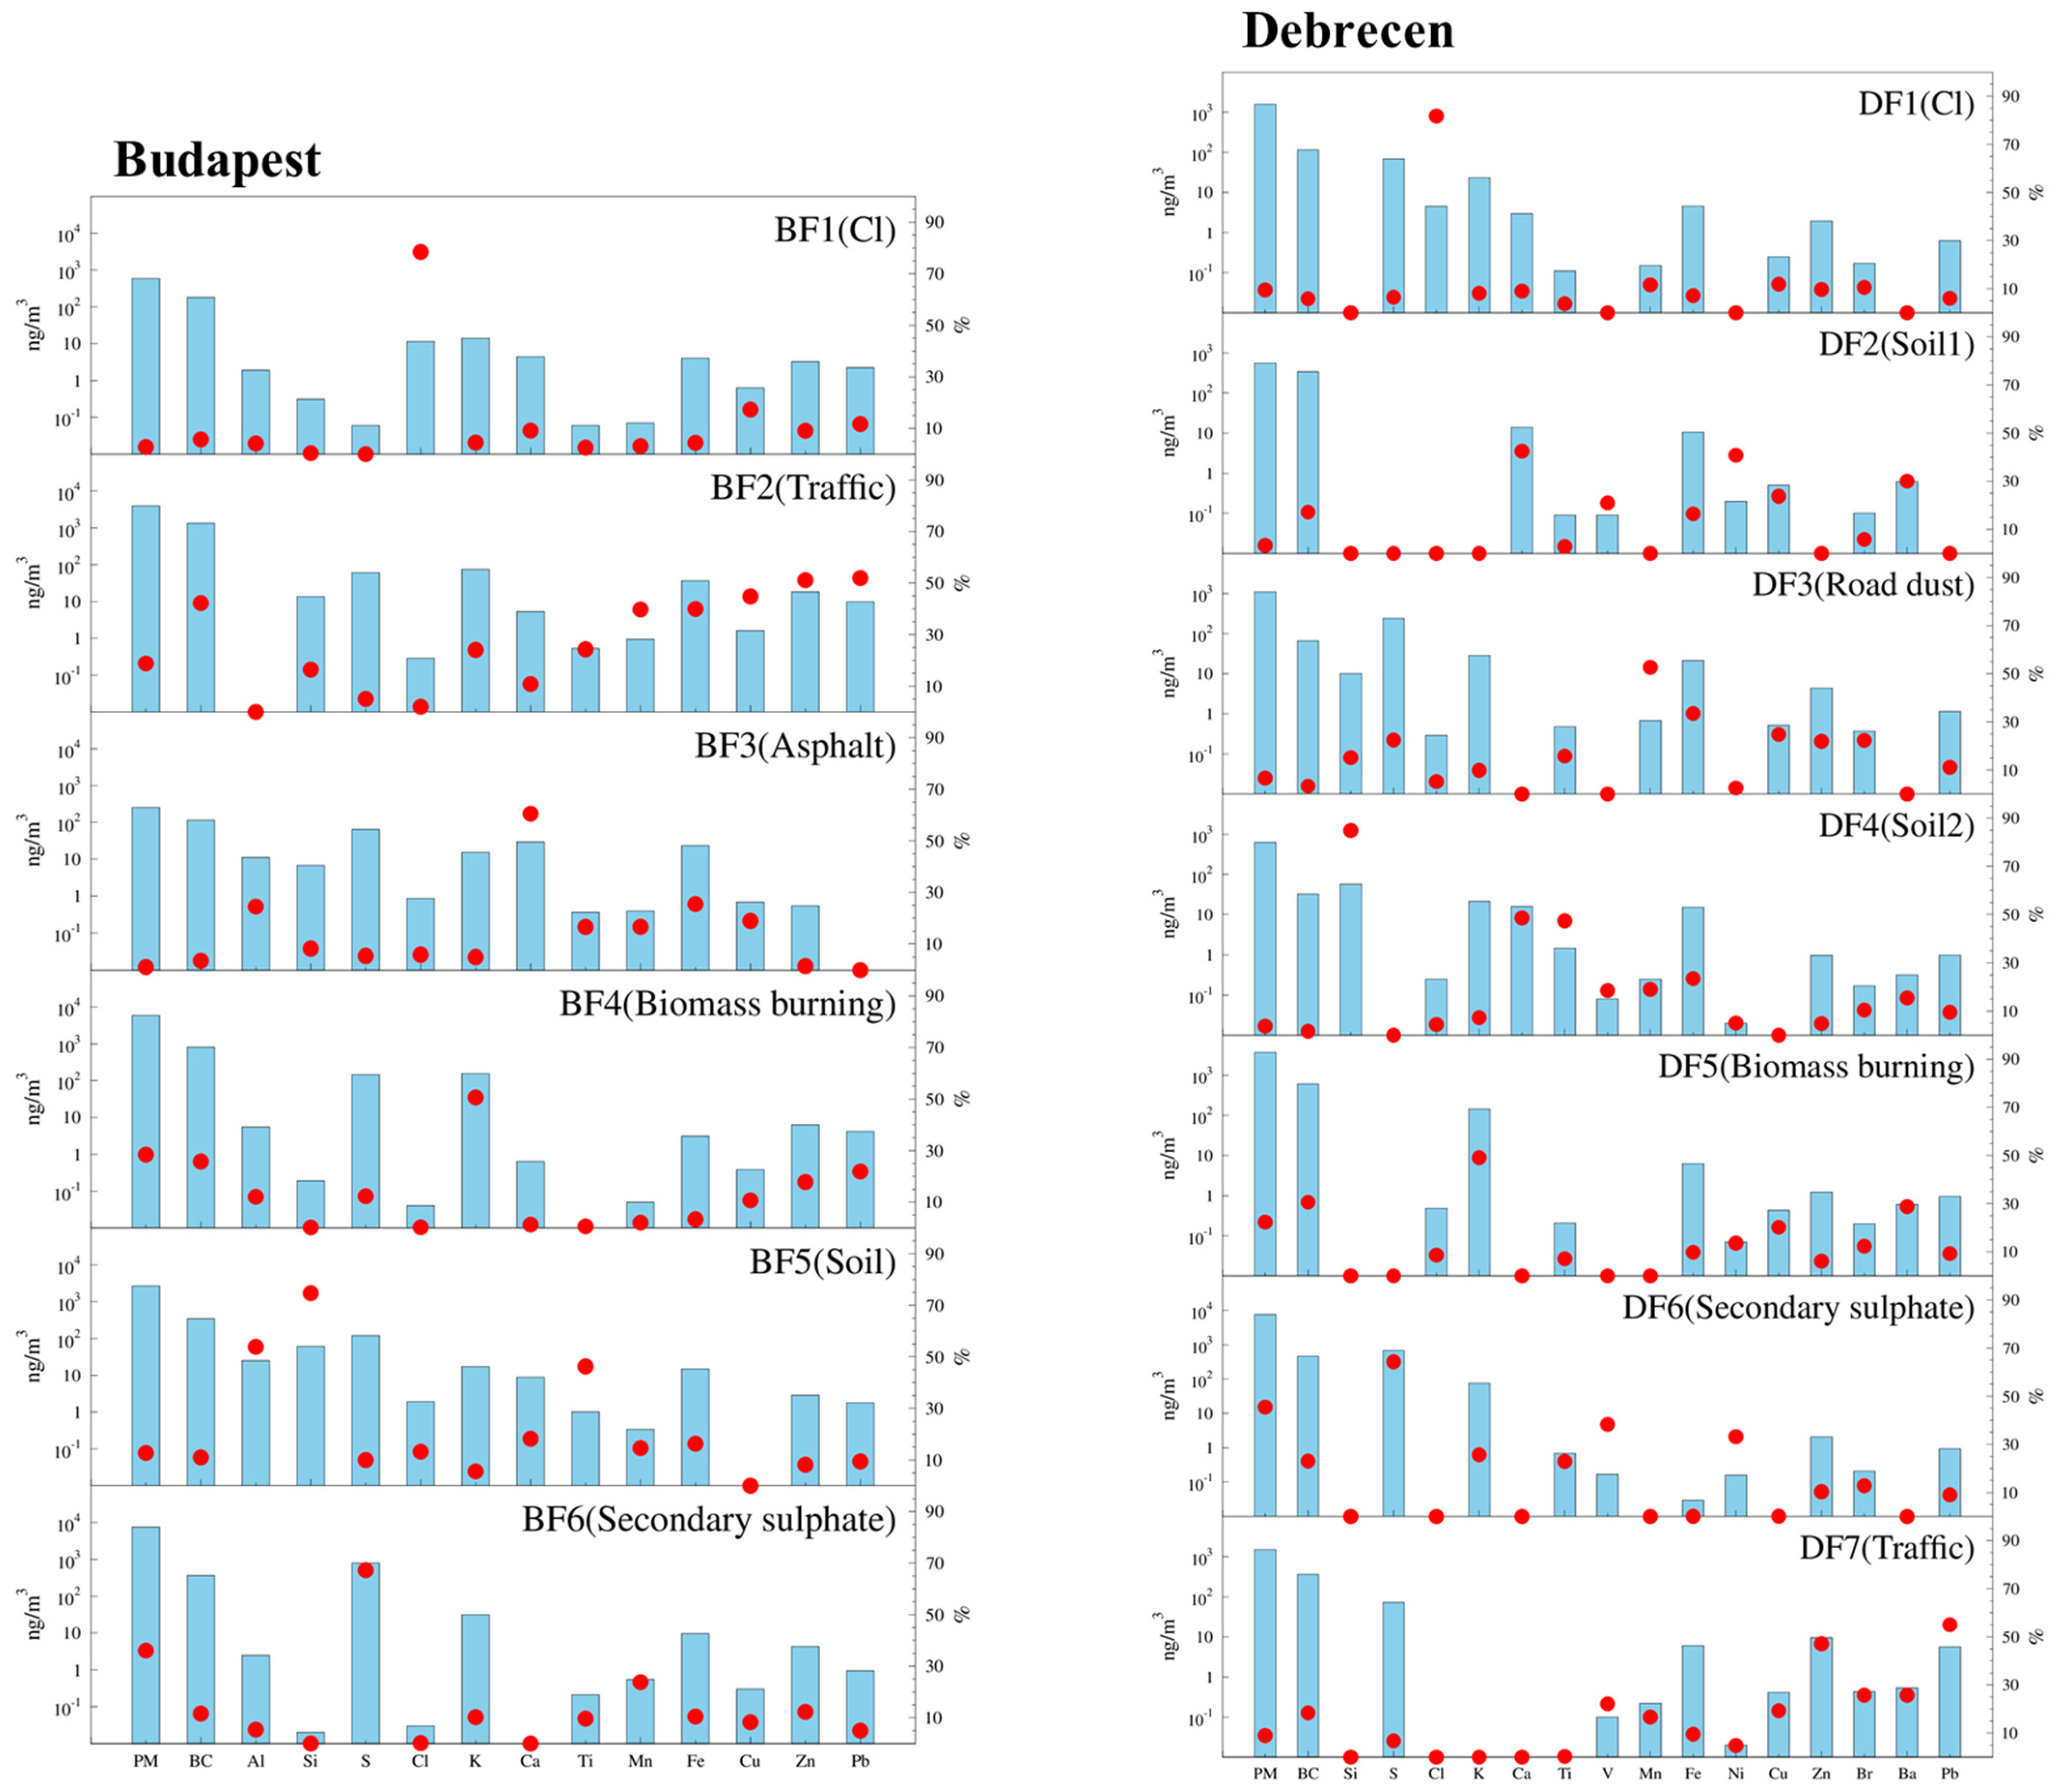
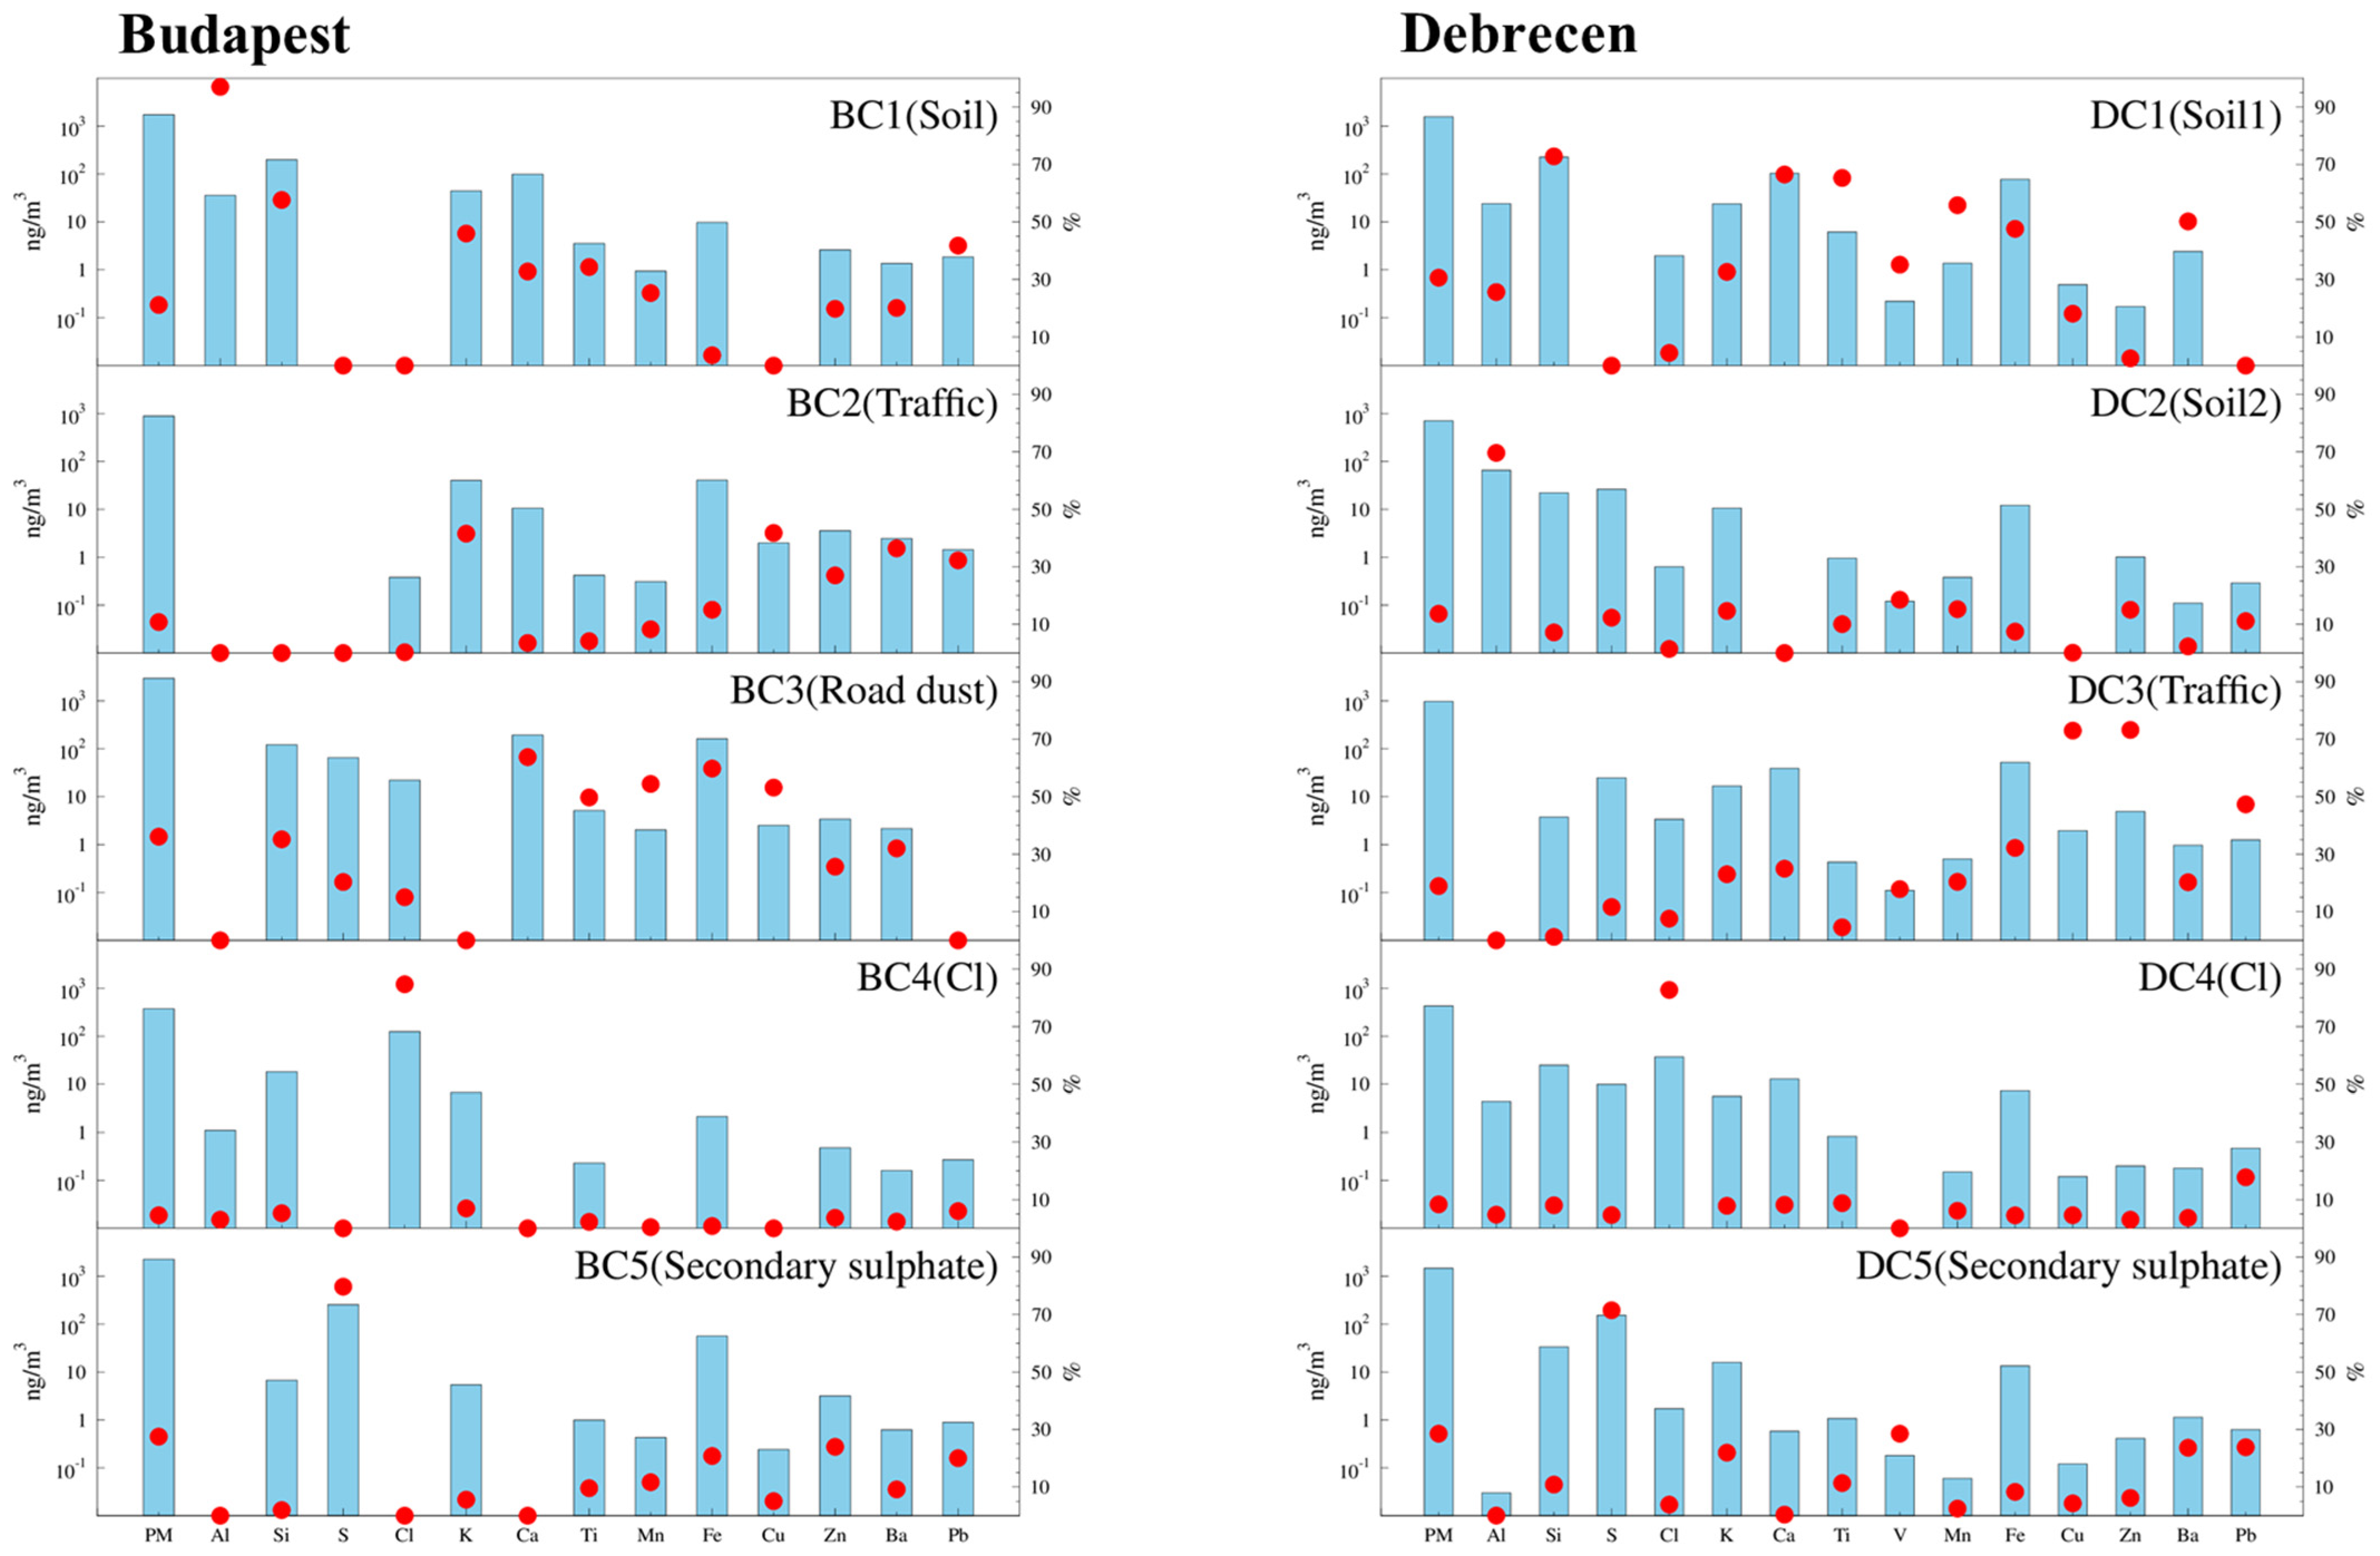
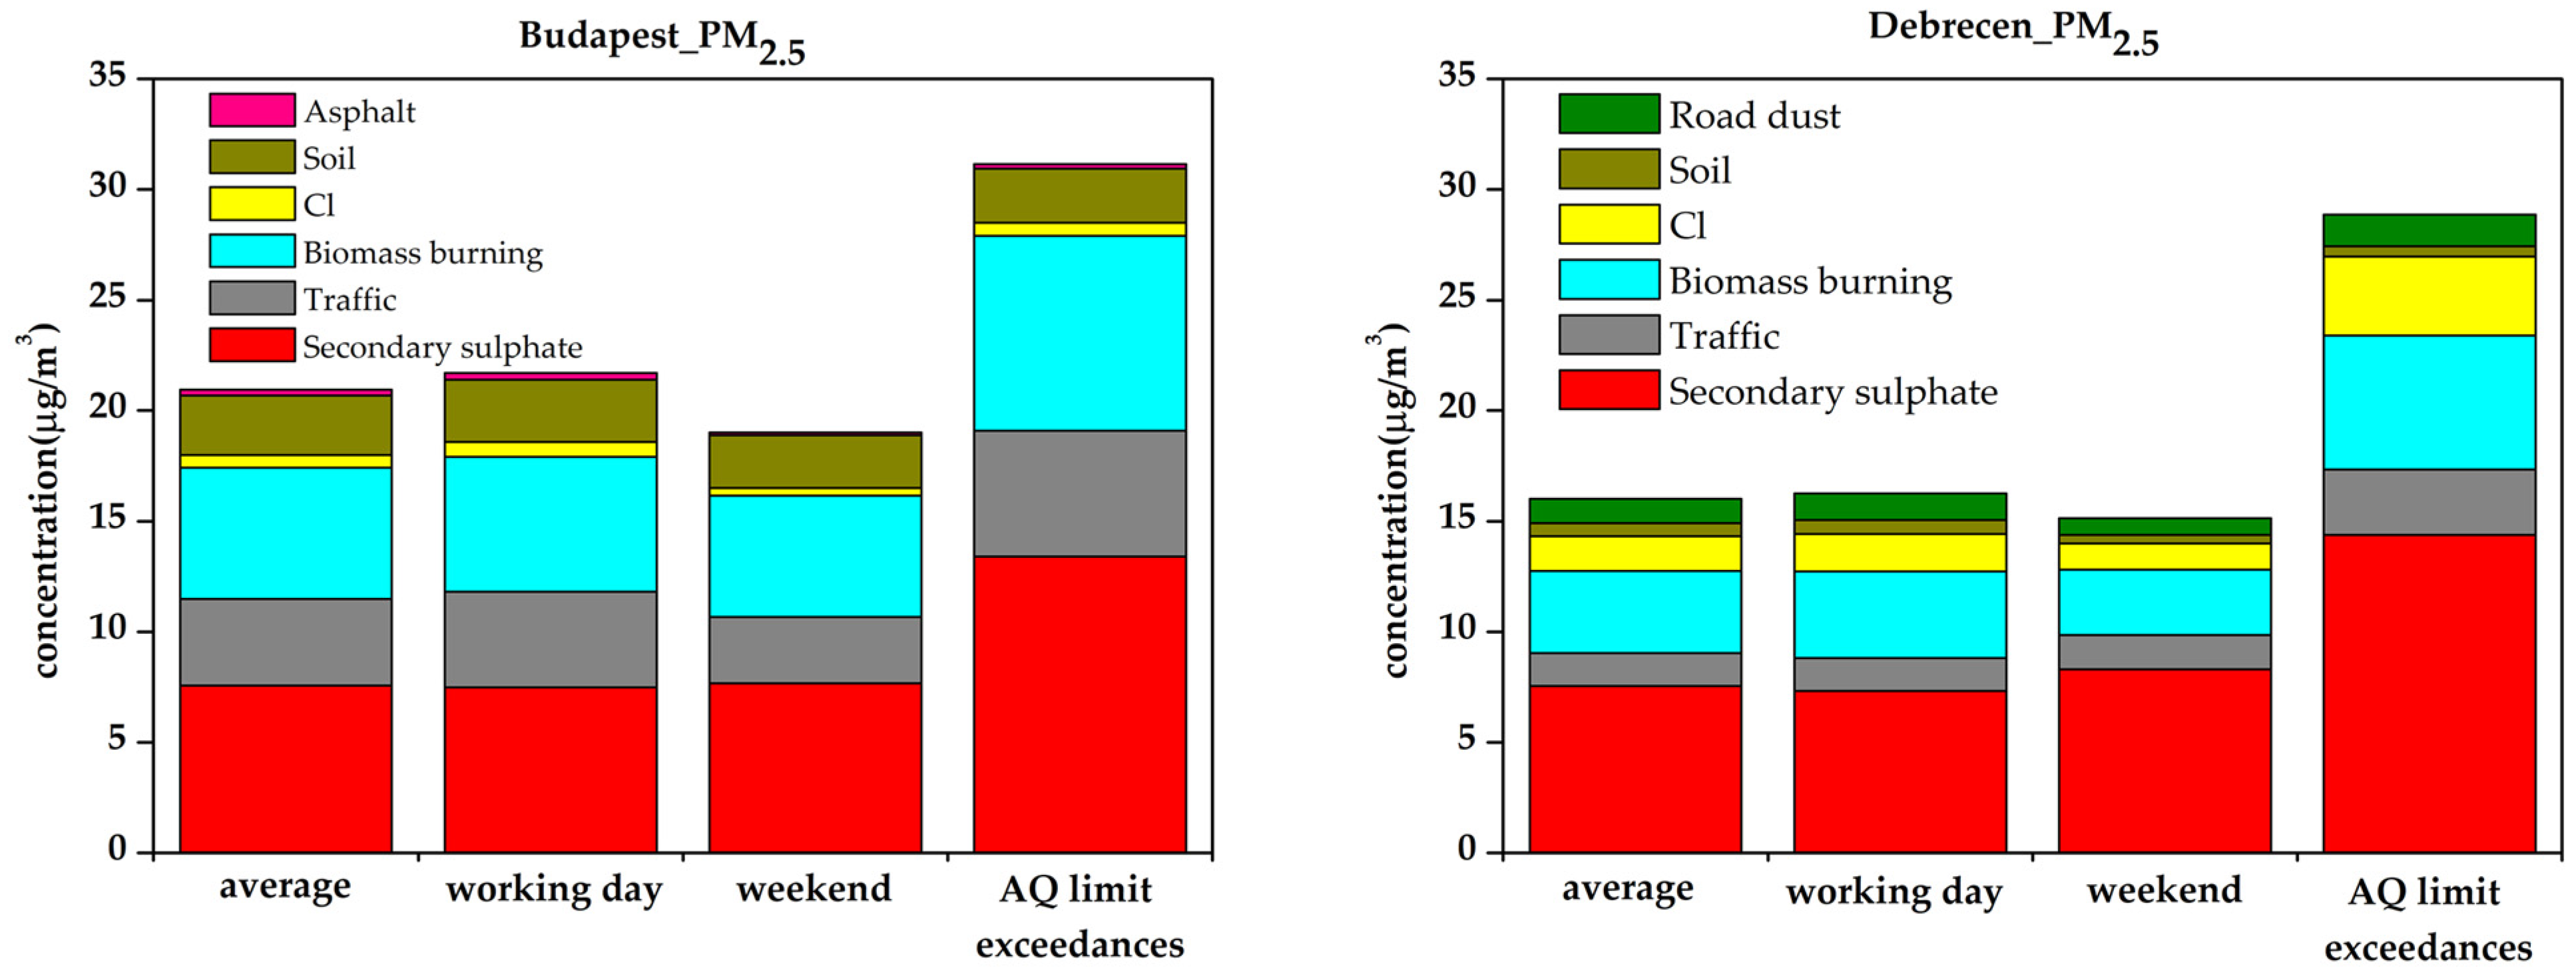
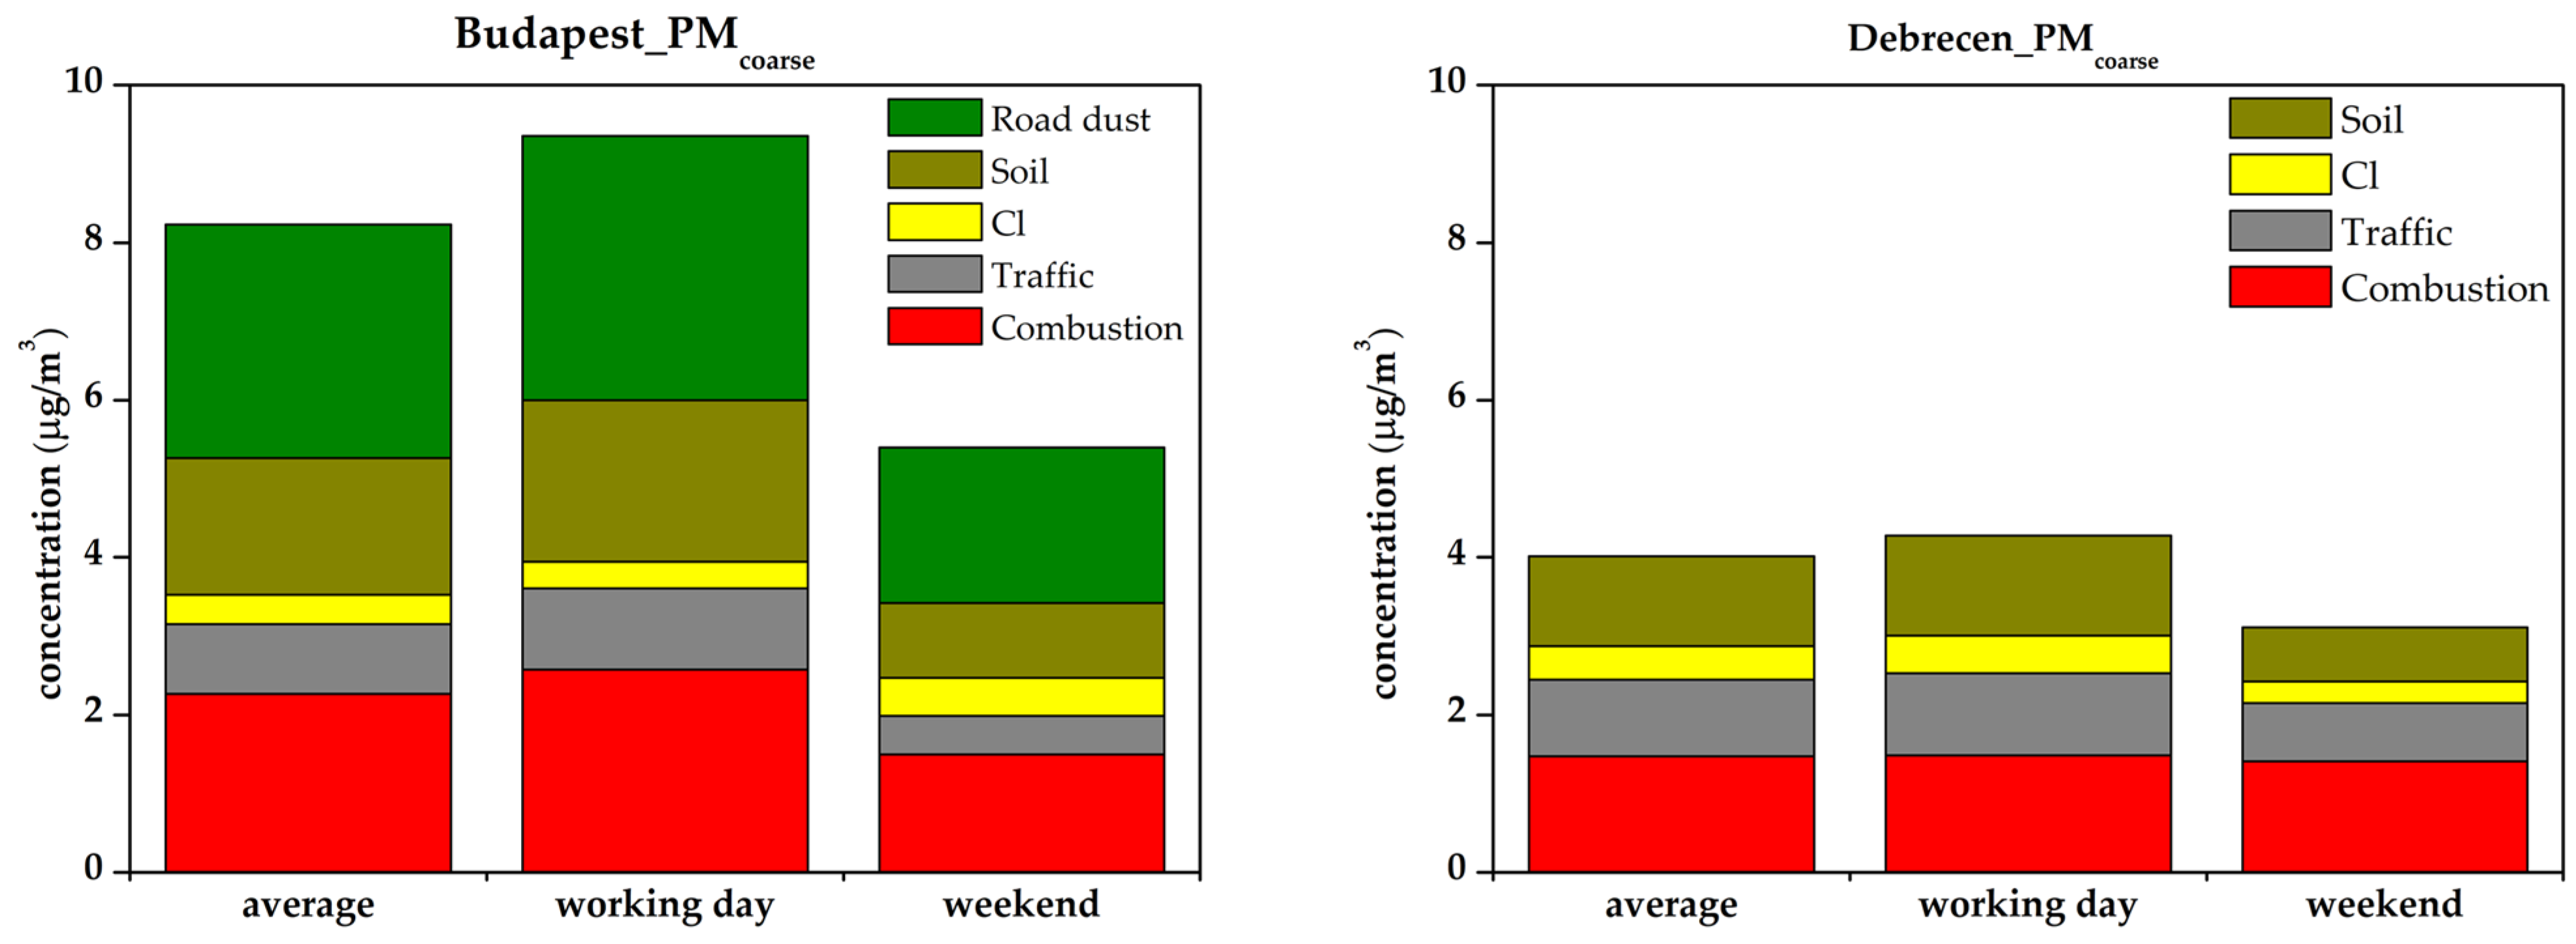
3.3. Sources of Urban Aerosol Pollution

Aerosol sources in the sampled cities were determined using the positive matrix factorization model developed by the EPA [57]. The analysis was performed separately for both the fine and coarse fraction data sets, during which outliers were excluded so as not to cause bias in the results. At both sampling sites, five sources were identified in the coarse fraction. In the fine mode, six sources were recognized in Budapest and seven in Debrecen. Figure 8 and Figure 9 show the source profiles of the fine and coarse fractions, respectively.
In the case of the fine fraction in Debrecen, the high Cl content in DF1 (contains almost 90% of the Cl) and the time pattern assigned this factor to the winter salting of roads, as the peaks appeared after the snowfalls [76]. Factors DF2 and DF4 were defined as soil because the constituents of mineral dust (Al, Ca, Si, Ti, Mn, Fe, and Ba) were the predominant elements. The presence of two soil factors is explained by the location of the city. The borderline of two landscapes, the Hajdúhát—Hajdúság (loess area) and Nyírség (sandy area) crosses the city in a N–S direction [47]. Factor DF3 is dominated by the traffic-related road dust elements. Mn and Fe are tracers of tram traffic, while Cu, Zn, and Pb are tracers of vehicle transport [77]. Factor DF5 was identified as biomass burning from domestic heating due to high K and BC concentrations [78]. Factor DF6 is characterized by high sulfur content. S is found in the aerosol primarily in various compounds of SO42−. Fossil fuel (coal, oil, etc.) burning and diesel engines are their primary sources [79]. Fingerprint elements of heavy oil combustion, such as V and Ni, also appear in this factor [80]. Factor DF7 is characterized by heavy metals and BC which are tracers of traffic. The origin of Cu is brake abrasion while Zn can be derived from the wear of tires, as ZnO is used in the vulcanization process in the production of tires [81]. Pb can be the result of wear and abrasion of winter tires. Although leaded petrol was essential for the operation of older and mainly eastern-European cars, it was banned in Hungary in 1999 due to its negative effects. Since then, emissions of lead have decreased significantly; however, Pb is still present in the road dust [82].
The following six sources were identified in the fine fraction in Budapest. The main component of factor BF1 is Cl which can be explained primarily by winter salting of roads in the same way as in Debrecen. In the case of factor BF2, the dominant elements are traffic-related metals (Mn, Fe, Cu, Zn, and Pb) and BC, so this factor was identified as traffic [83]. Factor BF3 is characterized by high Ca concentration and some heavy metals; therefore it was attributed to construction and asphalt wear [84]. Factor BF4 is biomass burning characterized by high K and BC concentrations. Factor BF5 contains the mineral constituents of soil (Al, Ca, Si, Ti, Mn, Fe, and Ba) and has therefore been identified as soil. Factor BF6, such as factor DF6, is characterized by high S concentration.
In the coarse fraction of Debrecen, factors DC1 and DC2 contain elements of mineral dust (Al, Si, Ca, Ti, Mn, Fe, and Ba) [50], therefore these factors were attributed to the two soil types of Debrecen described earlier [47]. The main of components factor DC3 are metals from traffic: Fe, Cu, Zn, and Pb [83]. The main constituent of the DC4 source is Cl. Its origin can be tracked back to the winter salting of the roads as “salt” (mostly in the form of NaCl) which was applied for de-icing of the roads [76,84]. Factor DC5 is characterized by a high concentration of S, the origin of which was most probably heating with oil [68]. Similar sources were identified in the coarse mode in Budapest too, with the difference that the “road dust” factor (BC3) appearing here, not in the fine mode as in Debrecen.
Absolute and relative contributions of the factors are presented in Table S2 (in Supplementary Materials) and in Figure 10 and Figure 11. Contributions for the whole period, for working days, weekends, and for polluted days (when PM2.5 concentrations were higher than 25 μg/m3) were also calculated. The two soil factors of Debrecen were merged in order to make the comparison clearer.
Sources dominating the fine fraction for both cities were secondary sulfate and biomass burning. The relative contribution of secondary sulfate was 36% in Budapest and 45% in Debrecen, while the contribution of biomass burning was 28% in the capital and 22% in Debrecen. The relative contribution of the source identified as traffic was 19% in Budapest and 9% in Debrecen. In Debrecen, soil together with road dust, contributed 14% to the total PM2.5 mass, while the summed contribution of soil and asphalt was the same in Budapest.
In the case of the coarse fraction, the contribution of the source identified as combustion was 28% for both cities. In Debrecen, the relative contribution of soil was 44%, and traffic gave 19%. In Budapest, the contribution of the soil factor was 21%, which was added up by the 36% of road dust and 11% of traffic factors.
When studying the time trend of source contributions, we found that in the fine fraction the increased concentrations were associated with cold days, so consequently biomass burning and sulfate from oil combustion were the dominant pollutants on these days. In March, the relative contribution of traffic and soil-related sources increased markedly. For the Cl-rich source, the temporal variation was similar in the two cities corresponding to episodes of snowfall. The trends seen in the fine fraction were also observed in the coarse mode. Sulfate from combustion dominated on cold days, while traffic, road dust, and soil were the main contributors in March. Cl appeared after snowfalls.
In the days with high pollution levels, the source contribution of fine fraction sulfate in both cities increased almost twofold compared to the average. In addition, it can be seen that the absolute contribution of sulfate was very similar in the two cities (~7.5 μg/m3) over the period, suggesting a regional origin. In the case of the source identified as traffic, much smaller contributions (up to 50%) were measured in Budapest on weekends compared to working days, while in Debrecen there was no significant difference between weekends and weekdays. However, the contribution of this source was also almost twice as high as the average for days of exceedances. The contribution from biomass burning showed an increase for the exceedances compared to the other periods. The contribution of the Cl-traced, soil, and asphalt sources decreased in the weekends. In the case of traffic, biomass burning, and soil, the absolute contributions were significantly higher in Budapest than in Debrecen.
In the coarse fraction in Budapest, the absolute contribution of sulfate, traffic, soil, and road dust decreased on weekends compared to working days. In Debrecen, the main difference between weekdays and weekend was in the contribution of soil, which was reduced during the weekend. Furthermore, a decrease was also observed in the traffic contribution, but to a lesser extent than for soil. The contribution of the factor identified as combustion showed the same value on weekdays and weekends. A comparison of the two cities shows that the contribution of transport-related sources (traffic, road dust, re-suspended dust) was much higher in Budapest. There were two high-pollution level episodes with 49.5 and 58 μg/m3 concentrations on 22 and 27 January in the coarse fraction in Budapest (see Figure 2). These were days with very low temperatures (−6 and −9 °C). In addition, these were the only two days within the cold periods in January when the wind direction was S, SE (wind speed was 3.7 and 2 m/s, respectively). The contribution of combustion was 50% on these days, and the tracers of the combustion factor (S, Pb, and Zn) also had very high concentrations on these days.

3.4. Comparison with Data from 2015

There are data available for the same sampling sites in the heating period of 2015, 5 years later than the present study. In Vratolis et al. [39] composition and sources of PM2.5 at Gilice tér is presented, together with results from Zagreb and Sofia. In the heating period (9 February–20 March) the average PM2.5 concentration was found to be 25 μg/m3 (measured by β-attenuation method) which is similar to the corresponding PM2.5 data from the present study. They identified the following sources: soil, traffic, biomass burning, secondary aerosols, and a nitrate rich source with biomass burning. The estimated source contributions were almost identical to our findings in 2010: (e.g., secondary aerosols: 7.6 μg/m3 (2010) to 7.0 μg/m3 (2015), biomass burning: 5.9 μg/m3 (2010) and 6.3 μg/m3 (2015), soil: 2.7 μg/m3 (2010) and 2.9 μg/m3 (2015).
For the Debrecen site, PM2.5 data from 2014–2015 can be found in Almeida et al. [40]. For comparison purposes, data from the same winter period (December, 2014 to March, 2015) are used here. The mean PM2.5 concentration for the winter of 2014–15 was 15.6 μg/m3. Five years earlier this value was 17 μg/m3. The same sources were identified for the PM2.5 pollution: two types of soil, biomass burning, secondary aerosols, traffic, and Cl. In this case, the contribution of soil and traffic were similar in the two investigated years; however, the contribution of biomass burning doubled from 2010 to 2015, while there was a decrease in the contribution of secondary aerosols. We can conclude that basically the same tendencies could be observed at the two sites.
Our findings fit well in the regional panorama presented in [39,40]. The main sources of PM2.5 pollution in winter were biomass burning, secondary aerosols, traffic, fuel oil combustion, coal combustion, and industry in the investigated urban background sites in middle-eastern and southern Europe. Compared to other cities, such as Zagreb, Belgrade, or Krakow, the contribution of secondary aerosols was higher in Hungary, while the industry factor was missing. In our case, the oil combustion appeared in the coarse fraction, while the relative contribution of biomass burning was very similar to the neighboring countries. We have not seen contribution of coal combustion in either in 2010 or 2015, whereas heating with coal was the main source of pollution in winter in Poland. Considering the PM2.5 levels, both cities belong to the average, moderately polluted sites.

4. Summary and Conclusions

In the present work, atmospheric aerosol pollution was characterized in the winter of 2009–2010 in two Hungarian cities (Budapest and Debrecen) by analyzing daily aerosol samples. On average, the mass concentrations of PM10, PM2.5, and PMcoarse were higher in Budapest than in Debrecen. The PM2.5/PM10 ratio ranged from 60 to 78% for both cities, indicating the dominance of the fine fraction aerosol during the study period. The daily evolution of mass concentrations showed that there were lower concentrations on weekends than on weekdays. The daily concentration of PM10 exceeded the 24-h AQ limit value (50 μg/m3) seven times in Budapest and on one occasion in Debrecen. In the case of PM2.5 fraction, the number of exceedances of the WHO recommended limit value (15 μg/m3) were 67 in Budapest and 46 in Debrecen, which is 73% and 50% of the investigated period, respectively. At the time of the exceedances the daily average temperature was always below freezing.
Elements of natural origin (Al, Si, Ca, Ti, Mn, Fe, and Ba) and chlorine were found to be dominant in the coarse fraction, while elements of anthropogenic origin (S, K, Cu, Zn, and Pb) were predominant in the fine fraction. Similar concentrations were measured in the two cities in the case of S, which originates from regional transport, and K, which serves as a tracer for biomass combustion. Traffic-related elements were present in 2–3-times higher concentrations in Budapest. The episodic peaks in the Cl time series could be attributed to snowfalls.
Sources of APM pollution were identified by using the EPA PMF 5.0 receptor model. The profiles of the sources and the relative and absolute contributions of each source were established. The following sources were identified in the coarse fraction in Budapest: soil, traffic, road dust, secondary sulfate, and a Cl-traced source. In Debrecen, two types of soil (quicksand and loess), traffic, secondary sulfate, and a Cl-traced source were recognized in the coarse mode. Sources determined in the fine fraction were soil, traffic, biomass burning, secondary sulfate, and a Cl rich source in Budapest and biomass burning, traffic, secondary sulfate, the Cl-rich source, road dust, and two types of soil in Debrecen. The contribution of secondary sulfate (which originates from regional transport) was the same in the two cities, while the contribution of sources related to traffic was significantly higher in Budapest. On polluted days, when the PM2.5 concentration exceeded 25 μg/m3, the contribution of secondary sulfate, domestic heating, and traffic increased significantly compared to the average. On weekends and holidays, the contribution of soil and traffic decreased.
In this study, we have provided information about the composition and sources of urban particulate matter pollution in two Hungarian cities for the most polluted period of a year, not only for PM2.5, but also for the coarse fraction. The synchronized sampling at the two sites made it possible to study the connection between the air pollution in the cities and establish regional effects besides exploring the influence of local meteorological parameters and human activities. We have shown that source apportionment of the coarse fraction, besides the PM2.5, gives valuable information about the local air pollution, which could serve as a basis of future abatement strategies. Our findings for the PM2.5 fraction could be compared to results 5 years later. We have seen that the PM2.5 concentrations and the sources of PM2.5 pollution in the heating season did not change in the investigated years. In 2010 and 2015, the source contributions were similar except for biomass burning. The share of biomass burning almost doubled in 5-years’ time at both sites, indicating a change of heating habits. Whether this change was temporary or permanent is a question for further studies. The information on the variation of source contribution estimates on longer time scales are essential to policy makers in order to see the effects of different air pollution reduction measures.

Supplementary Materials

The following supporting information can be downloaded at: https://www.mdpi.com/article/10.3390/atmos13040554/s1, Table S1: Minimum detection limits (MDL) and analytical uncertainties of the of the applied analytical methods; Table S2: Absolute (in μg/m3) and relative (in%) source contributions.

Author Contributions

E.F.; were responsible for the sampling, E.F., A.A., Z.S., E.P., Z.T., and Z.K.; performed the experimental work and the compositional analysis, E.F. and A.A.; performed the data analysis, E.F. and Z.K., carried out the source apportionment, Z.K., performed the statistical analysis. E.F.; drafted the manuscript, Z.K.; made the review of the original draft, A.A. and E.P.; contributed to the review and editing. Z.K.; was the supervisor of the project and was responsible for the coordination and management, too. All authors have read and agreed to the published version of the manuscript.

Funding

The research was partially supported by the European Union and the State of Hungary, co-financed by the European Regional Development Fund in the project of GINOP-2.3.2-15-2016-00009 ‘ICER’.

Institutional Review Board Statement

Not applicable.

Data Availability Statement

The datasets generated and analyzed during the current study are not publicly available but are available from the corresponding author on reasonable request.

Conflicts of Interest

The authors declare no conflict of interest.

References

  1. UN; Department of Economic and Social Affairs, Population Division. The World’s Cities in 2018—Data Booklet; ST/ESA/SER.A/417; UN: New York, NY, USA, 2018. [Google Scholar]
  2. Cohen, A.J.; Anderson, H.R.; Ostro, B.; Pandey, K.D.; Krzyzanowski, M.; Kunzli, N.; Gutschmidt, K.; Pope, A.; Romieu, I.; Samet, J.M.; et al. The global burden of disease due to outdoor air pollution. J. Toxicol. Environ. Health Part A-Curr. Issues 2005, 68, 1301–1307. [Google Scholar] [CrossRef] [PubMed]
  3. Paraskevopoulou, D.; Liakakou, E.; Gerasopoulos, E.; Mihalopoulos, N. Sources of atmospheric aerosol from long-term measurements (5 years) of chemical composition in Athens, Greece. Sci. Total Environ. 2015, 527, 165–178. [Google Scholar] [CrossRef] [PubMed]
  4. Cesari, D.; Donateo, A.; Conte, M.; Merico, E.; Giangreco, A.; Giangreco, F.; Contini, D. An inter-comparison of PM2.5 at urban and urban background sites: Chemical characterization and source apportionment. Atmos. Res. 2016, 174, 106–119. [Google Scholar] [CrossRef]
  5. Khain, A.; Lynn, B.; Shpund, J. High resolution WRF simulations of Hurricane Irene: Sensitivity to aerosols and choice of microphysical schemes. Atmos. Res. 2016, 167, 129–145. [Google Scholar] [CrossRef] [Green Version]
  6. Zhao, H.J.; Che, H.Z.; Ma, Y.J.; Xia, X.G.; Wang, Y.F.; Wang, P.; Wu, X.C. Temporal variability of the visibility, particulate matter mass concentration and aerosol optical properties over an urban site in Northeast China. Atmos. Res. 2015, 166, 204–212. [Google Scholar] [CrossRef]
  7. IPCC. Climate Change 2014: Impacts, Adaptation, and Vulnerability; AnnexII. Glossary; Field, C.B., Barros, V.R., Dokken, D.J., Mach, K.J., Mastrandrea, M.D., Bilir, T.E., Chatterjee, M., Ebi, K.L., Estrada, Y.O., Genova, R.C., et al., Eds.; Cambridge University Press: Cambridge, UK; New York, NY, USA, 2014; p. 1763. Available online: http://www.ipcc.ch/report/ar5/wg2/ (accessed on 24 March 2022).
  8. Amann, M.; Bertok, I.; Cofala, J.; Gyarfas, F.; Heyes, C.; Klimont, Z.; Schöpp, W.; Winiwarter, W. Baseline Scenarios for the Clean Air for Europe (CAFE) Programme. Available online: https://ec.europa.eu/environment/archives/cafe/activities/pdf/cafe_scenario_report_1.pdf (accessed on 24 March 2022).
  9. Pope, C.A.; Burnett, R.T.; Thun, M.J.; Calle, E.E.; Krewski, D.; Ito, K.; Thurston, G.D. Lung cancer, cardiopulmonary mortality, and long-term exposure to fine particulate air pollution. JAMA-J. Am. Med. Assoc. 2002, 287, 1132–1141. [Google Scholar] [CrossRef] [Green Version]
  10. Martins, V.; Minguillon, M.C.; Moreno, T.; Querol, X.; de Miguel, E.; Capdevila, M.; Centelles, S.; Lazaridis, M. Deposition of aerosol particles from a subway microenvironment in the human respiratory tract. J. Aerosol Sci. 2015, 90, 103–113. [Google Scholar] [CrossRef] [Green Version]
  11. Nel, A. Air pollution-related illness: Effects of particles. Science 2005, 309, 1326. [Google Scholar] [CrossRef]
  12. Monn, C. Exposure assessment of air pollutants: A review on spatial heterogeneity and indoor/outdoor/personal exposure to suspended particulate matter, nitrogen dioxide and ozone. Atmos. Environ. 2001, 35, 1–32. [Google Scholar] [CrossRef]
  13. Putaud, J.P.; Van Dingenen, R.; Alastuey, A.; Bauer, H.; Birmili, W.; Cyrys, J.; Flentje, H.; Fuzzi, S.; Gehrig, R.; Hansson, H.C.; et al. A European aerosol phenomenology-3: Physical and chemical characteristics of particulate matter from 60 rural, urban, and kerbside sites across Europe. Atmos. Environ. 2010, 44, 1308–1320. [Google Scholar] [CrossRef]
  14. Amato, F.; Alastuey, A.; Karanasiou, A.; Lucarelli, F.; Nava, S.; Calzolai, G.; Severi, M.; Becagli, S.; Gianelle, V.L.; Colombi, C.; et al. AIRUSE-LIFE+: A harmonized PM speciation and source apportionment in 5 Southern European Cities. Atmos. Chem. Phys. Discuss. 2016, 15, 23989–24039. [Google Scholar] [CrossRef] [Green Version]
  15. Costa, V.; Bacco, D.; Castellazzi, S.; Ricciardelli, I.; Vecchietti, R.; Zigola, C.; Pietrogrande, M.C. Characteristics of carbonaceous aerosols in Emilia-Romagna (Northern Italy) based on two fall/winter field campaigns. Atmos. Res. 2016, 167, 100–107. [Google Scholar] [CrossRef]
  16. Pauraite, J.; Mordas, G.; Bycenkiene, S.; Ulevicius, V. Spatial and Temporal Analysis of Organic and Black Carbon Mass Concentrations in Lithuania. Atmosphere 2015, 6, 1229–1242. [Google Scholar] [CrossRef] [Green Version]
  17. Vodicka, P.; Schwarz, J.; Cusack, M.; Zdimal, V. Detailed comparison of OC/EC aerosol at an urban and a rural Czech background site during summer and winter. Sci. Total Environ. 2015, 518, 424–433. [Google Scholar] [CrossRef] [PubMed]
  18. Avino, P.; Manigrasso, M.; Rosada, A.; Dodaro, A. Measurement of organic and elemental carbon in downtown Rome and background area: Physical behavior and chemical speciation. Environ. Sci.-Process. Impacts 2015, 17, 300–315. [Google Scholar] [CrossRef]
  19. Heal, M.R.; Hammonds, M.D. Insights into the Composition and Sources of Rural, Urban and Roadside Carbonaceous PM10. Environ. Sci. Technol. 2014, 48, 8995–9003. [Google Scholar] [CrossRef]
  20. Dall’Osto, M.; Querol, X.; Amato, F.; Karanasiou, A.; Lucarelli, F.; Nava, S.; Calzolai, G.; Chiari, M. Hourly elemental concentrations in PM2.5 aerosols sampled simultaneously at urban background and road site during SAPUSS-diurnal variations and PMF receptor modelling. Atmos. Chem. Phys. 2013, 13, 4375–4392. [Google Scholar] [CrossRef] [Green Version]
  21. Gianini, M.F.D.; Piot, C.; Herich, H.; Besombes, J.L.; Jaffrezo, J.L.; Hueglin, C. Source apportionment of PM10, organic carbon and elemental carbon at Swiss sites: An intercomparison of different approaches. Sci. Total Environ. 2013, 454, 99–108. [Google Scholar] [CrossRef]
  22. Beuck, H.; Quass, U.; Klemm, O.; Kuhlbusch, T.A.J. Assessment of sea salt and mineral dust contributions to PM10 in NW Germany using tracer models and positive matrix factorization. Atmos. Environ. 2011, 45, 5813–5821. [Google Scholar] [CrossRef]
  23. Arruti, A.; Fernandez-Olmo, I.; Irabien, A. Regional evaluation of particulate matter composition in an Atlantic coastal area (Cantabria region, northern Spain): Spatial variations in different urban and rural environments. Atmos. Res. 2011, 101, 280–293. [Google Scholar] [CrossRef]
  24. Van Dingenen, R.; Raes, F.; Putaud, J.P.; Baltensperger, U.; Charron, A.; Facchini, M.C.; Decesari, S.; Fuzzi, S.; Gehrig, R.; Hansson, H.C.; et al. A European aerosol phenomenology-1: Physical characteristics of particulate matter at kerbside, urban, rural and background sites in Europe. Atmos. Environ. 2004, 38, 2561–2577. [Google Scholar] [CrossRef]
  25. Querol, X.; Alastuey, A.; Ruiz, C.R.; Artinano, B.; Hansson, H.C.; Harrison, R.M.; Buringh, E.; ten Brink, H.M.; Lutz, M.; Bruckmann, P.; et al. Speciation and origin of PM10 and PM2.5 in selected European cities. Atmos. Environ. 2004, 38, 6547–6555. [Google Scholar] [CrossRef]
  26. Juda-Rezler, K. Assessing the winter time air pollution in Cracow (Poland) in relation with possible influences on human health and cultural heritage. Pol. J. Environ. Stud. 2006, 15, 123–128. [Google Scholar]
  27. Houthuijs, D.; Breugelmans, O.; Hoek, G.; Vaskovi, E.; Mihalikova, E.; Pastuszka, J.S.; Jirik, V.; Sachelarescu, S.; Lolova, D.; Meliefste, K.; et al. PM10 and PM2.5 concentrations in Central and Eastern Europe: Results from the Cesar study. Atmos. Environ. 2001, 35, 2757–2771. [Google Scholar] [CrossRef]
  28. Kukkonen, J.; Pohjola, M.; Sokhi, R.S.; Luhana, L.; Kitwiroon, N.; Fragkou, L.; Rantamäki, M.; Berge, E.; Ødegaard, V.; Slørdal, L.H.; et al. Analysis and evaluation of selected local-scale PM10 air pollution episodes in four European cities: Helsinki, London, Milan and Oslo. Atmos. Environ. 2005, 39, 2759–2773. [Google Scholar] [CrossRef]
  29. Wilczyńska-Michalik, W.; Różańska, A.; Bulanda, M.; Chmielarczyk, A.; Pietras, B.; Michalik, M. Physicochemical and microbiological characteristics of urban aerosols in Krakow (Poland) and their potential health impact. Environ. Geochem. Health 2021, 43, 4601–4626. [Google Scholar] [CrossRef]
  30. Zimnoch, M.; Morawski, F.; Kuc, T.; Samek, L.; Bartyzel, J.; Gorczyca, Z.; Skiba, A.; Rozanski, K. Summer–winter contrast in carbon isotope and elemental composition of total suspended particulate matter in the urban atmosphere of Krakow, Southern Poland. Nukleonika 2020, 65, 181–191. [Google Scholar] [CrossRef]
  31. Błaszczak, B.; Widziewicz-Rzońca, K.; Zioła, N.; Klejnowski, K.; Juda-Rezler, K. Chemical characteristics of fine particulate matter in Poland in relation with data from selected rural and urban background stations in Europe. Appl. Sci. 2019, 9, 98. [Google Scholar] [CrossRef] [Green Version]
  32. Vossler, T.; Cernikovsky, L.; Novak, J.; Placha, H.; Krejci, B.; Nikolova, I.; Chalupnickova, E.; Williams, R. An investigation of local and regional sources of fine particulate matter in Ostrava, the Czech Republic. Atmos. Pollut. Res. 2015, 6, 454–463. [Google Scholar]
  33. Vossler, T.; Černikovský, L.; Novák, J.; Williams, R. Source apportionment with uncertainty estimates of fine particulate matter in Ostrava, Czech Republic using Positive Matrix Factorization. Atmos. Pollut. Res. 2016, 7, 503–512. [Google Scholar] [CrossRef]
  34. Jandacka, D.; Durcanska, D. Differentiation of particulate matter sources based on the chemical composition of PM10 in functional urban areas. Atmosphere 2019, 10, 583. [Google Scholar] [CrossRef] [Green Version]
  35. Alina, N.; Bogdan, N.; Dumitru, M. Evaluation of Air Pollution by Particulate Matter PM10 in the NE Region of Romania. Available online: http://georeview.ro/ojs/index.php/revista/article/view/432 (accessed on 24 March 2022).
  36. Proorocu, M.; Odagiu, A.; Oroian, I.G.; Ciuiu, G.; Dan, V. Particulate matter status in romanian urban areas: PM10 pollution levels in bucharest. Environ. Eng. Manag. J. 2014, 13, 3115–3122. [Google Scholar] [CrossRef]
  37. Jeričević, A.; Grgičin, V.D.; Prtenjak, M.T.; Vidič, S.; Bloemen, H. Analyses of urban and rural particulate matter mass concentrations in Croatia in the period 2006–2014. Geofizika 2016, 33, 157–181. [Google Scholar] [CrossRef]
  38. Habulan, M.; Đurin, B.; Siročić, A.P.; Sakač, N. Analysis of the Particulate Matter Pollution in the Urban Areas of Croatia, EU. Environ. Sci. Proc. 2021, 4, 9. [Google Scholar] [CrossRef]
  39. Perrone, M.G.; Vratolis, S.; Georgieva, E.; Török, S.; Šega, K.; Veleva, B.; Osán, J.; Bešlić, I.; Kertész, Z.; Pernigotti, D.; et al. Sources and geographic origin of particulate matter in urban areas of the Danube macro-region: The cases of Zagreb (Croatia), Budapest (Hungary) and Sofia (Bulgaria). Sci. Total Environ. 2018, 619, 1515–1529. [Google Scholar] [CrossRef]
  40. Almeida, S.M.; Manousakas, M.; Diapouli, E.; Kertesz, Z.; Samek, L.; Hristova, E.; Šega, K.; Alvarez, R.P.; Belis, C.A.; Eleftheriadis, K.; et al. Ambient particulate matter source apportionment using receptor modelling in European and Central Asia urban areas. Environ. Pollut. 2020, 266, 115–199. [Google Scholar] [CrossRef]
  41. Salma, I.; Maenhaut, W.; Zemplén-Papp, É.; Záray, G. Comprehensive characterisation of atmospheric aerosols in Budapest, Hungary: Physicochemical properties of inorganic species. Atmos. Environ. 2001, 35, 4367–4378. [Google Scholar] [CrossRef]
  42. Ferenczi, Z.; Imre, K.; Lakatos, M.; Molnár, Á.; Bozó, L.; Homolya, E.; Gelencsér, A. Long-term Characterization of Urban PM10 in Hungary. Aerosol Air Qual. Res. 2021, 21, 210048. [Google Scholar] [CrossRef]
  43. Czömpöly, O.; Börcsök, E.; Groma, V.; Pollastri, S.; Osán, J. Characterization of unique aerosol pollution episodes in urban areas using TXRF and TXRF-XANES. Atmos. Pollut. Res. 2021, 12, 101214. [Google Scholar] [CrossRef]
  44. Ferenczi, Z.; Bozó, L. Effect of the long-range transport on the air quality of greater Budapest area. Int. J. Environ. Pollut. 2017, 62, 407–416. [Google Scholar] [CrossRef]
  45. Angyal, F.Z.; Manousakas, M.; Furu, E.; Szoboszlai, Z.; Török, Z.; Papp, E.; Szikszai, Z.; Kertész, Z. Source identification of fine and coarse aerosol during smog episodes in Debrecen, Hungary. Air Qual. Atmos. Health 2021, 14, 1017–1032. [Google Scholar] [CrossRef]
  46. KözpontiStatisztikai Hivatal (KSH). Magyarország Közigazgatási Helynévkönyve 2013. 2013. Available online: https://www.ksh.hu/docs/hun/hnk/hnk_2013.pdf (accessed on 24 March 2022).
  47. Kft., C. Földrajzi Atlasz a 10–16 éves Tanulók Számára. 2005, pp. 7–17. Available online: https://utikonyv.eu/spd/k_739386/Foldrajzi-atlasz-a-10-16-eves-tanulok-szamara-CR-0 (accessed on 24 March 2022).
  48. Maenhaut, W.; Francois, F.; Cafmeyer, J. The “Gent” Stacked Filter Unit (SFU) Sampler for the Collection of Atmospheric Aerosols in Two Size Fractions: Description and Intrsuctions for Installation and Use; IAEA-NAHRES-19; IAEA: Vienna, Austria, 1994; pp. 249–263. [Google Scholar]
  49. Maenhaut, W.; Malmqvist, K.G. Particle–induced X-ray emission analysis. In Handbook of X-ray Spectrometry, 2nd ed.; Van Grieken, R.E., Ed.; Marcel Dekker: New York, NY, USA, 2001. [Google Scholar]
  50. Angyal, A.; Kertesz, Z.; Szikszai, Z.; Szoboszlai, Z.; Furu, E.; Csedreki, L.; Daroczi, L. Study of emission episodes of urban aerosols by ion beam analytical techniques. Nucl. Instrum. Methods Phys. Res. Sect. B-Beam Interact. Mater. At. 2011, 269, 2399–2403. [Google Scholar] [CrossRef]
  51. Papp, E.; Nagy, D.; Szoboszlai, Z.; Angyal, A.; Török, Z.; Csepregi, Á.; Furu, E.; Kertesz, Z. Investigation of aerosol pollution inside trams in Debrecen, Hungary. Nucl. Instrum. Methods Phys. Res. Sect. B-Beam Interact. Mater. At. 2020, 477, 138–143. [Google Scholar] [CrossRef]
  52. Furu, E.; Katona-Szabó, I.; Angyal, A.; Szoboszlai, Z.; Török, Z.; Kertész, Z. The effect of the tramway track construction on the aerosol pollution in Debrecen, Hungary. Nucl. Instrum. Methods Phys. Res. Sect. B-Beam Interact. Mater. At. 2015, 363, 124–130. [Google Scholar] [CrossRef] [Green Version]
  53. Borbelykiss, I.; Koltay, E.; Laszlo, S.; Szabo, G.; Zolnai, L. Experimental and Theoretical Calibration of a Pixe Setup for K and L X-Rays. Nucl. Instrum. Methods Phys. Res. Sect. B-Beam Interact. Mater. At. 1985, 12, 496–504. [Google Scholar] [CrossRef]
  54. Szabo, G.; Borbelykiss, I. Pixyklm Computer Package for Pixe Analyses. Nucl. Instrum. Methods Phys. Res. Sect. B-Beam Interact. Mater. At. 1993, 75, 123–126. [Google Scholar] [CrossRef]
  55. Szabó, G. PIXEKLM Program, User Guide; ATOMKI: Debrecen, Hungary, 2009. [Google Scholar]
  56. Adams, H.S.; Nieuwenhuijsen, M.J.; Colvile, R.N.; Older, M.J.; Kendall, M. Assessment of road users’ elemental carbon personal exposure levels, London, UK. Atmos. Environ. 2002, 36, 5335–5342. [Google Scholar] [CrossRef]
  57. Paatero, P.; Tapper, U. Positive matrix factorization: A non-negative factor model with optimal utilization of error estimates of data values. Environmetrics 1994, 5, 111–126. [Google Scholar] [CrossRef]
  58. Hopke, P.K. Review of receptor modeling methods for source apportionment. J. Air Waste Manag. Assoc. 2016, 66, 237–259. [Google Scholar] [CrossRef]
  59. Paatero, P. Least squares formulation of robust non-negative factor analysis. Chemom. Intell. Lab. Syst. 1997, 37, 23–35. [Google Scholar] [CrossRef]
  60. Kim, E.; Hopke, P.K.; Edgerton, E.S. Source identification of atlanta aerosol by positive matrix factorization. J. Air Waste Manag. Assoc. 2003, 53, 731–739. [Google Scholar] [CrossRef] [PubMed] [Green Version]
  61. Masiol, M.; Squizzato, S.; Formenton, G.; Khan, B.; Hopke, P.; Nenes, A.; Pandis, S.N.; Tositti, L.; Benetello, F.; Visin, F.; et al. Hybrid multiple-site mass closure and source apportionment of PM2.5 and aerosol acidity at major cities in the Po Valley. Sci. Total Environ. 2020, 704, 135–287. [Google Scholar] [CrossRef] [PubMed]
  62. Brown, S.G.; Eberly, S.; Paatero, P.; Norris, G.A. Methods for estimating uncertainty in PMF solutions: Examples with ambient air and water quality data and guidance on reporting PMF results. Sci. Total Environ. 2015, 518, 626–635. [Google Scholar] [CrossRef] [PubMed] [Green Version]
  63. WHO. WHO Global Air Quality Guidelines: Particulate Matter (PM2.5 and PM10), Ozone, Nitrogen. Dioxide, Sulfur Dioxide and Carbon Monoxide: Executive Summary; Licence: CC BY-NC-SA 3.0 IGO; World Health Organization: Geneva, Switzerland, 2021. [Google Scholar]
  64. EU. Standards-Air Quality-Environmnet-European Commission. 2008. Available online: https://ec.europa.eu/environment/air/quality/standards.htm (accessed on 24 March 2022).
  65. World Health Organization; Occupational and Environmental Health Team. WHO Air Quality Guidelines for Particulate Matter, Ozone, Nitrogen Dioxide and Sulfur Dioxide: Global Update 2005: Summary of Risk Assessment. 2006. Available online: https://apps.who.int/iris/handle/10665/69477 (accessed on 24 March 2022).
  66. Cohen, D.D.; Atanacio, A.; Crawford, J.; Siegele, R. Ion beam techniques for source fingerprinting fine particle air pollution in major Asian-Pacific cities. Nucl. Instrum. Methods Phys. Res. Sect. B Beam Interact. Mater. At. 2020, 477, 122–132. [Google Scholar] [CrossRef]
  67. Mónok, D.; Kardos, L.; Pabar, S.A.; Kotroczó, Z.; Tóth, E.; Végvári, G. Comparison of soil properties in urban and non-urban grasslands in Budapest area. Soc. Soil Sci. 2020, 37, 790–801. [Google Scholar] [CrossRef]
  68. Borbely-Kiss, I.; Kertesz, Z.; Koltay, E.; Szabo, G.; Tar, K. Composition of urban and rural aerosol samples collected in the Great Hungarian Plain. Nucl. Instrum. Methods Phys. Res. Sect. B-Beam Interact. Mater. At. 1999, 150, 339–344. [Google Scholar] [CrossRef]
  69. Kertész, Z.; Szoboszlai, Z.; Angyal, A.; Dobos, E.; Borbély-Kiss, I. Identification and characterization of fine and coarse particulate matter sources in a middle-European urban environment. Nucl. Instrum. Methods Phys. Res. B 2010, 268, 1924–1928. [Google Scholar] [CrossRef]
  70. Yu, J.T.; Yan, C.Q.; Liu, Y.; Li, X.Y.; Zhou, T.; Zheng, M. Potassium: A Tracer for Biomass Burning in Beijing? Aerosol Air Qual. Res. 2018, 18, 2447–2459. [Google Scholar] [CrossRef] [Green Version]
  71. Zhang, R.; Jing, J.; Tao, J.; Hsu, S.C.; Wang, G.; Cao, J.; Lee, C.S.L.; Zhu, L.; Chen, Z.; Zhao, Y.; et al. Chemical characterization and source apportionment of PM2.5 in Beijing: Seasonal perspective. Atmos. Chem. Phys. 2013, 13, 7053–7074. [Google Scholar] [CrossRef] [Green Version]
  72. Zhang, Y.S.; Shao, M.; Lin, Y.; Luan, S.J.; Mao, N.; Chen, W.T.; Wang, M. Emission inventory of carbonaceous pollutants from biomass burning in the Pearl River Delta Region, China. Atmos. Environ. 2013, 76, 189–199. [Google Scholar] [CrossRef]
  73. Tao, J.; Gao, J.; Zhang, L.; Zhang, R.; Che, H.; Zhang, Z.; Lin, Z.; Jing, J.; Cao, J.; Hsu, S.C. PM2.5 pollution in a megacity of southwest China: Source apportionment and implication. Atmos. Chem. Phys. 2014, 14, 8679–8699. [Google Scholar] [CrossRef] [Green Version]
  74. McNamara, S.M.; Kolesar, K.R.; Wang, S.; Kirpes, R.M.; May, N.W.; Gunsch, M.J.; Cook, R.D.; Fuentes, J.D.; Hornbrook, R.S.; Apel, E.C.; et al. Observation of Road Salt Aerosol Driving Inland Wintertime Atmospheric Chlorine Chemistry. ACS Cent. Sci. 2020, 6, 684–694. [Google Scholar] [CrossRef] [PubMed]
  75. Katheryn, K.R.; Mattson, C.N.; Peterson, P.K.; May, N.W.; Prendergast, R.K.; Pratt, K.A. Increases in wintertime PM2.5 sodium and chloride linked to snowfall and road salt application. Atmos. Environ. 2018, 177, 195–202. [Google Scholar]
  76. Kertesz, Z.; Furu, E.; Kavcic, M. Chemical speciation of chlorine in atmospheric aerosol samples by high-resolution proton induced X-ray emission spectroscopy. Spectrochim. Acta Part B-At. Spectrosc. 2013, 79–80, 58–62. [Google Scholar] [CrossRef]
  77. Gunawardana, C.; Goonetilleke, A.; Egodawatta, P.; Dawes, L.; Kokot, S. Source characterisation of road dust based on chemical and mineralogical composition. Chemosphere 2012, 87, 163–170. [Google Scholar] [CrossRef] [Green Version]
  78. Kertész, Z.; Szoboszlai, Z.; Dobos, E.; Borbélyné-Kiss, I. Characterization of urban aerosol sources in Debrecen, Hungary. AGD Landsc. Environ. 2008, 2, 109–119. [Google Scholar]
  79. Viana, M.; Kuhlbusch, T.A.J.; Querol, X.; Alastuey, A.; Harrison, R.M.; Hopke, P.K.; Winiwarter, W.; Vallius, A.; Szidat, S.; Prevot, A.S.H.; et al. Source apportionment of particulate matter in Europe: A review of methods and results. J. Aerosol Sci. 2008, 39, 827–849. [Google Scholar] [CrossRef]
  80. Wang, L.; Qi, J.H.; Shi, J.H.; Chen, X.J.; Gao, H.W. Source apportionment of particulate pollutants in the atmosphere over the Northern Yellow Sea. Atmos. Environ. 2013, 70, 425–434. [Google Scholar] [CrossRef]
  81. Hjortenkrans, D. Road Traffic Metals–Sources and Emissions. Ph.D. Thesis, Faculty of Natural Sciences and Engineering, University of Kalmar, Kalmar, Sweden, 2008. [Google Scholar]
  82. Kar, S.; Maity, J.P.; Samal, A.C.; Santra, S.C. Metallic components of traffic-induced urban aerosol, their spatial variation, and source apportionment. Environ. Monit. Assess. 2010, 168, 561–574. [Google Scholar] [CrossRef]
  83. Christoforidis, A.; Stamatis, N. Heavy metal contamination in street dust and roadside soil along the major national road in Kavala’s region, Greece. Geoderma 2009, 151, 257–263. [Google Scholar] [CrossRef]
  84. Angyal, A.; Kertesz, Z.; Szikszai, Z.; Szoboszlai, Z. Study of Cl-containing urban aerosol particles by ion beam analytical methods. Nucl. Instrum. Methods Phys. Res. Sect. B-Beam Interact. Mater. At. 2010, 268, 2211–2215. [Google Scholar] [CrossRef]
Figure 1. Location of sampling stations (A: Budapest, Gilice square, B: Debrecen, Atomki).
Atmosphere 13 00554 g001
Figure 2. Daily mass concentration of PM2.5, PM10, and PMcoarse, and the daily average temperature in Budapest and Debrecen between 8 December 2009 and 18 March 2010.
Atmosphere 13 00554 g002
Figure 3. PM2.5 and PMcoarse concentrations (in μg/m3) on various days of the week.
Atmosphere 13 00554 g003
Figure 4. Budapest/Debrecen elemental and mass concentration ratio in the coarse and fine fractions.
Atmosphere 13 00554 g004
Figure 5. Temporal variation of S and K concentration (ng/m3) in the fine (PM2.5) fraction.
Atmosphere 13 00554 g005
Figure 6. Temporal variation of mineral dust concentration (ng/m3) in Budapest (left) and in Debrecen (right) in the fine and coarse fractions.
Atmosphere 13 00554 g006
Figure 7. Temporal variation of Cl concentration (ng/m3) in the fine (PM2.5) and the coarse (PMcoarse) fraction.
Atmosphere 13 00554 g007
Figure 8. Source profiles in Budapest and in Debrecen in the fine fraction. The blue bars represent the element concentrations on a logarithmic scale, in ng/m3. The red points indicate the relative contribution of each source to the total concentration of the given element in %. The first bar shows the PM2.5 concentration and shows the contribution of each factor to total aerosol pollution.
Atmosphere 13 00554 g008
Figure 9. Source profiles in Budapest and in Debrecen in the coarse fraction. The blue bars represent the element concentrations on a logarithmic scale, in ng/m3. The red points indicate the relative contribution of each source to the total concentration of the given element in %.
Atmosphere 13 00554 g009
Figure 10. Source contributions in the fine fraction in Budapest and Debrecen.
Atmosphere 13 00554 g010
Figure 11. Source contributions in the coarse fraction in Budapest and Debrecen.
Atmosphere 13 00554 g011
Table 1. Average, standard deviation, median, minimum, and maximum of PM2.5, PMcoarse, PM10 concentration in μg/m3 and the PM2.5/PM10 ratio at the sampling locations (Budapest and Debrecen).
Budapest (µg/m3)Debrecen (µg/m3)
PM2.5PMcoarsePM10PM2.5/PM10PM2.5PMcoarsePM10PM2.5/PM10
DecemberAverage178240.67165210.73
Median176230.71124170.76
Min539 114
Max342143 561467
SD859 13315
JanuaryAverage2410340.74195240.78
Median236320.77184220.8
Min7210 819
Max435889 361347
SD101219 8310
FebruaryAverage258320.73205250.78
Median257310.78215250.81
Min228 8312
Max591868 401148
SD14316 9210
MarchAverage1510250.6116160.65
Median179250.59105170.64
Min4313 7212
Max261740 161223
SD749 333
Whole periodAverage219300.7175230.75
Median207280.74154190.78
Min228 134
Max595889 561467
SD11815 10311
Table 2. Average, median, minimum, and maximum concentrations (ng/m3) of elemental, BC, and mineral dust components of PM2.5 with standard deviation (SD) in Budapest and Debrecen.
BudapestDebrecen
AverageMedianMinMaxSDAverageMedianMinMaxSD
Al6859<DL27256174<DL10925
Si83683275646737<DL41574
S1201111252319475210619421213271658
Cl158<DL108205.61.5<DL529
K31129926758155294255261070161
Ca49351216483323316830
Ti2.32<DL823.12.6<DL122
Mn2.52<DL821.41.3<DL81
Fe94855243546458618138
Cu4.53.3<DL4252.32<DL81
Zn3733<DL92202016<DL 9015
Ba32<DL2732.81.1<DL163
Pb2017<DL6013118<DL488
BC31592972317658013761991175938964531048
PM21,20020,100242058,80011,30017,40015,200139055,8009530
min. dust513439611529339319231261515277
Table 3. Average, median, minimum, and maximum concentrations (ng/m3) of elemental and mineral dust components of PMcoarse with standard deviation (SD) in Budapest and Debrecen.
BudapestDebrecen
AverageMedianMinMaxSDAverageMedianMinMax
Al6528<DL420889471<DL604
Si34623429112129131121161665
S35724937262342521818641693
Cl17746<DL20164184517<DL470
K103811460997756217297
Ca31421339107026516411271133
Ti1081.6318107<DL63
Mn3.93.1<DL1632.61.9<DL10
Fe2742184585816916512517589
Cu53.8<DL2452.92.50.68
Zn2112320734961.2151
Ba76<DL24554<DL47
Pb64<DL681131.1<DL13
PM88806720161058,000790052504470116014,400
min. dust17051208229555012841330949577223
Table 4. Spearman’s correlation coefficients between Budapest and Debrecen elemental concentrations in the fine and coarse fractions.
PM2.5PMcoarse
rp Value rp Value
PM0.58<0.01PM0.50<0.01
BC0.30<0.01---
Si0.43<0.01Si0.62<0.01
S0.66<0.01S0.53<0.01
Cl--Cl0.50<0.01
K0.45<0.01K0.53<0.01
Ca0.46<0.01Ca0.53<0.01
Ti0.36<0.01Ti0.63<0.01
Mn--Mn0.53<0.01
Fe0.270.01Fe0.46<0.01
Cu0.270.05Cu--
Zn0.35<0.01Zn--
Pb--Pb--
Publisher’s Note: MDPI stays neutral with regard to jurisdictional claims in published maps and institutional affiliations.

