Abstract
Lightning causes significant damage and casualties globally by directly striking humans and livestock, by igniting forest fires, and by inducing electrical surges in electronic infrastructure, airplanes, rockets, etc. Monitoring the evolution of thunderstorms by tracking lightning events using lightning locating systems can help prepare for and mitigate these disasters. In this work, we propose to use Benford’s law to assess the quality of the data provided by lightning locating systems. The Jensen–Shannon and Wasserstein distances between the recorded data distribution and Benford’s distribution are used as metrics for measuring the performance of the lightning locating systems. The data are provided by the European lightning detection network (EUCLID) for the years from 2000 to 2020. The two decades consist of three time windows between which the lightning locating system underwent several upgrades to improve the detection of both positive and negative strokes. The analysis shows that the agreement with Benford’s law is consistent with the expected behavior caused by the applied upgrades to the system throughout the years. The study suggests that the proposed approach can be used to test the success of software and hardware upgrades and to monitor the performance of lightning locating systems.
1. Introduction
Lightning is an atmospheric phenomenon that transfers significant amounts of electrical charge, up to many hundreds of Coulombs, from thunderclouds to the ground over a short period of time, typically less than a second. Lightning releases energies of several gigajoules, much of it resulting in a broad spectrum of electromagnetic radiation from DC to radio frequencies, visible light, microwave radiation, and X-rays. It also generates heat due to the movement of charges in the atmosphere, causing rapid changes in temperature and pressure, that can be heard as thunder. These properties of lightning can cause human and livestock casualties, infrastructure damage, and electromagnetic interference [1,2]. It can start fires, especially in forests; it can interfere, damage, and destroy electrical devices, which can cause fatal system failures in airplanes and rockets as well as power network disruption [3,4,5,6].
The localization of lightning discharges is critical in a wide range of applications. Meteorological agencies, airports and space launch facilities, land management entities, forest services, and power transmission and distribution companies are typical users of lightning information. Lightning and thunderstorm forecasting and warning, locating infrastructure damage, lightning and geophysics research, risk assessment, and resolving insurance claims are just a few examples in which the information provided by lightning locating systems (LLS), such as the location of the lightning strike and its intensity, are extensively used [7]. Ground-based or satellite-based LLSs use a single or a network of electromagnetic sensors to detect and locate lightning discharges. In ground-based LLSs, the central processor is triggered if the signal generated by a lightning discharge is detected by multiple sensors. These signals are processed and combined together using various methods including time of arrival and magnetic direction finding to estimate the precise location of the lightning event.
In this work, we propose using Benford’s law as a means of assessing the quality of the data provided by LLSs. Benford’s law states that in many classes of measurable natural quantities, human activity related datasets, and combinations thereof, the frequency of occurrence of the leading digit of the measured values follows a logarithmic probability distribution, with the digit one appearing about 30% of the time and increasing digits appearing with monotonically decreasing probability down to the digit nine, which is observed as the leading digit only 5% of the time [8,9]. This observation has found applications for instance in fraud detection in accounting, tax returns, elections, and even scientific reports [10,11,12]. Manoochehrnia et al. [13] used Benford’s law to verify the detection efficiency of LLSs by analyzing lightning data over Switzerland from 1999 to 2007. In their paper, it was shown that Benford’s law works for both positive and negative lightning data [13]. In this paper, we use Benford’s law to quantify the quality of the data acquired by LLSs. To do this, we use the data provided by the European lightning detection network (EUCLID) over a region in Austria in three different time windows between which the LLS has undergone several upgrades to improve the localization accuracy, detection efficiency, and categorization capability. We will show that performance improvements due to these successive upgrades are positively correlated with the level of conformity of the lightning data to Benford’s law.
2. Materials and Methods
LLS provides essential data for each detected stroke, including location, peak current estimate, polarity, and type. In this paper, we focus on the evolution of detection efficiency as a result of upgrades. In this section, we briefly introduce Benford’s law and describe its application to the data obtained by the LLS.
2.1. Benford’s Law
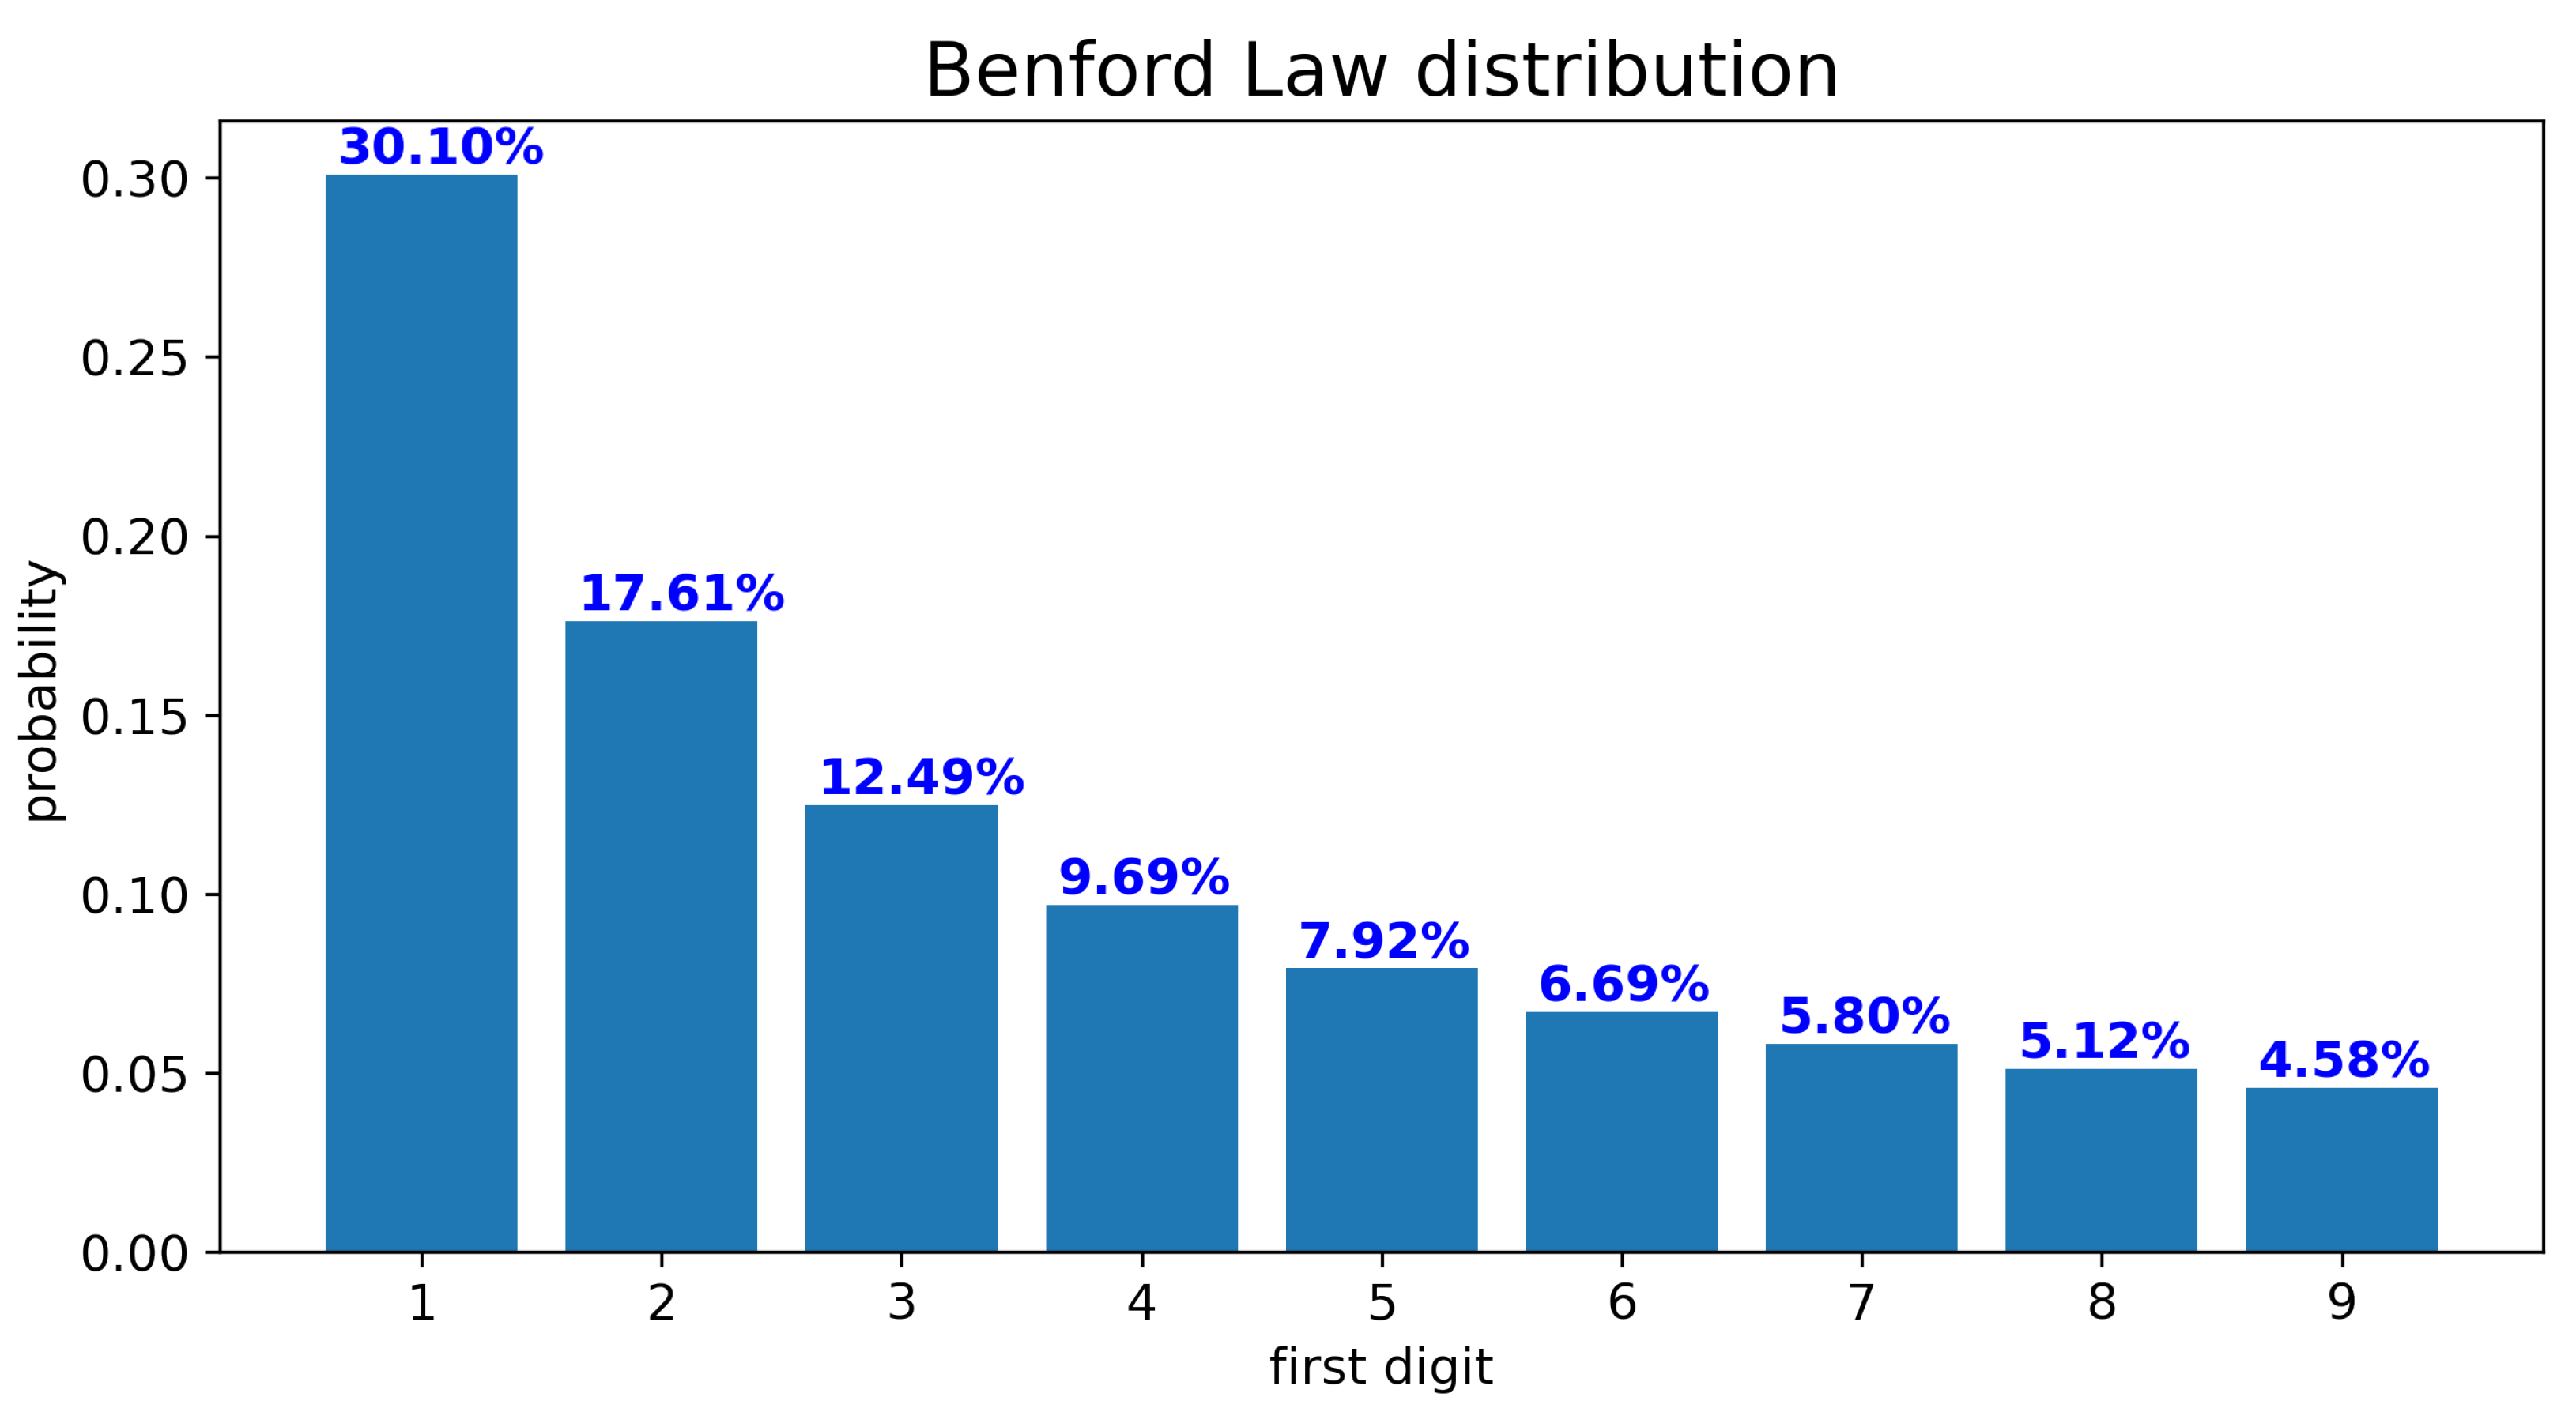
Benford’s Law or Newcomb-Benford’s Law was first discovered by astronomer Simon Newcomb in 1881 [8]. He realized that the first pages of paperback logarithm tables, which were popular at the time, were more worn down than the last pages. Noticing that the early pages correspond to numbers starting with the digit one, he concluded that numbers in nature tend to start with digit one more frequently compared to other digits. He proposed that the probability of observing digit “N” at the beginning of a number is equal to for naturally occurring data [8,9]. In 1938, Frank Benford examined the phenomenon on 20 different data sets, published their hypothesis, and was credited for this discovery [14].
A set of numbers satisfies Benford’s law if the probability of the first (most significant) digit equal to d obeys the following equation:
Benford’s law for numbers in any integer base B for can be obtained by changing the base of the logarithm in Equation (1) from 10 to B. The distribution described by Equation (1) is shown in Figure 1. It can be seen that digit one occurs about 30% of the time, while the probability of digit nine is less than 5% as opposed to a naive belief that all digits are equiprobable with a probability of 11%.
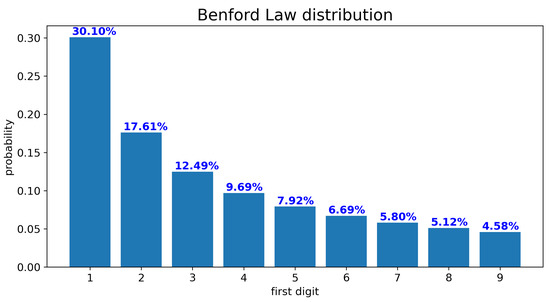
Figure 1.
First digit’s probability distribution in a set satisfying Benford’s law.
From probability theory, we know that for a uniform continuous variable between , the probability of selecting a number in the interval is equal to the ratio of the lengths of the intervals, namely . By the same argument, if we choose a number uniformly between in a logarithmic scale, the probability of this number lying in the interval in logarithmic scale which has d as the leading digit is as follows:
which corresponds to Benford’s law. Therefore, if the data spans several decades with approximately uniform distribution on a logarithmic scale, it will satisfy Benford’s law [15].
Benford’s law has been extensively applied in various fields, such as accounting, fraud detection, and data-integrity analysis (see, e.g., [10,11,12]). Manoochehrnia et al. [13] applied for the first time Benford’s law to LLS data. Their analysis suggested that Benford’s law may find an interesting application in the evaluation of the detection efficiency of LLS. In what follows, we will apply Benford’s law to the data provided by EUCLID.
2.2. Data
In this section, we will examine the data provided by the EUCLID lightning locating system in three different, non-overlapping time windows, between which the system underwent several upgrades. Our goal is to use the changes in the level of compliance of the data with Benford’s law after each one of the upgrades to investigate if Benford’s law is a reasonable tool for the assessment of the performance of LLSs.
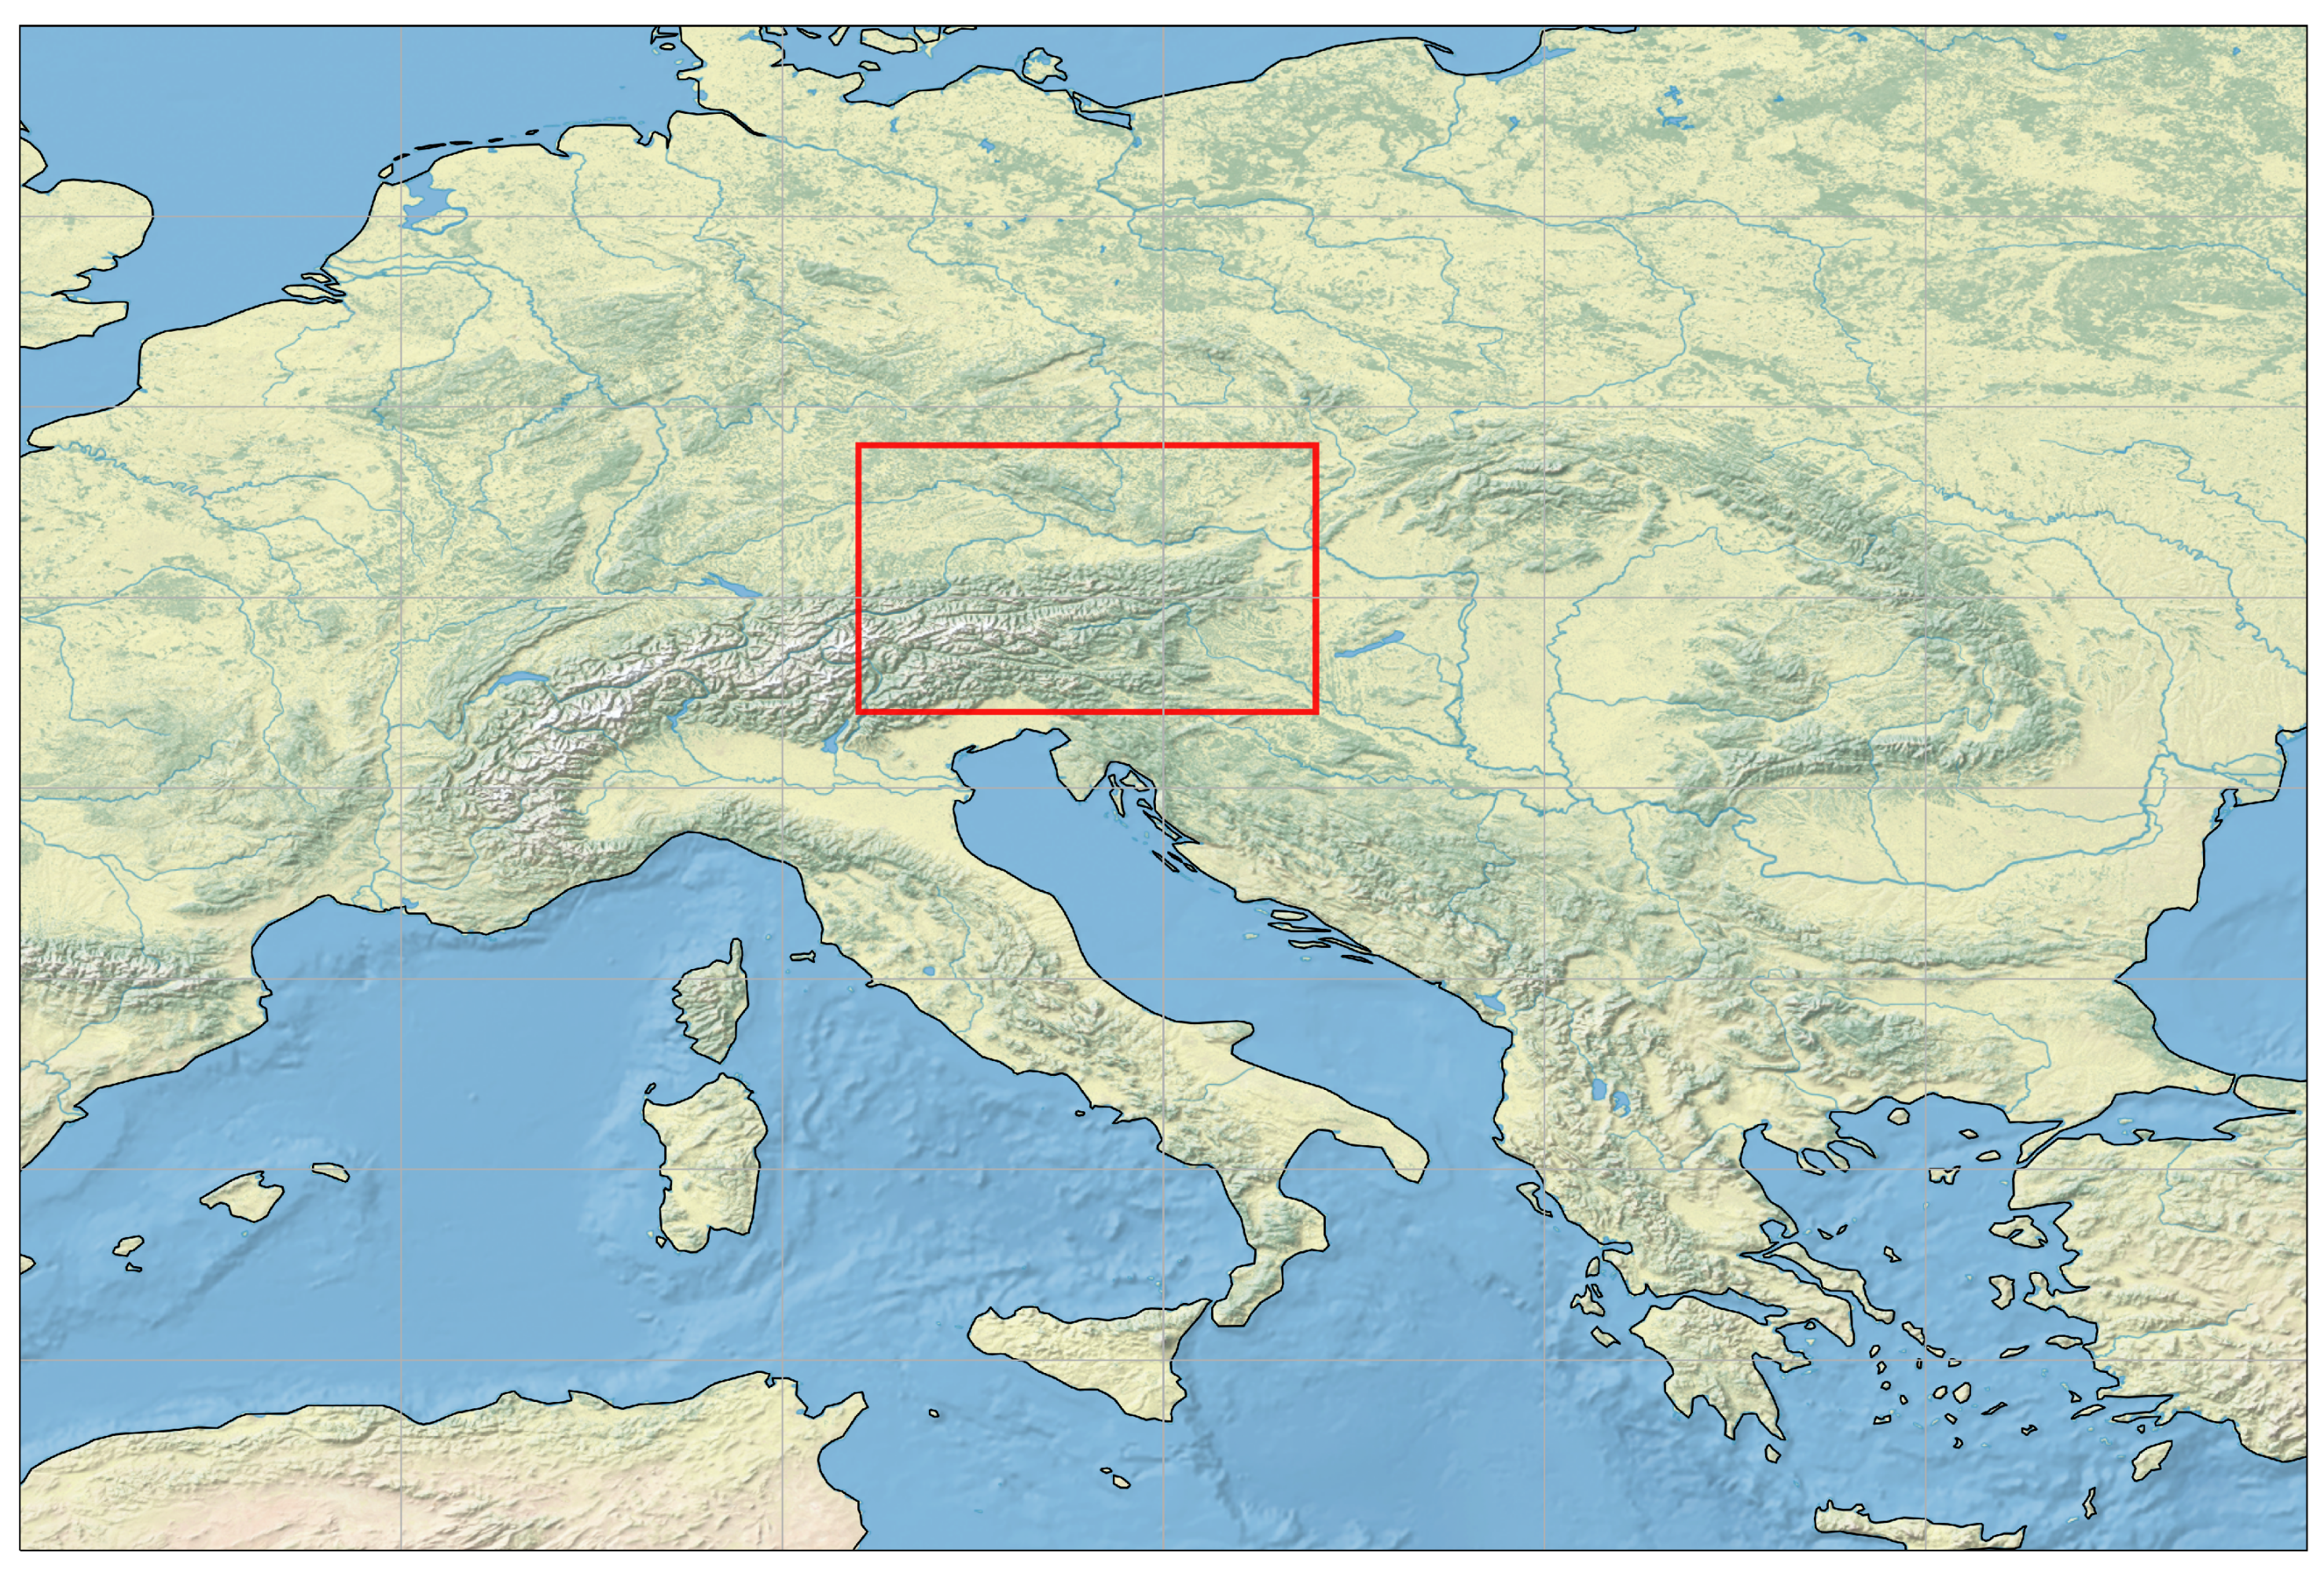
The data are provided by EUCLID. The dataset consists of lightning flashes and strokes in the region with latitudes between and and longitudes between and (see Figure 2) in Austria, for three time periods: 2000–2004, 2010–2014, and 2016–2020. The dataset includes the time of occurrence of each flash and stroke with a precision of nanoseconds, their geographical coordinates, the amplitude and sign of the inferred lightning current, and whether it was detected as a cloud or a cloud-to-ground event. The data do not include whether the event was an upward or a downward flash.

Figure 2.
Lightning Dataset Region in Central Europe.
The statistics of the data are shown in Table 1. The first row shows the average global count of cloud-to-ground and cloud flashes that can be compared to our dataset [16]. Between the first and the second time windows, the lightning detection system underwent several upgrades, especially in the detection algorithm of cloud lightning discharges [17]. The significant increase in the number of lightning events in the second time period (2010–2014) can be explained by the increase in the detection efficiency of the system as a result of the applied upgrades. From the second to the third period, along with an improvement in the detection efficiency, the cloud/ground classification algorithm was improved, which resulted in better compliance with the expected global average values. The polarities of the detected flashes in the three periods are consistent with global average values [16].

Table 1.
Number of Events for the considered dataset.
2.3. Data Preprocessing
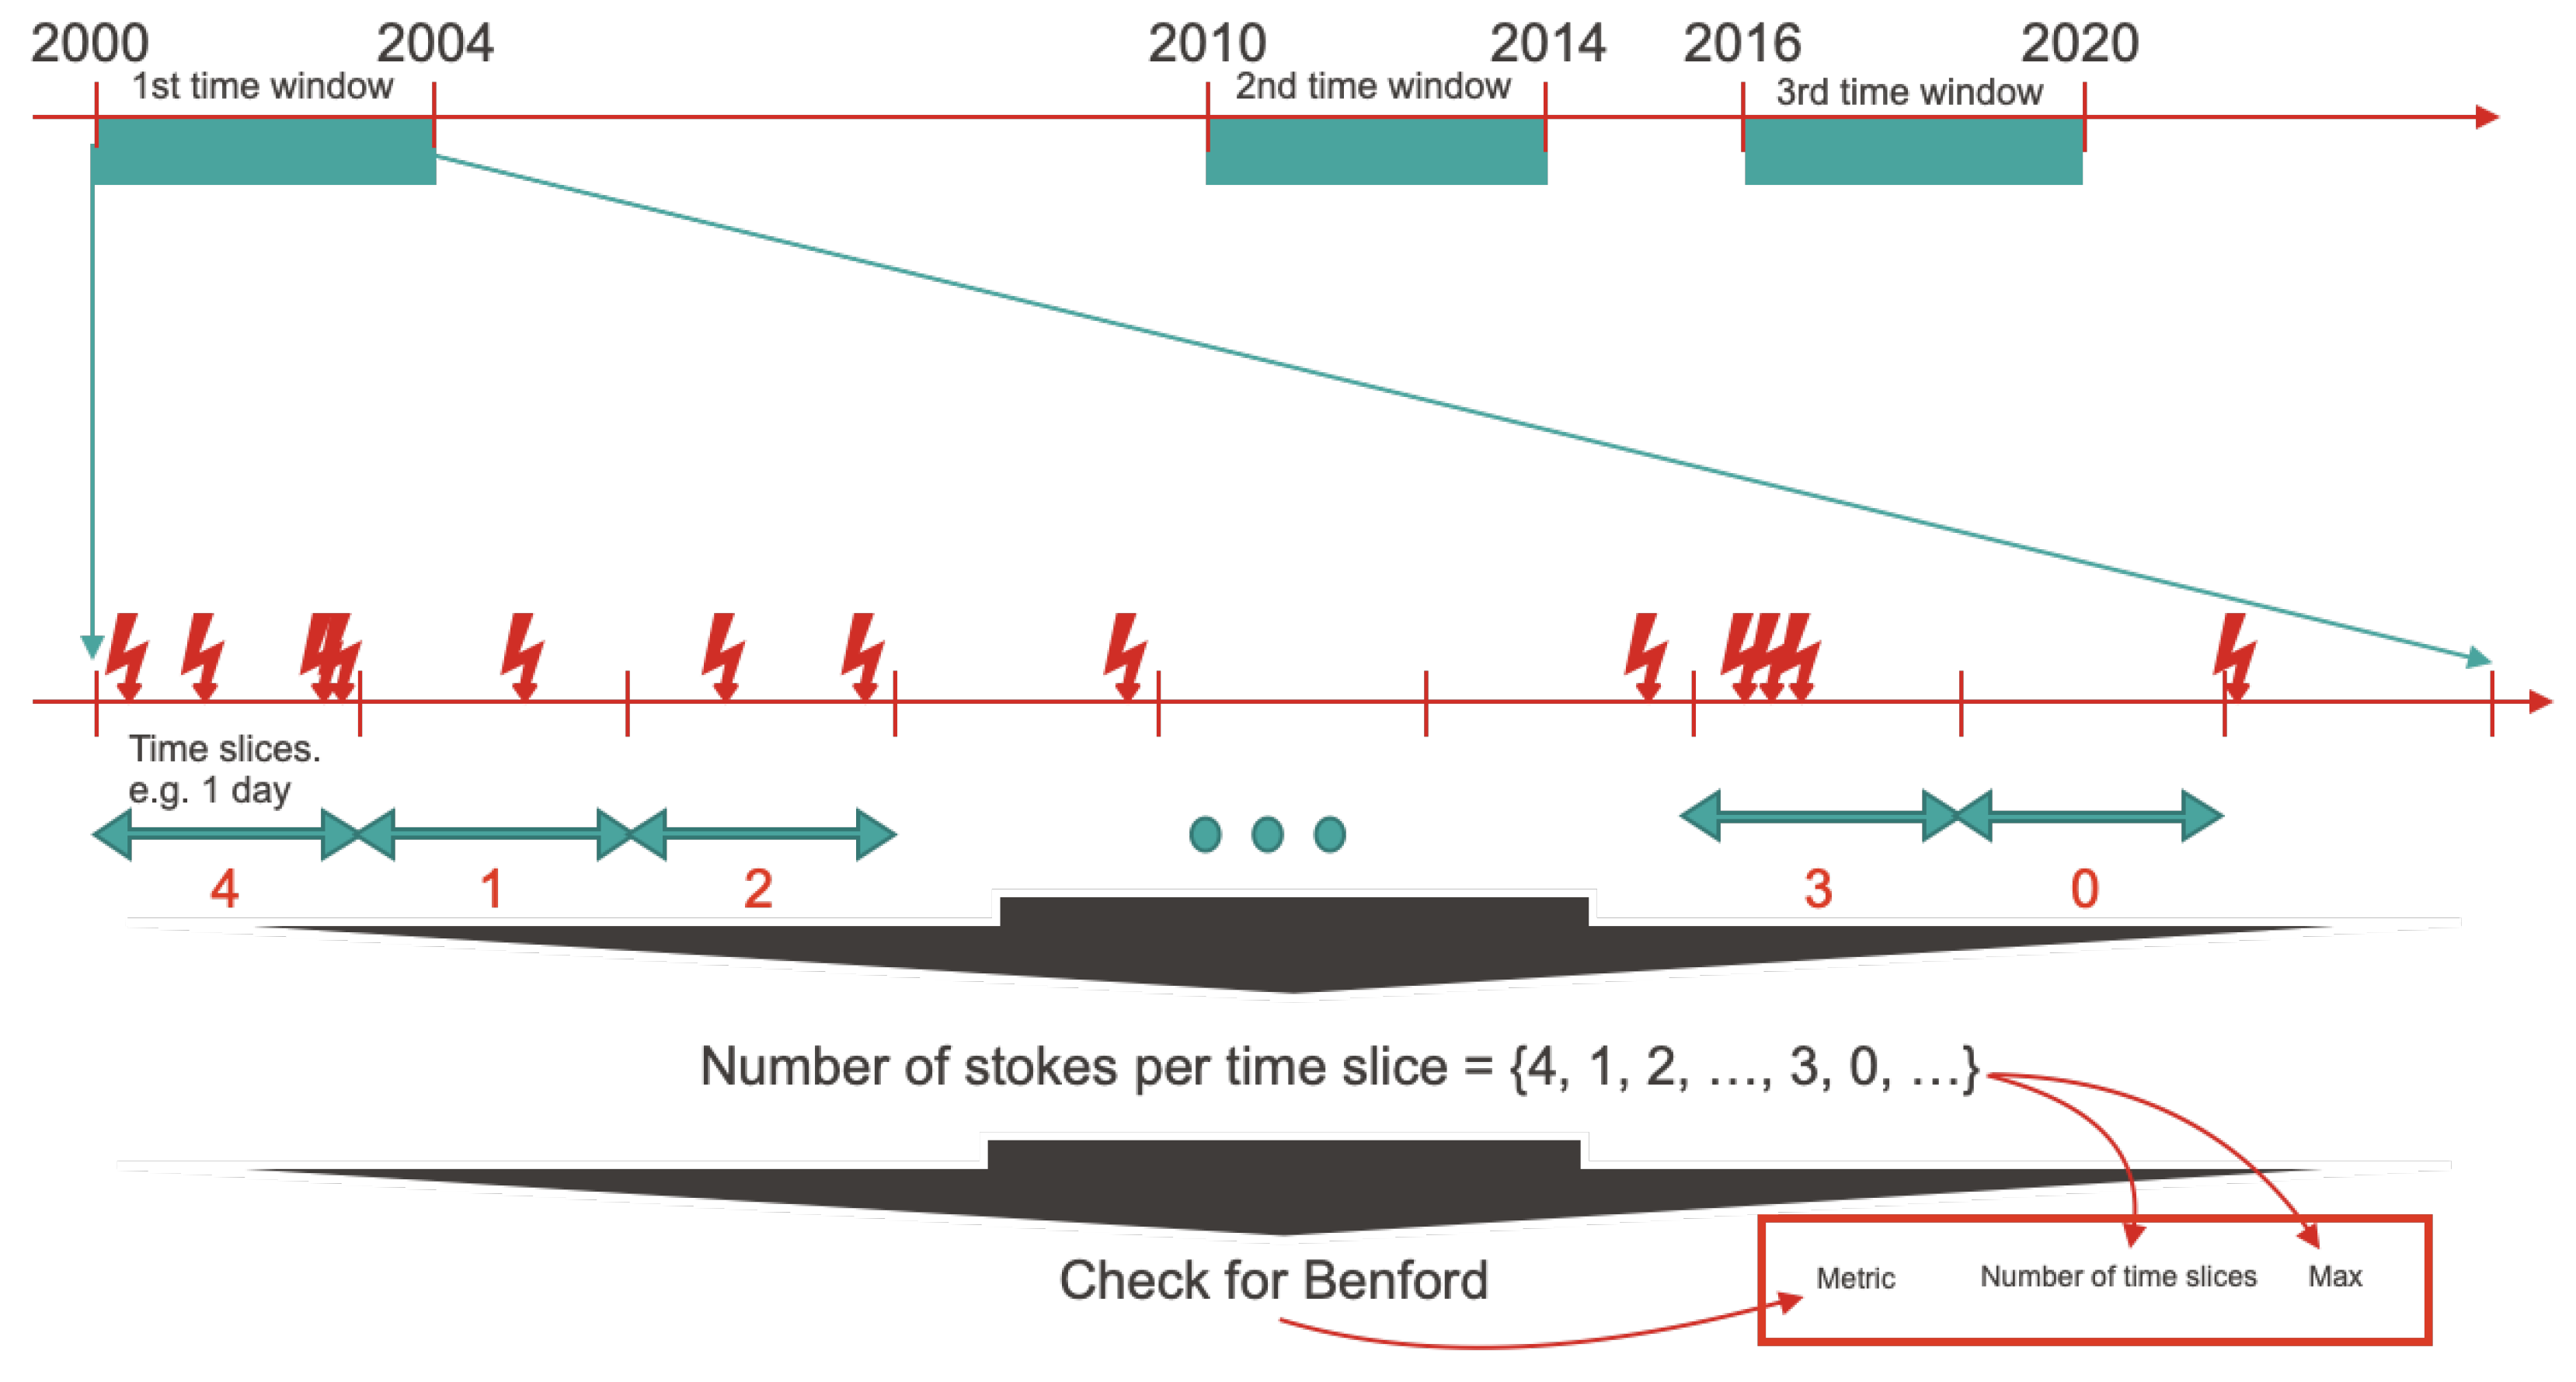
We will apply Benford’s law to the number of cloud-to-ground strokes detected within predefined time slices as explained in what follows. With reference to Figure 3, each one of the three time windows, e.g., 2000–2004, is divided into time slices and the number of cloud-to-ground strokes detected by the LLS within that slice constitutes a data point. The number of data points is, therefore, equal to the number of slices into which the time window is divided. The totality of the points constitutes the dataset on which Benford’s law will be tested. The data processing was carried out using the Pandas Python library as follows: A dataframe was created and sorted by the time stamp of the lightning event. A time slice size was then selected (for instance, one day, one hour, etc.), and the number of lightning events in each time slice was counted. The number of lightning events in a given time slice is a data point as explained earlier. A discussion on the selection of the optimum time slice will be given in Section 2.6. The number of time slices having a number of strokes that start with the digits one to nine was then counted and the relative frequency of appearance was compared against Benford’s law. A metric was used to quantify the compliance with the ideal Benford distribution for the first digit. The metric is described in the next subsection.
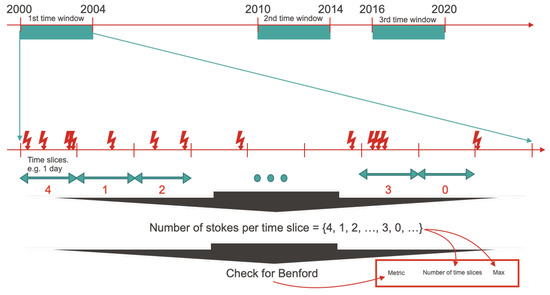
Figure 3.
Data preprocessing: Each time window is divided into time slices and the number of strokes detected by the LLS within each slice constitutes a data point.
2.4. Metric
In this work, we used the following two metrics to quantify the similarity of the dataset created in the previous section with the ideal Benford distribution: (i) the Jensen–Shannon distance, and (ii) the Wasserstein distance. Both of them satisfy the required properties of a proper distance: is a distance if, for any x, y, and z, the following hold:
- if and only if
For two probability distributions P and Q over probability space X, the Jensen–Shannon distance is defined as:
where and is the Kullback–Leibler divergence.
The first Wasserstein distance is defined as:
where is the set of distributions whose marginals are equal to P and Q. Furthermore, , and are the cumulative distribution functions (CDF) of P and Q, respectively.
2.5. Code
The codes were developed in Python. As mentioned earlier and illustrated in Figure 3, Pandas was used to handle each dataset and to partition events into time slices. It was also used for grouping and aggregation over partitions. Numpy, Scipy, and Matplotlib were used to find the first digit of each entry, to calculate the metrics, and to visualize the results.
2.6. Selection of the Size of the Time Slice
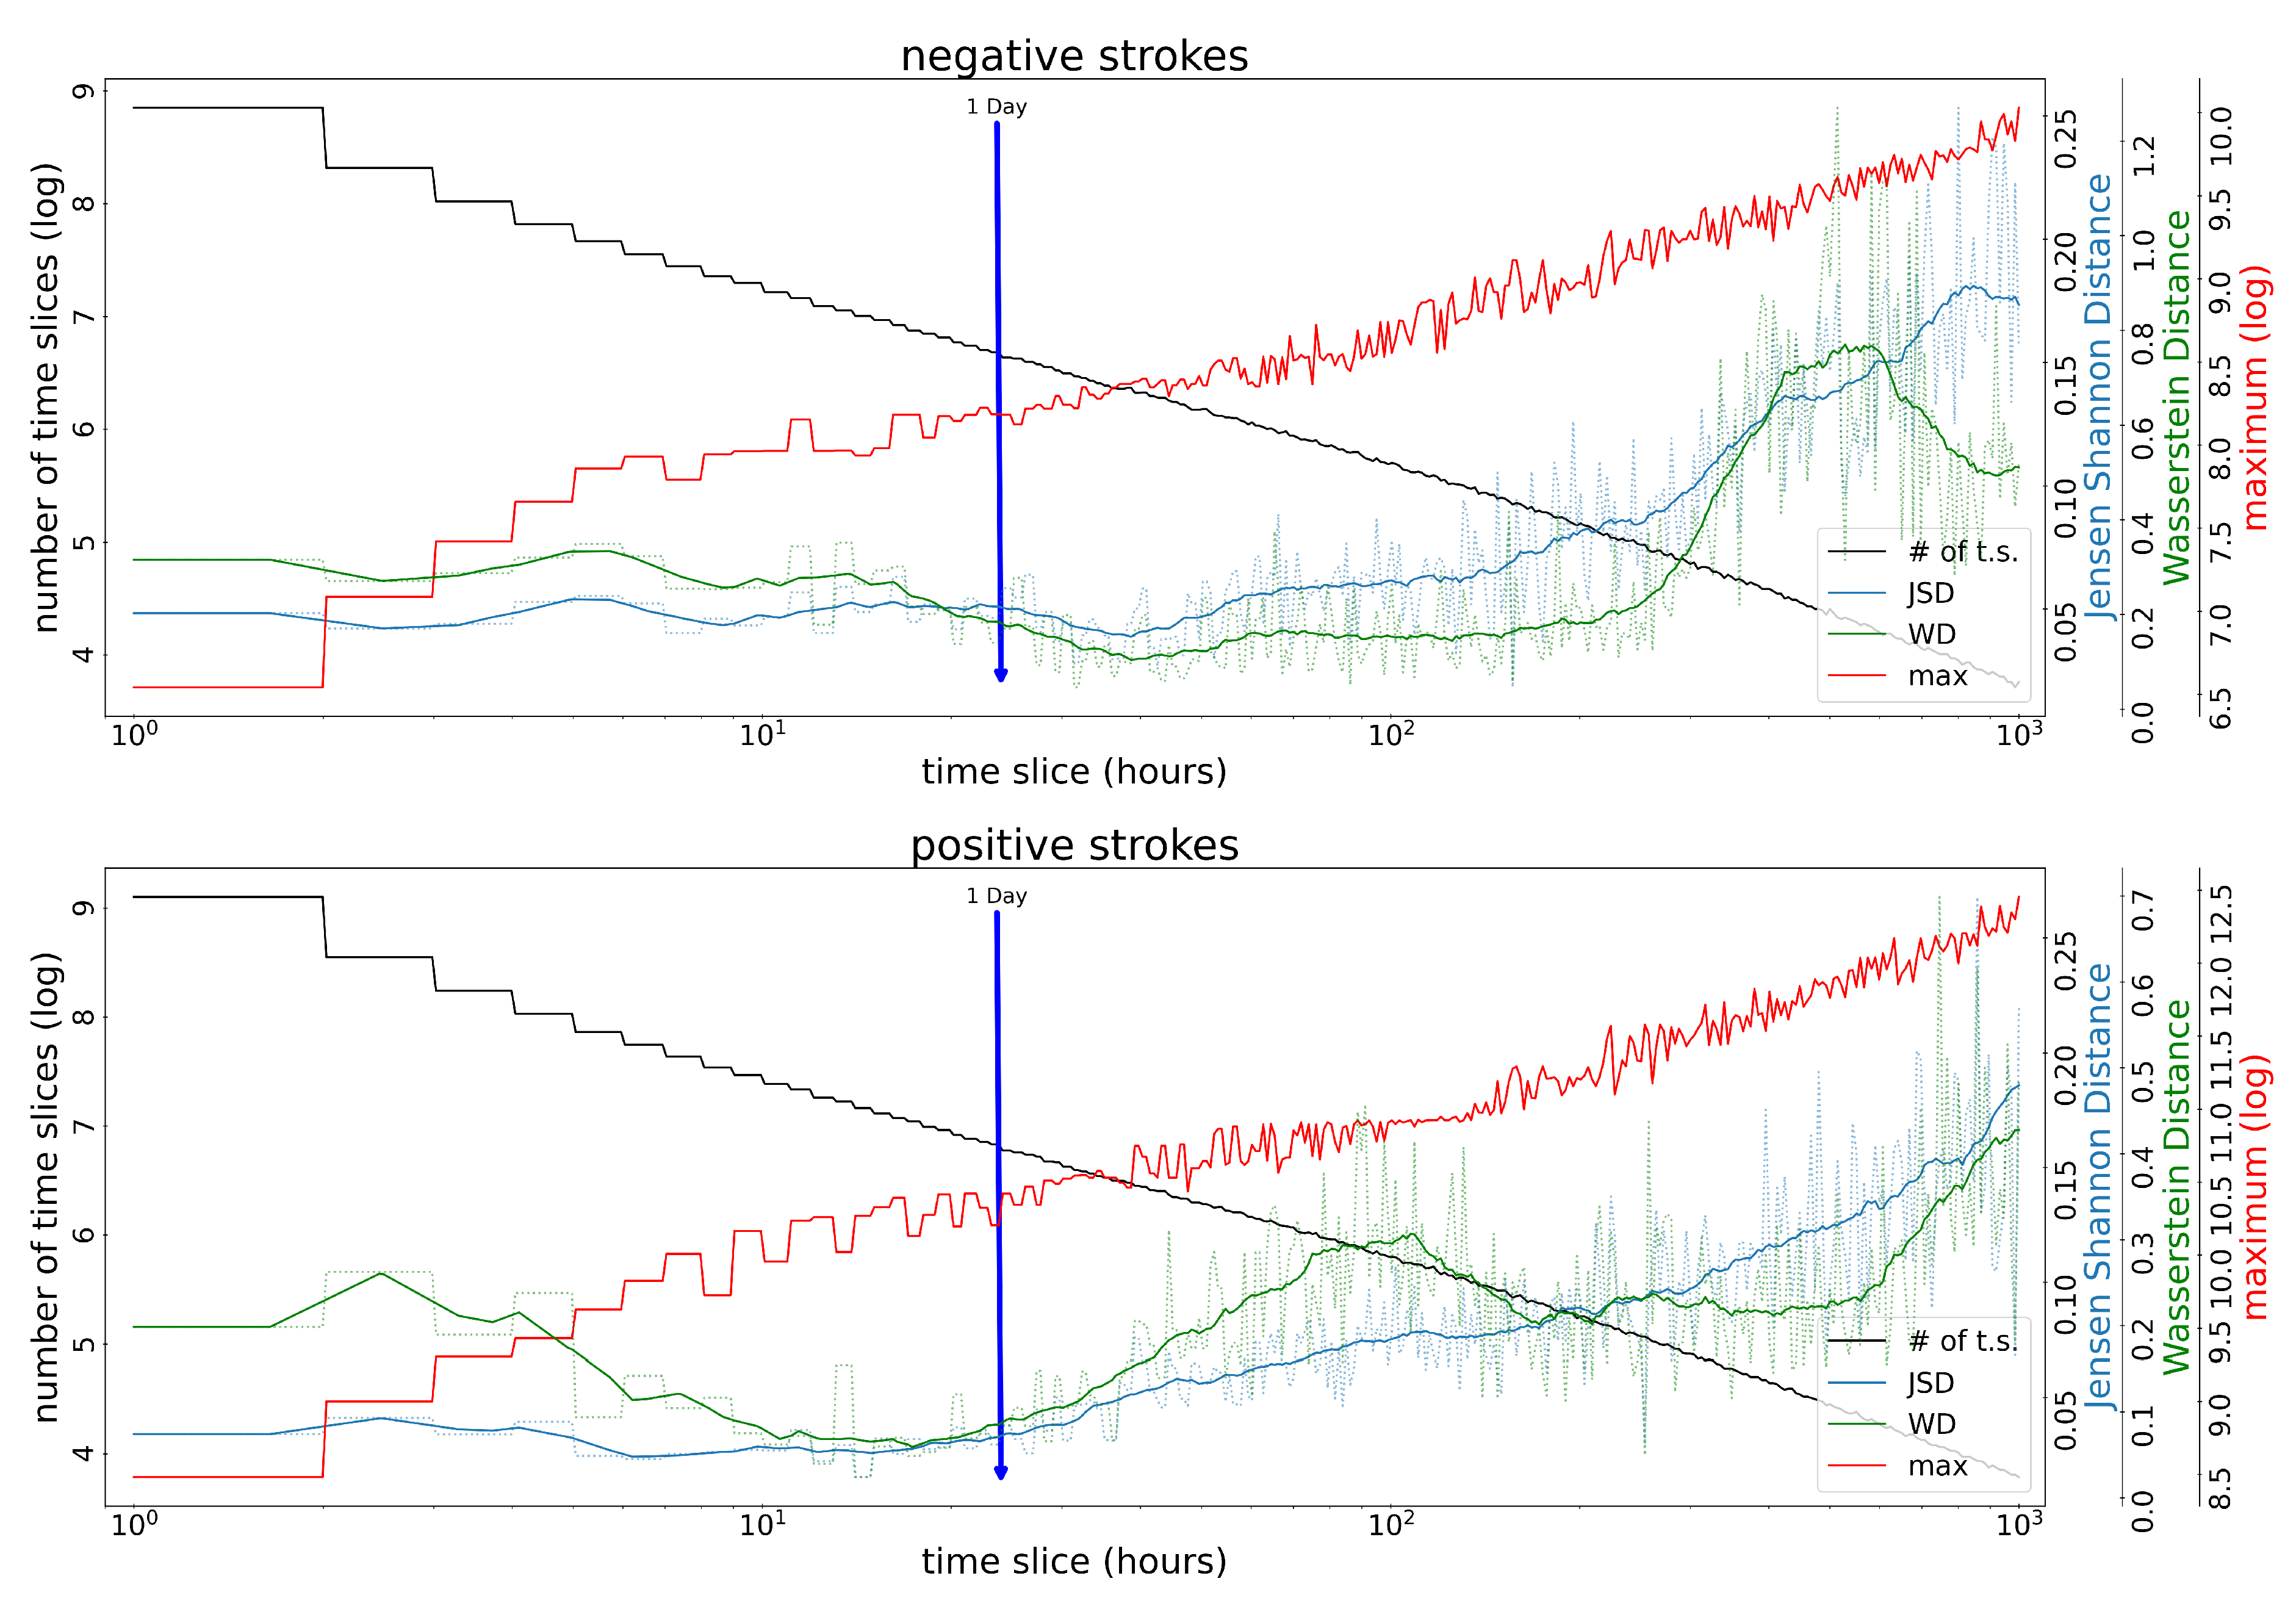
The proximity of the dataset distribution to Benford distribution depends on the choice of the length of the time slice. We selected the time slice that minimizes the distance between the two distributions. To find the best time slice under this criterion, we examined the variation of the metrics as a function of the time slice size. The Wasserstein distance and the Jensen–Shannon distance for both positive and negative strokes in the third considered time window (2016–2020) are shown in Figure 4. In this figure, the black line shows the total number of time slices as the time slice size is changed, the red line is the maximum number of lightning events per time slice, and the blue and green lines are the Jensen–Shannon and the Wasserstein distances. The data for negative strokes are presented in the upper panel, and those for positive strokes in the lower panel. As it can be seen in the figure, the minima of the Jensen–Sh and Wasserstein distances occur approximately for the slice size of around 24 h (1 day) for both positive and negative polarity events. It is important to understand that there are two opposing factors that result in the appearance of a minimum in the Jensen–Shannon and Wasserstein distances. Since lightning is a rare event, the number of lightning events per time slice cannot reach high values when the time slice size is small. This represents a problem since a large span of values is a requirement of Benford’s law’s applicability. For this reason, the conformity with Benford’s law is low for small time slice sizes and hence the metric shows large distances between the two distributions. On the other hand, as the time slice size increases, the number of time slices becomes smaller, leading to a lower number of data points. As a consequence, a smooth and well-behaved distribution cannot be obtained leading, again, to large values of the metrics due to the large distance between the lightning detection system dataset and Benford distribution. The optimum value that leads to a large enough span in each time slice and a large enough number of slices corresponds to a time slice size of approximately one day. Although the minima are close but not exactly at slice size equal to 24 h, we selected one day, since it coincides with an easily identifiable partition without appreciable penalty in the accuracy of the results.

Figure 4.
The choice of the size of the time slice. In these figures, which correspond to negative (upper panel) and positive (lower panel) strokes in the 2016–2020 time window, the horizontal axis is the size of the time slices in hours. In the vertical axis, the black line shows the number of time slices, the red line shows the maximum value of the dataset, and the solid blue and green curves represent the smoothed Jensen–Shannon distance (JSD) and Wasserstein distance (WD), respectively, where as dotted lines show actual value.
3. Results and Discussion
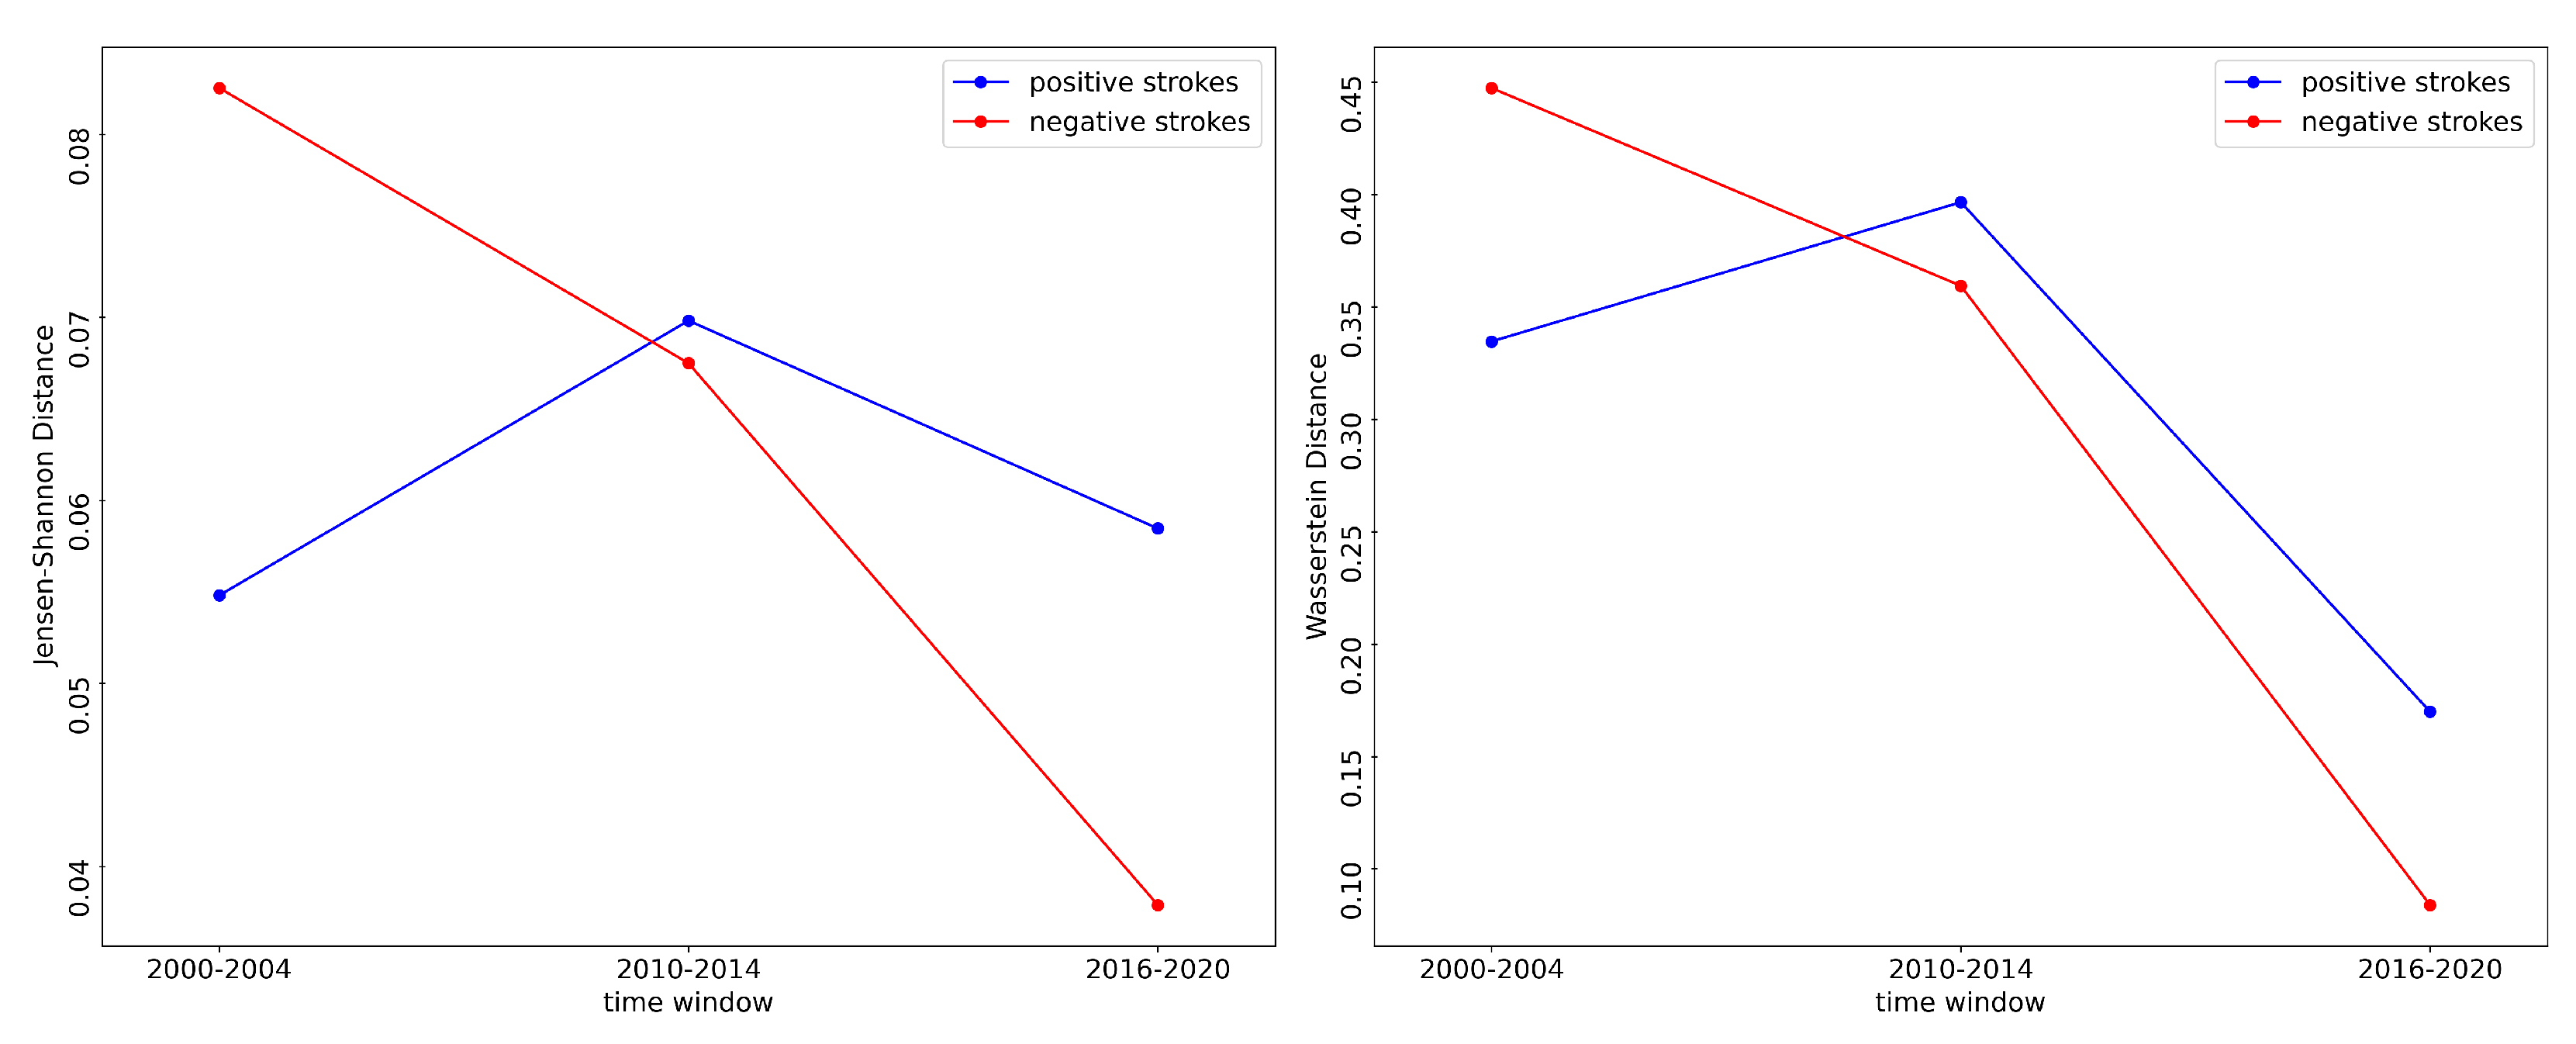
We selected one day as the time slice size and we compared the performance of the detection system over time for both positive and negative strokes. Figure 5 shows a comparison of the probability distribution of the leading digit for real data with the ideal Benford distribution. Figure 6 shows the performance of the detection system by comparing the distance to Benford distribution as a function of the time window. Both the Jensen–Shannon and the Wasserstein metrics indicate that the first digit distribution of negative strokes becomes closer to Benford distribution as time advances. This result is expected under the assumption of this work since the detection efficiency for negative cloud-to-ground lightning was improved over time by the upgrades made both to the software and to the hardware of the EUCLID network [17]. In Figure 6, however, it can be seen that this is not the case for positive strokes. Figure 6 shows that the performance worsens from the first to the second time window and it then improves again in the third time window. In Table 1, it can be seen that the total number of detected events increased over time, which can be explained by one or by a combination of the following factors: (1) improvement of the detection efficiency of the system, (2) normal variations of the lightning incidence, (3) an increase in the number of lightning events due to climate change [18], or (4) changes in the misclassification rate. However, the right-hand side of Table 1 indicates that the number of detected positive and negative cloud-to-ground strokes decreased. If the lower number of positive and negative strokes comes as a result of a lower detection efficiency of the system, one might expect an increase in the values of the metrics (worse agreement). Surprisingly, we see an improvement from the second to the third time window. This improvement is actually due to an important upgrade between the second and the third time windows in which the lightning classification algorithm was significantly improved, reducing the problem of misclassification of positive cloud-to-ground flashes being incorrectly identified as cloud flashes [17].
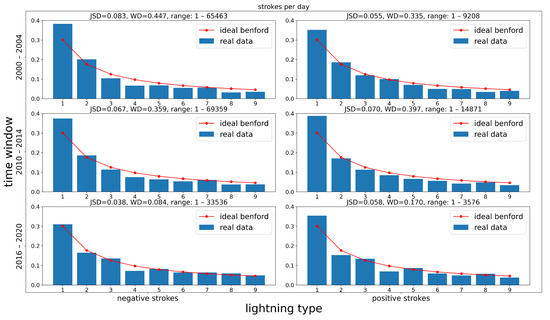
Figure 5.
First digit distribution of data versus Benford. These figure show the frequency of the most significant digit of lightning data in blue compared to the expected probability distribution dictated by Benford’s law in red. The left column depicts the negative strokes data and the right one represents the positive ones. Furthermore, rows represent the three time windows, from top to bottom: 2000–2004, 2010–2014, 2016–2020. Jensen–Shannon distance (JSD), Wasserstein distance (WD), and range of data is provided on the top of each figure.
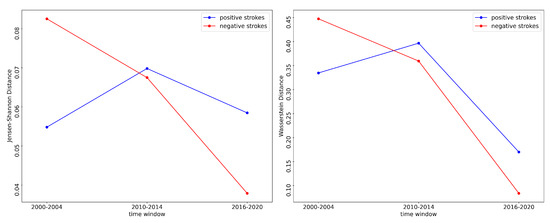
Figure 6.
Agreement with Benford’s law for the number of positive and negative strokes per day (lower is better). (Left panel) Jensen–Shannon distance; (right panel) Wasserstein distance.
In fact, in the two later periods, the detection efficiency was better than in 2000–2004 due to the upgrades made. For this reason, the agreement with Benford’s law was less good than in the subsequent periods. The detection efficiency of the system was improved in 2010. However, an appreciable number of cloud flashes was still misclassified as positive cloud-to-ground flashes, resulting in the observed disagreement with Benford’s law. After upgrading the classification algorithm in 2016, both the detection and classification efficiency were improved, which was reflected in the significant improvement of the metrics. It is worth mentioning that the negative cloud-to-ground lightning flashes are not affected by the misclassification problem.
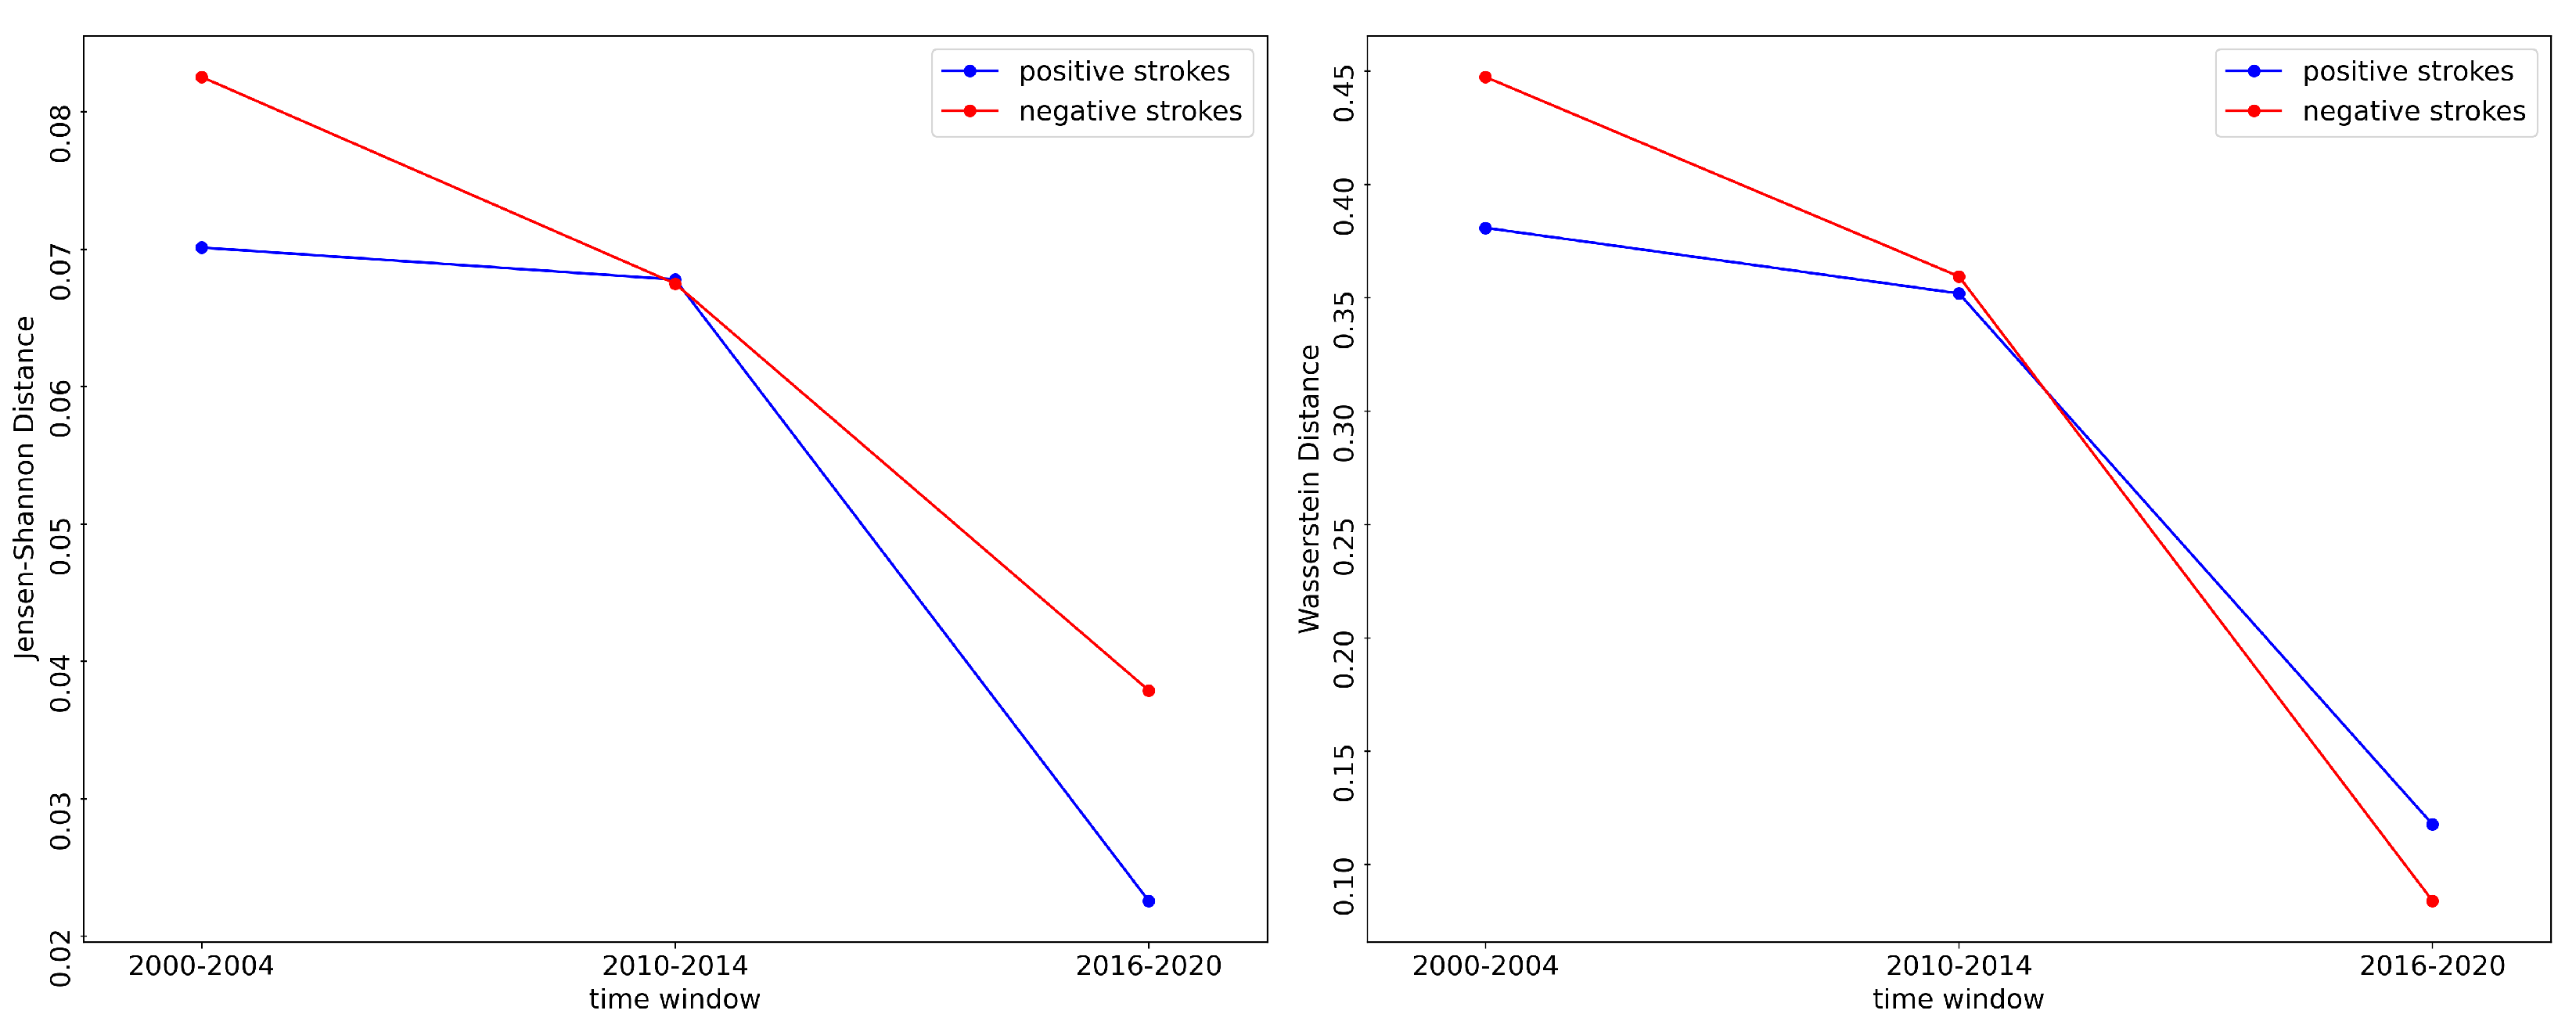
Lightning locating systems detect lightning flashes through their emitted electromagnetic radiation and the classification is done based on the shape of the received waveform. The characteristics of the electromagnetic field waveshapes associated with cloud discharges are somewhat similar to those of small positive cloud-to-ground lightning. Improving the detection efficiency results in higher detection of small-amplitude cloud lightning events. Some of these small-amplitude events are counted as positive cloud-to-ground lightning due to the classification error. Therefore, if only the strokes with amplitudes higher than an appropriate threshold current are considered, the misclassification issue should be mitigated and a relative improvement over time in compliance with Benford’s law would be expected. This is shown in Figure 7 using 10 kA as a threshold.
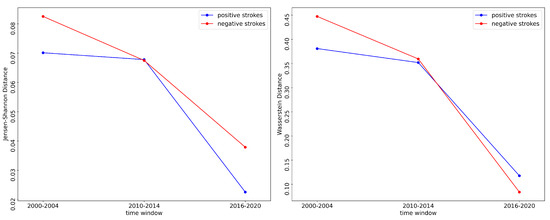
Figure 7.
Compliance with Benford’s law for number of positive and negative strokes with current amplitude over 10 kA per day (lower is better). (Left panel) Jensen–Shannon distance; (right panel) Wasserstein distance.
4. Conclusions
Lightning’s deleterious effects can be mitigated by monitoring the evolution of thunderstorms by tracking lightning events using lightning locating systems. In this work, we used Benford’s law to assess the quality of the data provided by lightning locating systems. The Jensen–Shannon and Wasserstein distances between the recorded data distribution and Benford’s distribution were used as metrics for measuring the performance of the lightning locating systems. The used data for the analysis were provided by the European lightning detection network (EUCLID) and they were recorded during three time windows from 2000 to 2020 between which the lightning locating system underwent several upgrades to improve the detection of both positive and negative strokes. The analysis showed that the agreement with Benford’s law is consistent with the expected results of the upgrades applied to the system over time. The study suggests that the proposed approach can be used to monitor the performance of lightning locating systems and to assess the relative success of upgrades and changes to their software and hardware. Furthermore, lightning locating systems can provide historical data that can be used to develop data-driven lightning forecasting and nowcasting systems. The proposed approach using Benford’s law can also be used to assess the quality of the available data in a given region to be used for such purposes.
Author Contributions
Conceptualization, F.R. and M.R.; methodology, E.M.; software, E.M.; validation, A.M.; formal analysis, E.M. and A.M.; investigation, E.M.; resources, F.R. and M.R.; data curation, W.S. and G.D.; writing—original draft preparation, E.M.; writing—review and editing, A.M., W.S., G.D., M.R. and F.R.; visualization, E.M. and A.M.; supervision, F.R. and M.R.; project administration, F.R. and M.R.; funding acquisition, F.R. and M.R. All authors have read and agreed to the published version of the manuscript.
Funding
This research was funded by Swiss National Science Foundation, Grant 200020_204235.
Institutional Review Board Statement
Not applicable.
Informed Consent Statement
Not applicable.
Data Availability Statement
LLS data of this study are available from ALDIS (aldis@ove.at) upon reasonable request.
Conflicts of Interest
The authors declare no conflict of interest.
Abbreviations
The following abbreviations are used in this manuscript:
| LLS | Lightning Locating System |
| EUCLID | European Cooperation for Lightning Detection |
References
- Cooper, M.A.; Holle, R.L. (Eds.) Current Global Estimates of Lightning Fatalities and Injuries. In Reducing Lightning Injuries Worldwide; Springer Natural Hazards, Springer International Publishing: Cham, Switzerland, 2019; pp. 65–73. [Google Scholar] [CrossRef]
- Cerveny, R.S.; Bessemoulin, P.; Burt, C.C.; Cooper, M.A.; Cunjie, Z.; Dewan, A.; Finch, J.; Holle, R.L.; Kalkstein, L.; Kruger, A.; et al. WMO Assessment of Weather and Climate Mortality Extremes: Lightning, Tropical Cyclones, Tornadoes, and Hail. Weather Clim. Soc. 2017, 9, 487–497. [Google Scholar] [CrossRef]
- Watson, A.I.; Holle, R.L.; López, R.E.; Ortiz, R.; Nicholson, J.R. Surface Wind Convergence as a Short-Term Predictor of Cloud-to-Ground Lightning at Kennedy Space Center. Weather Forecast. 1991, 6, 49–64. [Google Scholar] [CrossRef]
- Watson, A.I.; López, R.E.; Holle, R.L.; Daugherty, J.R. The Relationship of Lightning to Surface Convergence at Kennedy Space Center: A Preliminary Study. Weather Forecast. 1987, 2, 140–157. [Google Scholar] [CrossRef] [Green Version]
- Yokoyama, S.; Honjo, N.; Yasuda, Y.; Member, K. Causes of wind turbine blade damages due to lightning and future research target to get better protection measures. In Proceedings of the 2014 International Conference on Lightning Protection (ICLP), Shanghai, China, 11–18 October 2014; pp. 823–830. [Google Scholar] [CrossRef]
- Curran, E.; Holle, R.; López, R. Lightning Casualties and Damages in the United States from 1959 to 1994. J. Clim. 2000, 13, 3448–3464. [Google Scholar] [CrossRef]
- Nag, A.; Murphy, M.J.; Schulz, W.; Cummins, K.L. Lightning locating systems: Insights on characteristics and validation techniques. Earth Space Sci. 2015, 2, 65–93. [Google Scholar] [CrossRef]
- Newcomb, S. Note on the Frequency of Use of the Different Digits in Natural Numbers. Am. J. Math. 1881, 4, 39–40. [Google Scholar] [CrossRef] [Green Version]
- Formann, A.K. The Newcomb-Benford Law in Its Relation to Some Common Distributions. PLoS ONE 2010, 5, 1–13. [Google Scholar] [CrossRef] [PubMed]
- Sambridge, M.; Tkalčić, H.; Jackson, A. Benford’s law in the natural sciences. Geophys. Res. Lett. 2010, 37, L22301. [Google Scholar] [CrossRef]
- Judge, G.; Schechter, L. Detecting Problems in Survey Data Using Benford’s Law. J. Hum. Resour. 2009, 44, 1–24. [Google Scholar] [CrossRef]
- Deckert, J.; Myagkov, M.; Ordeshook, P.C. Benford’s Law and the Detection of Election Fraud. Political Anal. 2011, 19, 245–268. [Google Scholar] [CrossRef]
- Manoochehrnia, P.; Rachidi, F.; Rubinstein, M.; Schulz, W.; Diendorfer, G. Benford’s law and lightning data. In Proceedings of the 2010 30th International Conference on Lightning Protection (ICLP), Cagliari, Italy, 13–17 September 2010; pp. 1–3. [Google Scholar] [CrossRef]
- Benford, F. The Law of Anomalous Numbers. Proc. Am. Philos. Soc. 1938, 78, 551–572. [Google Scholar]
- Fewster, R.M. A Simple Explanation of Benford’s Law. Am. Stat. 2009, 63, 26–32. [Google Scholar] [CrossRef] [Green Version]
- Rakov, V.A.; Uman, M.A. Lightning: Physics and Effects; Cambridge University Press: Cambridge, UK, 2003. [Google Scholar]
- Schulz, W.; Diendorfer, G.; Pedeboy, S.; Poelman, D.R. The European lightning location system EUCLID—Part 1: Performance analysis and validation. Nat. Hazards Earth Syst. Sci. 2016, 16, 595–605. [Google Scholar] [CrossRef] [Green Version]
- Romps, D.M.; Seeley, J.T.; Vollaro, D.; Molinari, J. Projected increase in lightning strikes in the United States due to global warming. Science 2014, 346, 851–854. [Google Scholar] [CrossRef] [PubMed]

Publisher’s Note: MDPI stays neutral with regard to jurisdictional claims in published maps and institutional affiliations. |
© 2022 by the authors. Licensee MDPI, Basel, Switzerland. This article is an open access article distributed under the terms and conditions of the Creative Commons Attribution (CC BY) license (https://creativecommons.org/licenses/by/4.0/).