Error in Figure Legend
In the original article [1], there was a mistake in the legends for Figures 8 and 9. The correct legend appears below.
Figure 8. Drought vulnerability index for the 2030s, 2050s, 2070s, and 2090s under RCP4.5 scenarios. Counties with white hachure show lack of data.
Figure 9. Drought vulnerability index for the 2030s, 2050s, 2070s, and 2090s under RCP8.5 scenarios. Counties with white hachure show lack of data.
Error in Figure
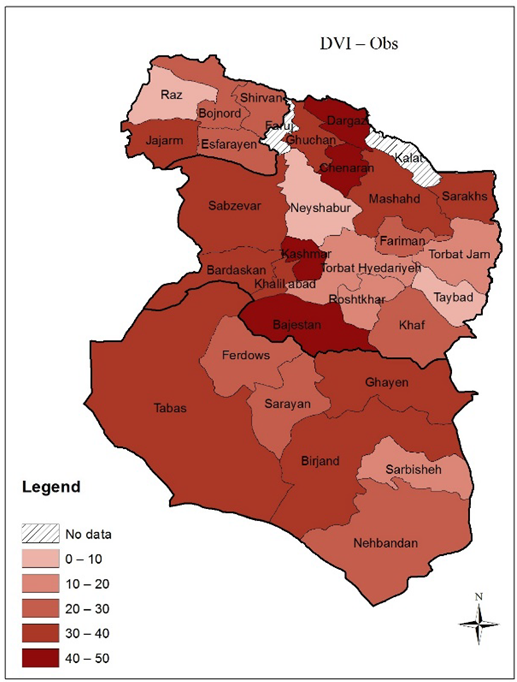
In the original article, there was a mistake in Figure 5 (lower-right panel) as published. The corrected Figure appears below.
The authors apologize for any inconvenience caused and state that the scientific conclusions are unaffected. The original article has been updated.
Reference
- Babaeian, I.; Rahmatinia, A.E.; Entezari, A.; Baaghideh, M.; Aval, M.B.; Habibi, M. Future Projection of Drought Vulnerability over Northeast Provinces of Iran during 2021–2100. Atmosphere 2021, 12, 1704. [Google Scholar] [CrossRef]
Publisher’s Note: MDPI stays neutral with regard to jurisdictional claims in published maps and institutional affiliations. |
© 2022 by the authors. Licensee MDPI, Basel, Switzerland. This article is an open access article distributed under the terms and conditions of the Creative Commons Attribution (CC BY) license (https://creativecommons.org/licenses/by/4.0/).