Abstract
One of the greatest environmental health problems to arise in recent years is air pollution. Inorganic and organic particles are important components of air aerosol. The potential of air microbiota as an indicator of air quality is gaining increasing research interest. The aim of the present study was to determine the relationship between the level of fungal contamination and the levels of bacteria and smog particles in outdoor air in recreational areas during the heating season. A quantitative and qualitative mycological evaluation and quantitative bacteriological evaluation of air quality in 10 selected parks were performed. The numbers of microorganisms in the air were correlated with smog levels. The mean prevalence of fungi was 18.96 ± 15.43–23.30 ± 26.70 CFU/m3 of air and the mean bacterial count was 74.06 ± 130.89–268.04 ± 126.10 CFU/m3. Among the isolated fungi, clinically significant species were identified: four species belonged to Risk Group 2, and 17 to Risk Group 1. The predominant genera were Aspergillus, Penicillium and Alternaria. The total number of bacteria demonstrated a positive correlation with the size of the park, air temperature and ozone level during sampling, and a negative correlation with humidity, pressure and smog parameters (CO, NO, NO2 and NOx). The qualitative and quantitative composition of bioaerosols can be used as a bioindicator for environmental monitoring. There is a need for more efficient monitoring of airborne pollutants and microorganisms to learn about the structure of the air biota, the mechanisms regulating their occurrence, and to identify potential threats to human health.
1. Introduction
One of the greatest environmental health problems to arise in recent years is air pollution. The World Health Organization reports a clear relationship between human exposure to outdoor air pollution and the incidence of civilization diseases such as cardiovascular diseases, chronic obstructive pulmonary disease and cancer, as well as lower respiratory tract infections. It is estimated that air pollution contributes to 2.9–8.9 million deaths annually [1,2,3,4].
Although all inorganic contaminants may pose a threat to human health, the most dangerous are believed to be PM2.5 and O3 [1,2,5]. In 2018, 49% of European citizens were exposed to PM10 concentrations above those specified in WHO Air Quality Guidelines and 76% to PM2.5 [6]. The effect of PM pollution on life expectancy has been widely studied, and previous studies have confirmed a statistically significant correlation between exposure to PM and decreased life expectancy [6,7].
One significant source of air pollution is the use of household fuels (coal, wood, charcoal, agricultural wastes, animal dung, or kerosene) for cooking or heating. This is especially true for households where the furnace is installed incorrectly or poorly sealed. Household exposure to air pollution is one of the major risk factors for disease, with the poorest communities in low- and middle-income countries (LMICs) most severely affected [8]. The highest levels of air pollution were noted in densely-populated areas [4,9] and mortality risk factors related to outdoor air mostly concerning low and medium economic level countries. A World Health Organization report found that over 90% of the human population lives in areas where the level of air pollution exceeds acceptable standards [1]. In addition, in 2015, ambient air pollution accounted for 7.6% of total global mortality [3].
In recent years, the bioaerosol of atmospheric air has also begun to arouse the interest of researchers [10,11,12,13]. It is estimated that organic particles can constitute as much as 25% of the air aerosol [14]. The atmospheric bioaerosol consists mainly of spores, pollen, viruses, bacteria, fungi and their microbial metabolites (endotoxins or mycotoxins), as well as animal allergens such as epidermal cells and hair. The qualitative and quantitative composition of bioaerosols changes significantly over time; it can be used as a bioindicator for environmental monitoring [15].
Although microorganisms are an important component of bioaerosol, the air environment is not suitable for their growth [16] and hence they only remain in the air temporarily. The microbial bioaerosol occurs in the air as aggregates of cells or individual cells, which adhere to dust particles, water vapor droplets, mucus, epidermis or animal hair [17]. Together with air currents, microorganisms can be transported over long distances and are also exposed to direct UV radiation, rapid temperature changes and dehydration. Air microorganisms are believed to have a strong influence on biodeterioration processes and climate change [13]. Microorganisms occurring in the environment may accelerate global warming because, as a result of their metabolic activity, organic matter decomposes and carbon dioxide and methane are released into the atmosphere. Microorganisms are also responsible for increasing greenhouse gas concentrations, whereas phytoplankton emissions of sulfur dioxide promote cloud condensation [18,19]. They were been found to have a direct impact on human health. Inhalation with microbial cells may promote the occurrence of infectious diseases, especially in the respiratory system, and result in a higher risk of allergic diseases and asthma, and indirectly metabolic, neurodegenerative and oncological diseases [12,15].
The potential of air microbiota as an indicator of air quality is gaining increasing research interest [20,21]. As such tests based on the number and taxonomic structure of microorganisms were successfully used in indoor air, they should also be used for assessing outdoor air quality [20,21]. The most frequently used microbiological indicators in the air are the total number of microorganisms and the number of mesophilic and psychrophilic bacteria. In addition, the virus-to-bacteria ratio was also used as an indicator of air microbiological quality [10]. However, recent studies have underlined the importance of using the total number of fungi [20,22]. Studies by other authors indicate the existence of a relationship between the presence of microorganisms in the outside air and the degree of pollution [23,24,25]. However, the research so far was conducted in remote climatic regions, with different weather conditions and different anthropogenic activity, as well as in other ecosystems [25]. It is still important to obtain more and more information from various environments in order to better understand the relationships within the air microbiota and between airborne microorganisms and physical and chemical pollutants of natural and anthropogenic origin.
Air bioaerosol consists of viable and non-viable microorganisms and metabolites produced by microorganisms. The methods for the quantitative and qualitative assessment of air microbiota are divided into culture-based and culture-independent. The culture-based methods do not reflect the full composition of the air microbiota but provide information on the physiological properties of microorganisms, especially related to the ability to maintain viability under strong UV radiation and low humidity (air conditions) and the ability to form a biofilm on the surface of solid particles floating in the air [26]. On the other hand, culture-independent methods, which are based on DNA or RNA sequencing of microorganisms, allow for a more detailed analysis of taxonomic diversity within bioaerosols [26,27]. There are still no standardized procedures in molecular methods [28], while the proposed guidelines for the quantitative and qualitative microbiological assessment of air focus on cultured microorganisms. Still, many analyses of the indoor and outdoor air microbiota are based solely on cultured methods [23,24,29].
Therefore, the aim of the present study was to determine the relationship between the level of cultured fungal contamination and the levels of bacteria and smog particles in outdoor air in recreational areas within one day during the heating season in Lodz, Poland, in the context of human health. Our goal was also to try to show that culturable fungi can be used as indicators of biological air pollution at a specific point in time.
2. Materials and Methods
2.1. Study Sites
The study was conducted within the administrative boundaries of the city of Lodz. Lodz is a city located in the center of Poland (geographical coordinates: 51°46′36″ N 19°27′17″ E) and covers an area of 293.25 km2. The number of inhabitants of the city in December 2019 was 682,679. Lodz is considered one of the most polluted cities in Poland.
The studies were conducted in two parts: a pilot study and follow-up studies.
A pilot study was carried out in November and December 2016 and included three selected parks: Pilsudski Park, Zrodliska Park and May 3rd Park.
Follow-up studies were performed between December 2017 and March 2018 and included 8 parks (Poniatowski Park, Zrodliska Park, Sienkiewicz Park, Pilsudski Park, May 3rd Park, Baden-Powell Park, Zaruski Park, Widzewska Gorka Park) and two street localizations (Gdanska 16 and Czerniak 1/3 Street), which were the city control for recreational areas. The analyzed parks were selected due to their diversified size and location within the city, as well as the existence of recreational and sports facilities in their area. The parks selected for the research differed in size, especially Piłsudski Park, which is crossed in two directions by busy streets connecting the city center with the so-called sleeping districts. During our research, we wanted to take up the topic of developing a guide for the application of air microbiological purity analysis in the context of human health using a given environment for recreation. Our goal was to develop a codified system of air quality assessment in recreation places, therefore it was decided that, regardless of the size of the park, only 3 representative locations would be analyzed. The designated sites were selected due to their use by residents as places for recreation and sports. Areas where few people usually are present were omitted and the focus was on places where there are usually large numbers of inhabitants.
There were 3 sampling points in each park: one near the main entrance, one near the large playground for children, and one in the middle of the park. Data on the area and characteristics of the examined parks are presented in Table 1.

Table 1.
Characteristics of selected parks.
2.2. Mycological Assessment of Air
A mycological evaluation of air quality was performed using the Koch Sedimentation Method/open plate method [22,30]. The total number of fungi in 1 m3 of air was assessed. Samples were taken on Czapek-Dox medium (bioMérieux) between 3 p.m. and 4 p.m. (rush hours) in similar weather conditions: rainless and windless days. Three replicates were taken at each sampling point. Samples were taken once to demonstrate the possibility of using fungi as indicators of biological contamination at a specific point in time. The exposure of the plates lasted 30 min. The fungi were cultured for 48 h at 37 °C, then incubated for 168 h (7 days) at 20 °C. Colonies were counted every 48 h. The obtained number of colonies in each location in the parks studied was calculated according to the Omelianski formula:
where —average number of colonies on the plate, —plate area, —plate exposure time, and the concentration of microorganisms in the air was presented as CFU/m3 air.
The obtained filamentous fungi isolates were passaged on the following media: Sabouraud’s agar (bioMérieux) and Potato dextrose agar (bioMérieux) in order to assess morphological variability and obtain characteristic sporulation. Microscopic preparations were made in lactophenol with the addition of aniline blue according to the imprint technique according to Gerlach [31]. Fungi were identified on the basis of macroscopic characteristics (e.g., color and structure of the colony surface, dye secreted into the medium, dye gutting on the surface) and microscopic (e.g., size and branching of hyphae, spore-bearing structures, sexual and asexual sporulation, size and shape of spores). The isolated fungi were identified using the following keys: Krzyściak et al. [32], de Hoog et al. [33], Watanabe [34], Raper et al. [35], Pitt et al. [36], Fassatiova [37] and St-Germain and Summerbell [38]. Molecular analysis was not carried out because we focused on culturable fungi and the applicability of classical methods. Current species names were assigned on the basis of the Index Fungorum Website [39]. Clinically-relevant species were classified into risk groups (RGs) and biosafety levels (BSLs) according to the online version of the Atlas of Clinical Fungi [33].
2.3. Bacteriological Assessment of Air
A quantitative bacteriological evaluation of air quality was performed using the Koch Sedimentation Method/open plate method [22,30]. The total number of bacteria in 1 m3 of air was assessed using nutrient agar (bioMérieux). Samples were collected in the same way as in mycological studies. Bacterial cultures were carried out for 48 h at 37 °C and another 24 h at the temperature of 20 °C. Colonies were counted every 24 h. The obtained number of colonies in each location in the parks studied was calculated according to the Omelianski formula:
where —average number of colonies on the plate, —plate area, —plate exposure time, and the concentration of microorganisms in the air was presented as CFU/m3 air.
In the European Union, no relevant legislation exists that specifies the permissible content of microorganisms in outdoor air. Therefore, as a result of adjusting Polish law to EU law, Polish standards [30,40,41,42] concerning air pollution were withdrawn in August 2015. However, as they were not replaced with new ones [43], the present study used the withdrawn standards to interpret the microbiological air quality results.
2.4. Evaluation of Physico–Chemical Air Contamination
Weather conditions were obtained from Weather Underground database [44]. The findings were compared with levels of physico–chemical air contamination. Pollutants concentration levels were obtained from the Voivodeship Inspectorate for Environmental Protection in Lodz [45].
All levels of smog parameters were available during the follow-up studies. The air quality was assessed in accordance with the international standard (EU Ambient Air Quality Directives and World Health Organization (WHO) air quality guidelines (AQGs) [6]. The level of air pollution was presented in Table 2.
Table 2.
Weather conditions and airborne smog parameters in the selected localizations in the city of Lodz, during pilot and follow-up studies sampling. Data obtained from the following databases: Weather Underground database and Voivodeship Inspectorate for Environmental Protection in Lodz database [44,45].
In 2016, the level of benzene and PM10 exceeded the limit value specified in the EU Ambient Air Quality Directives and World Health Organization Air Quality Standards. In addition, in 2017–2018 the level of PM10 and PM2.5 exceeded the limits specified in the EU Ambient Air Quality Directives and World Health Organization Air Quality Standards (Table 2).
2.5. Statistical Analysis
The obtained data were statistically analyzed using the Kruskal–Wallis test, with p-values < 0.05 being regarded as significant. The numbers of microorganisms in the air were correlated with smog level using the Spearman correlation coefficient, again with a significance level of p = 0.05. Statistical analysis was performed with the use of the STATISTICA 13.1 software (StatSoft® Polska, Józefa Ignacego Kraszewskiego 36, 30-110 Kraków, Poland).
3. Results
3.1. Pilot Study
The mean prevalence of fungi was 23.30 ± 26.70 CFU/m3 of air (Table 3). Fungi were confirmed in Pilsudski Park (52.42 CFU/m3) and May 3rd Park (17.47 CFU/m3). No fungi were found in Zrodliska Park. The CFU values of fungi did not exceed the permissible values in accordance with the standard [42].
Table 3.
Number of microorganisms found in the air in the pilot study.
The mean bacterial count was 268.04 ± 126.10 CFU/m3. More specifically, total counts were 122.77 CFU/m3 in Pilsudski Park, 332.01 CFU/m3 in Zrodliska Park and 349.33 CFU/m3 in May 3rd Park (Table 3). None of these CFU values exceeded the permissible values in accordance with the standard [41].
The isolated fungi belonged to 11 species, with Alternaria alternata and Aspergillus fumigatus dominating. All the isolated species of fungi belonged to filamentous fungi, no yeast was found (Table 4). Among the isolated fungi, four species belonged to RG 2, and six to RG 1.
Table 4.
Species of fungi isolated from the air in the pilot study.
3.2. Follow-Up Studies
The mean fungal count in parks was 14.96 ± 15.97 CFU/m3. The highest count was noted in Widzewska Gorka Park (41.94 CFU/m3), and the lowest in Poniatowski Park (2.61 CFU/m3). No fungi were found in Baden-Powell Park (Table 5). We isolated the larger numbers of fungi from the air in parks with a smaller area but situated in quieter parts of the city (with little traffic nearby). None of the values exceeded the permissible values [42]. On the street locations, the total number of fungi was 38.44 CFU/m3 at Gdanska 16 Street and 20.97 CFU/m3 at Czerniak 1/3 Street.
Table 5.
Number of microorganisms found in the air in follow-up studies.
The mean bacterial count in parks was 87.22 ± 146.64 CFU/m3. In the screened parks, the highest total number of bacteria was observed in Poniatowski Park (439.48 CFU/m3), and the lowest in Sienkiewicz Park (3.5 CFU/m3). We found the highest number of bacteria in the air in the park, which is surrounded on all sides by busy streets and bordering two shopping centers. On the street locations, the counts were 52.42 CFU/m3 at Gdanska 16 Street and 20.97 CFU/m3 at Czerniak 1/3 Street (Table 5). None of these values exceeded the permissible values, i.e., all were below 1000 CFU/m3 [41].
The isolated fungi belong to 20 species. Four species, viz. Alternaria alternata, Aspergillus fumigatus, Penicillium chrysogenum and Trichoderma harzianum, were found in the air samples from five locations (Table 6). The most species-rich samples were taken from Zrodliska Park and Gdanska 16 (seven species each). Of the 20 species isolated, three belonged to RG 2 and 17 to RG 1.
Table 6.
Species of fungi isolated from the air in follow-up studies.
An example of fungal growth is shown in Figure 1.
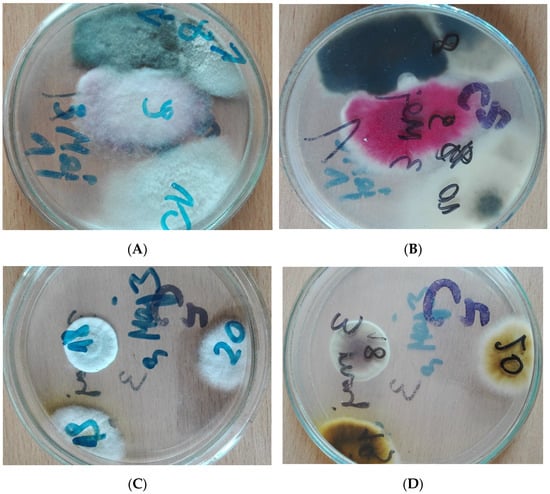
Figure 1.
Fungi growth on Czapek-Dox medium in samples collected in May 3rd Park: (A) Pilot Study-obverse, (B) Pilot study-reverse, (C) Follow-up study-obverse, (D) Follow-up study-reverse.
3.3. Statistical Analysis
The statistical analysis (Kruskal–Wallis test, at p < 0.05) showed no statistically significant differences in the total number of bacteria (p = 0.6287) and fungi (p = 0.3856) between individual seasons and locations: parks and street locations (Figure 2).
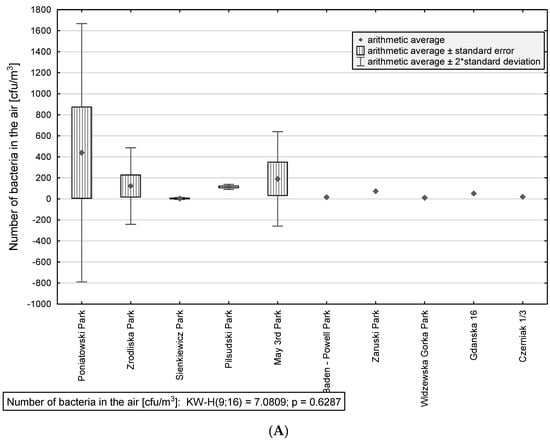
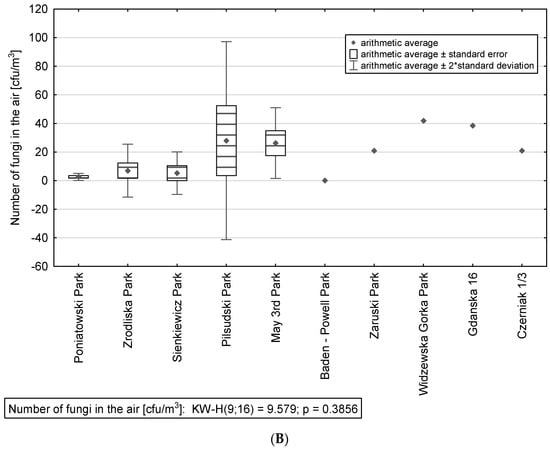
Figure 2.
Values of arithmetic averages for multiple comparisons (Kruskal–Wallis test post-hoc test result): (A) total number of bacteria; (B) total number of fungi.
Considering street locations as controls, there were no statistically significant differences in the number of fungi (p = 0.0771) and bacteria (p = 0.7237) between the stands in parks and at streets. A comparison of the number of fungi and bacteria between individual parks was also made. Statistical analysis showed no statistically significant differences in the total number of fungi between the analyzed parks (p = 0.4289), as well as between the value of the total number of bacteria (p = 0.3326).
No statistically significant correlations of the total number of fungi with weather parameters and the level of airborne smog particles were found. However, the total number of bacteria demonstrated a positive correlation with air temperature and ozone levels during sampling, and a negative correlation with humidity, atmospheric pressure and smog parameters (CO, NO, NO2 and NOx). A statistically significant positive correlation was also observed between the total number of bacteria and the size of the park. In larger parks we found a greater total number of bacteria than in smaller ones, however, in the case of fungi, we did not register such a relationship. The values of the Spearman correlation coefficient are presented in Table 7.
Table 7.
Relationship between the total number of bacteria and fungi and the size of the park and physico–chemical air contamination (Spearman’s correlation coefficient values).
No statistically significant correlations were found between the total number of bacteria and fungi, although in some parks, the total number of bacteria was very high (Poniatowski and Piłsudski Parks). On the other hand, the total number of fungi was very low. In our study, we also did not find statistically significant correlations between the total number of fungi or the total number of bacteria and the levels of PM2.5 and PM10 (Table 7).
4. Discussion
Airborne fungi can pose a risk to human health. About 10% of the population suffers from an allergy associated with fungal spores. The presence of fungi in bioaerosols has been associated with an increase in the frequency of asthma and infectious diseases of the respiratory tract [16].
The presence of fungal spores in the air can pose a risk to people with a severely weakened immune system. Therefore, analyses of the presence of potentially pathogenic fungi are often carried out within hospitals. For example, in Iran, a comparison of the number and diversity of air mycobiota was carried out at the Hematology, Infectious Disease, and the Ear, Nose and Throat Ward, as well as the Neonatal Intensive Care Unit and in ambient air at locations outside the hospital [22]. Interestingly, a higher concentration of fungi was found in outdoor air than in the hospital wards. In the indoor air, the greatest number of fungal spores was recorded in the Hematology Ward, and the least in the Ear, Nose and Throat Ward. The genera Alternaria, Penicillium and Aspergillus dominated around the hospital, which corresponds to our present findings regarding recreational areas. Interestingly, Rostami et al. [22] note that yeasts dominated the indoor air of the hospital, and mold fungi outside. We found no yeast in our research.
In the forest part of the Rogów Arboretum, between 75 and 110 CFU of fungi were found per m3 of air, with the highest concentration of fungi observed in May. Alternaria alternata dominated the Rogów Arboretum. However, in the Alpinarium part, the author observed a lower concentration of fungi in the air but greater species diversity [46]. Hila et al. [47] noted varied numbers of fungi of air in different urban environments, with the highest number being found in an outdoor market (on average 460 CFU/m3) and the lowest in parks (44 CFU/m3). Much higher concentrations of fungi (on average 930 CFU/m3) were found in the air in various regions of the USA, with filamentous fungi of the genera Cladosporium, Penicillium and Aspergillus dominating [48]. Air analyses around cowsheds over 12 months showed that the average fungus count was 634.2 CFU/m3, with the highest numbers recorded in March and June. In this case, filamentous fungi of the genera Aspergillus and Alternaria dominated [16]. In our present study conducted from December to March, the predominant genera were Aspergillus, Penicillium and Alternaria.
Previous studies indicate that bioaerosol particles may become deposited on PM [17]. In addition, higher numbers of fungal spores tend to be found on PM10 than PM2.5. This was clearly demonstrated in a study in the city of Taj [13], where 15 species of filamentous fungi, including the genera Aspergillus and Penicillium, were noted in almost every sample [13].
Relatively low numbers of bacteria were found in the air in the parks by some authors. In a study conducted in a city in Algeria, mean bacterial counts of 49 CFU/m3 were found in parks and as much as 467 CFU/m3 at train stations [47]. Corresponding results were also obtained by Adamus-Białek et al. [49], who also note a higher concentration of bacteria in street air than in parks. In our study, the average number of bacteria in the parks was more than twice as high as that recorded in city locations, while the average number of fungi was twice as low. Statistical analysis showed that in parks in Lodz, the number of bacteria positively correlated with the size of the park.
Research conducted at the Tourism-driven Center of Southeast China showed the lowest concentration of cultivated fungi in winter [25]. It was found that the number of fungi in green and cultural and educational areas was similar but higher than in areas with heavy traffic and in the vicinity of shops and shopping centers [25]. The authors suggest that this may be related to the possibility of fungal growth on vegetation [25]. In our research, the highest concentration of fungi in the air was found in parks that were located in places with less traffic. On the other hand, we found a very low concentration of fungi in the largest park, which is crossed in two directions by very busy streets, and due to the proximity of the botanical garden, the zoo and the aqua park, it is very often visited by residents. We believe that these may be the reasons for the lower fungal concentration. We can observe a similar relationship in Poniatowski Park, which is surrounded by busy streets and borders two shopping centers. Interestingly, in both of these parks, we found the highest concentration of breeding bacteria.
A year-round study of urban areas found lower numbers of bacteria in winter seasons, being several times lower than in spring [17]. A similar study by Brągoszewska and Pastuszka [11] also observed the highest number of bacteria in atmospheric air in spring and autumn, and the lowest in winter. Similarly, Raghav et al. [13] report bacterial concentrations several times higher than in our present study. Compared to the values reported by Brągoszewska and Pastuszka [11], the winter bacterial CFU values in the present pilot study were found to be a few times higher (November and December), and the value in the follow-up study was twice as high (December–March). In studies conducted in Silesia (Poland), a strong correlation was observed between the number of bacteria and dust particles; the authors suggest that small bacterial cells may adhere to dust particles and be transported with them in the air [11]. In the present study, no statistically significant relationship was found between the total number of bacteria and the levels of PM10 and PM2.5. This may be related to low air temperatures during sampling, which negatively affected the survival of microorganisms.
In recent years, in Beijing, extensive analyses of the prevalence of microorganisms in relation to smog particles were carried out [14,50,51,52]. Molecular studies have shown that bacteria had the largest share in bioaerosol, constituting over 80% of microorganisms, while fungi, algae, Archea and viruses contributed significantly less [14]. Most of the microorganisms found in the air samples were of terrestrial origin. Cao et al. [14] observed that bacteria were more likely to be associated with PM2.5, while eukaryotic cells were usually found among PM10.
A negative correlation was found by Fan et al. [51] between air pollution and bacterial differentiation: high bacterial species diversity was observed on days with a low level of PM2.5, and low diversity with a high level of PM2.5. In the case of fungi, no similar relationships were found [51]. Although most researchers that are inclined to analyze mainly the relationship of microorganisms with PM2.5 [14,50,51] suggest that PM10 may be a better predictor of the airborne bacterial and fungal community. Although a number of studies [14,50,51,53,54,55] indicate the dependence of the abundance and differentiation of microorganisms on the components of air pollutants, recent studies also indicate a significant share of meteorological factors [53,56,57]. Wang et al. [53] showed that the highest richness and diversity of microorganisms occur in autumn and the lowest in winter. Our study was conducted in winter and we did not observe a statistically significant dependence of the number of bacteria and fungi on PM2.5 and PM10. Wherein Zhen et al. [56] calculated that during winter, the abundance of bacteria is only 28% dependent on pollution, while bacteria diversity is not affected by pollution. Additionally, Gou et al. [55] found no correlation between the number of fungi and PM10 but found such a correlation in the case of PM1. In our research, we did not assess the presence of PM1, which, when analyzing the results of other authors [55], seems to be significant. Therefore, we want to extend the research in subsequent stages to assess the relationship between the number of fungi and PM1.
Our present findings indicate a negative correlation between the presence of bacteria and the levels of chemical pollutants (CO, NO, NOx). In our study, we found a negative relationship between the number of bacteria and the concentration of CO and NO/NO2. Similar relationships were also found in the studies by Wang et al. [53]. Liu et al. [54] found a negative correlation between the overall abundance of bacteria and CO, while in the case of pathogenic bacteria, they found a positive correlation. In our study, the total number of bacteria was related to the concentration of O3. Interestingly, similar results were obtained by Liu et al. [54] for total bacterial abundance and the opposite relationship was observed in the case of pathogenic bacteria. In our opinion, this aspect requires a lot of further research. Liu et al. [50] also observed a significant difference in microbial communities between urban and rural areas. Higher bacterial abundance was noted in the rural environment. Regarding the fungi, higher levels of Ascomycota were observed in urban areas and Basidiomycota in rural areas. Long-term monitoring also showed that air microbiota communities were more homogeneous in urban environments [50].
It was observed that the number and diversity of microorganisms were related to weather conditions [53,55,57]. Most culturable bacteria and fungi were observed during unhealthy haze days when higher PM concentrations were also observed [52]. The number and diversity of microorganisms in the bioaerosol of the outside air in a given area depends also on the season, with a greater number of microorganisms recorded in the summer [12,13]. Our present findings indicate an increased number of bacteria at higher air temperatures. A positive correlation has also previously been found between the number of bacteria and air temperature in urban areas [17], which suggests that the number of bacteria in the atmospheric air increases with increasing temperature. Similar results were observed during the autumn–winter season in positions located on busy streets, where the number of bacteria in the air increased significantly at 12 °C [49]. Fan et al. [51] recorded a greater species diversity in Beijing in winter than in summer. This is probably related to the winter temperature being more favorable for microorganisms. Fan et al. [51] also report a positive correlation between bacterial diversity and atmospheric pressure. In contrast, in our present study, we observed an inverse relationship. In our research, we observed a negative correlation between air humidity and the number of bacteria. Uetake et al. [57] also found a negative correlation of air humidity with the bacterial composition and diversity of bioaerosol. This fact may be related to reduced aerosolization under high humidity conditions [26]. However, studies conducted in China by the team of Fang et al. [25] found a significant relationship between the selected types of fungi and air humidity. This may indicate that changes in air humidity significantly affect the taxonomic structure of mycobiota.
However, the number of propagules may also be influenced by other factors, such as the level of UV radiation. Studies conducted in Upper Silesia showed a significant negative correlation between the number of bacteria and the level of UV radiation [17]. Our research was carried out in winter because we wanted to assess whether the number of fungi and bacteria in the air could be affected by particles from household chimneys. In Lodz, especially in the city center, a number of tenement houses and detached houses still use coal and wood-fired stoves. A meta-analysis by Lee et al. [8] showed a correlation between household air pollution and the incidence of numerous respiratory diseases, including asthma, acute respiratory infection and adults and children, chronic obstructive pulmonary disease, lung cancer, tuberculosis, as well as cardiovascular disease, ischaemic heart disease, low birth weight and stillbirths.
Bragoszewska et al. [17] report a positive correlation between the number of bacteria and air humidity, however, in the present study, a decreased number of bacteria was observed at higher humidity levels. Regarding fungi, a similar relationship was observed by Pavan and Manjunath [16] in the atmospheric air around cowsheds, while Fan et al. [51] note a negative correlation between both bacterial and fungal diversity and humidity. Our present findings do not indicate any correlation between humidity and fungal CFU count.
Mycological and bacteriological studies of outside air were conducted in various environments in a number of regions of the world. The findings indicate that the microorganisms present in bioaerosols can have a considerable influence on human health and can be used as a bioindicator for environmental monitoring. Both the number and composition of microorganisms in the air are extremely important for human health [58]. Specific genera or species, even the most common allergens, can be successfully used as air quality indicator organisms. However, this still requires a lot of further research. It would be very important for human health to set a limit value for the presence of microorganisms in the air. Some authors suggest a value of 10,000 CFU/m3, while others indicate that a concentration of bacteria above 5000/m3 indicates microbiological contamination [15,59]. Unfortunately, further research is required to set more definite values.
Even so, it is widely accepted that the highest proportion of air bioaerosols is made up of bacteria and fungi. Many complex interactions exist between these organisms, and between bioaerosol components and air pollutants, all of which could have negative effects on human health [51]. Therefore, there is a need for more efficient monitoring of airborne pollutants and microorganisms to learn about the structure of the air biota, the mechanisms regulating their occurrence, and to identify potential threats to human health. Constant monitoring of various regions will contribute to establishing the nature of the relationship between organisms, including fungi, and factors of anthropogenic origin.
About 140,000 species are currently known within the kingdom of fungi, but according to taxonomists, the number of species reaches 2.2–3.8 million species, and may even reach 12 million [28]. Therefore, in fact, we are just discovering this group of organisms, and research of various environments is still necessary, including air monitoring, based on both classical and molecular methods.
5. Conclusions
During the research, we did not find that the number of microorganisms (fungi and bacteria) in the air was exceeded.
Among the isolated fungi, species posing a threat to human health were found.
The average number of bacteria in the parks was more than twice as high as that recorded in city locations, while the average number of fungi was twice as low. Statistical analysis showed that in parks in Lodz, the number of bacteria positively correlated with the size of the park.
The total number of bacteria demonstrated a positive correlation with air temperature and ozone levels during sampling and a negative correlation with humidity, atmospheric pressure and smog parameters (CO, NO, NO2 and NOx).
Author Contributions
Conceptualization, K.G., S.L. and W.G.; methodology, K.G.; formal analysis, K.G., S.L., W.G. and F.K.; investigation, S.L., W.G. and K.R.; resources, F.K. and K.R.; data curation, K.G. and W.G.; writing—original draft preparation, K.G., W.G. and F.K.; writing—review and editing, K.G., W.G. and E.B.-L.; visualization, S.L. and K.R.; supervision, E.B.-L.; project administration, K.G. and E.B.-L. All authors have read and agreed to the published version of the manuscript.
Funding
This research received no external funding.
Institutional Review Board Statement
Not applicable.
Informed Consent Statement
Not applicable.
Data Availability Statement
Weather Underground https://www.wunderground.com/about/data (access on 15 December 2018); Voivodeship Inspectorate for Environmental Protection in Lodz database https://www.wios.lodz.pl/Lodz-Gdanska_16,211,11 (access on 11 November 2019).
Conflicts of Interest
The authors declare no conflict of interest.
References
- Evangelopoulos, D.; Perez-Velasco, R.; Walton, H.; Gumy, S.; Williams, M.; Kelly, F.K.; Kűnzli, N. The role of burden of disease assessment in tracking progress towards achieving WHO global air quality guidelines. Int. J. Public Health 2020, 65, 1455–1465. [Google Scholar] [CrossRef] [PubMed]
- Rajagopalan, S.; Brook, R.D. The indoor-outdoor air-pollution continuum and the burden of cardiovascular disease: An opportunity for improving global health. Glob. Heart 2012, 7, 207–213. [Google Scholar] [CrossRef] [PubMed]
- Babatola, S.S. Global burden of diseases attributable to air pollution. J. Public Health Afr. 2018, 9, 162–166. [Google Scholar] [CrossRef] [PubMed]
- Butt, E.W.; Turnock, S.T.; Rigby, R.; Reddington, C.L.; Yoshioka, M.; Johnson, J.S.; Regayre, L.A.; Pringle, K.J.; Mann, G.W.; Spracklen, D.V. Global and regional trends in particulate air pollution and attributable health burden over the past 50 years. Environ. Res. Lett. 2017, 12, 104017. [Google Scholar] [CrossRef]
- Anenberg, S.C.; Miller, J.; Henze, D.K.; Minjares, R.; Achakulwisut, P. The global burden of transportation tailpipe emissions on air pollution-related mortality in 2010 and 2015. Environ. Res. Lett. 2019, 14, 094012. [Google Scholar] [CrossRef]
- European Environment Agency. Air Quality in Europe—2020 Report; Publications Office of the European Union: Luxembourg, 2020. [Google Scholar] [CrossRef]
- Dziubanek, G.; Spychała, A.; Marchwińska-Wyrwał, E.; Rusin, M.; Hajok, I.; Ćwieląg-Drabek, M.; Piekut, A. Long-term exposure to urban air pollution and the relationship with life expectancy in cohort of 3.5 million people in Silesia. Sci. Total Environ. 2017, 580, 1–8. [Google Scholar] [CrossRef]
- Lee, K.K.; Bing, R.; Kiang, J.; Bashir, S.; Spath, N.; Stelzle, D.; Mortimer, K.; Bularga, A.; Doudesis, D.; Joshi, S.S.; et al. Adverse health effects associated with household air pollution: A systematic review, meta-analysis, and burden estimation study. Lancet Glob. Health 2020, 8, e1427–e1434. [Google Scholar] [CrossRef]
- Shaddick, G.; Thomas, M.L.; Mudu, P.; Ruggeri, G.; Gumy, S. Half of the world’s population are exposed to increasing air pollution. Clim. Atmos. Sci. 2020, 3, 23. [Google Scholar] [CrossRef]
- Prussin, A.J., II; Garcia, E.B.; Marr, L.C. Total virus and bacteria concentrations in indor and outdoor air. Environ. Sci. Technol. Lett. 2015, 2, 84–88. [Google Scholar] [CrossRef]
- Brągoszewska, E.; Pastuszka, J.S. Influence of meteorological factors on the level and characteristics of culturable bacteria in the air in Gliwice, Upper Silesia (Poland). Aerobiologia 2018, 34, 241–255. [Google Scholar] [CrossRef]
- Jiayu, C.; Qiaoqiao, R.; Feilong, C.; Chen, L.; Jiguo, W.; Zhendong, W.; Lingyun, C.; Liu, R.; Guoxia, Z. Microbiology community structure in bioaerosols and the respiratory diseases. J. Environ. Sci. Public Health 2019, 3, 347–357. [Google Scholar] [CrossRef]
- Raghav, N.; Mamta Shrivastava, J.N.; Satsangi, G.P.; Kumar, R. Enumeration and characterization of airborne microbial communities in an outdoor environment of the city of Taj, India. Urban Clim. 2020, 32, 100590. [Google Scholar] [CrossRef]
- Cao, C.; Jiang, W.; Wang, B.; Fang, J.; Lang, J.; Tian, G.; Jiang, J.; Zhu, T.F. Inhalable microorganisms in Beijing’s PM2.5 and PM10 pollutants during a severe smog event. Environ. Sci. Technol. 2014, 48, 1499–1507. [Google Scholar] [CrossRef] [PubMed]
- Chmiel, M.J.; Frączek, K.; Grzyb, J. The problems of microbiological air contamination monitoring. Water-Environ.-Rural Areas 2015, 1, 17–27. [Google Scholar]
- Pavan, B.; Manjunath, K. Qualitative analysis of indoor and outdoor airborne fungi in cowshed. Hindawi J. Microbiol. 2014, 985921. [Google Scholar] [CrossRef]
- Brągoszewska, E.; Mainka, A.; Pastuszka, J.S. Concentration and size distribution of culturable bacteria in ambient air during spring and winter in Gliwice: A typical urban area. Atmosphere 2017, 8, 239. [Google Scholar] [CrossRef]
- Abatenh, E.; Gizaw, B.; Tsegaye, Z.; Tefera, G. Microbial function on climate change—A review. Open J. Environ. Biol. 2018, 3, 001–007. [Google Scholar] [CrossRef]
- Cavicchioli, R.; Ripple, W.J.; Timmis, K.N.; Azam, F.; Bakken, L.R.; Baylis, M.; Behrenfeld, M.J.; Boetius, A.; Boyd, P.W.; Classen, A.T.; et al. Scientists’ warning to humanity: Microorganisms and climate change. Nat. Rev. Microbiol. 2019, 17, 569–586. [Google Scholar] [CrossRef]
- Grisoli, P.; Albertoni, M.; Rodolfi, M. Application of airborne microorganism indexes in offices, gyms, and libraries. Appl. Sci. 2019, 9, 1101. [Google Scholar] [CrossRef]
- Mucci, N.; Gianfranceschi, G.; Cianfanelli, C.; Santucci, S.; Spica, V.R.; Valeriani, F. Can microbiota be a novel marker for public health? A sampling model and preliminary data from different environments. Aerobiologia 2020, 36, 71–75. [Google Scholar] [CrossRef]
- Rostami, N.; Alidadi, H.; Zarrinfar, H.; Salehi, P. Assessment of indoor and outdoor airborne fungi in an Educational, Research and Treatment Center. Ital. J. Med. 2017, 11, 52–56. [Google Scholar] [CrossRef][Green Version]
- Górny, R.L.; Harkawy, A.S.; Ławniczek-Wałczyk, A.; Karbowska-Berent, J.; Wlazło, A.; Niesler, A.; Gołofit-Szymczak, M.; Cyprowski, M. Exposure to culturable and total microbiota in cultural heritage conservation laboratories. Int. J. Occup. Med. Environ. Health 2016, 29, 255–275. [Google Scholar] [CrossRef] [PubMed]
- Awad, A.H.; Gibbs, S.G.; Tarwater, P.M.; Green, C.F. Coarse and fine culturable fungal air concentrations in urban and rural homes in Egypt. Int. J. Environ. Res. Public Health 2013, 10, 936–949. [Google Scholar] [CrossRef] [PubMed]
- Fang, Z.; Zhang, J.; Guo, W.; Lou, X. Assemblages of Culturable Airborne Fungi in a Typical Urban, Tourism-driven Center of Southeast China. Aerosol. Air Qual. Res. 2019, 19, 820–831. [Google Scholar] [CrossRef]
- Ruiz-Gil, T.; Acuna, J.J.; Fujiyoshi, S.; Tanaka, D.; Noda, J.; Maruyama, F.; Jorquera, M.A. Airborne bacterial communities of outdoor environments and their associated influencing factors. Environ. Int. 2020, 145, 106156. [Google Scholar] [CrossRef] [PubMed]
- Chanchaem, W.; Awakairt, S. Detection of Pathogenic Bacteria in the Air by Culture Techniques in Combination with Multiplex Polymerase Chain Reaction. Curr. Appl. Sci. Technol. 2020, 20, 354–362. [Google Scholar]
- Lücking, R.; Aime, M.C.; Robbertse, B.; Miller, A.N.; Ariyawansa, H.A.; Aoki, T.; Cardinali, G.; Crous, P.G.; Druzhinina, I.S.; Geiser, D.M.; et al. Unambiguous identification of fungi: Where do we stand and how accurate and precise is fungal DNA barcoding? IMA Fungus 2020, 11, 14. [Google Scholar] [CrossRef]
- Andualem, Z.; Ayenew, Y.; Ababu, T.; Betelhem Hailu, B. Assessment of Airborne Culturable Fungal Load in an Indoor Environment of Dormitory Rooms: The Case of University of Gondar Student’s Dormitory Rooms, Northwest Ethiopia. Air Soil Water Res. 2020, 13. [Google Scholar] [CrossRef]
- PN-89/Z-04008/08:1989; Ochrona Czystości Powietrza. Pobieranie Próbek. Pobieranie Próbek Powietrza Atmosferycznego (Imisja) Do Badań Mikrobiologicznych Metodą Aspiracyjną i Sedymentacyjną. Air Purity Protection. Sampling. Atmospheric Air Sampling (Immission) for Microbiological Tests Using the Aspiration and Sedimentation Method. Sektor Zdrowia, Środowiska i Medycyny: Warsaw, Poland, 1989. (In Polish)
- Gerlach, D. Basics of Botanical Microtechnique; PWRiL: Warszawa, Poland, 1972. [Google Scholar]
- Krzyściak, P.; Skóra, M.; Macura, A.B. Atlas Grzybów Chorobotwórczych; MedPharm Polska: Wrocław, Poland, 2011. (In Polish) [Google Scholar]
- de Hoog, G.S.; Guarro, J.; Gené, J.; Figueras Ahmed, S.; Al-Hatmi, A.M.S.; Figueras, M.J.; Vitale, R.G. Atlas of Clinical Fungi Online; Wiley: Hoboken, NJ, USA, 2019; Available online: http://www.clinicalfungi.org/ (accessed on 20 September 2021).
- Watanabe, T. Pictorial Atlas of Soil and Seed Fungi. In Morphologies of Cultured Fungi and Key to Species; CRC Press LLC: Boca Raton, FL, USA, 2002. [Google Scholar]
- Raper, K.B.; Fennell, D.I. The Genus Aspergillus; Krieger: New York, NY, USA, 1973. [Google Scholar]
- Pitt, J.I. The Genus Penicillium and Its Teleomorphic States Eupenicillium and Talaromyces; Academic Press: London, UK, 1979. [Google Scholar]
- Fassatiova, O. Microscopic Fungi in Technical Microbiology; Wydawnictwo Naukowo-Techniczne: Warszawa, Poland, 1983. [Google Scholar]
- St-Germain, G.; Summerbell, R. Identifying Filamentous Fungi, 2nd ed.; Star Publishing Company: Belmont, MA, USA, 2011. [Google Scholar]
- Index Fungorum. Available online: http://www.indexfungorum.org/names/names.asp (accessed on 4 December 2021).
- PN-89/Z-04111/01:1989; Ochrona Czystości Powietrza. Badania Mikrobiologiczne. Postanowienia Ogólne i Zakres Normy. Air Purity Protection. Microbiological Testing. General Provisions and the Scope of the Standard. Sektor Zdrowia, Środowiska i Medycyny: Warsaw, Poland, 1989. (In Polish)
- PN-89/Z-04111/02:1989; Ochrona Czystości Powietrza. Badania Mikrobiologiczne. Oznaczanie Liczby Bakterii w Powietrzu Atmosferycznym (Imisja) Przy Pobieraniu Próbek Metodą Aspiracyjną i Sedymentacyjną. Air Purity Protection. Microbiological Testing. Determination of the Number of Bacteria in the Atmospheric Air (Immission) during Sampling with the Aspiration and Sedimentation Method. Sektor Zdrowia, Środowiska i Medycyny: Warsaw, Poland, 1989. (In Polish)
- PN-89/Z-04111/03:1989; Ochrona Czystości Powietrza. Badania Mikrobiologiczne. Oznaczanie Liczby Grzybów Mikroskopowych w Powietrzu Atmosferycznym (Imisja) Przy Pobieraniu Próbek Metodą Aspiracyjną i Sedymentacyjną. Air Purity Protection. Microbiological Testing. Determination of the Number of Microscopic Fungi in the Atmospheric air (Immission) When Sampling with the Aspiration and Sedimentation Method. Sektor Zdrowia, Środowiska i Medycyny: Warsaw, Poland, 1989. (In Polish)
- Basińska, M.; Michałkiewicz, M.; Górzeński, R. Jakość powietrza—wymagania i klasyfikacje dotyczące zanieczyszczeń chemicznych i mikrobiologicznych. Rynek Instal. 2016, 6, 74–78. (In Polish) [Google Scholar]
- Weather Underground. Available online: https://www.wunderground.com/about/data (accessed on 15 December 2018).
- Voivodeship Inspectorate for Environmental Protection in Lodz Database. Available online: https://www.wios.lodz.pl/Lodz-Gdanska_16,211,11 (accessed on 11 November 2019).
- Kwiatkowska, J. Mycological air pollution in the rocery and forest part of the Rogów Arboretum of the Warsaw University of Life Science. Zesz. Nauk. Inst. Ogrod. 2018, 26, 33–41. (In Polish) [Google Scholar]
- Hila, N.; Mali, S.; Miraka, M. Microbiological quality of outdoor air in some settings of Elbasan City. Thalass. Salentina 2018, 40, 67–74. [Google Scholar] [CrossRef]
- Shelton, B.G.; Kirkland, K.H.; Flanders, D.; Morris, G.K. Profiles of airborne fungi in buildings and outdoor environments in the United States. Appl. Environ. Microbiol. 2002, 68, 1743–1753. [Google Scholar] [CrossRef] [PubMed]
- Adamus-Białek, W.; Filipiak, A.; Wawszczak, M.; Woźniak, A.; Głuszek, S. The microbiological condition of public air in the city during autum and winter. Med. Stud. 2019, 35, 203–209. [Google Scholar] [CrossRef]
- Liu, H.; Hu, Z.; Zhou, M.; Hu, J.; Yao, X.; Zhang, H.; Li, Z.; Lou, L.; Xi, C.; Qian, H.; et al. The distribution variance of airborne microorganisms in urban and rural environments. Environ. Pollut. 2019, 247, 898–906. [Google Scholar] [CrossRef]
- Fan, X.-Y.; Gao, J.-F.; Pan, K.-L.; Li, D.-C.; Dai, H.-H.; Li, X. More obvious air pollution impacts on variations in bacteria than fungi and their co-occurrences with ammonia-oxidizing microorganisms in PM2.5. Environ. Pollut. 2019, 251, 668–680. [Google Scholar] [CrossRef]
- Guo, Z.; Wang, Z.; Qian, L.; Zhao, Z.; Zhang, C.; Fu, Y.; Li, J.; Zhang, C.; Lu, B.; Qian, J. Biological and chemical compositions of atmospheric particulate matter during hazardous haze days in Beijing. Environ. Sci. Pollut. Res. 2018, 25, 34540–34549. [Google Scholar] [CrossRef]
- Wang, S.; Liu, W.; Li, J.; Sun, H.; Qian, Y.; Ding, L.; Ma, H.; Li, J. Seasonal variation characteristics of bacteria and fungi in PM2.5 in typical basin cities of Xi’an and Linfen, China. Atmosphere 2021, 12, 809. [Google Scholar] [CrossRef]
- Liu, H.; Zhang, X.; Zhang, H.; Yao, X.; Zhou, M.; Wang, J.; He, Z.; Zhang, H.; Lou, L.; Mao, W.; et al. Effect of air pollution on the total bacteria and pathogenic bacteria in different sizes of particulate matter. Environ. Pollut. 2018, 233, 483–493. [Google Scholar] [CrossRef]
- Gou, H.; Lu, J.; Li, S.; Tong, Y.; Xie, C.; Zheng, X. Assessment of microbial communities in PM1 and PM10 of Urumqi during winter. Environ. Pollut. 2016, 214, 202–210. [Google Scholar] [CrossRef]
- Zhen, Q.; Deng, Y.; Wang, Y.; Wang, X.; Zhang, H.; Sun, X.; Ouyang, Z. Meteorological factors had more impact on airborne bacterial communities than air pollutants. Sci. Total Environ. 2017, 601, 703–712. [Google Scholar] [CrossRef]
- Uetake, J.; Tobo, Y.; Uji, Y.; Hill, T.C.J.; DeMott, P.J.; Kreidenweis, S.M.; Misumi, R. Seasonal changes of airborne bacterial communities over Tokyo and influence of local meteorology. Front. Microbiol. 2019, 10, 1572. [Google Scholar] [CrossRef] [PubMed]
- Siebielec, S.; Woźniak, M.; Gałązka, A.; Siebielec, G. Microorganisms as indoor and outdoor air biological pollution. Adv. Microbiol. 2020, 59, 115–117. [Google Scholar] [CrossRef]
- Goyer, N.; Lavoie, J.; Lazure, L.; Marchand, G. Bioaerosols in the Workplace: Evaluations, Control and Prevention Guide; IRSST, Occupational Health and Safety Research Institute Robert Sauvre: Montreal, QC, Canada, 2001. [Google Scholar]
Publisher’s Note: MDPI stays neutral with regard to jurisdictional claims in published maps and institutional affiliations. |
© 2022 by the authors. Licensee MDPI, Basel, Switzerland. This article is an open access article distributed under the terms and conditions of the Creative Commons Attribution (CC BY) license (https://creativecommons.org/licenses/by/4.0/).