Abstract
Green infrastructure is well recognized as a key urban climate mitigation strategy. In line with this, and following a central government decree, Jakarta Municipal Government has created a green infrastructure target of 30% underpinned by a green space weighting factor. This study questions the efficacy of such a “universal” target setting from the point of view of outdoor thermal comfort and demonstrates the basis for an alternative approach. Based on a “new’ green factor developed from a systematic analysis of the literature, thermal comfort simulations of representative local climate zones (LCZ) show that improvements in current green space policy are possible. We enumerate a rational basis for specifying green space targets per local area based on contextual realities as captured by the LCZ approach. Such a nuanced approach to mitigate the human comfort consequences of inadvertent urban growth is not only more contextually appropriate but also enhances the feasibility of achieving the intended goal of urban greening in Jakarta.
1. Introduction
Elevated temperatures resulting from global climate change super-imposed on urban warming due to the urban heat island (UHI) effect are a serious public health concern [1]. This is particularly problematic in hot, humid regions of the world, where the increasing frequencies of heatwaves are likely to threaten urban resilience to climate change. The overheating risk is further enhanced by a combination of urban-scale impacts (e.g., reduced ventilation, increased waste heat, lack of green space, and dense built-up areas), [2] as well as building-scale impacts [3].
Green infrastructure (GI) has been proposed as one possible intervention that may help mitigate the UHI effect and to enhance human health and comfort. Trees and other types of vegetation can reduce air and radiant temperatures via shading and evaporative cooling [4] and these are further influenced by site-specific conditions [5]. In light of this, and as indicated in the section below on “Environmental context of Jakarta, Indonesia,” the Jakarta city government has set a green area target of 30% of the total city area, following the national law of the Central Government of Indonesia. Nevertheless, less than a third of this target has been achieved in 20 years, indicating the need to base such targets on a realistic, rational, and evidence-based approach.
In this paper, we aim to show the limitations of a city-wide GI target and propose a better way to approach GI target setting based on local climate realities. We explore the implications of our findings for open space policy in warm, humid climates in general.
2. Background
2.1. Urban Warming and Green Infrastructure
The UHI mitigation strategies can be grouped into three: (1) increase vegetation cover, (2) increase thermal reflectivity (albedo) of urban surfaces, particularly roofs, and (3) manipulate urban geometry [6]. At the city scale, these three are controlled by the number of buildings, greenery, and pavement, and could be measured in terms of green plot ratio (GnPR) [7], sky view factor (SVF), surrounding building density, the wall surface area, pavement area, and albedo [8]. Based on several case studies, Wong et al. [8] showed that in the tropics the largest cooling impact (up to 1.2 °C) is achieved by variables such as GnPR, building height, and density. GnPR has the highest impact due to the shading and evapotranspiration effects of trees. As such, increasing the vegetation cover is the most common intervention to mitigate not only the heat but also human health [4]. Green infrastructure can reduce the impact of air pollutants, enhance carbon sequestration, contribute to rainwater infiltration and flooding risk control, cool the air through tree transpiration and shading, and reduce energy consumption and the UHI effect.
The cooling effect of GI can reach up to 500 m from the edge of large green patches [9] but this is strongly influenced by not only the quantity of green space [10] but also their spatial distribution [11], as well as the type of green spaces (such as forests, [12]). Refs. [13,14] provide a framework to quantify three different health benefits of greenspace: reducing harm (air pollution, heat, and noise), restoring, and enhancing capacities.
Nazarian et al. [15] stated that thermal comfort is a top priority with a direct impact on productivity and cognitive performance, wellbeing, and health of urban dwellers. However, its practical implementation would necessitate comprehensive, accurate, and easy-to-understand evaluations of outdoor thermal comfort. The proposed outdoor thermal comfort autonomy uses metrics that quantify outdoor space performance with regards to thermal comfort and heat stress.
2.2. Quantification of GI
Given the variety and type of urban green infrastructure (natural and semi-natural forests, trees, grass meadows, roof gardens, green walls, etc.) it is necessary to devise ways to quantify their ecological effectiveness (including cooling effectiveness). One of the early works in recognizing the differences in different landscape elements is the GnPR developed by Ong [7], which used the leaf area index (LAI) as a proxy for the ecosystem services provided by the different green covers. A commonly used contemporary strategy is to assign different weights to different GI classes, depending on their “ecological effectiveness” [16,17]. Several cities have recently developed calculation tools as a means to quantify the disparate GI features into a single metric to aid planning decision making. While different names are assigned to these metrics, a common name appears to be green area factor (GAF) or green factor (GF). The use of the term “factor” denotes the urban planning decision making nature of the exercise—GAF/GF is an attempt to give more or less credit to various GI in proportion to the ecosystem services provided by them. The GAF/GF is a planning instrument developed by cities to aid their environmental agenda of reconnecting people and nature, reducing energy consumption, enhancing flood control, restoring the full hydrological cycle, preserving and enhancing wildlife habitats, improving urban aesthetics, and building a new green identity in a thermally comfortable urban environment [18]. In general, typical GAF is composed of three interconnected components: ratings to compare different GI features (such as trees, grass, roof gardens, etc.); set of targets (depending on land use and urban functions), and a final ratio determined for each parcel of land [19].
There appears to be two approaches to quantify ecosystem services provided by different landscape elements.
- Connection to surrounding soil assigned the highest value without regard to the type of vegetation cover, and the depth of soil structure rather than the vegetation highlighted;
- An inclusive calculation that accounts for both the existence of landscape elements, as well as the soil structure
Table 1 shows a comparison of different green factors from around the world. In keeping with the first approach to quantify ecosystem services provided by GI, “sealed surfaces” (such as paved areas) are typically assigned a zero score. Some of the green factors shown in Table 1 have been adjusted so as to make them comparable.

Table 1.
Green factors from different cities.
Berlin and NW England fall under the first category (i.e., connection to surrounding soil), followed by Southampton and London with the inclusion of ground cover vegetation such as grass and shrubs in their calculation. On the other hand, Helsinki, Seattle, Washington DC, and Malmö give credit to different ground cover, shrubs, and trees and are therefore examples of the second category (i.e., inclusive calculations).
Not all cities have all of the “Landscape elements” shown in Table 1; in some cases, there is greater variety within a single “Landscape element” (such as “Rainwater infiltration and stormwater features” in Helsinki, which has six different sub-categories). Where these differ, an average value has been used. The selected green factors compared in Table 1 are not meant to be exhaustive; these merely reflect only those that are comparable across the many landscape elements specified in the Table.
2.3. Environmental Context of Jakarta, Indonesia
The key environmental concerns in Jakarta (6.12° S, 106.49° E), capital of Indonesia are flooding (USD357 million damage in 2007 according to the Jakarta Disaster Management Department); UHI (recognized as a major environmental hazard in the city [20] with a strong correlation between land surface temperatures and the density of impervious surfaces); and air pollution. Jakarta’s annual average levels of PM2.5 in 2018 was 45 μg/m3 [21], against the World Health Organization, WHO, air quality threshold of 25 μg/m3 for 24 h exposure [22]. PM2.5 levels in the Special Capital Region of Jakarta have a positive correlation with temperatures and fraction of residential land cover and a negative correlation with NDVI and humidity [21].
Given the role of land cover (especially green cover) in addressing all of the above environmental concerns, the Jakarta city government considers GI as key to mitigating the environmental issues in the metropolitan region. Several policy and legal instruments exist to promote GI in the region, for example, Law No. 27 (2007) of The Republic of Indonesia concerning Spatial Management (see http://sim.ciptakarya.pu.go.id/p2kh/knowledge/detail/uu-26-2007-law-spatial-planning, accessed on 23 January 2022, for an English translation), the proportion of “ideal” green area in big cities such as Jakarta is set at 30% of the total city area, with 20% public green areas, and 10% for the private sector. Ministry of Home Affairs Regulation No. 1/2007 (http://extwprlegs1.fao.org/docs/pdf/ins74544.pdf, accessed on 23 January 2022) concerning the arrangement of green/open spaces in urban areas classifies the functions of green area as a buffer for urban conservation areas, pollution control and environmental damage, biodiversity protection, water system control, and as urban aesthetics (Ministry of Home Affairs, Regulation No. 1/2007). However, these targets are area based and do not differentiate between the different types of GI.
Based on the Ministry of Public Works Green City Roadmap 2015, the total area of Jakarta Green space in recent years was only 9.97% in public areas (against the target of 20%) and the shortfall in meeting the total green area is 6520 Ha. This discrepancy between “law” and “practice” of green open space in Jakarta is highlighted elsewhere (for example, [23]).
One of the strategies to improve Jakarta’s green open space, according to Jakarta’s Provincial Spatial Plan 2030, is to increase the quantity and quality of green open space distribution throughout the city’s districts and to maintain the availability of green open space, one of which is the implementation of the green area factor (GAF) particularly for government buildings and vertical greenery. While this is a useful attempt to account for the differences in ecosystem services provided by different types of GI, a rational basis for such GAF does not exist at present. Similarly, the efficacy and practicality of green space approaches to cooling have not been previously studied.
3. Materials and Methods
The present work aims to develop a new green factor for Jakarta and propose a better way to approach GI target setting based on local climate realities rather than a blanket, city-wide approach.
Our approach was based on six steps:
- Literature based search for green area indices;
- Develop own “New Green Factor” for cooling in Jakarta;
- Classify Jakarta metropolitan area into climatically similar zones (local climate zones—LCZ);
- Select representative examples representing a majority of Jakarta’s land use;
- Explore the cooling effect of GI on the basis of maximum possible green cover in these representative areas;
- Evaluate cooling potential/limitations and propose next steps.
Jakarta has a tropical monsoon climate with high, year-round temperature (average monthly temperature 28.9 °C, diurnal range = 26–32 °C), very high rainfall (average annual rainfall = 1243.8 mm), and high humidity (>70%) (http://statistik.jakarta.go.id, accessed on 23 January 2022,). With over 10 million population and high population density (16,376 per km2), Jakarta metropolitan area (“Jabodetabek”—an acronym of Jakarta, Bogor, Depok, Tangerang, and Bekasi) is the second-largest metropolitan area in the world [24].
We developed our own “New Green Factor” for Jakarta as follows. First, we listed fifteen landscape elements as categories to structure the proposed “New Green Factor”. Thereafter, all the selected weighting factors were normalized (0 to 1). Note that Malmo’s green factor values for trees are not normalized. Although a simple averaging of all of the selected green factors may lead to a skewed value for trees, we have retained the original numbers in the expectation that trees have a disproportionately high influence on cooling ecosystem service than all other types of GI [25]. It is customary to assign weightage factors based on expert opinion [26]. In the absence of such expert opinion, and given that the selected factors were themselves based on expert opinion, we simply averaged them all to derive our proposed “New Green Factor”. In other words, ours is an average of “expert opinions”. We have aimed to accommodate as many possibilities of landscape elements as possible for implementation and consider the practical difficulties of applying green infrastructure in the Jakarta Metropolitan area, based on the own experience of one of the authors.
The third step involved the classification of the city region into climatically similar areas. We followed the well-known supervised classification process called the “World Urban Database and Access Portal Tools” (WUDAPT) protocols [27] to classify the region into 17 local climate zone (LCZ) classes [28]. We selected 145 training areas to train the machine to classify the whole Jakarta metropolitan area into LCZs. In this process, we relied on our own local knowledge of land use and land cover across the region.
Having developed an LCZ map of the Metropolitan area, Step 4 involved the selection of “representative” locations that account for the majority of LCZ classes in the region. We selected LCZ classes that account for the majority of the Jakarta metropolitan region. The following steps guided their selection:
- At least 400 m × 400 m in extent and entirely consist of the same LCZ class (to facilitate the simulations in Step 5);
- Located in the center of an LCZ patch (to minimize the “edge” effect);
- Conform to local development plans, design guidelines, limitations due to conservation area and nature of ownership to increase the possibility of GI implementation.
Step 5 involved the exploration of the cooling potential of GI in the selected places as per Step 4. This involved ENVI-met simulation and comparison of mean radiant temperature (as a proxy for thermal comfort) of the existing situation (“base case”) against a future “green” scenario where the maximum green cover possible in each location is assumed to have taken place (“best case”). MRT is an excellent predictor of thermal comfort and has been widely used in the past as a proxy for thermal comfort [29]. While outdoor human thermal comfort indices such as PET or UTCI exist, these need to be validated for the local context and only a few studies have attempted this (less than 10% of outdoor thermal comfort studies, according to a recent survey [29]). In order to indicate thermal discomfort, we also calculated the predicted percentage of dissatisfied (PPD). It is to be noted that PPD (a corollary of PMV) was developed for indoor comfort, it is therefore a limitation of the present study. However, we have used PPD only to highlight the relative differences (between cases) of thermal dissatisfaction and not the absolute values. Together with MRT, such relative PPD values could provide a measure of thermal comfort/discomfort. Both the PPD and MRT values were calculated using the ENVI-met software and are reported at a height of 1.5 m above ground. We use our own proposed “New Green Factor” as developed in Step 2 to calculate the maximum green cover possible.
ENVI-met is a prognostic non-hydrostatic model for the simulation of surface–plant–air interactions. It comprises a 3D main model and a one-dimensional (1D) atmospheric boundary layer (ABL) model, which extends from the ground surface up to 2500 m. ENVI-met has a typical horizontal resolution from 0.5 m to 5 m and a typical time frame of 24 h to 48 h with a time step of 1 s to 5 s, which meets the criteria for the accurate simulation of physical processes, suitable for microclimate studies at the neighborhood scale. The atmospheric system solves Reynolds-averaged Navier–Stokes equations using a 1.5 order turbulence closure k-ε model. The model has been extensively validated, including in warm climates [30,31,32,33,34,35]. For a full review of validation studies, proper procedures for simulations and their limitations, see [36,37].
Input parameters for ENVI-met simulation are given in Table 2 below. The geometric models of the selected sites are shown in Supplementary Materials.
Table 2.
ENVI-met simulation parameters.
Finally, we created a composite “cooling map” of Jakarta metropolitan area. This is based on the assumption that the maximum possible greening being met across the whole region. This enabled us to estimate the likely city-wide cooling effect of the current GI policy and to explore future policy directions and the next steps needed to cool the city adequately.
4. Results
The proposed “New Green Factor” for Jakarta is shown in Table 3. These were used to quantify the GI in the rest of the study.
Table 3.
Proposed “New Green factor” for Jakarta.
Figure 1 shows the LCZ classification of the Jakarta Metropolitan Area. Table 4 enumerates the fraction of the city covered in each of the LCZ classes. As can be seen from Table 4, five classes of LCZ account for nearly 70% of the entire urban area (LCZ 1, 3, 6, 8, and 10). This provided the basis for the selection of simulation locations.
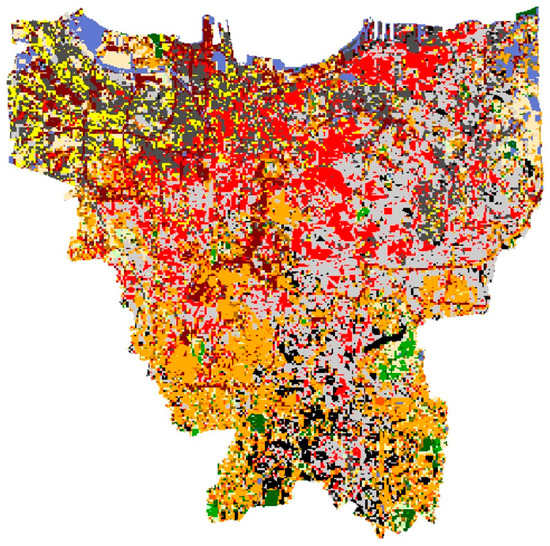
Figure 1.
LCZ map of Jakarta Metropolitan Region.
Table 4.
Distribution of LCZ classes in the Jakarta Metropolitan Region.
Table 5 describes in detail the urban characteristics of the five selected areas, representing each of the LCZ classes that together account for the vast majority of land cover in the city. Figure 2 shows the locations and images of the selected sites.
Table 5.
Description of urban characteristics of the selected sites.
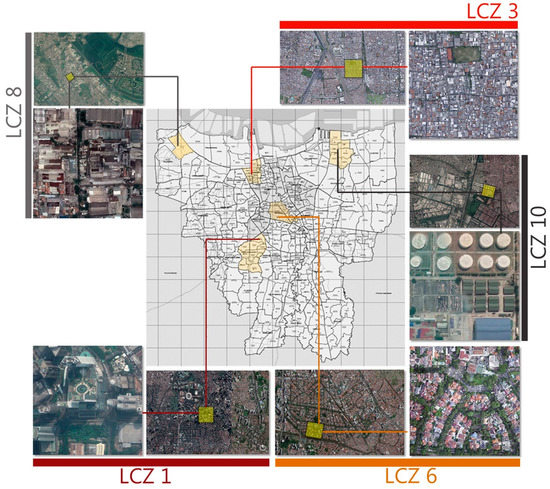
Figure 2.
Map of the Jakarta Metropolitan Region showing the selected sites.
Table 6 shows a comparison of green scores for the existing (“base case”) and the “best case” for all five selected locations. The “best scenario” refers to the maximum possible green cover achievable at a given site, using our new green factor. It could be seen from this table that the official target (30% GI cover) is not always possible to be achieved in all areas, without reducing the built cover.
Table 6.
GI score for “base” and “best” cases at the selected sites.
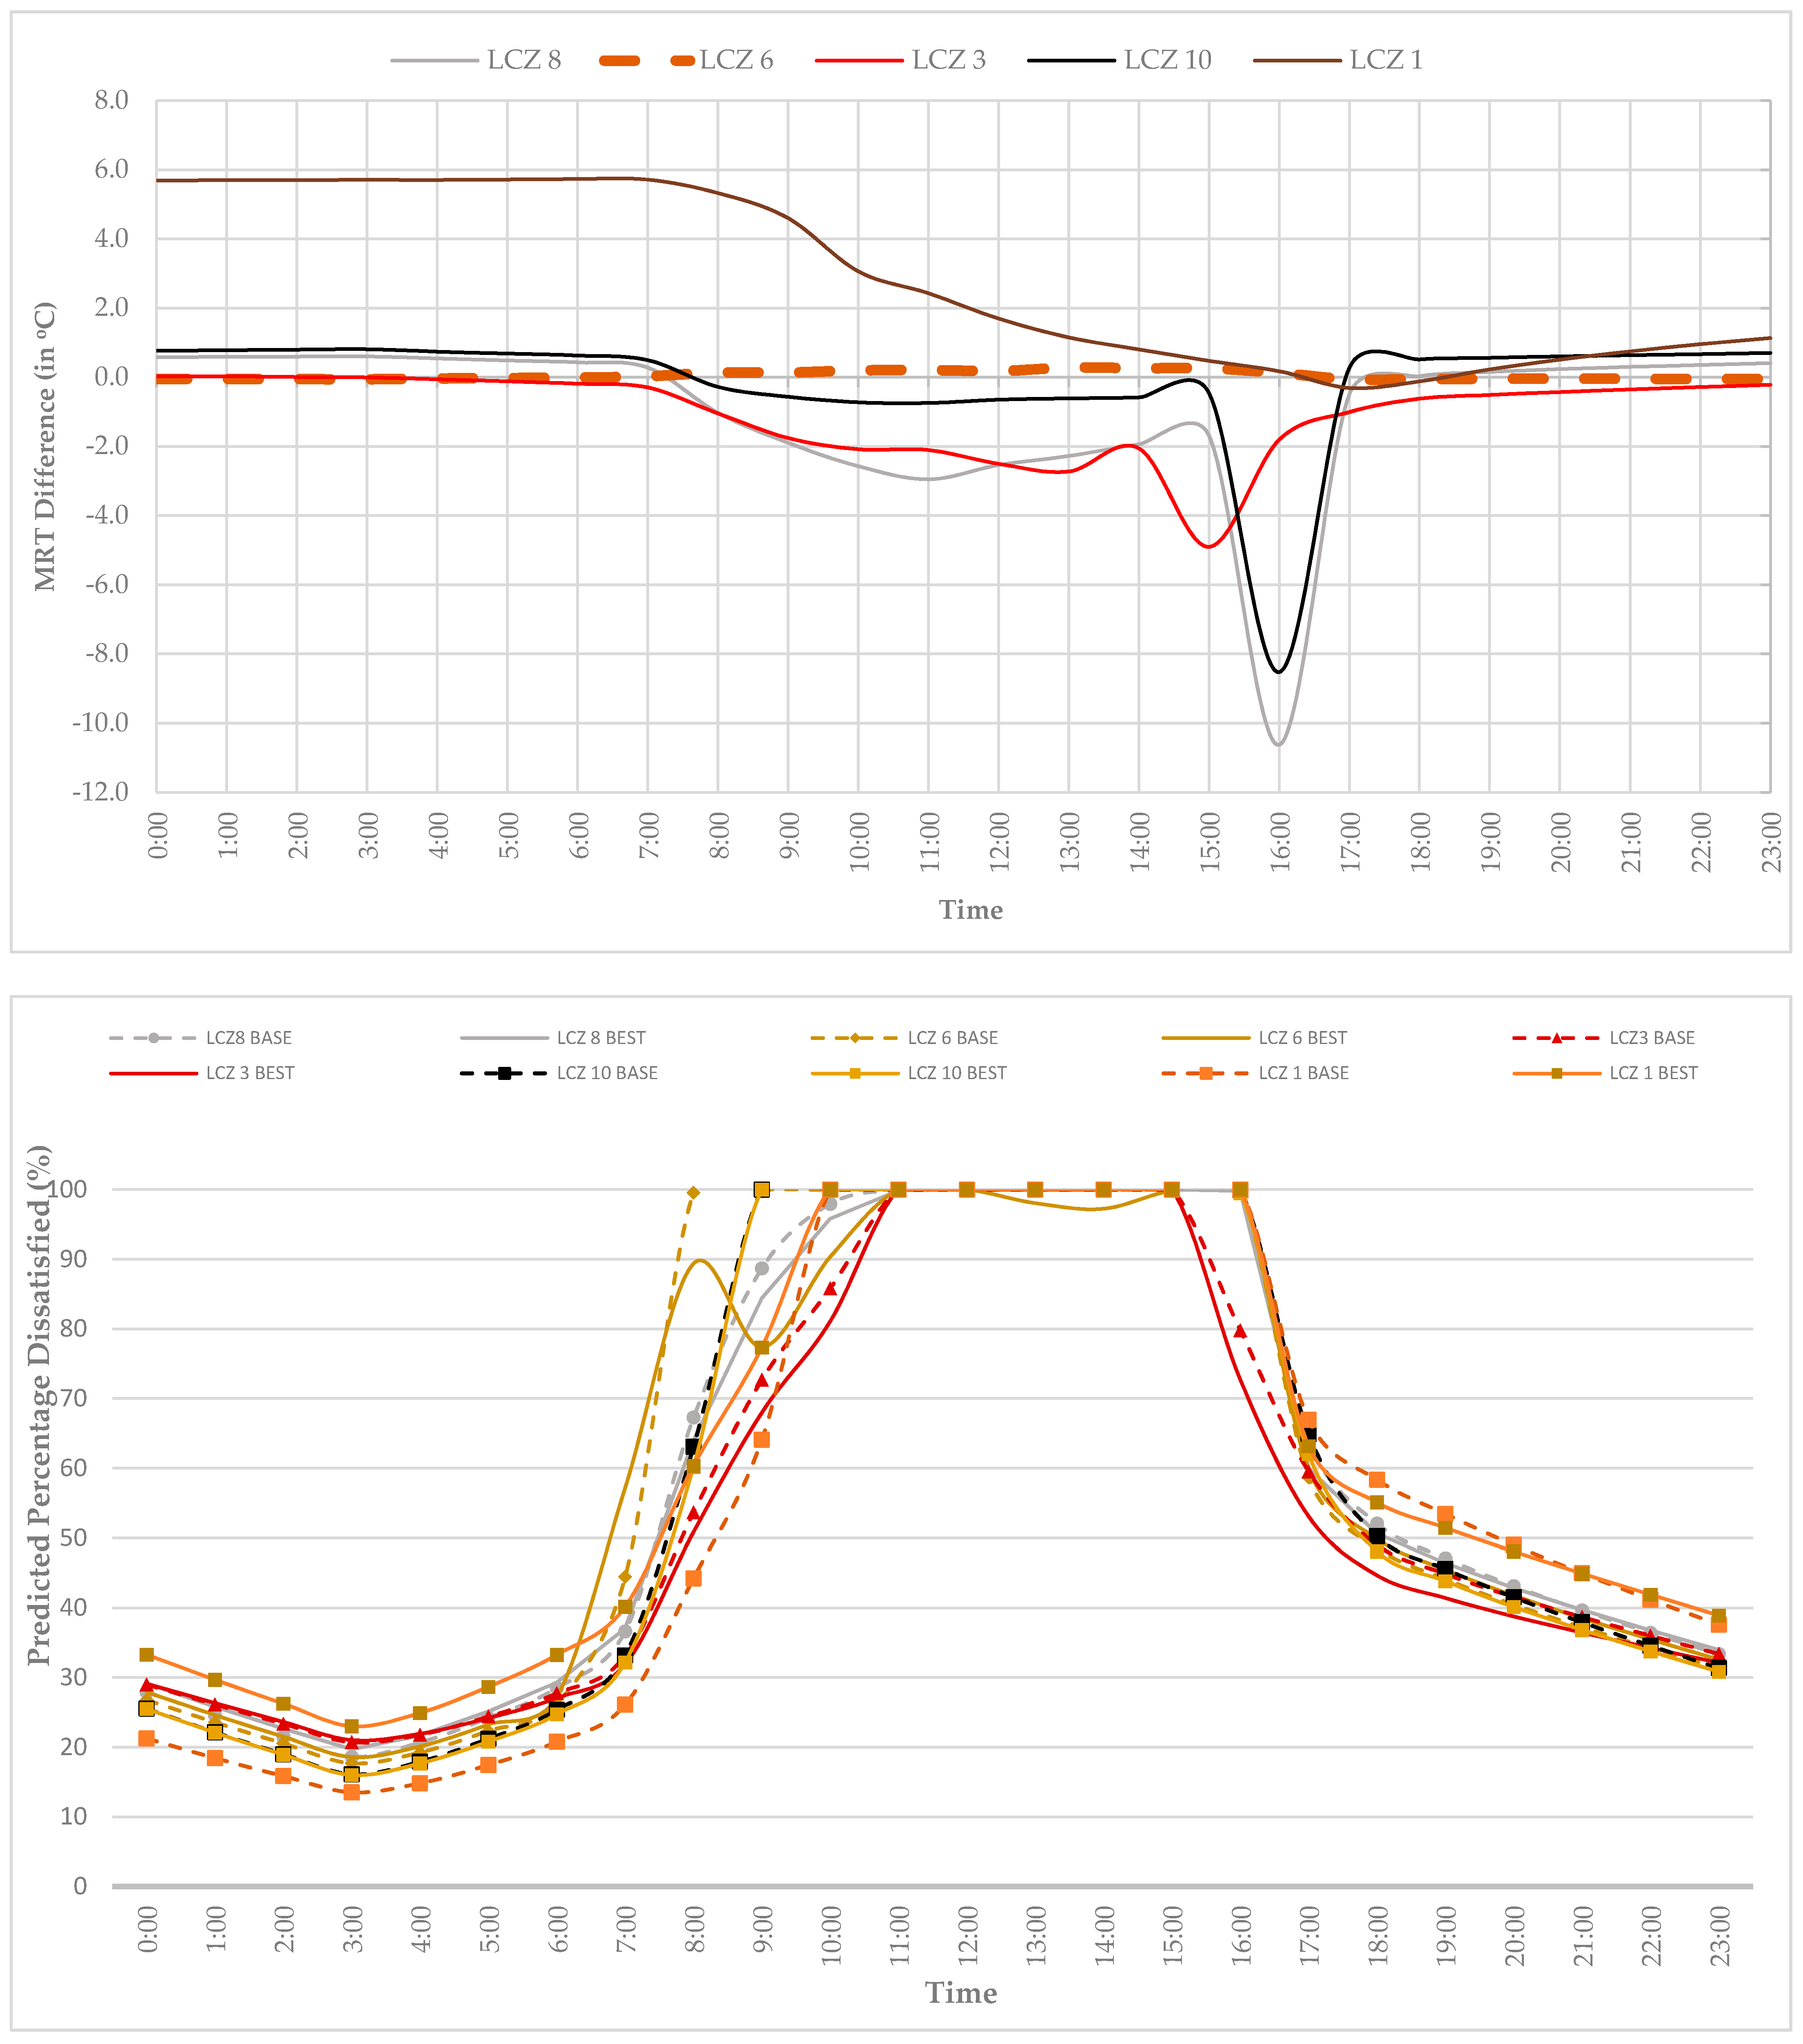
Table 7 and Figure 3 tabulates and visually represent (respectively) the results of the “best case” application of GI on the selected study date (16 June 2020), when the weather was typical of a warm, humid location such as Jakarta (day/night air temperature/humidity conditions were 32 °C/71% and 26 °C/93% respectively). The results are presented as differences between the “best” and the “base” cases. A negative value means the “best” case is warmer while a positive value indicates the best case is cooler than the “base” case.
Table 7.
Maximum and minimum MRT (in °C) for all selected sites.
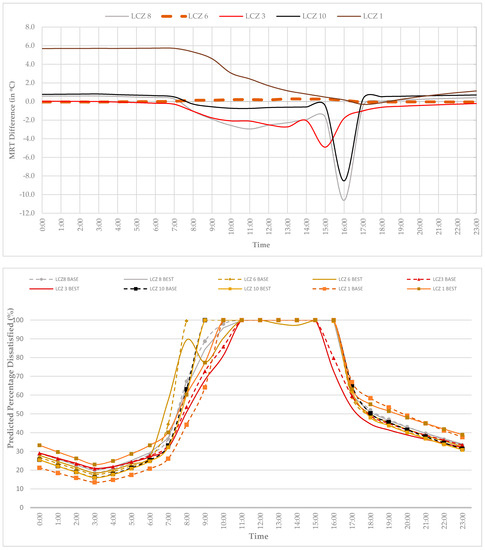
Figure 3.
Thermal comfort changes due to green infrastructure (above) MRT differences and (below) predicted percentage of dissatisfied (PPD).
It can be seen from the above that in LCZ 8 and LCZ 3, the addition of >40% green cover leads to an MRT reduction of approx. 2.5 °C. In LCZ 10, 17% increase in green cover lowers MRT by about 1.5 °C. However, in LCZ 6, where greater increase in green cover is not possible (i.e., difference in green cover between “base” and “best” cases <8%), more green cover leads to a modest increase in MRT (≈0.4 °C). This is due to the very high built cover (see Supplementary Materials for the base case model) where any further increase in shading (by green cover) could lead to a reduction in ventilation. A modest increase in MRT is also seen in LCZ 1. In fact, the tall buildings at this site already provide considerable shade and the addition of a large amount of GI (+117%) further reduces ventilation.
The results show positive effects of GI only in three LCZ categories: LCZ 3, LCZ 8, and LCZ 10. In these locations, the higher the GI cover, the larger the reduction in MRT. On the contrary, LCZ 1 (compact high-rise, which has the highest built cover), shows an increase in MRT even with a very high GI cover. Shadows from high-rise buildings create large cooling pockets at this site.
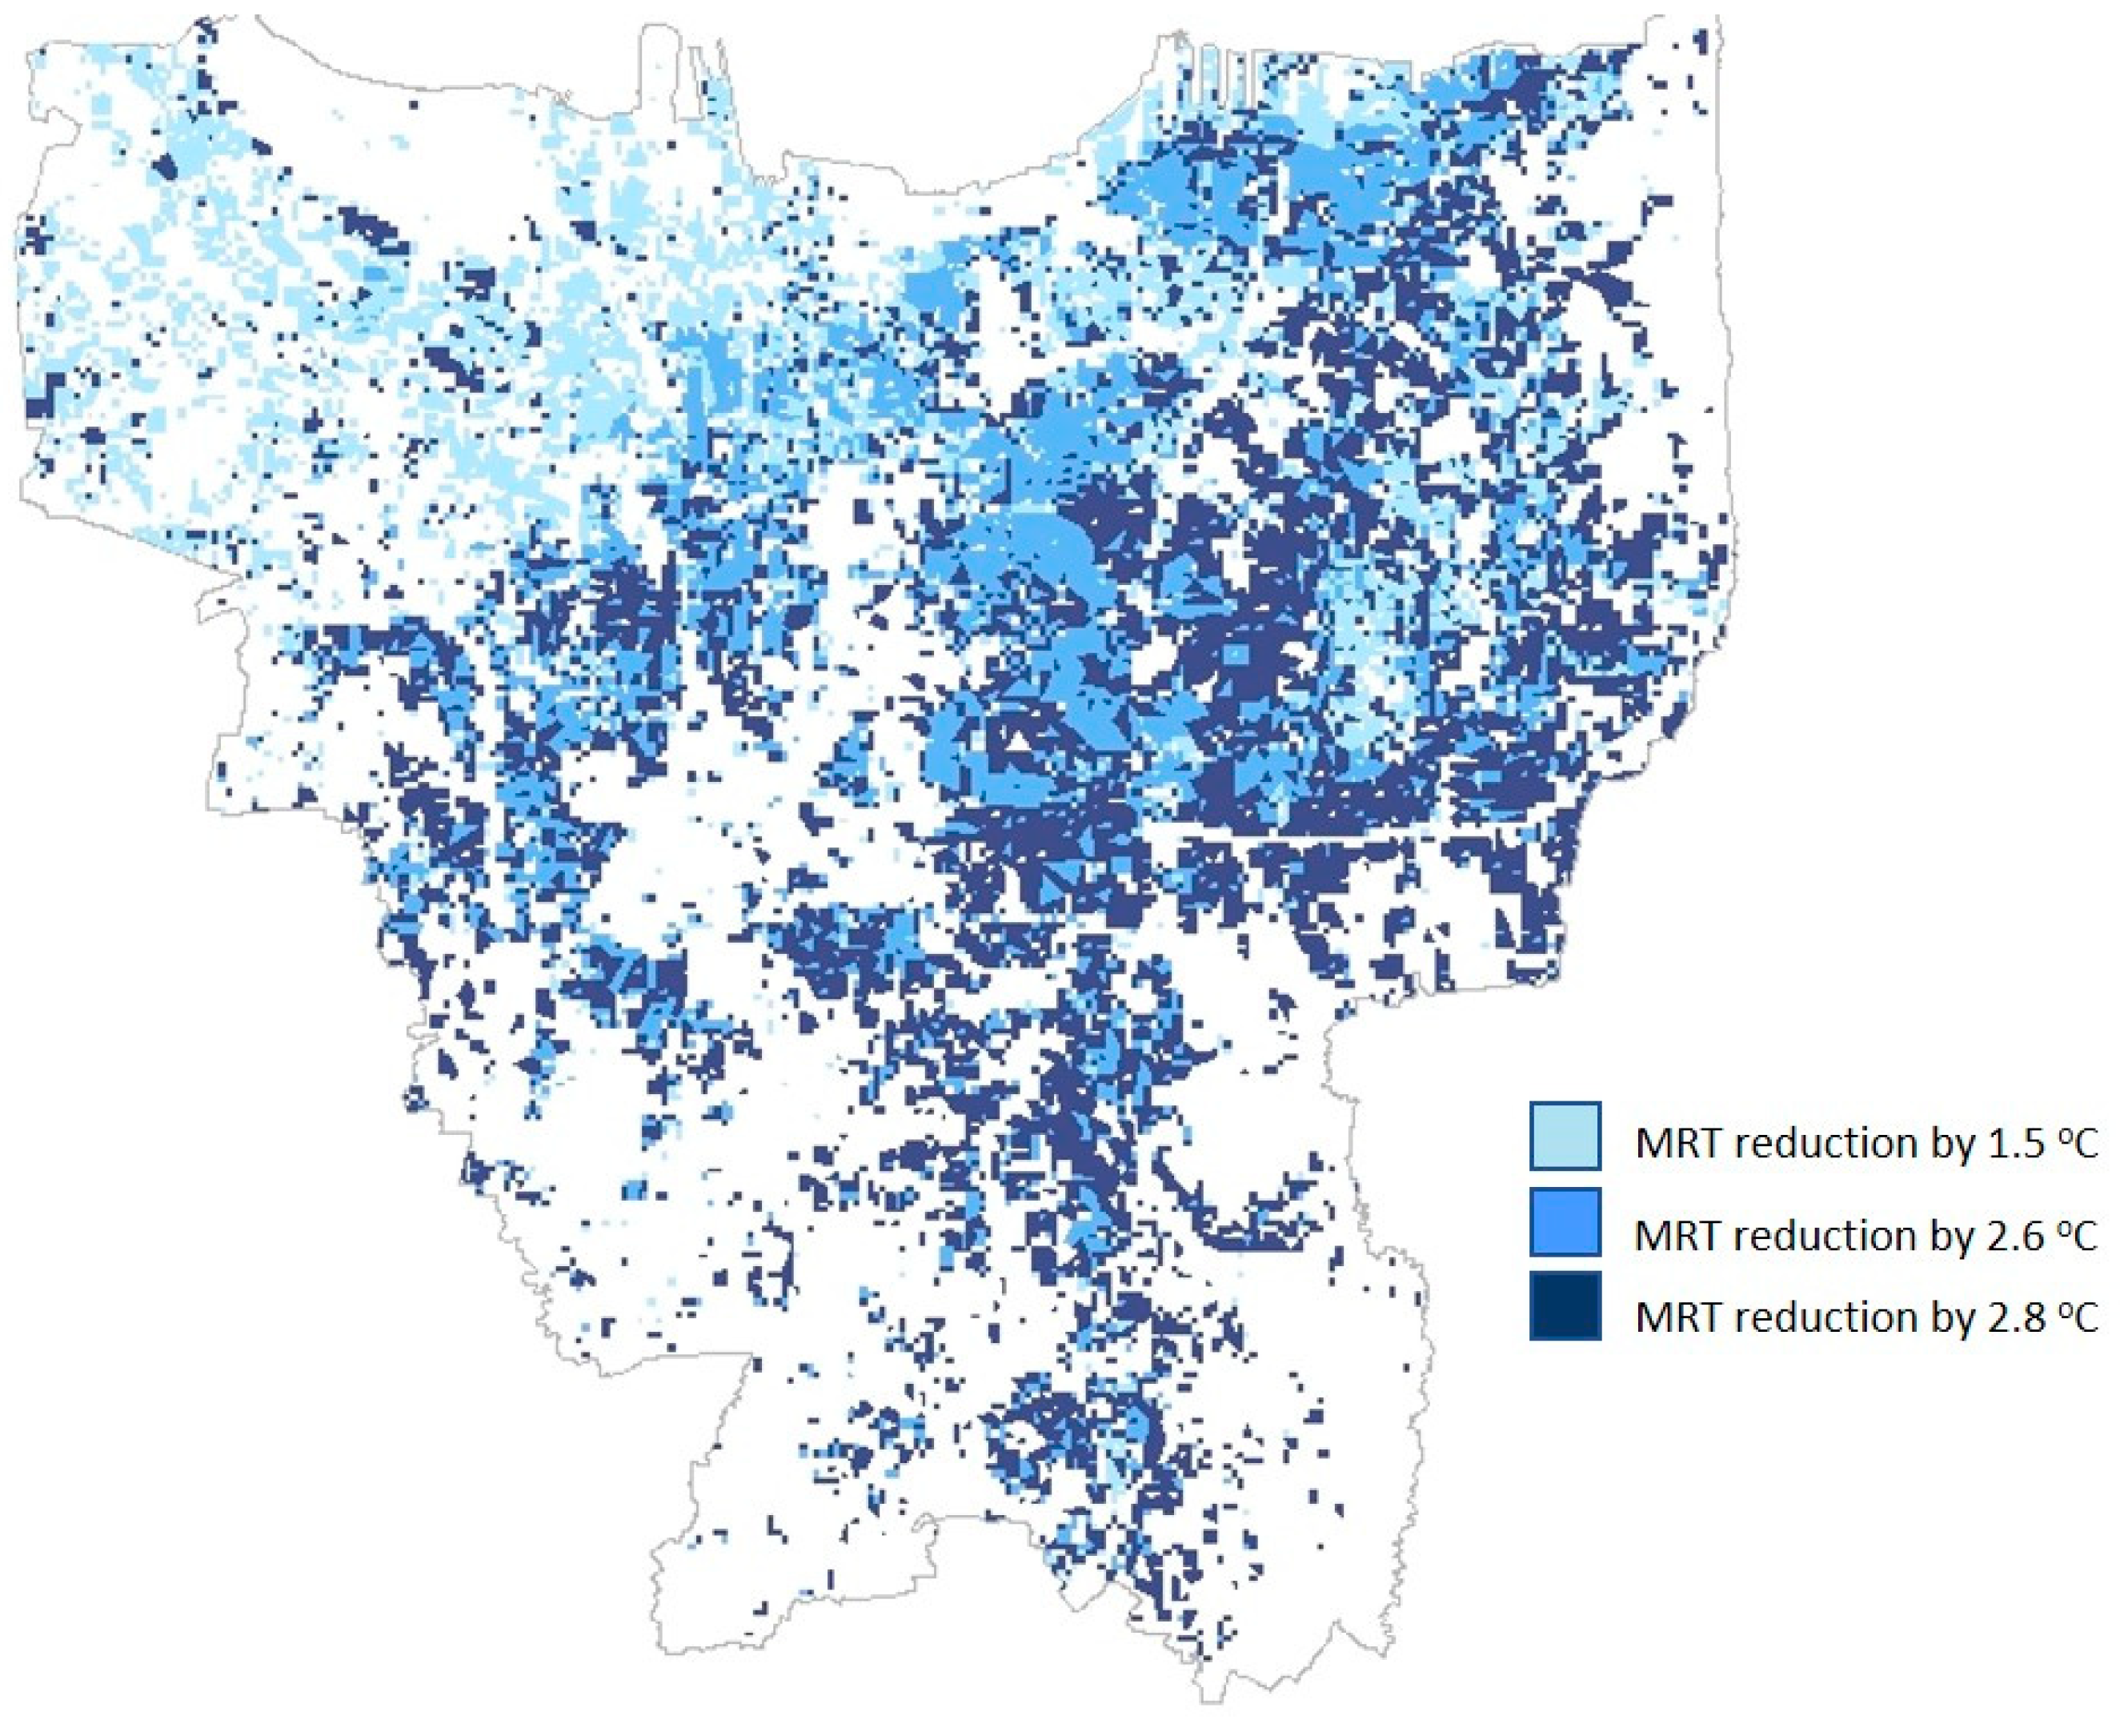
The absolute maximum effect of GI at the warmest time of the day (14:00 h local time) is shown in Table 8. The three listed LCZs (3, 8, and 10) represent nearly half (46.8%) of Jakarta. Based on this, an extrapolation across the Jakarta Metropolitan Area of the likely maximum cooling effect of GI is shown in Figure 4.
Table 8.
Maximum MRT reductions at the warmest time of day (14:00 hrs local time).
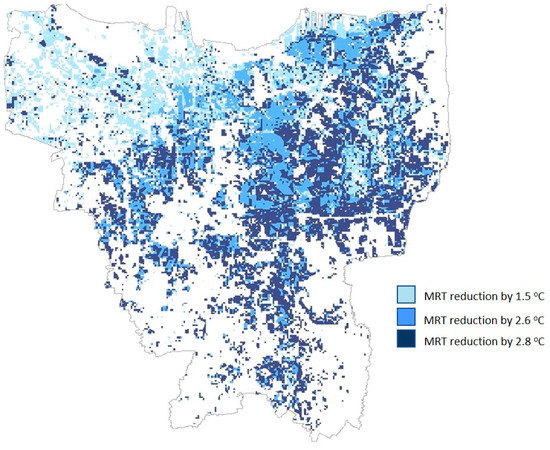
Figure 4.
Extrapolation of cooling across the Jakarta Metropolitan Region.
5. Implications
One of the distinctions that is gaining increased attention is the spatial pattern of GI. In literature dealing with GI-based urban cooling, it is customary to distinguish between the composition and configuration of GI. Masoudi et al. [38] defined composition of GI (quantity) as those attributes that are not place-specific whereas configuration focuses on spatial attributes (in which land use) as well as the distributional characteristics of green patches. The target setting of GI needs to account for these differences as well (i.e., where the target is to be set, as well as how much should be the target). Although we have not distinguished between the two, it is indirectly implied in our approach to target setting based on LCZ classes (which accounts for local land use as well as land cover). This tallies well with a previous study [24] that found in Jakarta, not only the amount but also the configuration of urban green spaces controls the land surface temperature (and therefore UHI). As such, greening policies will need to focus on optimizing green spaces as opposed to merely focusing on increasing the number of green spaces.
Such optimization would benefit from more evidence-based quantification of cooling services provided by actual green spaces in warm, humid cities. In particular, studies on the quantitative and qualitative requirements for multiple ecosystem service provision of urban green space in compact and/or rapidly growing cities are needed [39]. This would help to better contextualize the green space quantification that we have developed in Table 3 that attempted to synthesize the current state of knowledge from different cities around the world, but not specific to warm, humid cities.
Finally, there is a need to acknowledge the limitations of a GI-based cooling approach to mitigate the UHI phenomenon. As shown in Figure 4, the amount of GI-based cooling likely in a significant area of this highly compact/built-up city is negligible. In these instances, other cooling approaches (including urban form-based shading—[40,41]) will be needed. Better still, the approach to built-form in some parts of the city (compact, high plot coverage, and high-rise) may need to be questioned: should the problem of UHI resulting from such an approach to urban development be created in the first place before attempts to mitigate it with GI is attempted? The present work shows that although GI-based cooling in warm, humid climates is possible, it may not be adequate to tackle ALL of the local warming created by urbanization. An integrated approach that tackles land use/land cover, built-form as well as GI are needed to mitigate the negative consequences of UHI in warm climate cities.
6. Conclusions
The present work shows that a more nuanced approach to green space target setting is needed to manage local warming. While this is likely to be true in many cities, the need for such an approach in rapidly changing, warm, humid cities is urgent, given the pressures on land and the rapidity of urban growth. Besides, the health and wellbeing consequences of urban warming are likely to be at their worst in this region. Such a nuanced approach needs to consider local realities (including land value, need for development, space availability, the practicality of installing large GI and/or presence of buildings, and other shading possibilities) when setting GI targets. We have shown that an LCZ-based approach might be useful in classifying sub-areas of cities into the local climate realities.
One of the significant findings from the present study is that a green intervention approach could substantially cool the Jakarta metropolitan area but the levels of green cover needed to provide substantial cooling may be impractical in certain areas of the city. In a majority of locations, the achievement of the current green cover target would lead to modest improvements (MRT < 3 degrees) in local comfort conditions. This is certainly not negligible but could be enhanced when used in conjunction with other strategies such as the shadow provided by high-rises during daytime. GI target setting should be flexible enough to account for such possibilities.
The following conclusions can be drawn from the present study:
- Given the warm, humid climate, diurnal cooling is necessary in Jakarta, but even a maximal greening approach is insufficient by itself to substantially increase outdoor comfort across the day
- Although the overall cooling provided by green cover is modest, there are some areas of the city that could be made comfortable by the addition of trees. These improvements need to consider local space use patterns and other urban form attributes (such as building shading) to maximize the benefits of cooler outdoor conditions.
While GI has many positive attributes (such as biodiversity enhancement, high aesthetic value, better health, and psycho-social wellbeing) climate-sensitive design of the public realm needs to rely on a variety of solutions, and not just GI. Only comprehensive, site-specific, spatial, and functional analyses can identify the qualitative and quantitative benefits of GI among a slew of other planning and design approaches. A benefit-cost analysis of the extra-ordinary effort needed to increase green cover against only a modest improvement in cooling across significant sections of the city needs to be made.
Supplementary Materials
The following supporting information can be downloaded at: https://www.mdpi.com/article/10.3390/atmos13020184/s1.
Author Contributions
Conceptualization, R.E.; methodology, H.M.N.S. and R.E.; software, H.M.N.S.; validation, H.M.N.S. and R.E.; formal analysis, H.M.N.S. and R.E.; investigation, H.M.N.S.; resources, R.E.; data curation, H.M.N.S.; writing—original draft preparation, H.M.N.S. and R.E.; writing—review and editing, H.M.N.S. and R.E.; visualization, H.M.N.S.; supervision, R.E.; project administration, R.E.; funding acquisition, R.E. All authors have read and agreed to the published version of the manuscript.
Funding
Support for the research underpinning this paper was provided by the European Education and Culture Executive Agency (EACEA) under the Erasmus Mundus Joint Master Degree program, Master of Urban Climate and Sustainability (www.murcs.eu, accessed on 23 January 2022), Grant Agreement: 2017-1926.
Institutional Review Board Statement
Not Applicable.
Informed Consent Statement
Not Applicable.
Data Availability Statement
Not Applicable.
Conflicts of Interest
The authors declare no conflict of interest. The funders had no role in the design of the study; in the collection, analyses, or interpretation of data; in the writing of the manuscript, or in the decision to publish the results.
References
- Hajat, S.; Kosatky, T. Heat-related mortality: A review and exploration of heterogeneity. J. Epidemiol. Community Health 2010, 64, 753–760. [Google Scholar] [CrossRef] [PubMed]
- Johansson, E.; Emmanuel, R. The influence of urban design on the outdoor thermal comfort in the hot, humid city of Colombo, Sri Lanka. Int. J. Biometeorol. 2006, 51, 119–133. [Google Scholar] [CrossRef] [PubMed]
- Lu, S.-L.; Emmanuel, R.; Perera, N.; Ratnayake, R.; Grimmond, S.; Luo, Z.; Omidvar, H.; Sun, T. Reduction of overheating in Sri Lanka: An action research imperative? ARCOM 2020, 36, 243–252. [Google Scholar]
- Bowler, D.E.; Buyung-Ali, L.; Knight, T.M.; Pullin, A.S. Urban greening to cool towns and cities: A systematic review of the empirical evidence. Landsc. Urban Plan. 2010, 97, 147–155. [Google Scholar] [CrossRef]
- Adams, M.P.; Smith, P.L. A systematic approach to model the influence of the type and density of vegetation cover on urban heat using remote sensing. Landsc. Urban Plan. 2014, 132, 47–55. [Google Scholar] [CrossRef]
- Emmanuel, R. An Urban Approach to Climate Sensitive Design: Strategies for the Tropics, 1st ed.; Taylor & Francis: Abingdon, UK, 2005. [Google Scholar]
- Ong, B.L. Green plot ratio: An ecological measure for architecture and urban planning. Landsc. Urban Plan. 2003, 63, 197–211. [Google Scholar] [CrossRef]
- Wong, N.H.; Jusuf, S.K.; Syafii, N.I.; Chen, Y.; Hajadi, N.; Sathyanarayanan, H.; Manickavasagam, Y.V. Evaluation of the impact of the surrounding urban morphology on building energy consumption. Sol. Energy 2011, 85, 57–71. [Google Scholar] [CrossRef]
- Monteiro, M.V.; Doick, K.J.; Handley, P.; Peace, A. The impact of greenspace size on the extent of local nocturnal air temperature cooling in London. Urban For. Urban Green. 2016, 16, 160–169. [Google Scholar] [CrossRef]
- Maimaitiyiming, M.; Ghulam, A.; Tiyip, T.; Pla, F.; Latorre-Carmona, P.; Halik, U.; Caetano, M. Effects of green space spatial pattern on land surface temperature: Implications for sustainable urban planning and climate change adaptation. ISPRS J. Photogramm. Remote Sens. 2014, 89, 59–66. [Google Scholar] [CrossRef] [Green Version]
- Zhou, W.; Huang, G.; Cadenasso, M.L. Does spatial configuration matter? Understanding the effects of land cover pattern on land surface temperature in urban landscapes. Landsc. Urban Plan. 2011, 102, 54–63. [Google Scholar] [CrossRef]
- Nastran, M.; Kobal, M.; Eler, K. Urban heat islands in relation to green land use in European cities. Urban For. Urban Green. 2019, 37, 33–41. [Google Scholar] [CrossRef] [Green Version]
- Basnou, C. Ecosystem services provided by green infrastructure in the urban environment. CAB Rev. Perspect. Agric. Vet. Sci. Nutr. Nat. Resour. 2015, 10, 1–11. [Google Scholar] [CrossRef] [Green Version]
- Markevych, I.; Schoierer, J.; Hartig, T.; Chudnovsky, A.; Hystad, P.; Dzhambov, A.M.; de Vries, S.; Triguero-Mas, M.; Brauer, M.; Nieuwenhuijsen, M.J.; et al. Exploring pathways linking greenspace to health: Theoretical and methodological guidance. Environ. Res. 2017, 158, 301–317. [Google Scholar] [CrossRef] [PubMed]
- Nazarian, N.; Acero, J.A.; Norford, L. Outdoor thermal comfort autonomy: Performance metrics for climate-conscious urban design. Build. Environ. 2019, 155, 145–160. [Google Scholar] [CrossRef]
- Farrugia, S.; Hudson, M.D.; McCulloch, L. An evaluation of flood control and urban cooling ecosystem services delivered by urban green infrastructure. Int. J. Biodivers. Sci. Ecosyst. Serv. Manag. 2013, 9, 136–145. [Google Scholar] [CrossRef]
- Kruuse, A. GRaBS Expert Paper 6: The Green Space Factor and the Green Points System. London—The GRaBS Project. London, Town and Country Planning Association and GRaBS. 2011. Available online: https://www.tcpa.org.uk/Handlers/Download.ashx?IDMF=c6ecd8bc-a066-435f-80d6-d58e47ab39a7 (accessed on 23 January 2022).
- Vartholomaios, A.; Kalogirou, N.; Athanassiou, E.; Papadopoulou, M. The green space factor as a tool for regulating the urban microclimate in vegetation-deprived Greek cities. In Proceedings of the International Conference on “Changing Cities”: Spatial, Morphological, Formal & Socio-Economic Dimensions, Skiathos, Greece, 18–21 June 2013. [Google Scholar] [CrossRef]
- Keeley, M. The Green Area Ratio: An urban site sustainability metric. J. Environ. Plan. Manag. 2011, 54, 937–958. [Google Scholar] [CrossRef]
- Estoque, R.C.; Murayama, Y.; Myint, S.W. Effects of landscape composition and pattern on land surface temperature: An urban heat island study in the megacities of Southeast Asia. Sci. Total Environ. 2017, 577, 349–359. [Google Scholar] [CrossRef]
- Kusuma, W.L.; Chih-Da, W.; Yu-Ting, Z.; Hapsari, H.H.; Muhamad, J.L. PM2.5 Pollutant in Asia—A Comparison of Metropolis Cities in Indonesia and Taiwan. Int. J. Environ. Res. Public Health 2019, 16, 4924. [Google Scholar] [CrossRef] [Green Version]
- WHO. World Health Organisation. Urban Green Spaces and Health—A Review of Evidence. 2016. Available online: http://www.euro.who.int/__data/assets/pdf_file/0005/321971/Urban-green-spaces-and-health-review-evidence.pdf (accessed on 18 February 2020).
- Werner, C. Green Open Spaces in Indonesian Cities: Schisms between Law and Practice. Pac. Geogrphies 2014, 41, 26–31. Available online: http://www.pacific-geographies.org/wp-content/uploads/sites/2/2017/06/PG41_werner.pdf (accessed on 23 January 2022).
- Masoudi, M.; Tan, P.Y.; Liew, S.C. Multi-city comparison of the relationships between spatial pattern and cooling effect of urban green spaces in four major Asian cities. Ecol. Indic. 2019, 98, 200–213. [Google Scholar] [CrossRef]
- Geletič, J.; Lehnert, M.; Krč, P.; Resler, J.; Krayenhoff, E.S. High-Resolution Modelling of Thermal Exposure during a Hot Spell: A Case Study Using PALM-4U in Prague, Czech Republic. Atmosphere 2021, 12, 175. [Google Scholar] [CrossRef]
- Huang, P.-S.; Tsai, S.-M.; Lin, H.-C.; Tso, I.-M. Do Biotope Area Factor values reflect ecological effectiveness of urban landscapes? A case study on university campuses in central Taiwan. Landsc. Urban Plan. 2015, 143, 143–149. [Google Scholar] [CrossRef]
- Ching, J.; Mills, G.; Bechtel, B.; See, L.; Feddema, J.; Wang, X.; Ren, C.; Brousse, O.; Martilli, A.; Neophytou, M.; et al. WUDAPT: An Urban Weather, Climate, and Environmental Modeling Infrastructure for the Anthropocene. Bull. Am. Met. Soc. 2018, 99, 1907–1924. [Google Scholar] [CrossRef] [Green Version]
- Stewart, I.; Oke, T. Local climate zones for urban temperature studies. Bull. Am. Meteorological Soc. 2012, 93, 1879–1900. [Google Scholar] [CrossRef]
- Lam, C.K.C.; Lee, H.; Yang, S.-R.; Park, S. A review on the significance and perspective of the numerical simulations of outdoor thermal environment. Sustain. Cities Soc. 2021, 71, 102971. [Google Scholar] [CrossRef]
- Emmanuel, R.; Fernando, H.L.S. Urban heat islands in humid and arid climates: Role of urban form and thermal properties in Colombo, Sri Lanka and Phoenix, USA. Clim. Res. 2007, 34, 241–251. [Google Scholar] [CrossRef] [Green Version]
- Fahmy, M.; El-Hady, H.; Mahdy, M. LAI and Albedo measurements based methodology for numerical simulation of urban tree’s microclimate: A case study in Egypt. Int. J. Sci. Eng. Res. 2013, 7, 790–797. [Google Scholar]
- Gatto, E.; Buccolieri, R.; Aarrevaara, E.; Ippolito, F.; Emmanuel, R.; Perronace, L.; Santiago, J.L. Impact of Urban vegetation on outdoor thermal comfort: Comparison between a Mediterranean city (Lecce, Italy) and a northern European city (Lahti, Finland). Forests 2020, 11, 228. [Google Scholar] [CrossRef] [Green Version]
- Morakinyo, T.E.; Ouyang, W.; Lau, K.K.; Ren, C.; Ng, E. Right tree, right place (urban canyon): Tree species selection approach for optimum urban heat mitigation—Development and evaluation. Sci. Total Environ. 2020, 719, 137461. [Google Scholar] [CrossRef]
- Ouyang, W.; Morakinyo, T.E.; Ren, C.; Ng, E. The cooling efficiency of variable greenery coverage ratios in different urban densities: A study in a subtropical climate. Build. Environ. 2020, 174, 13. [Google Scholar] [CrossRef]
- Shinzato, P.; Simon, H.; Silva Duarte, D.H.; Bruse, M. Calibration process and parametrization of tropical plants using ENVI-met V4–Sao Paulo case study. Architect. Sci. Rev. 2019, 62, 112–125. [Google Scholar] [CrossRef]
- Acero, J.A.; Arrizabalaga, J. Evaluating the performance of ENVI-met model in diurnal cycles for different meteorological conditions. Theor. Appl. Climatol. 2018, 131, 455–469. [Google Scholar] [CrossRef]
- Salata, F.; Golasi, I.; de Lieto Vollaro, R.; de Lieto Vollaro, A. Urban microclimate and outdoor thermal comfort. A proper procedure to fit ENVI-met simulation outputs to experimental data. Sustain. Cities Soc. 2016, 26, 318–343. [Google Scholar] [CrossRef]
- Masoudi, M.; Tan, P.Y.; Fadaei, M. The effects of land use on spatial pattern of urban green spaces and their cooling ability. Urban Clim. 2021, 35, 100743. [Google Scholar] [CrossRef]
- Haaland, C.; van den Bosch, C.K. Challenges and strategies for urban green-space planning in cities undergoing densification: A review. Urban For. Urban Green. 2015, 14, 760–771. [Google Scholar] [CrossRef]
- Makaremi, N.; Salleh, E.; Jaafar, M.Z.; GhaffarianHoseini, A. Thermal comfort conditions of shaded outdoor spaces in hot and humid climate of Malaysia. Build. Environ. 2012, 48, 7–14. [Google Scholar] [CrossRef]
- Mazhar, M.; Brown, R.D.; Kenny, N.; Lenzholzer, S. Thermal comfort of outdoor spaces in Lahore, Pakistan: Lessons for bioclimatic urban design in the context of global climate change. Landsc. Urban Plan. 2015, 138, 110–117. [Google Scholar] [CrossRef]


Publisher’s Note: MDPI stays neutral with regard to jurisdictional claims in published maps and institutional affiliations. |
© 2022 by the authors. Licensee MDPI, Basel, Switzerland. This article is an open access article distributed under the terms and conditions of the Creative Commons Attribution (CC BY) license (https://creativecommons.org/licenses/by/4.0/).