1. Introduction
In the field of studying traveling ionospheric disturbances (TIDs) based on total electron content data obtained using GNSS receivers (GPS TEC), the method of constructing hodochrones has proved to be the most successful [
1,
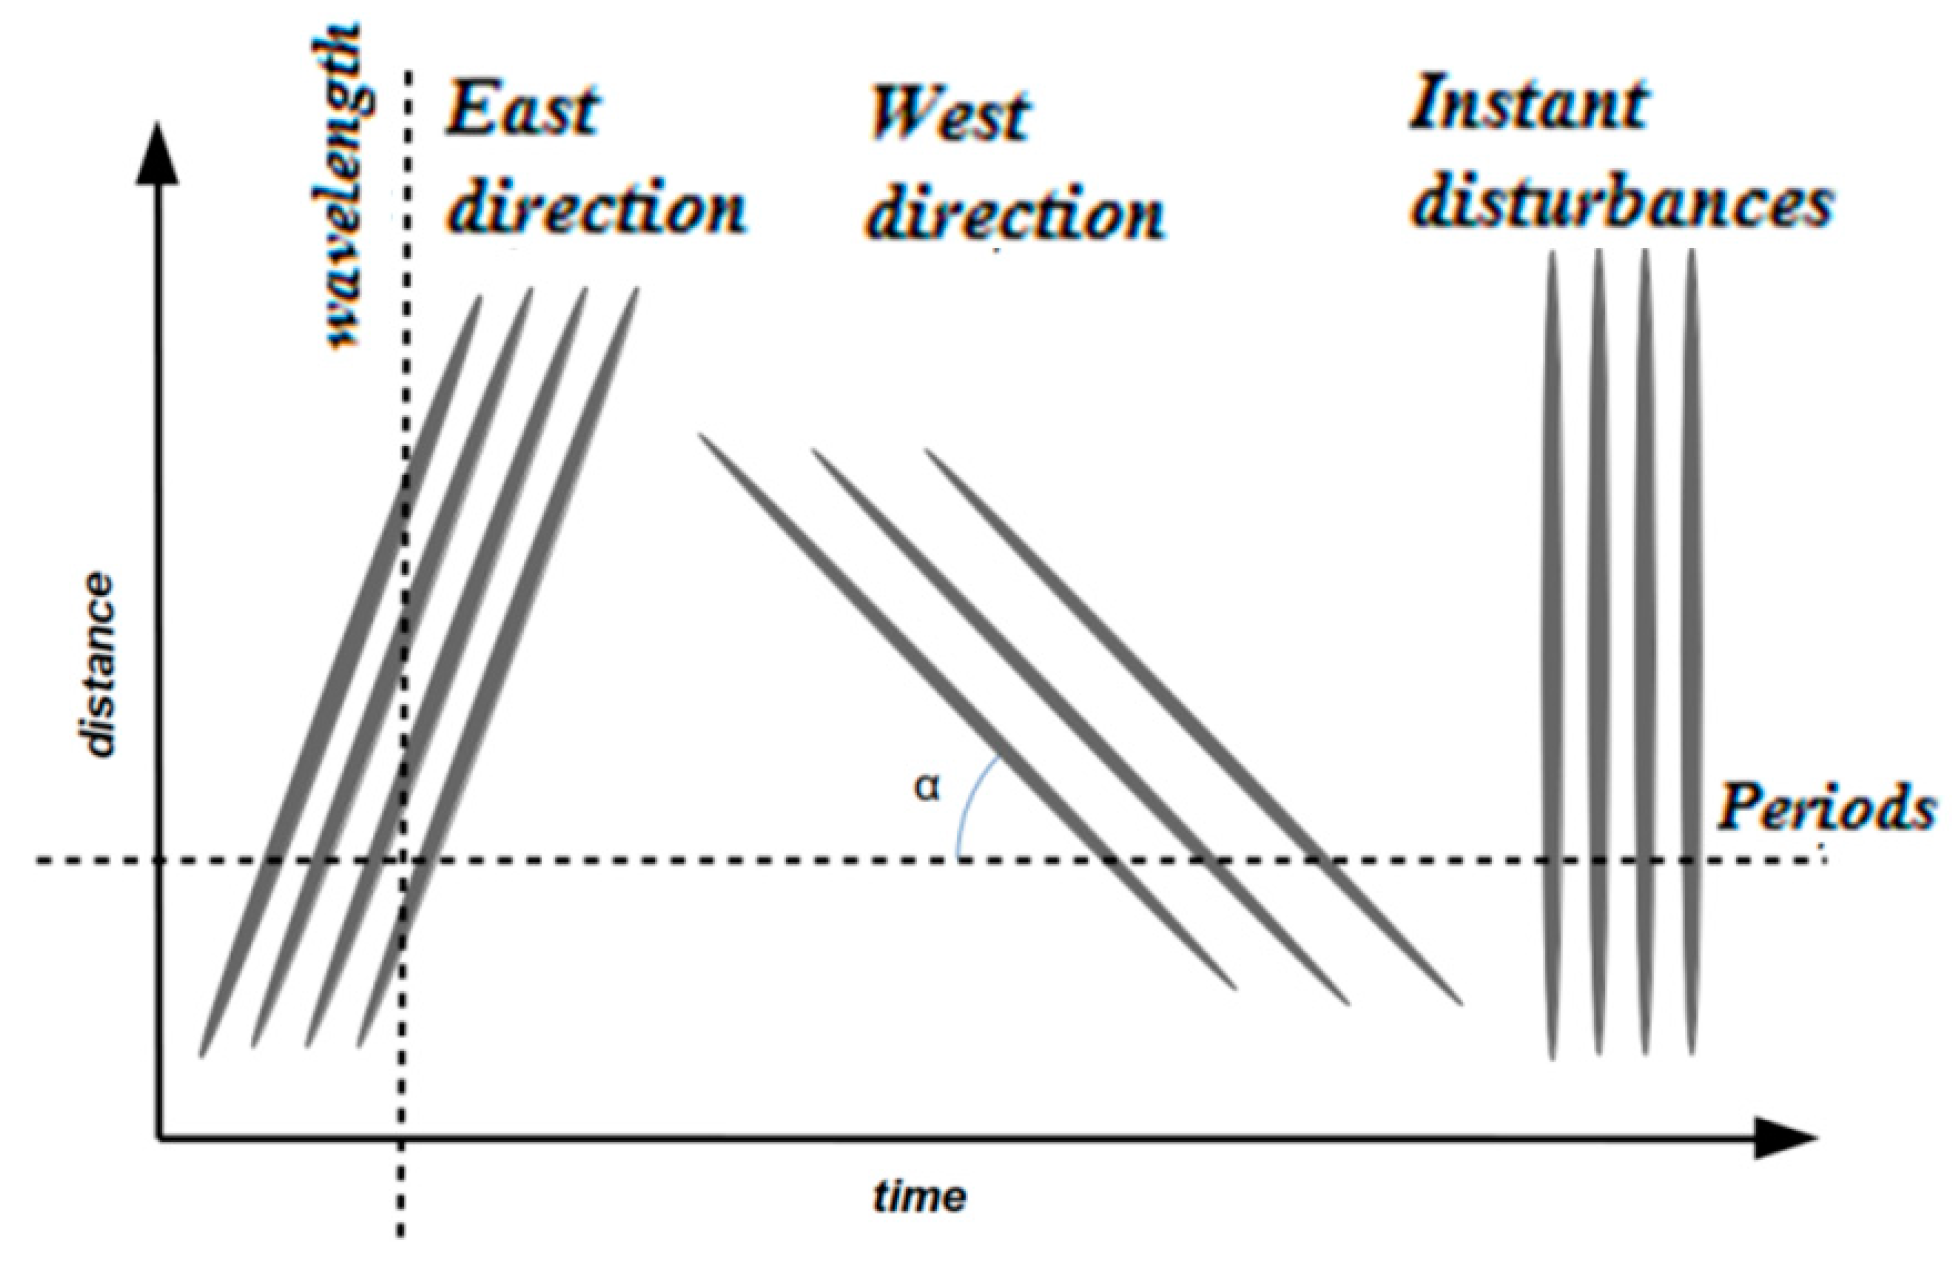
2]. The essence of this method is to construct three-dimensional diagrams, in which time is plotted along the
x-axis, distance is plotted along the
y-axis, and the color value corresponds to variations in the total electron content (TEC) after filtering low frequencies. In this case, the “distance” coordinate corresponds to either the radial distance from the central source of disturbances (for example, the epicenter of an earthquake), or the distance along a certain direction in the case of a plane wavefront. In this case, wave disturbances from a common source form a coherent wave pattern (
Figure 1).
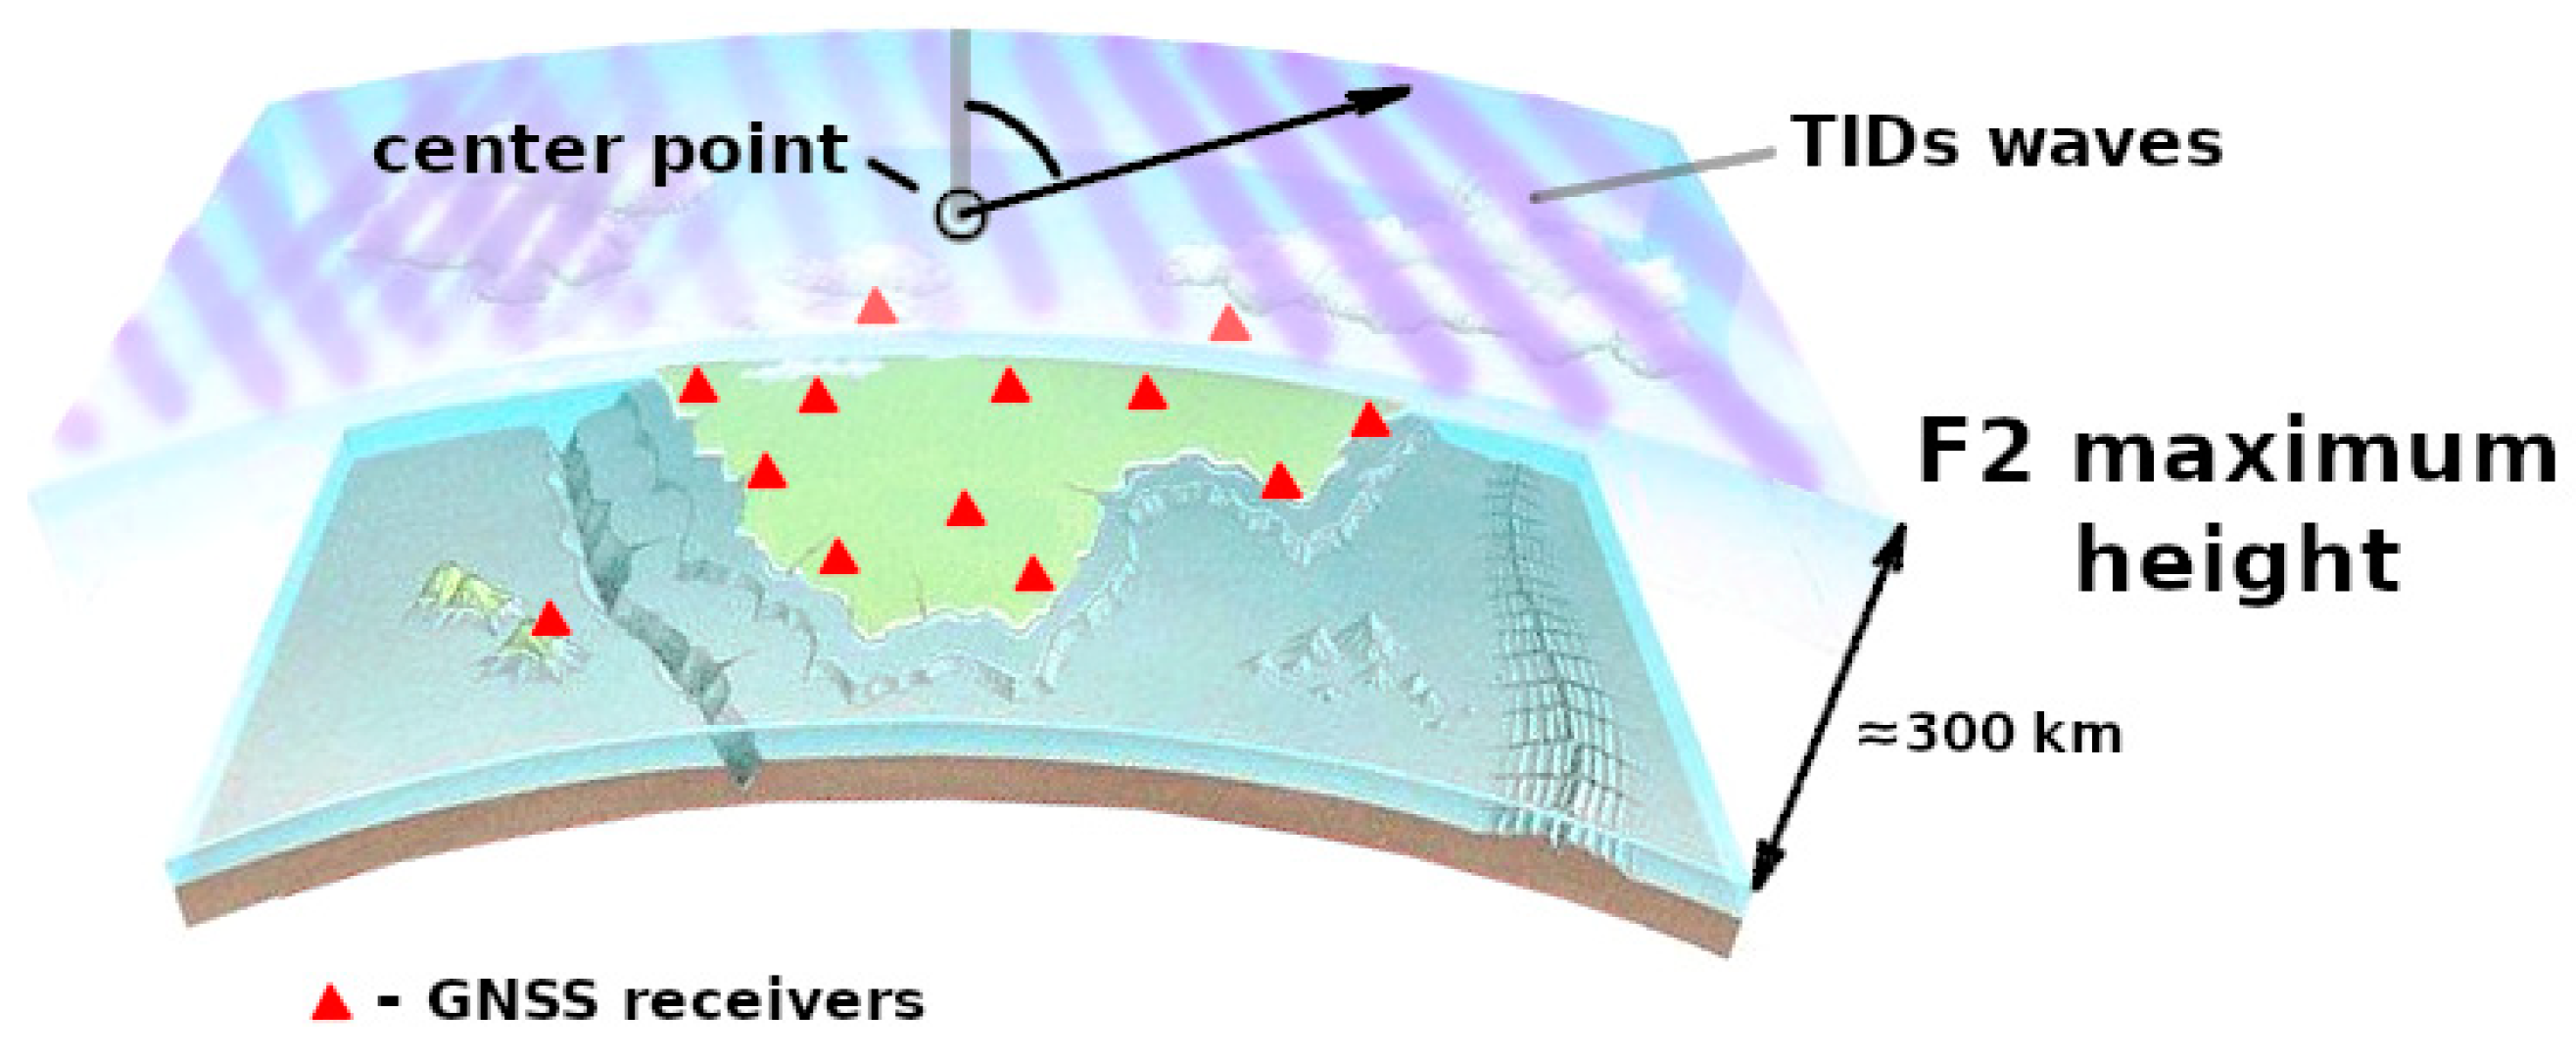
In this paper, we consider the cases of the plane-parallel propagation of waves having a quasi-linear shape of the wave maxima on the local area of the surface of the ionospheric maximum (
Figure 2).
However, despite their clarity, hodochrones are a set of images and are not very suitable for automating their analysis.
As of today, more than 8000 publicly available permanent GNSS receivers and more than a hundred navigation satellites are available in the world for the study of the ionosphere by the method called GPS TEC. Working with such a large amount of data requires the development of methods and tools to automate the data analysis process.
2. Materials and Methods
An important feature of the use of hodochrones in relation to GNSS sounding of the ionosphere is that they allow one to obtain the true values of the characteristics of TID waves—their period, wavelength, and velocity [
3]. This is due to the fact that the ionospheric points at which the TEC is measured move in the horizontal plane during the orbital motion of the satellites and the rotation of the Earth. With such a movement of points, the speed of which is on the order of hundreds of kilometers per hour, due to the Doppler effect, the values of the frequency of wave disturbances in the time series for various stations and satellites are distorted. Hodochrones make it possible to measure the true values of the frequency (period), wavelength, and velocity of the TEC [
4,
5]. The horizontal slice of the hodochrone gives a time sweep of the TEC variations, the vertical cut gives a spatial distribution of the TEC variations, and the TID propagation velocity is equal to the slope angle α of the coherent lines of the TEC variations’ maxima (
Figure 1).
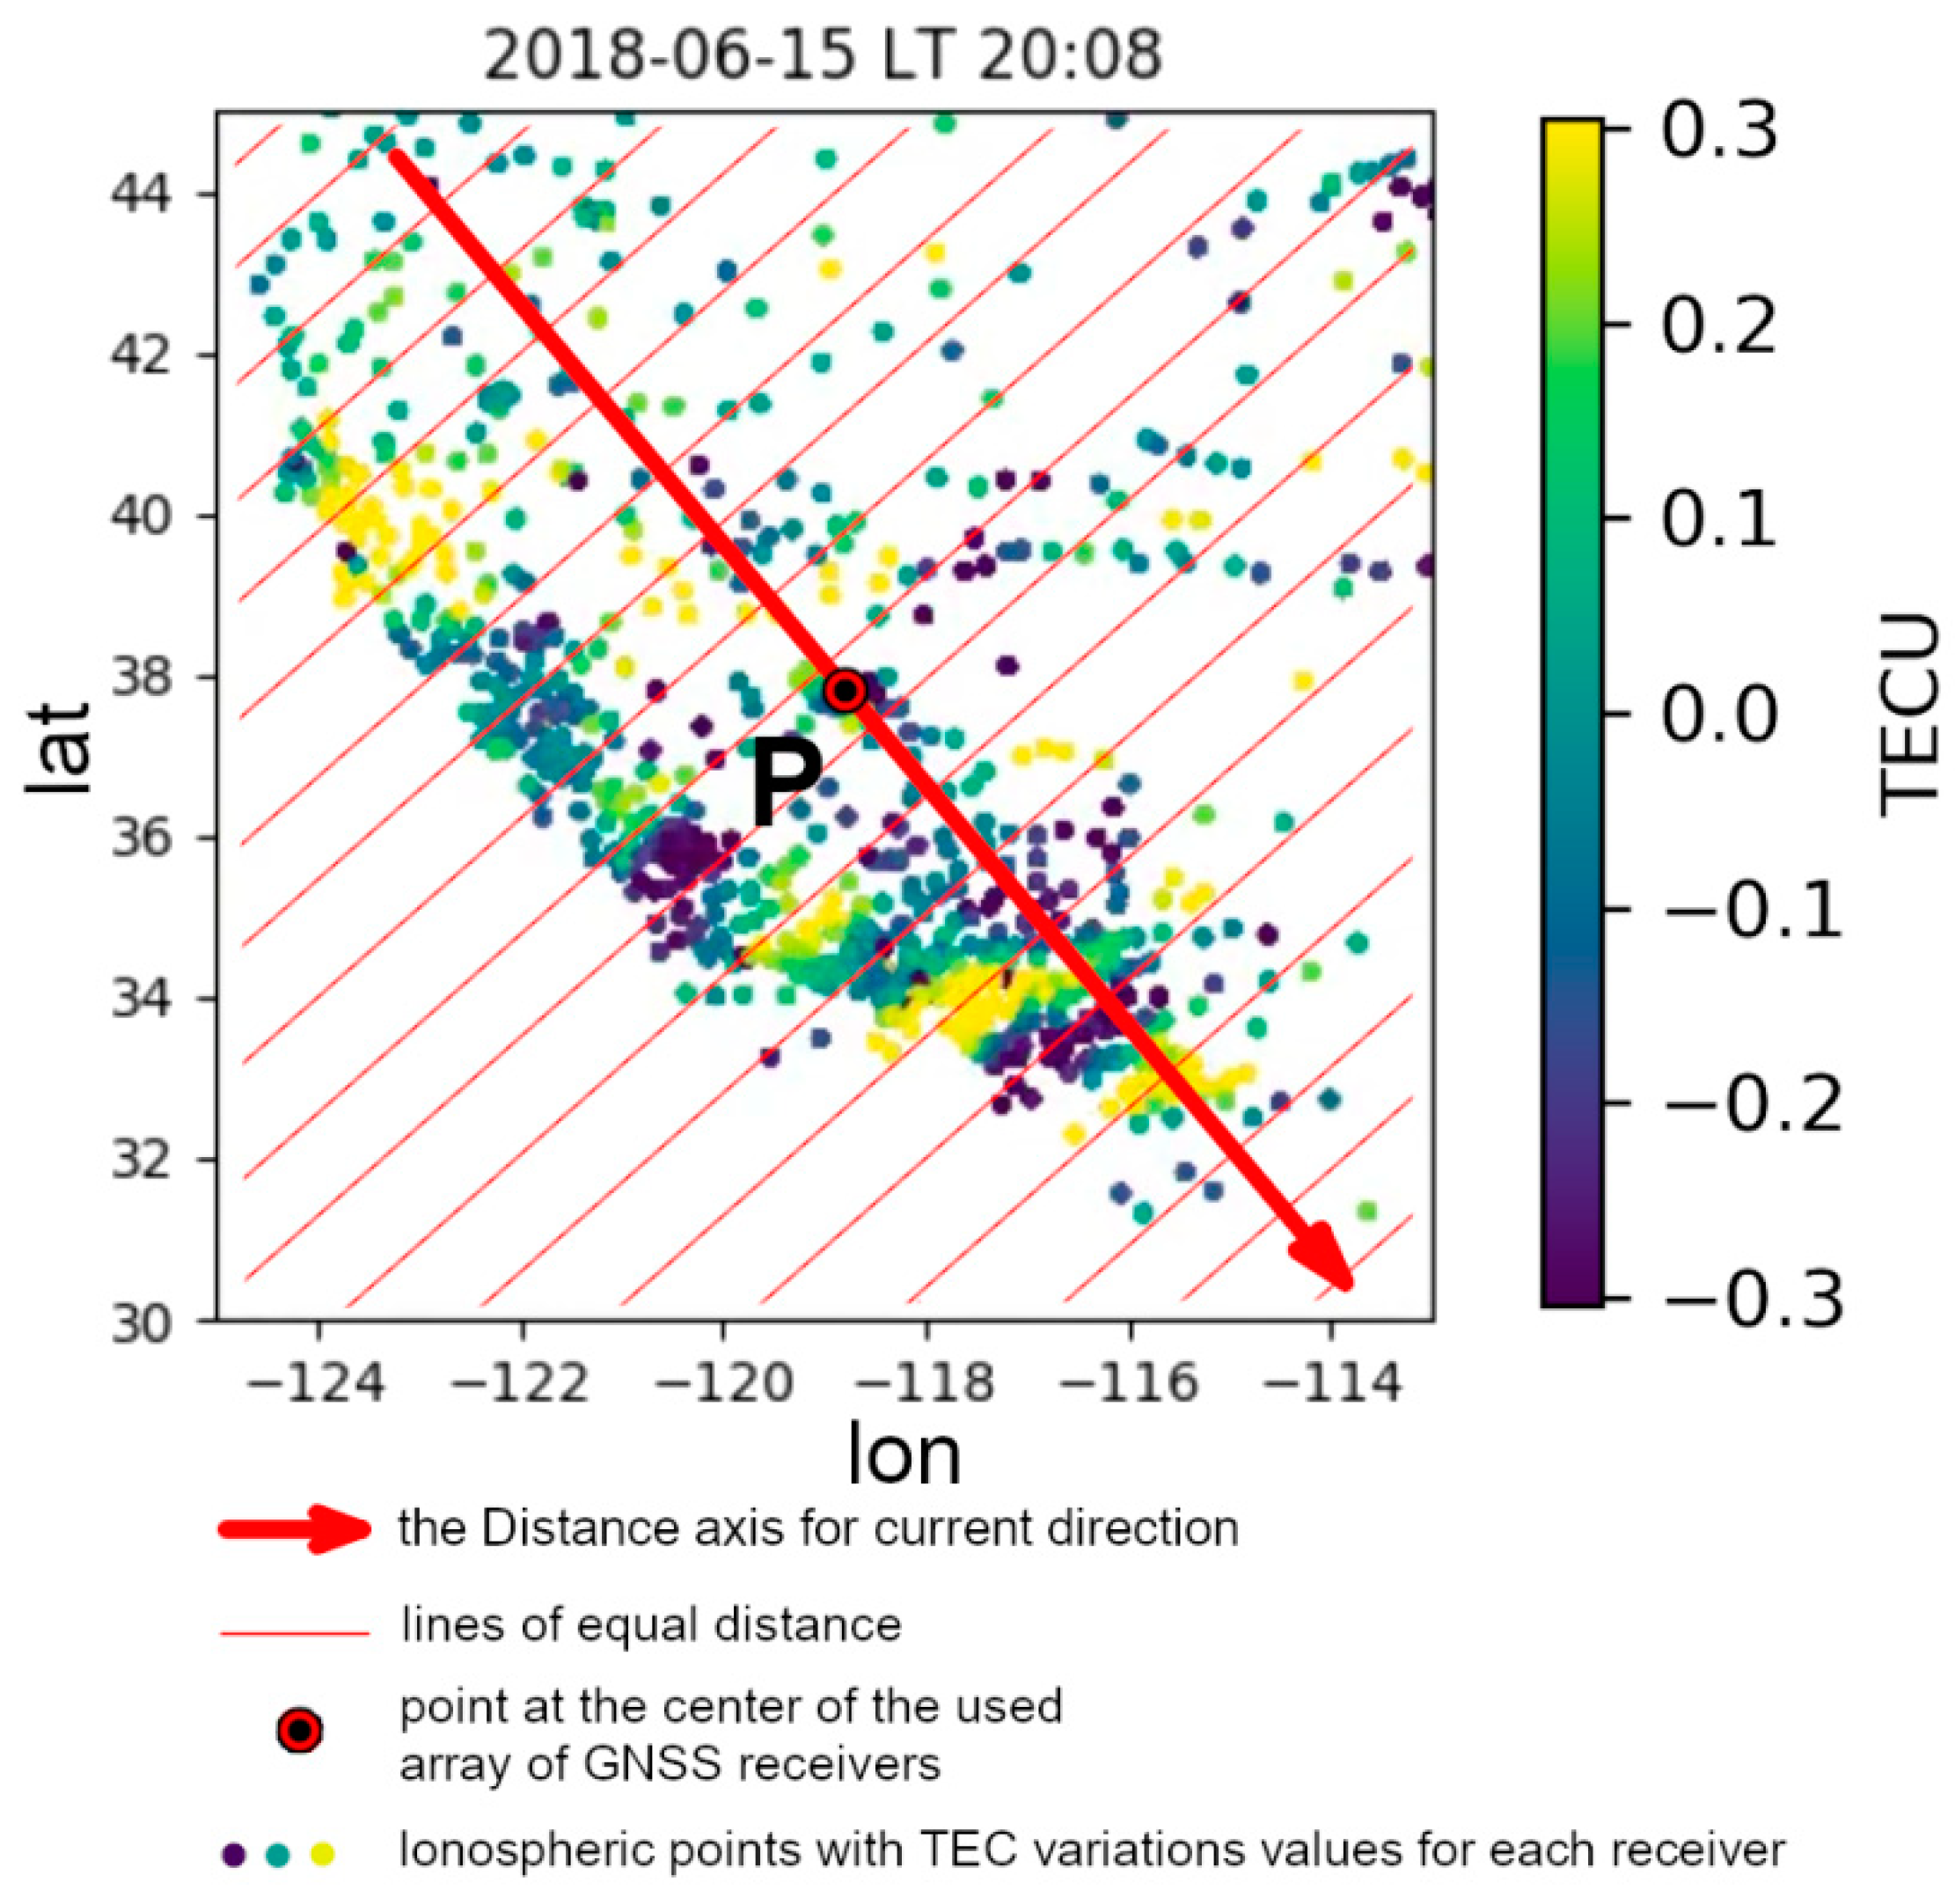
To identify TIDs, the source and, consequently, the direction of propagation of which are unknown, a modified method is proposed for plotting hodochrones of TEC variations and detecting TIDs. The essence of the method consists of constructing hodochrones, in which the distance axis is plotted along a straight line passing through a conditional point with a given azimuthal direction (
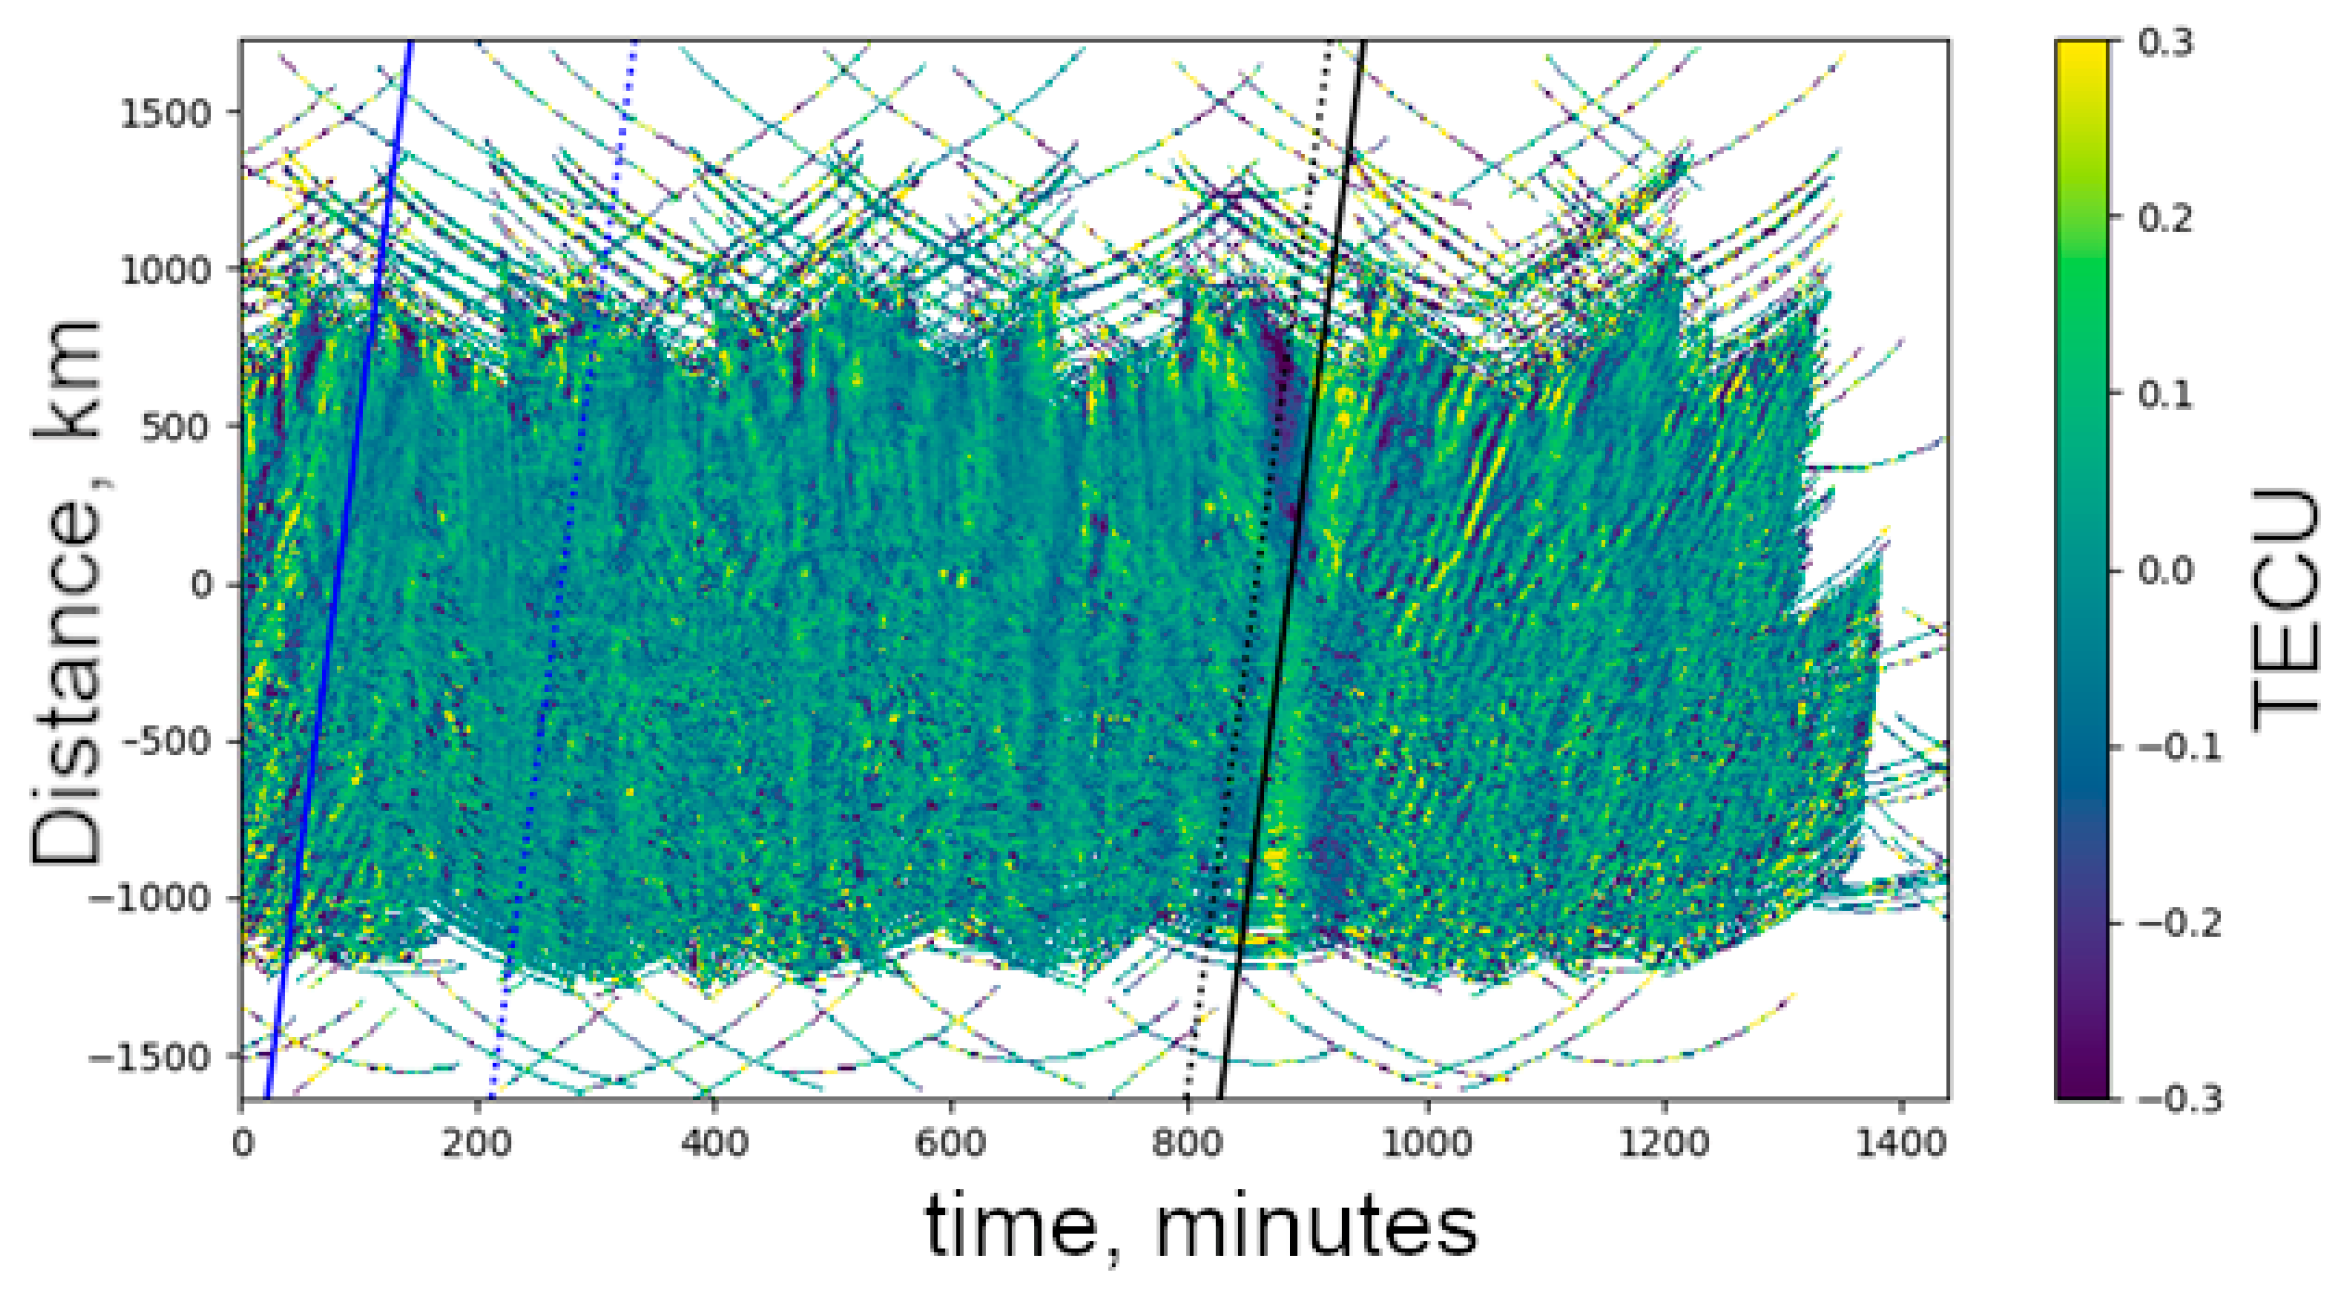
Figure 3). The conditional point is placed at an altitude of 300 km (the height of the maximum electron content of the F2 layer of the ionosphere, for which the TEC is calculated) in the center of the used GNSS array. Thus, for example, one day of processed data represent a set of hodochrones for different azimuths of the direction of propagation of TIDs. One such hodochrone plotted for the specific azimuth 105° is shown in
Figure 4. This figure has been plotted on the data of about 1300 GPS receivers located at the west coast of the US.
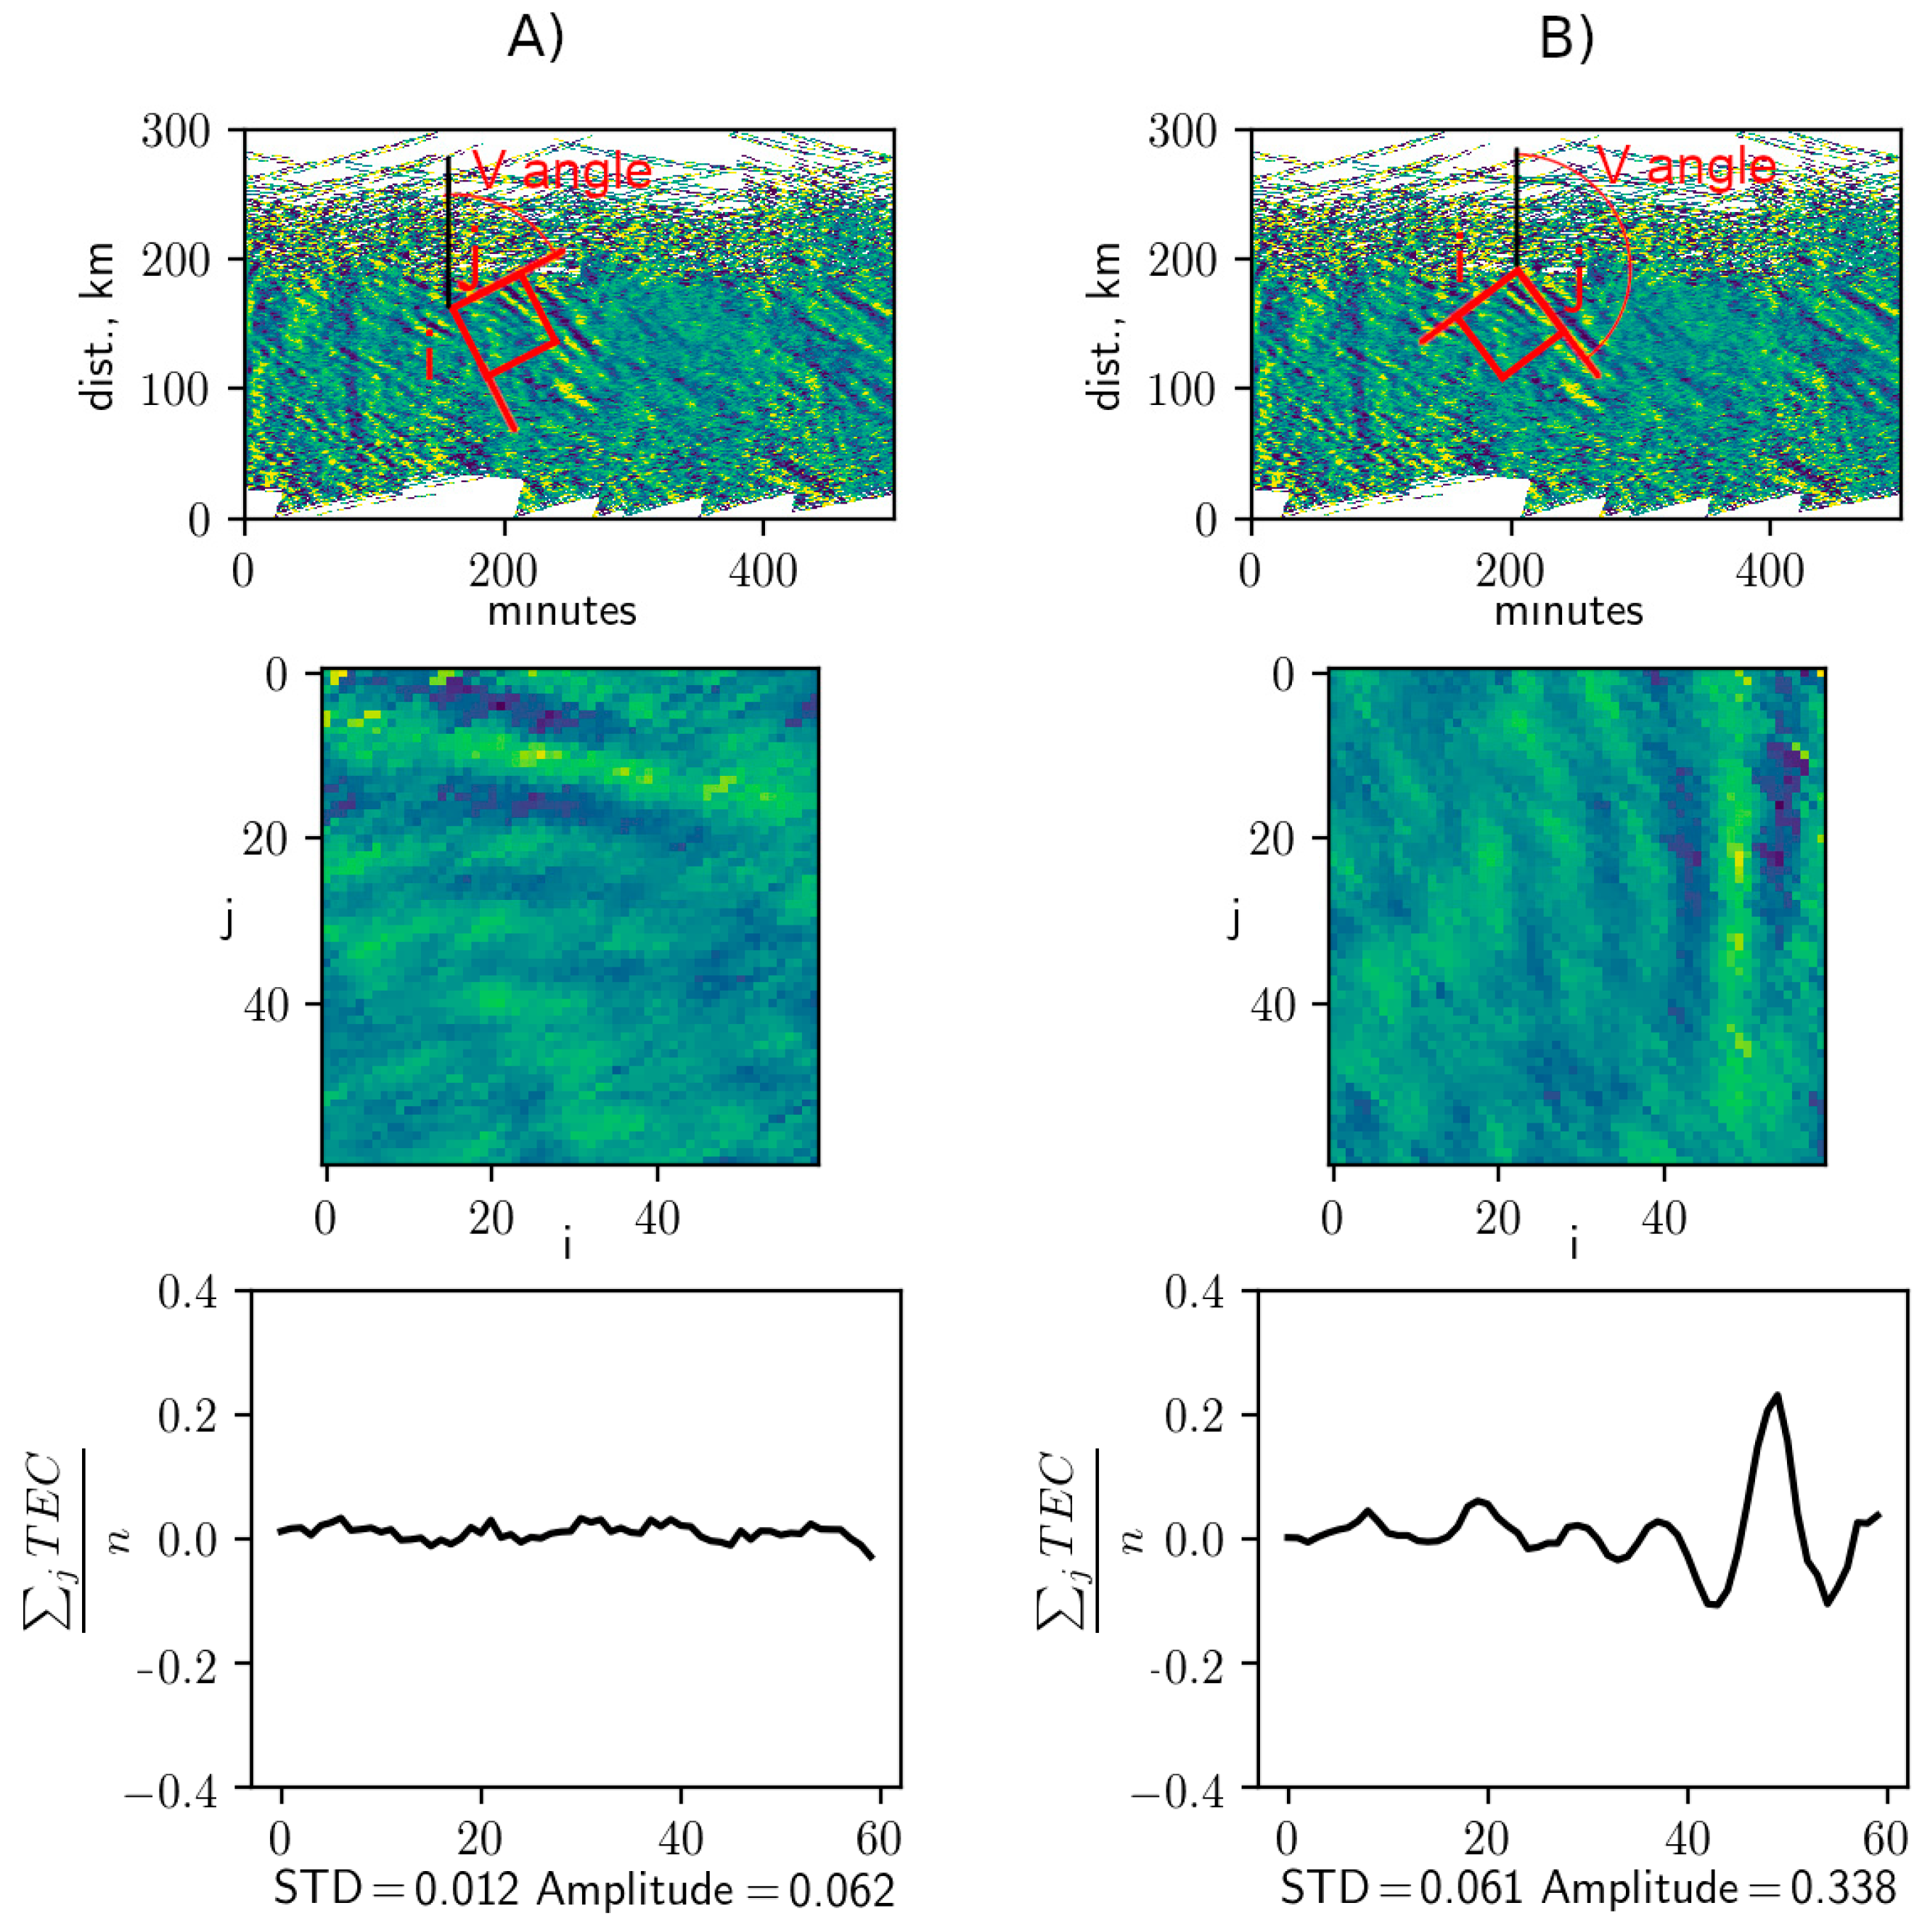
To automate the process of recognizing the wave pattern at hodochrones, it is proposed to use the value of the signal-to-noise ratio as a function of the time (t) and distance (d) coordinates
SNR(t, d), calculated in the vicinity of the point (t, d). The method for calculating the signal-to-noise ratio is as follows. For each point (t, d) on the plots of the hodochrone, a square area of values of size n, centered at point (t, d), is distinguished. This area is oriented along different angles
V in the range of 0–180 degrees, corresponding to all possible propagation velocities of disturbances. The values of TEC variations in this area take on new vertical and horizontal indices
i and
j, respectively.
Figure 5 shows the highlighted areas for two different angles
V. The signal level
is calculated as the sum of the squares of the mean values along the vertical
j index for each angle
V, and the noise level
N is calculated as the average of the signal power values for all angles
V:
Thus, the angle V at which has a maximum value corresponds to the propagation velocity of disturbances at time t, in the direction Az, at a distance d, and the value characterizes the power of the disturbance.
Thus, the set of hodochrones for all directions is converted into two-dimensional maps of the signal value depending on a pair of any of the coordinates: velocity, direction of propagation, and observation time. The novelty of the proposed method lies in the application of signal analysis methods to two-dimensional images of hodochrones.
3. Software
To implement the proposed method for recognizing the structure of wave disturbances, a software system for collecting, processing, and analyzing GNSS data has been developed. The functionality of the developed system allows the following tasks to be performed:
- (1)
Collection and display of information on the availability of data from various networks of GNSS stations on the internet;
- (2)
Downloading observational and navigation RINEX-files for selected stations or for stations located in the specified area for the selected period;
- (3)
Processing RINEX files, calculating satellite coordinates, calculating DCB corrections (differential code delays), and calculating TEC;
- (4)
Storage of TEC data and station data (station characteristics, coordinates, and DCB) in a local database;
- (5)
Data visualization: building hodochrones, calculating the level of the TID signal and its wave characteristics (direction of propagation, speed, period, and wavelength).
All software is implemented in Python and Fortran languages. Fortran is used in separate resource-intensive modules responsible for processing RINEX files, calculating DCB corrections, filtering data, and calculating the signal-to-noise ratio and wave parameters. These modules are compiled using the f2py interface into modules of the Python language. This approach allows the use of the extensive capabilities of the Python language for loading, visualizing, and manipulating data (data manipulation and fetching is carried out using the Pandas library), as well as the ability to use the Python interpreter directly as a working environment for researching and analysis of ionospheric disturbances. Storage of the calculated TEC time series, satellite coordinates and ionospheric points, DCB corrections, and station data is carried out in the PostgreSQL database, which provides quick access to the TEC data. The developed system is designed to work with various operating systems, that is, it is cross-platform. In addition, the system has a client–server architecture—the database and file storage are located on the server computer, while data management and analysis are performed on the client computers.
The obtained results of data processing during the passage of the solar terminator correspond to the existing theoretical and experimental studies of ionospheric disturbances [
6,
7]. The time interval of appearance of the detected TIDs associated with the solar terminator corresponds to the earlier obtained results: in the daytime in the winter months, and at night in the summer months.
The correct operation of the developed software system lies in the correct operation of its individual constituent modules. The correctness of modules responsible for the TEC calculation and the construction of the hodochrones were demonstrated in the works [
8,
9]. The components responsible for calculating the level of the TID signal and its wave characteristics are still under development and require further testing.
4. Results
The developed software system for monitoring TIDs based on GNSS data is at the testing stage, but it is already being used to detect regular disturbances of the ionosphere generated by the passage of the solar terminator, as well as sporadic disturbances generated by earthquakes and solar activity. A method is proposed for determining the signal level and characteristics of ionospheric wave disturbances for GNSS data.
5. Discussion
The novelty of the proposed method lies in the application of signal analysis methods to two-dimensional images of hodochrones. The ability to process a large amount of TEC data in automatic mode, in order to study the influence of various sources on ionospheric disturbances, is also a new result. We expect that in the future, this method will allow the collection of more statistics on the properties of TIDs in different time periods and for different states of the solar and geomagnetic environment, instead of manually considering individual events.
The limitations of the proposed method are due to the assumptions made about the structure of the ionosphere and the structure of ionospheric wave disturbances. This method is based on the assumption that the disturbance of the ionosphere propagates in a thin layer at the altitude of the ionization maximum of the F2 layer, and the vertical structure of wave disturbances is not taken into account. As our previous study showed [
6], TEC data have a strong dependence on the spatial orientation of the direction to the satellite, and the next step will be to include this dependence in the proposed methodology. In addition, the described method is designed to detect wave disturbances propagating in a plane wavefront in certain local areas. As a consequence, the proposed method does not work for perturbations of concentric and other, more complex propagation geometries. Taking into account the concentric geometry of wave propagation, this method can be improved in the future for detecting disturbances from point sources.
6. Conclusions
We proposed a method for the automated detection of the signal of shortwave disturbances in the ionosphere from the data of the total electron content. This method allows the detection of TIDs propagating in the form of a plane wavefront (for example, generated by a solar terminator), as well as determining wave parameters such as wavelength, period, and direction of propagation. The proposed method was implemented in the developed software system designed to process a large amount of GNSS TEC data.
Author Contributions
Conceptualization, A.A. and S.M.; methodology, V.S.; software, A.A. and V.K.; validation, S.M. and A.A.; formal analysis, S.M.; investigation, A.A. and S.M.; resources, S.M.; data curation, A.A. and V.K.; writing—original draft preparation, A.A., V.S. and S.M.; writing—review and editing, A.A., V.S. and S.M.; visualization, A.A.; supervision, S.M.; project administration, S.M.; funding acquisition, S.M. All authors have read and agreed to the published version of the manuscript.
Funding
This study was funded by the Science Committee of the Ministry of Education and Science of the Republic of Kazakhstan, grant project AP09259554.
Institutional Review Board Statement
Not applicable.
Informed Consent Statement
Not applicable.
Data Availability Statement
Conflicts of Interest
The authors declare no conflict of interest.
References
- Yasyukevich, Y.V.; Edemskiy, I.K.; Perevalova, N.P.; Polyakova, A.S. Ionospheric Response to Helio—And Geophysical Disturbing Factors According to GPS Data; Publishing House of ISU: Irkutsk, Russia, 2013. [Google Scholar]
- Astafyeva, E. Ionospheric detection of natural hazards. Rev. Geophys. 2019, 57, 1265–1288. [Google Scholar] [CrossRef]
- Savastano, G. New Applications and Challenges of GNSS Variometric Approach. Ph.D. Thesis, The University of Rome La Sapienza, Rome, Italy, 2018. Available online: https://core.ac.uk/download/pdf/153369083.pdf (accessed on 21 January 2022).
- Nishioka, M.; Tsugawa, T.; Kubota, M.; Ishii, M. Concentric waves and short-period oscillations observed in the ionosphere after the 2013 Moore EF5 tornado. Geophys. Res. Lett. 2013, 40, 5581–5586. [Google Scholar] [CrossRef]
- Inchin, P.A. Atmospheric and Ionospheric Responses to Acoustic and Gravity Waves Driven by Earthquakes and Tsunamis. Ph.D. Thesis, Embry-Riddle Aeronautical University, Daytona Beach, FL, USA, 2020. [Google Scholar]
- Olusegun, J.; Coster, A.; Zhang, S.-R.; Goncharenko, L.; Erickson, P.; de Paula, E.; Kherani, E. TID Observations and Source Analysis During the 2017 Memorial Day Weekend Geomagnetic Storm Over North America. J. Geophys. Res. Space Phys. 2018, 123, 8749–8765. [Google Scholar] [CrossRef]
- Somsikov, V.M. Solar Terminator and Dynamic Phenomena in the Atmosphere: A Review. Geomagn. Aeronomiya. 2011, 51, 707–719. [Google Scholar] [CrossRef]
- Andreyev, A.B. Dependence of the characteristics of the TEC signal on the angle of inclination of the sounding trajectory. J. Probl. Evol. Open Syst. 2017, 1, 93–96. [Google Scholar]
- Andreyev, A.B.; Kapytin, V.I. Method for detecting ionospheric disturbances from various sources based on GPS TEC data. In Proceedings of the XII International Conference of Young Scientists and Students “Modern Technology and Technologies in Scientific Research”, Bishkek, Kyrgyzstan, 22–24 April 2020. [Google Scholar]
| Publisher’s Note: MDPI stays neutral with regard to jurisdictional claims in published maps and institutional affiliations. |
© 2022 by the authors. Licensee MDPI, Basel, Switzerland. This article is an open access article distributed under the terms and conditions of the Creative Commons Attribution (CC BY) license (https://creativecommons.org/licenses/by/4.0/).


