
Dry and Wet Changes and Vegetation Time-Delay Responses in Western China

Abstract
1. Introduction
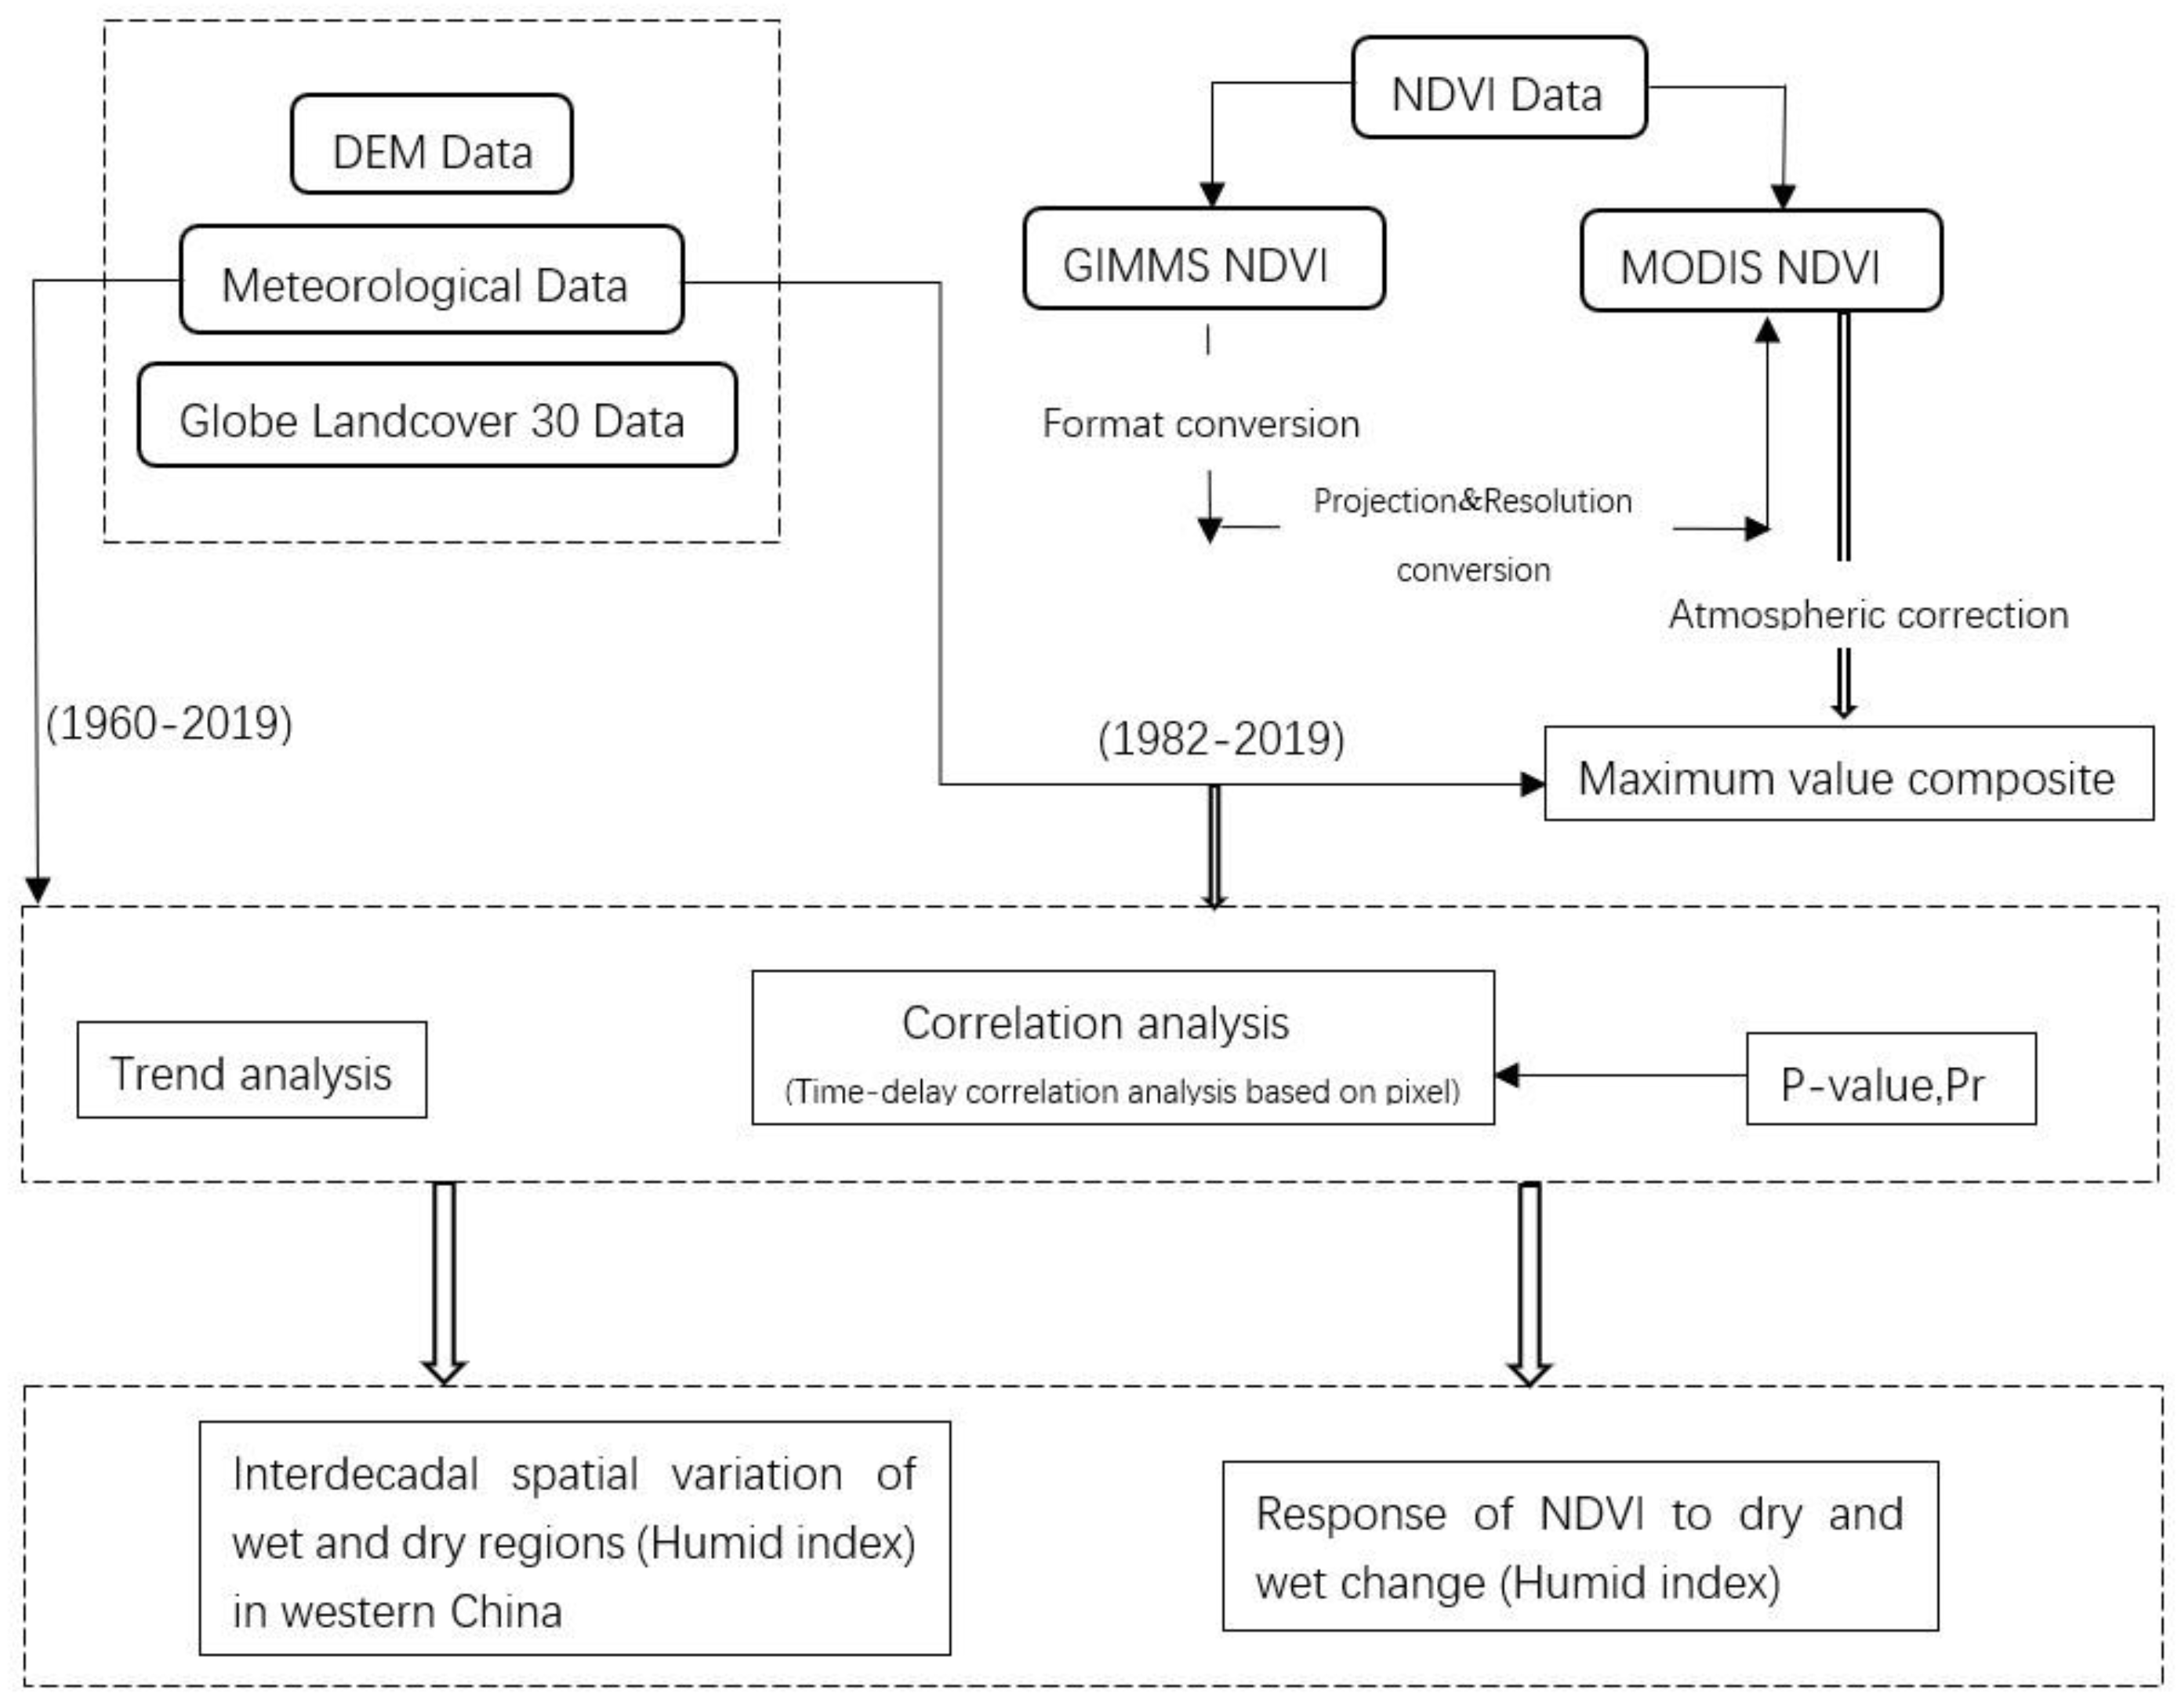
2. Data and Methods
2.1. Study Area
2.2. Data
2.3. Maximum Value Composite Method
2.4. Calculation of Evapotranspiration and Humidity Indexes
2.5. Correlation Analysis
2.6. Inverse Distance Weight (IDW) Interpolation
3. Results
3.1. Interdecadal Spatial Distribution and Variation in Humidity Index
- Menggan Region. The humidity index of the Menggan region reaches a minimum in the Badain Jaran Desert and its surrounding areas, and a maximum in the south of the Yinshan Mountains to the north of Ordos and the Gannan region. Over the past 60 years, the extent of extremely arid areas in Menggan District has gradually decreased from 11.43% in the 1960s to 5.16% in the 2010s, while the extent of semi-arid areas has experienced a change process of first decreasing and then increasing, and the total area today is largely equal to that in the 1960s. As shown in Table 1.
- Weihe Region. The changes in semi-arid and sub-humid areas in the Weihe region showed opposite trends. The extent of semi-arid areas showed an overall increase, but decreased significantly in the 1980s and 2000s, from 11.40% to 38.19% and then to 17.09%, mainly in the Weihe River region in the Loess Plateau. In the 2000s, the extent of subhumid areas decreased from 73.60% in the 1960s to 24.57% in the 1990s and then to 64.42% in the 1990s. The change range is mainly distributed in the north of the Qinling Mountains and the south of Guanzhong Plain, such as Shangluo City and Baoji City.
- Qinghai–Tibet Region. As shown in Figure 3, the extent of extremely arid and arid regions in the Qinghai–Tibet Plateau has decreased from 4.54% in the 1960s to 1.87% in the 2010s, mainly in the northern part of Qaidam District and the western part of the Qilian–Qinghai Lake region. The extent of arid areas decreased from 42.82% to 17.56%, mainly in western Shigatse and Ngari. The extent of subhumid and humid areas increased significantly, from 5.94% in the 1960s to 25.77% in the 2010s for subhumid areas, and from 2.15% to 11.23% for humid areas, mainly in the Bomi–West Sichuan area.
- The Xinjiang region. Over the past 60 years, the Xinjiang region has shown a trend of continuous wetting. The extent of extremely dry areas decreased from 23.40% to 11.27%, mainly in the southern part of southern Xinjiang, from Kashgar to Hotan. As shown in Table 1, The extent of semi-arid areas decreased from 27.84% to 22.77%; subhumid areas increased from 3.16% to 9.66%; and humid areas increased from 3.33% to 7.86%, mainly in the Yining area, the Tacheng area, and the fertile area in the north of Altay.
- The Yunnan–Guizhou region. As a whole, the climate in the Yunnan–Guizhou region is relatively humid, as shown in Figure 3. Variations in the humidity index in this region mainly occur in the northern part of Chuxiong Prefecture and on the western side of the Wumeng Mountains. Over the past 60 years, the extent of semi-arid areas decreased from 1.14% to 0.26%, humid areas increased from 93.24% to 97.04%, while subhumid areas decreased slightly from 5.62% to 2.70%.
- The Sichuan region. The semi-arid area of Sichuan, including Chongqing, was mainly distributed in Neijiang and Ziyang, and its extent decreased from 0.67% in the 1960s to 0.22% in the 2000s, and then there was no semi-arid area in the 2010s. The extent of humid areas increased from 98.47% to 99.64%.
- Qinba Region: The Qinba District is located in southern Shaanxi and the upper reaches of the Han River. The north subtropical monsoon climate and warm-temperate monsoon climate are both humid. The area of each humid or subhumid area hardly changed during the period covered by the study and is largely stable. However, there is an increasing trend in the extent of semi-arid areas.
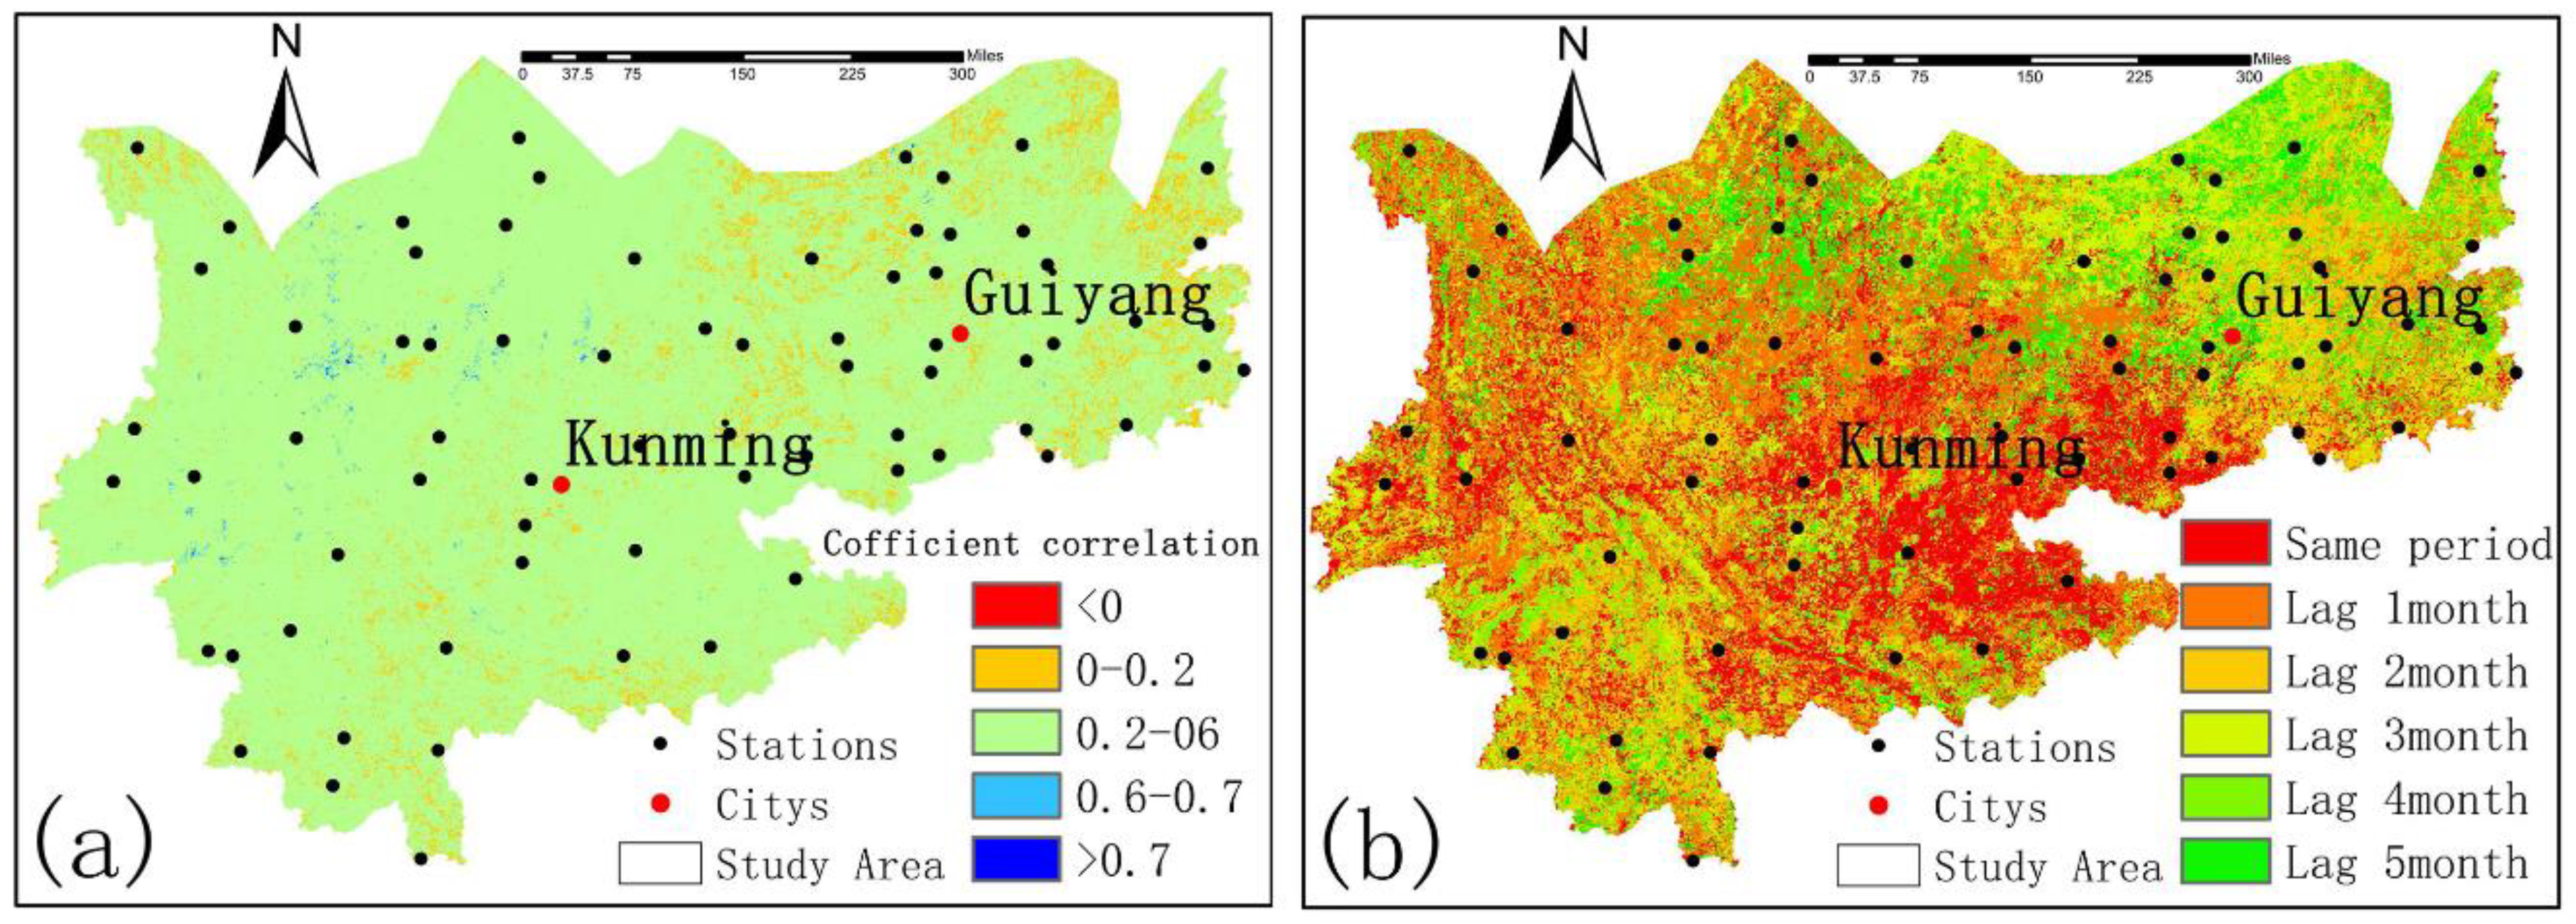
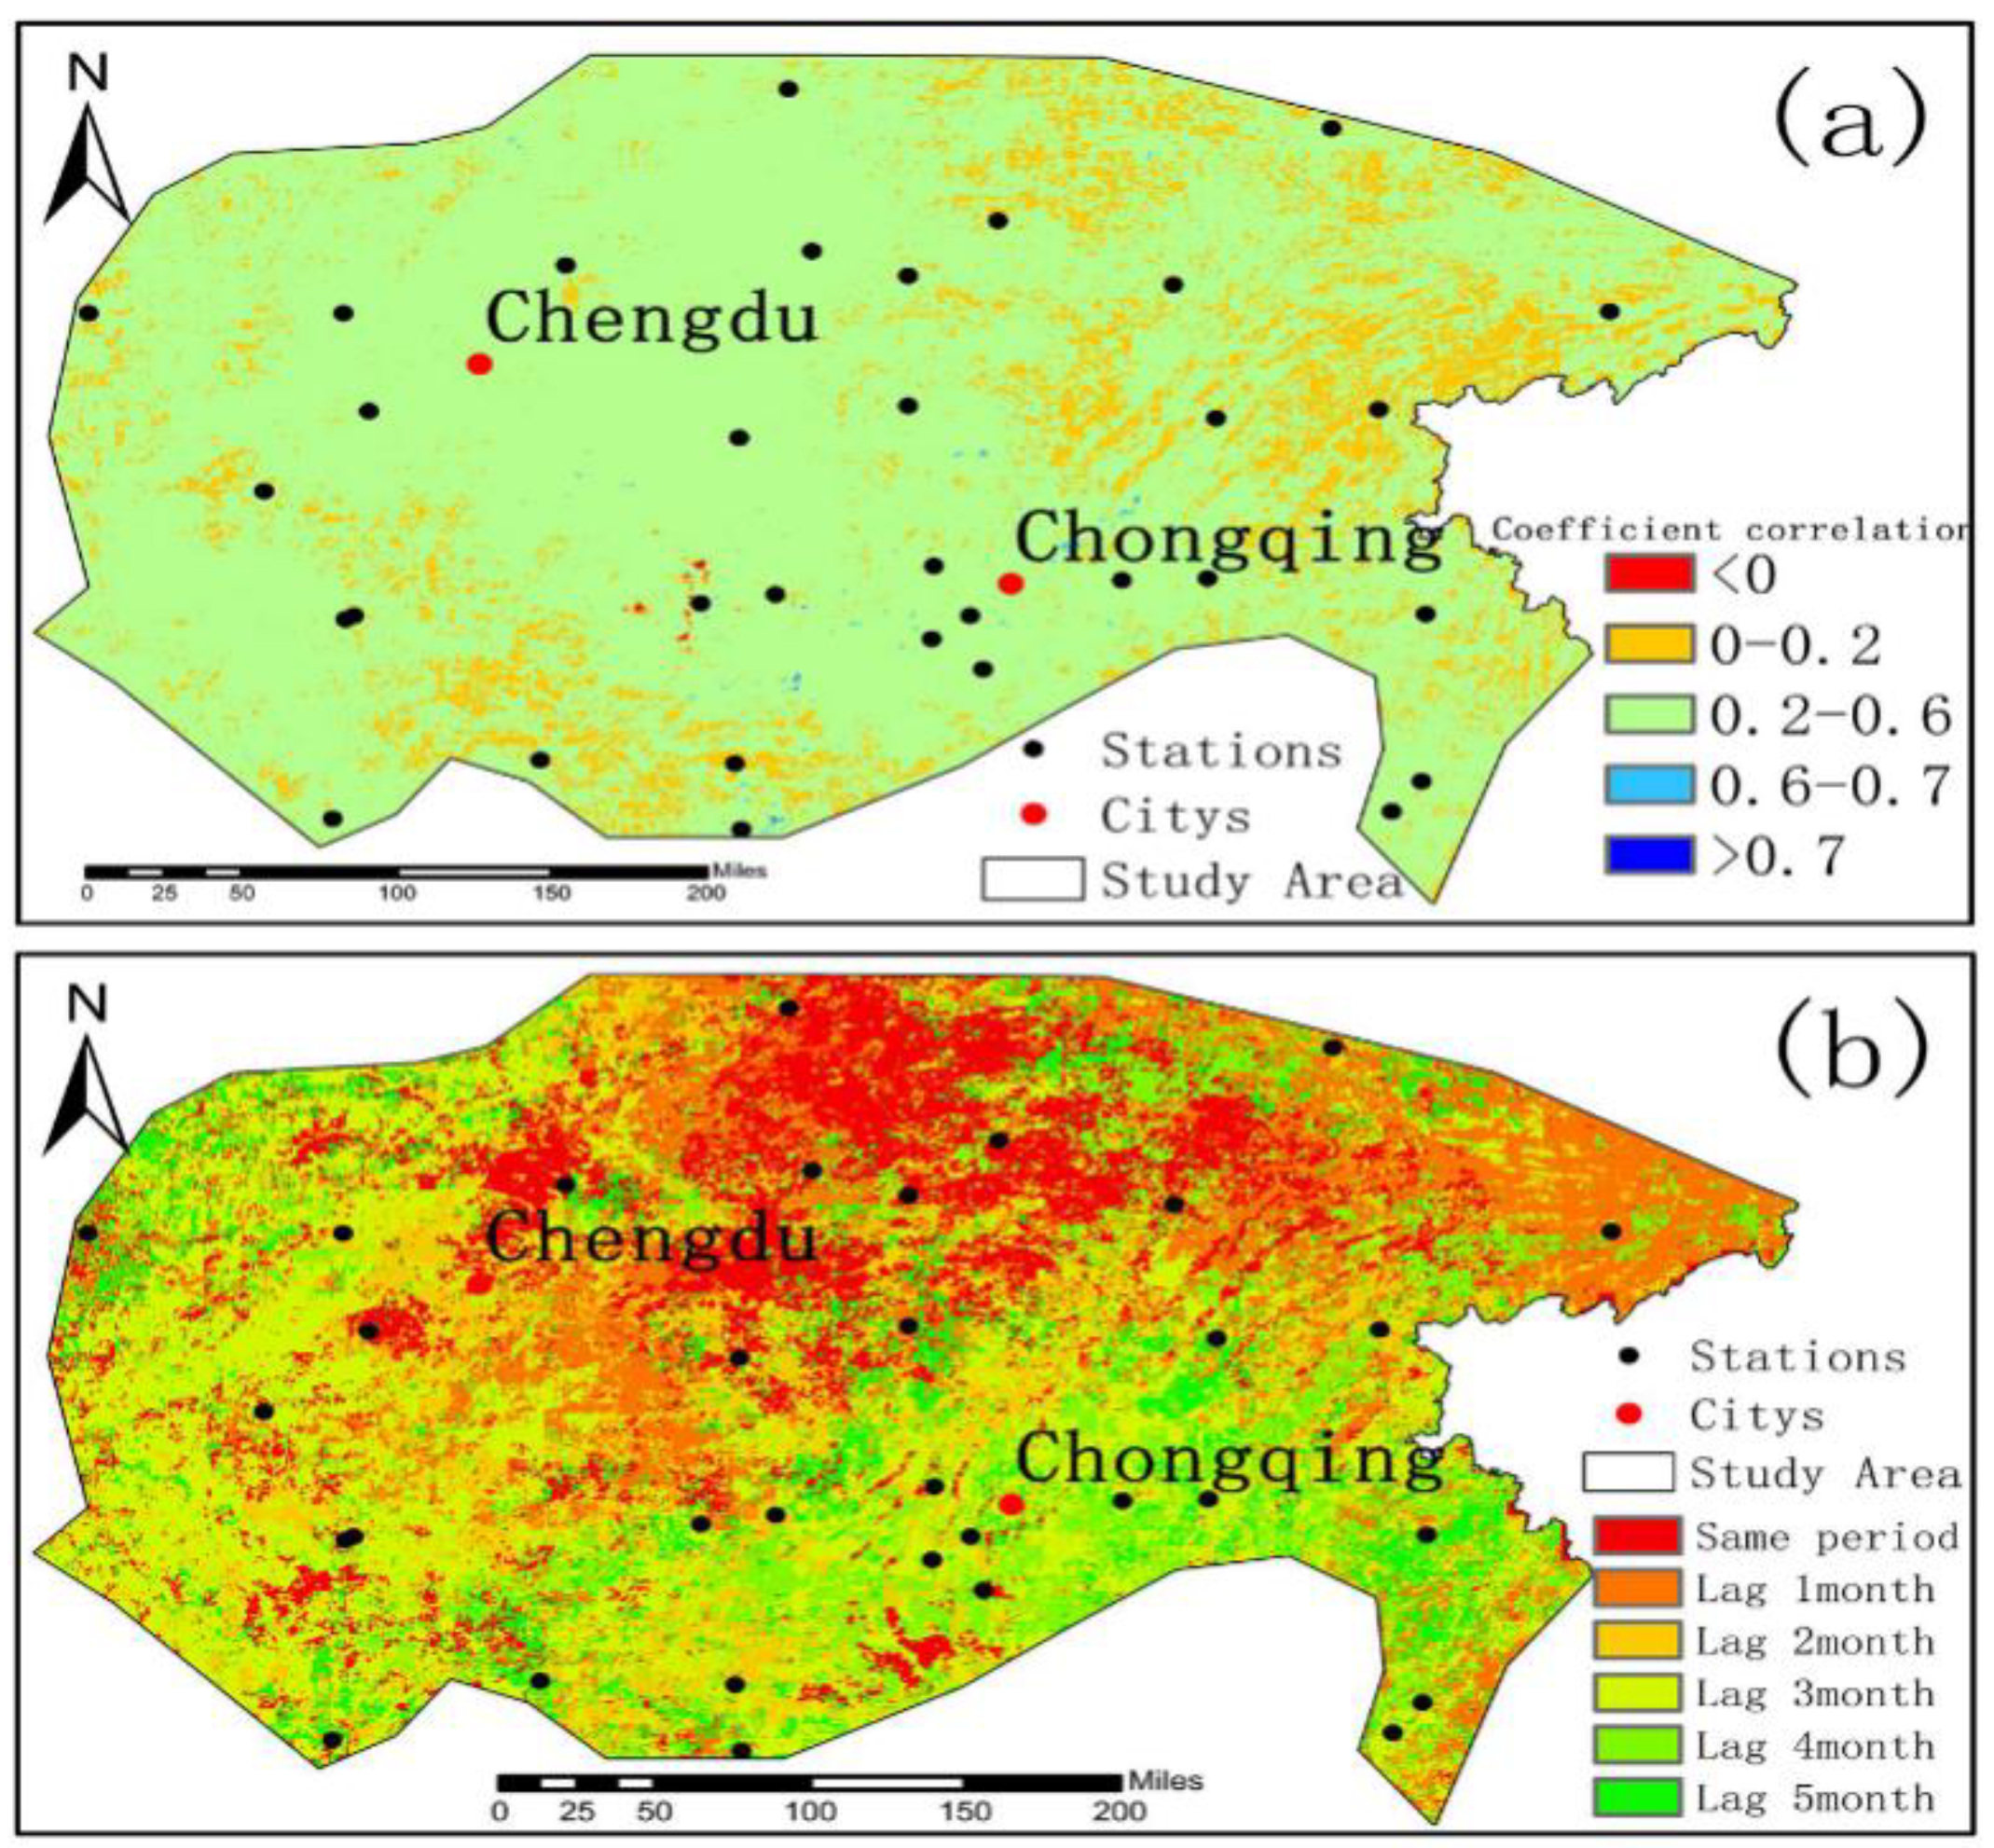
3.2. Time-Delay Mutual Correlation between the NDVI and the Humidity Index
4. Discussion
5. Conclusions
Author Contributions
Funding
Institutional Review Board Statement
Informed Consent Statement
Data Availability Statement
Conflicts of Interest
References
- Wang, L.; Zhang, B.C.; Shi, Y.E.A. Interpretation of the IPCC AR6 on the impacts and risks of climate change. Clim. Chang. Res. 2022, 18, 389–394. [Google Scholar]
- Qin, M.; Jin, N.; Zhao, J.; Feng, M.; Wang, C. Dynamics of the Response of Vegetation Activity to Air Temperature Change in Temperate China. Atmosphere 2022, 13, 1574. [Google Scholar] [CrossRef]
- Li, S.; Zhang, J.; Henchiri, M.; Cao, D.; Zhang, S.; Bai, Y.; Yang, S. Spatiotemporal Variations of Chinese Terrestrial Ecosystems in Response to Land Use and Future Climate Change. Atmosphere 2022, 13, 1024. [Google Scholar] [CrossRef]
- Walters, L.J.; McClenachan, G. Commentary on Osland et al.: Tropicalization of temperate ecosystems in North America: The northward range expansion of tropical organisms in response to warming winter temperatures. Glob. Chang. Biol. 2021, 27, 3006–3008. [Google Scholar] [CrossRef] [PubMed]
- Ali, H.; Din, J.U.; Bosso, L.; Hameed, S.; Kabir, M.; Younas, M.; Nawaz, M.A. Expanding or shrinking? range shifts in wild ungulates under climate change in Pamir-Karakoram mountains, Pakistan. PLoS ONE 2021, 16, e0260031. [Google Scholar] [CrossRef]
- Yao, Y.; Liu, Y.; Wang, Y.; Fu, B. Greater increases in China’s dryland ecosystem vulnerability in drier conditions than in wetter conditions. J. Environ. Manag. 2021, 291, 112689. [Google Scholar] [CrossRef]
- Li, C.; Leal Filho, W.; Wang, J.; Fudjumdjum, H.; Fedoruk, M.; Hu, R.; Yin, S.; Bao, Y.; Yu, S.; Hunt, J. An Analysis of Precipitation Extremes in the Inner Mongolian Plateau: Spatial-Temporal Patterns, Causes, and Implications. Atmosphere 2018, 9, 322. [Google Scholar] [CrossRef]
- Ge, G.; Shi, Z.; Yang, X.; Hao, Y.; Guo, H.; Kossi, F.; Xin, Z.; Wei, W.; Zhang, Z.; Zhang, X.; et al. Analysis of Precipitation Extremes in the Qinghai-Tibetan Plateau, China: Spatio-Temporal Characteristics and Topography Effects. Atmosphere 2017, 8, 127. [Google Scholar] [CrossRef]
- He, J.; Li, B.; Yu, Y.; Sun, L.; Zhang, H.; Malik, I.; Wistuba, M.; Yu, R. Temporal Variability of Temperature, Precipitation and Drought Indices in Hyper-Arid Region of Northwest China for the Past 60 Years. Atmosphere 2022, 13, 1561. [Google Scholar] [CrossRef]
- Ma, D.Y.; Yin, Y.H.; Wu, S.H.; Zheng, D. Sensitivity of arid/humid patterns in China to future climate change under high emission scenario. Acta Geogr. Sin. 2019, 74, 18. [Google Scholar] [CrossRef]
- Huang, Q.; Zhang, Q.; Singh, V.P.; Shi, P.; Zheng, Y. Variations of dryness/wetness across China: Changing properties, drought risks, and causes. Glob. Planet. Chang. 2017, 155, 1–12. [Google Scholar] [CrossRef]
- Zhang, F.M.; Shen, S.H. Studies on Spatial-Temporal Changes of Humidity Indices & Comparing with Precipitation Isograms; Society, C.M., Ed.; College of Applied Meteorology, Nanjing University of Information Science & Technology: Nanjing, China, 2007; pp. 970–979. [Google Scholar]
- Yang, J.P.; Ding, Y.J.; Chen, R.S.; Liu, L.Y. Interdecadal fluctuation of dry and wet climate boundaries in China in the past 50 years. J. Geogr. Sci. 2002, 12, 7. [Google Scholar]
- Yang, R.; Xing, B. Evidence for Intensification in Meteorological Drought since the 1950s and Recent Dryness–Wetness Forecasting in China. Atmosphere 2022, 13, 745. [Google Scholar] [CrossRef]
- Hu, Q.; Dong, B.; Pan, X.B.; Jiang, H.F.; Pan, Z.H.; Qiao, Y.; Shao, C.X.; Ding, M.L.; Yin, Z.W.; Hu, L.T. Spatiotemporal variation and causes analysis of dry-wet climate over period of 1961–2014 in China. Trans. Chin. Soc. Agric. Eng. 2017, 33, 124–130. [Google Scholar]
- Peng, D.; Zhou, T. Why was the arid and semiarid northwest China getting wetter in the recent decades? J. Geophys. Res. Atmos. 2017, 122, 9060–9075. [Google Scholar] [CrossRef]
- Wang, Y.; Liu, P.X.; Cao, L.G.; Gao, Y.; Yong, G.Z. Characteristics of Southwestern China Dry-wet Condition Based on Humid Index in 1960–2011. J. Nat. Resour. 2014, 29, 830–838. [Google Scholar]
- Huang, X.Y.; Zhang, M.J.; Jia, W.X.; Wang, S.J.; Zhang, N. Variations of surface humidity and its influential factors in Northwest China. Adv. Water Sci. 2011, 22, 151–158. [Google Scholar]
- Zhao, J.F.; Guo, J.P.; Xu, J.W.; Mao, F.; Yang, X.G.; Zhang, Y.H. Trends of Chinese dry-wet condition based on humid index. Trans. CSAE 2010, 26, 18–24. [Google Scholar]
- Shen, S.H.; Zhang, F.M.; Sheng, Q. Spatio-temporal changes of humid index in China from 1975 to 2004. Trans. CSAE 2009, 25, 11–15. [Google Scholar]
- Wang, M.; Zhou, C.P.; Wu, L.; Xu, X.L.; Ouyang, H. Aridity Pattern of Tibetan Plateau and Its Influential Factors in 2001–2010. Progress. Inquisitiones Mutat. Clim. 2012, 8, 320–326. [Google Scholar]
- Zhang, G.L.; Ouyang, H.; Zhou, C.P.; Zhang, X.Z.; Xu, X.L. Vegetation change and its responses to climatic variation based on eco-geographical regions of Tibetan Plateau. Geogr. Res. 2010, 29, 2004–2014. [Google Scholar]
- Zheng, J.Y.; Yin, Y.H.; Li, B.Y. A New Scheme for Climate Regionalization in China. Acta Geogr. Sin. 2010, 65, 3–12. [Google Scholar]
- Ma, Z.G.; Fu, C.B. Decadal variations of arid and semi-arid boundary in China. Chin. J. Geophys. 2005, 48, 520–525. [Google Scholar] [CrossRef]
- Li, M.M.; Wu, B.F. The Method of Vegetation Fraction Estimation by Remote Sensing; Chinese Academy of Sciences: Beijing, China, 2003. [Google Scholar]
- Standing Committee of the National People’s Congress. Decision of the Standing Committee of the National People’s Congress on the ratification of the United Nations Convention to Combat Desertification in Those Countries Experiencing Serious Drought and/or Desertification, Particularly in Africa. 1996. Available online: https://www.jus.uio.no/english/services/library/treaties/06/6-02/combat-desertification.xml (accessed on 2 November 2022).
- Pearson, K. Notes on the History of Correlation. Biometrika 1920, 13, 25–45. [Google Scholar] [CrossRef]
- Zuo, D.P.; Han, Y.N.; Xu, Z.X.; Li, P.J. Impact mechanism of climate change on the vegetation dynamics in the Yarlung Zangbo River basin. Water Resour. Prot. 2022, 6, 1–10. [Google Scholar]
- Li, Q.Q.; Cao, Y.P.; Miao, S.L. Spatio-temporal variation in vegetation coverage and its response to climate factors in the Yellow River Basin, China. Acta Ecol. Sin. 2022, 42, 4041–4054. [Google Scholar]
- Zhang, G.P.; Chen, G.M.; Shao, H.Y.; Xian, W. Spatial-temporal Characteristics of Vegetation Coverage and its Response to Climate from 2000 to 2015 in Jinsha River Basin, China. Resour. Environ. Yangtze Basin 2021, 30, 1638–1648. [Google Scholar]
- Zhang, W.; Wang, L.; Xiang, F.; Qin, W.; Jiang, W. Vegetation dynamics and the relations with climate change at multiple time scales in the Yangtze River and Yellow River Basin, China. Ecol. Indic. 2020, 110, 1–13. [Google Scholar] [CrossRef]
- He, H.; Zhang, B.; Hou, Q.; Li, S.; Ma, B.; Ma, S.Q. Variation Characteristic of NDVI and Its Response to Climate Change in Northern China from 1982 to 2015. J. Ecol. Rural Environ. 2020, 36, 70–80. [Google Scholar]
- Zhang, C.; Lei, T.W.; Song, D.X. Analysis of temporal and spatial characteristics of time lag correlation between the vegetation cover and soil moisture in the Loess Plateau. Acta Ecol. Sin. 2018, 38, 2128–2138. [Google Scholar]
- Sun, Q.M.; Liu, T.; Han, Z.Q.; Liu, H.F.; Dong, H.G.; Qin, C.M. Response of climate changes on vegetation cover in north of Tianshan Mountains evaluated using multiple time scales. Trans. Chin. Soc. Agric. Eng. 2014, 30, 248–255. [Google Scholar]
- Cai, F.; Yu, G.R.; Zhu, Q.L.; He, H.L.; Liu, X.A.; Li, Z.Q.; Guo, X.B. Comparison of Precisions between Spatial Methods of Climatic Factors: A Case Study on Mean Air Temperature. Resour. Sci. 2005, 27, 173–179. [Google Scholar]
- Liu, H.; Song, X.; Wen, W.; Jia, Q.; Zhu, D. Quantitative Effects of Climate Change on Vegetation Dynamics in Alpine Grassland of Qinghai-Tibet Plateau in a County. Atmosphere 2022, 13, 324. [Google Scholar] [CrossRef]
- Na, L.; Na, R.; Zhang, J.; Tong, S.; Shan, Y.; Ying, H.; Li, X.; Bao, Y. Vegetation Dynamics and Diverse Responses to Extreme Climate Events in Different Vegetation Types of Inner Mongolia. Atmosphere 2018, 9, 394. [Google Scholar] [CrossRef]


| Partition | Extremely Arid Zone | Arid Zone | Half Arid Zone | Semi-Humid Zone | Wet Zone |
|---|---|---|---|---|---|
| Menggan area | −6.27% | 4.10% | 1.48% | 0.57% | 0.12% |
| The Weihe area | \ | −0.02% | 5.69% | −9.18% | 3.50% |
| The Qinghai-Tibetan area | −2.67% | −27.14% | 0.89% | 19.83% | 9.08% |
| Xinjiang area | −12.13% | 6.17% | −5.07% | 6.50% | 4.53% |
| Yunnan-Guizhou area | \ | \ | −0.88% | −2.92% | 3.80% |
| Sichuan area | \ | 0.1% | −0.67% | −0.40% | 1.17% |
| Qinba area | \ | \ | 1.59% | 0.20% | −1.79% |
Publisher’s Note: MDPI stays neutral with regard to jurisdictional claims in published maps and institutional affiliations. |
© 2022 by the authors. Licensee MDPI, Basel, Switzerland. This article is an open access article distributed under the terms and conditions of the Creative Commons Attribution (CC BY) license (https://creativecommons.org/licenses/by/4.0/).
Share and Cite
Chen, J.; Zhang, B.; Yao, R.; Zhang, X.; Zhang, Y.; Zhou, J. Dry and Wet Changes and Vegetation Time-Delay Responses in Western China. Atmosphere 2022, 13, 2013. https://doi.org/10.3390/atmos13122013
Chen J, Zhang B, Yao R, Zhang X, Zhang Y, Zhou J. Dry and Wet Changes and Vegetation Time-Delay Responses in Western China. Atmosphere. 2022; 13(12):2013. https://doi.org/10.3390/atmos13122013
Chicago/Turabian StyleChen, Jie, Bo Zhang, Rongpeng Yao, Xiaofang Zhang, Yaowen Zhang, and Jing Zhou. 2022. "Dry and Wet Changes and Vegetation Time-Delay Responses in Western China" Atmosphere 13, no. 12: 2013. https://doi.org/10.3390/atmos13122013
APA StyleChen, J., Zhang, B., Yao, R., Zhang, X., Zhang, Y., & Zhou, J. (2022). Dry and Wet Changes and Vegetation Time-Delay Responses in Western China. Atmosphere, 13(12), 2013. https://doi.org/10.3390/atmos13122013