Abstract
The Eyjafjallajökull volcanic ash crisis in 2010 temporarily suspended European air traffic operations, as the 39-day eruption caused widely dispersed ashes to enter the lower atmosphere. In this paper, we assessed the effects of this event on the ionosphere layer and, consequently, on GPS positioning. We collected and analysed the data from four IGS stations, nearest to the volcano, for the month of April 2010. We recorded Vertical Total Electron Content (VTEC) time series, analysed their dynamics, and compared them with the GPS positioning errors of a commercial-grade, un-aided, single-frequency GPS receiver (simulating the response of a mass-market GPS receiver). The geomagnetic indices during the time period show little geomagnetic disturbance, especially during the volcanic event. Our results show an enhancement in ionosphere error by up to 15% during the volcanic ash event and an enhanced variance in GPS position components errors. This study reveals the potential impact of the charged volcanic ash on single-frequency, unaided GPS positioning accuracy in the Adriatic Sea region and establishes a foundation for studying similar events in future.
1. Introduction
The Eyjafjallajökull volcanic ash crisis disrupted and brought a temporary halt to European airspace in 2010. The volcanic plume created an exceptional atmospheric event that disturbed numerous technology systems and services. Along with significant economic damage, the Eyjafjallajökull volcanic ash crisis provided researchers with an opportunity to examine the physical mechanisms related to propagation of the hot volcanic ash across the European continent and the Atlantic Ocean. A number of flights were conducted with the intention to observe the propagation of volcanic ash and gather the data needed for flight risk assessments. These flights collected invaluable data for a greater understanding of physical processes in the atmosphere [1]. The data analysis revealed evidence of increased ion concentration in the atmosphere [2]. One of the parameters that signifies the amount of ion concentration is the Total Electron Content (TEC). By definition, TEC is the total number of free electrons encountered by a GPS signal travelling from a GPS satellite to a GPS user aerial. It determines the value of the GPS ionosphere delay and causes significant errors in GPS positioning [3,4,5,6,7].
The Adriatic Sea region is an economically active area in Southeastern Europe, with an increasing number of GNSS/GPS users. The region was on the border of the extensive Eyjafjallajökull volcanic ash crisis in 2010, with Vienna, Graz (Austria) and Zagreb (Croatia) airports closing, Dubrovnik (Croatia) airport being closed only briefly, and Rome (Italy) airport remaining operational throughout the period of crisis.
This paper aims to discover the extent to which the ionisation processes generated by the propagation of the Eyjafjallajökull volcanic ash in 2010 affected GPS positioning performance; particularly aviation and maritime applications in the region. For this purpose, we used GPS data from the International GNSS Service (IGS) Network reference stations in the region. These data were used to analyse TEC variation and GPS positioning deterioration analysis.
The paper is organised as follows: Section 2 defines the problem and outlines previous research. The sources of data, a data description and the research methodology are provided in Section 3. The results of the analysis related to TEC variations and GPS positioning accuracy are presented in Section 4 and discussed in detail in Section 5; The paper concludes with a summary of the research findings and an outline of subjects for further research in Section 6.
2. Problem Description and Previous Research
Satellite positioning is a measurement-based estimation process that utilises various satellite signal codes and phase measurements to estimate the user position. Details of the position estimation process may be found at [8,9,10]. A range of solutions to the GPS position estimation problem may be deployed for the purpose of specific applications. Here, we focus on mass-market applications in air, maritime and road navigation, and telecommunications (Location-Based Services, LBS), considering the utilisation of commercial-grade, non-augmented, single-frequency, code-based position estimation. Additionally, we consider the positioning accuracy from the perspective of mass-market users, who are not concerned with the absolute geodetic accuracy, but require a certain level of positioning performance for the fulfilment of the Quality of Service (QoS) requirements of related GPS applications.
This study targets the actual user experience in the exceptional situation of natural adversarial effects on GPS positioning performance, and not the best-possible absolute accuracy. The study does not aim to address advanced methods of position estimation for targeted classes of users (Real-Time Kinematic, RTK; Precise Point Positioning, PPP; or high-precision, satellite-based services), with specific forms and contents of assistance and augmentations. We focus on the vast majority of GPS users exposed to extraordinary natural ionospheric conditions and their effects on the prevalent scenario of GPS position estimation utilised in their satellite receivers.
The GPS ionospheric delay is the main cause of the GPS positioning error [3,8,11,12]. It results from the satellite signal propagation through ionised media (ionospheric layers) with variable refractive index [3,4,5]. Derived from the Appleton–Hartree formula [4,12], the GPS ionospheric delay can be determined from the known vertical ionospheric profile [3,4,12] using (1).
where:
- dIONO—quivalent ionospheric delay (expressed in m) at the
- f—nominal frequency of the GPS radio carrier signal (L1 = 1575.42 MHz, L2 = 1227.60 MHz, L5 = 1176.45 MHz)
- N(h)—vertical ionospheric profile (free electrons density in electrons/m3) at height above the mean sea level, h in m:
The integral (2) is known as Total Electron Content (TEC), a parameter describing the overall quantity of charged particles encountered by satellite signals along their path from a satellite to the user’s equipment. The studies of [10,13,14] outlined the computational process through which the GPS ionospheric delay propagates to GPS positioning error. It should be noted that the GPS ionospheric error contributes to the total GPS positioning error through scaling with the Dilution of Precision (DOP) coefficient. The DOP is determined by the geometrical constellation of satellites used for positioning, as seen from the user’s perspective. While the Horizontal DOP (HDOP) coefficient usually values from the interval (1–3), the worst-case scenario triples the ionospheric error contribution in the total GPS positioning error.
Although the major contributor in the TEC equation (2) is charged particles of the ionosphere layer [12,14,15,16]; in general, the ionised patches found on the rest of the satellite signal’s propagation path also play an important role [11,17]. These ionised patches may appear both above the height of the ionosphere’s top level (due to mainly solar storms and cosmic radiation) [18], as well as below the ionosphere’s bottom level (due to volcanic eruptions, thunderstorms and supersonic flights, respectively) [4,16].
The complexity of the formation of ionised layers and areas in the upper Earth’s atmosphere renders the modelling of the GPS ionospheric delay a challenging task. In general, the GPS ionospheric delay can be described as a linear model of deterministic and stochastic components [14,19], as presented with (3):
This model (3) comprises of stochastic and stable patterns of the GPS ionospheric delay dynamics, a nightly constant value and a daily cosine-shaped GPS ionospheric delay rhythm, as exploited in the Klobuchar model of GPS ionospheric delay correction [3,17,20]. The stochastic component of (3) contains the GPS ionospheric delay resulting from the unexpected and unpredictable processes that contribute to the overall TEC during events of unknown and limited duration, and constrained spatial outreach, such as: ionospheric/geomagnetic storms, earthquakes, volcanic eruptions, thunderstorms and supersonic flights.
Additional attempts to model the GPS ionospheric delay were conducted using various approaches on both global and regional scales [14,17,18,21,22]. However, they still failed to recognise the sudden and stochastic local ionospheric events. The studies of [1,2] used the case of the data-rich Eyjafjallajökull volcanic ash crisis to describe the temporal formation of the ionised layers below the ionosphere, generated by volcanic eruption and volcanic spatial propagation processes. This description established the foundation for a study on the effects of the temporal ionised areas, generated by volcanic ash below the ionosphere on the total TEC, GPS ionospheric delay and, subsequently, the overall GPS positioning performance during the occasions of volcanic ash eruption and dispersion.
The GPS positioning performance affects the quality of systems and services that utilise GPS as their foundation [23,24,25]. The definitions of the actual relation and risk analysis of GPS-based development are deeply application-dependent, and remain the subject of intensive research worldwide. The studies of [25,26] provided a cross-disciplinary qualitative assessment that could serve as the background for advanced research.
3. GPS Positioning Accuracy Deterioration during Volcanic Ash Crises in the Adriatic Sea Region
3.1. Data Sets
The global network of ground-based GPS receivers by International GNSS Service (IGS) provide raw GPS data in form of RINEX files to all users. The IGS reference stations collect various GPS-related observations, including raw dual-frequency GPS pseudoranges, and broadcast navigation messages regularly (every 30 s) and continuously (24 h a day for the whole year), for the purpose of post-processing and research. These reference stations comply with the IGS standard for data collection, design and the operation of the IGS reference site. The IGS process assures that raw GNSS pseudoranges do not encompass the errors caused by local effects, thus offering the objectively collected data affected by common sources of positioning error (ionospheric delay, satellite clock error and satellite ephemeris error) [10,27]. The dual-frequency, raw GPS pseudorange observations were collected at the four IGS reference stations in the region of interest (Figure 1 and Table 1). These data may be found at https://igs.org/data/ accessed on 6 November 2021. The single-frequency raw GPS pseudoranges were split into daily sets per site, and statistically analysed to identify the quality of performance and potential anomalies.
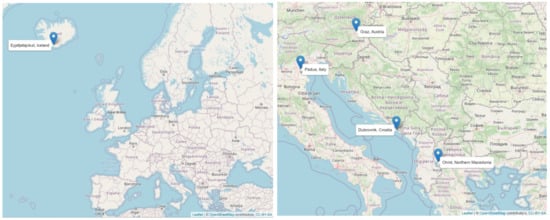
Figure 1.
Positions of Eyjafjallajökull volcano (left), and the IGS reference stations in the Adriatic Sea region that provided GPS observations for the research presented (right); illustrations were arranged using Open Street Map spatial data, and a bespoke software development in the R environment was used for statistical learning.

Table 1.
Details of the IGS reference stations that provided GPS observations used in this research.
GPS data for a period of 30 days: from 1 April 2010 (day 091 in 2010) to 30 April 2010 (day 120 in 2010), were used in the assessment of the GPS positioning performance. The time interval was selected based on the predicted volcanic ash circulation in the region, as presented by the UK Met Office volcanic ash prediction charts [28]. The Met Office charts serve as the reference material for volcanic ash circulation for various utilisations (including the risk analysis for aviation, and later research studies), in the absence of the other sources of systematically collected data.
TEC values were derived from dual-frequency GPS pseudorange observations, using the GPS-TEC v3.0 software, developed and maintained by Dr Seemala [29]. We utilised the receiver bias estimation procedure embedded in GPS-TEC software [10,29]. This is an open-source software available at https://seemala.blogspot.com/. The actual GPS ionosphere delay was estimated using the open-source software TEQC, available at UNAVCO website https://www.unavco.org/software/data-processing/teqc/teqc.html, accessed on 6 November 2021.
The positioning solutions were obtained using the open-source, software-defined radio RTKLIB [30], and other statistical analyses were performed using customised algorithm developed in the R environment.
For assessing the status of the positioning environment during the time of the Eyjafjallajökull volcanic ash crisis in 2010, we analysed the solar (F10 and Sn indices) and geomagnetic (Dst, Kp and ap indices) activity during the period in question [31]. The results were used for establishing the distinction between GPS positioning error effects caused by global (solar/geomagnetic/ionospheric disturbances) and local (volcanic ash-related ionisation) ionospheric activities, respectively.
3.2. Outline of Methodology
The downloaded data from IGS stations were input into the RTKLIB software in order to simulate the behaviour of a single-frequency GPS receiver using real GPS pseudorange observations [29]. The software-defined RTKLIB GNSS receiver (rev 2.4.3 b34) was set to apply GPS-only, single-frequency position estimation with an elevation mask at 15º and broadcasted satellite ephemeris data. The broadcast model (i.e., Klobuchar) was applied for ionosphere correction and broadcast data and the utilisation of broadcast ionospheric (Klobuchar) and Saastamoinen model for tropospheric correction, as depicted in Figure 2. This may be considered a common practice for an ordinary, single-frequency GPS receiver [32,33].
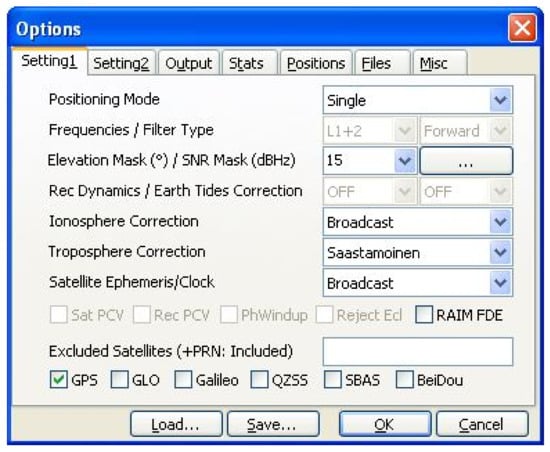
Figure 2.
Software-defined RTKLIB GPS receiver settings in presented research.
The RTKLIB GPS receiver returned position estimates, as well as the position estimation errors calculated using the known position of the reference station in a tabular data format suitable for further processing [30]. Data pre-processing and the statistical analysis of the GPS positioning error time series was conducted using the R-based [34] software we developed for the purpose of the research.
The same raw dual-frequency GPS observations were then used for the estimation of the Total Electron Content (TEC) [10,20,35], a result of the ionospheric conditions that directly determined the GPS ionospheric delay. The open-source tool TECQ was used for the determination of the actual GPS ionospheric delay (VTEC) from dual-frequency GPS observables [36]. Time series of VTEC values (equivalent to GPS ionospheric delay) were further processed using our own R-based software. Time series of VTEC values observed during the European volcanic ash 2010 crisis were compared with the normal VTEC values observed at the same station sites in quiet-space weather and ionospheric conditions, in order to assess the contribution of volcanic ash to the overall GPS ionospheric delay [7,33]. In addition, a due consideration was given to the global status of the geomagnetic and ionospheric conditions, using the reference data from [37], in order to distinguish volcanic ash affects from potential effects of global geomagnetic and ionospheric storms.
The contribution of the Eyjafjallajökull volcanic ash to total VTEC is estimated using an indirect methodology: Time interval of the VTEC encompassing just the ‘background’ ionospheric production is identified as the period after 15th April. This is when the Eyjafjallajökull volcanic ash receded from the geographical region in observation, according to [28]. The time interval of the VTEC containing the ‘background’ ionospheric production and the Eyjafjallajökull volcanic ash contribution was identified as the period with no active geomagnetic events. This is determined using Dst time series as an indicator of geomagnetic activity. Derived VTEC and GPS positioning error values during both periods were compared. Then, the estimated VTEC contribution due to the Eyjafjallajökull volcanic ash effects was obtained as the difference between the scenarios of the presence and absence of the Eyjafjallajökull volcanic ash.
The proposed methodology assumes the experimental GPS observations to be free of additional sources of ionisation, which would otherwise compromise the results. The IGS network methodology for observation provides a framework for a reasonable fulfilment of such an assumption. An additional effort was made to exclude the data with geomagnetic activity (as deduced from the Dst).
4. TEC and GPS Positioning Accuracy Analysis Results
4.1. The Space Weather Conditions during the Period of Study
Figure 3 presents the global indices (Ap, Kp, F10, Sn and Dst) for the month of April 2010. A short-time geomagnetic disturbance occurred around Day 105 (5 April 2010), as highlighted in Figure 3. Other than this, it is observed that the space weather situation was mostly calm in the period covered by this research. This allowed for the presumption that any potential positioning accuracy deterioration or VTEC enhancements, occurring other than Day 105, are solely by the Eyjafjallajökull volcanic ash.
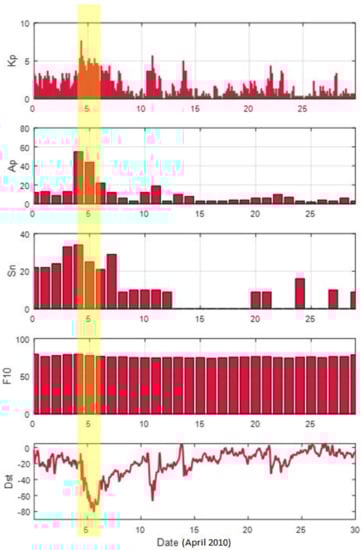
Figure 3.
Planetary indices during the month of April 2010. Anomalies are indicated by highlighted area.
4.2. Ionospheric Delay Observations and VTEC
Vertical TEC (VTEC) observation time series are derived from dual-frequency GPS observations, as outlined in Section 3.2. and depicted in Figure 4, using the equivalence between VTEC and the ionospheric time delay dIONO (1) and (2). A comparison was made between the days of considerable TEC disturbance and quiet TEC conditions for the reference sites in observation, as depicted in Figure 5. Figure 6 depicts the ionosphere delay error for all stations in metres. We infer that the enhancements observed on Day 105 were due to the mild geomagnetic disturbances (as depicted in Figure 3). However, it may be observed from Figure 4 that the increase in error variation is also observed on Day 114 (highlighted in the figure) when there is no geomagnetic disturbance. These increased levels of the vertical ionospheric delays are particularly evident at the reference stations significantly affected by the Eyjafjallajökull volcanic ash: Graz, Austria, with approx 15% increase in the maximum value; and Padova, Italy, with approximately a 16% increase in the maximum value, respectively, compared with the undisturbed levels. We infer that the increased vertical ionospheric delay in latter period may have resulted from the Eyjafjallajökull volcanic ash effects.
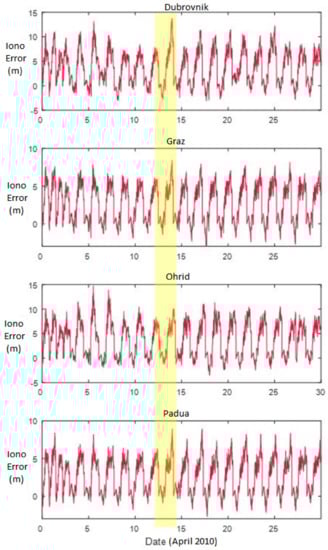
Figure 4.
Time series of vertical TEC (VTEC) values, during days April 2010, as observed at reference stations.
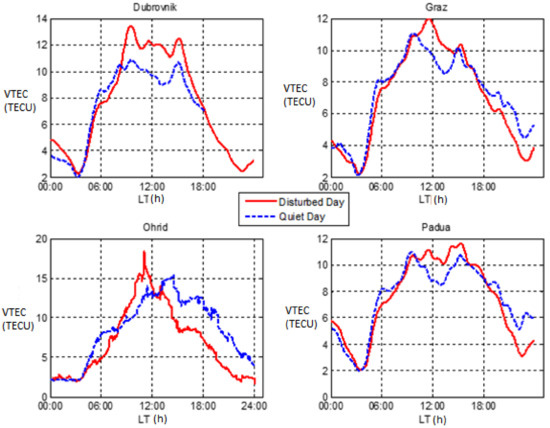
Figure 5.
Comparison of diurnal VTEC on Day 114 (disturbed day) and the quietest day of the month (i.e., Kp < 2) for all four stations.
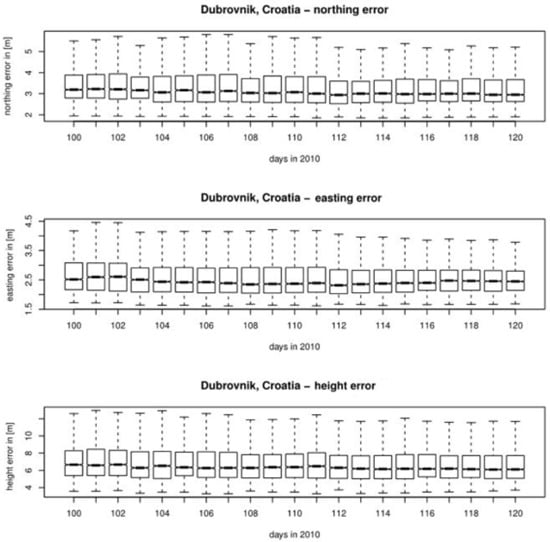
Figure 6.
Box-and-whisker plot of GPS positioning errors as observed at Dubrovnik, Croatia reference station during days 100–120 in 2010.
To further investigate the increase in VTEC on Day 114, we compared the diurnal TEC of Day 114 (indicated as Disturbed Day on Figure 5) with the quietest day in the month of April 2010 (indicated as Quiet Day on Figure 5). The quiet day was chosen as the day with Kp ≤ 2. A significant increase in VTEC, especially for Dubrovnik and Ohrid stations, was observed, and thus further confirmed that an unexpected VTEC enhancement was obtained on Day 114 when the geomagnetic activity was undisturbed.
4.3. Analysis of GPS Positioning Accuracy at Reference Sites
The GPS performance was assessed by estimating the calculated GPS positioning errors along the three co-ordinates of the spatial co-ordinate system. The statistical analysis of the northing, easting and height positioning errors is presented in this section. The box-and-whisker plots of northing, easting and vertical positioning errors, respectively, for related IGS reference stations are shown in Figure 6, Figure 7, Figure 8 and Figure 9.
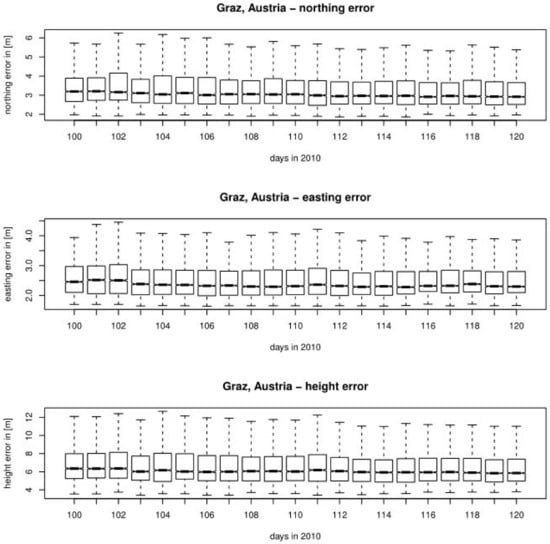
Figure 7.
Box-and-whisker plot of GPS positioning errors as observed at Graz, Austria reference station during days 100–120 in 2010.
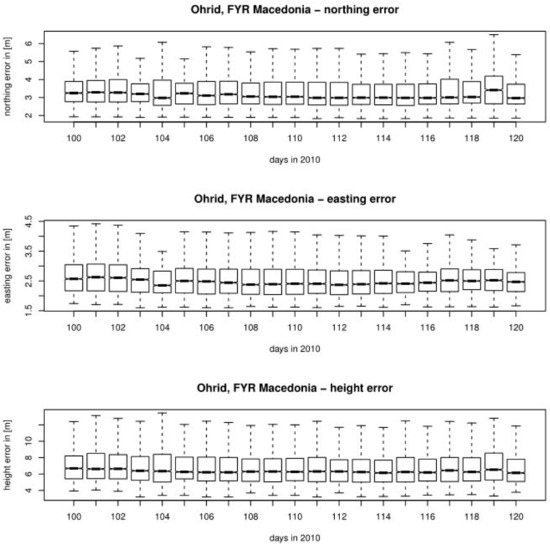
Figure 8.
Box-and-whisker plot of GPS positioning errors as observed at Ohrid, Northern Macedonia reference station during days 100–120 in 2010.
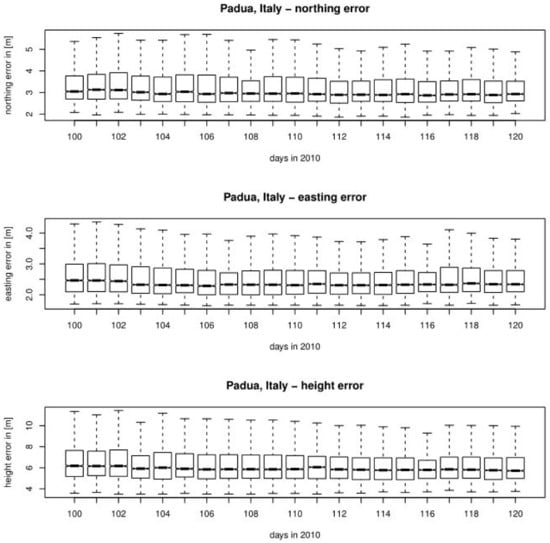
Figure 9.
Box-and-whisker plot of GPS positioning errors as observed at Padua, Italy reference station during days 100–120 in 2010.
A further analysis of daily GPS positioning errors revealed significant effects on the GPS position error variance, especially for vertical component error (up to 100%), and easting error (up to 25%). Inconclusive results were obtained in regard to the mean error of positioning components, as some components encountered an increase in the error during the volcanic ash period, while the others decreased.
5. Discussion
The spatial variations of the GPS positioning error components do not present any recognisable patterns created by the Eyjafjallajökull volcanic ash ionisation processes; instead, they have a very uncertain and inconsistent effect.
Assuming the utilisation of a single-frequency, un-aided GPS receiver and the positioning accuracy requirements outlined in Table 2, the potential risk in degraded GPS positioning accuracy was identified for particular aviation and maritime applications listed in [26]. The potential impact of Eyjafjallajökull volcanic ash processes was identified for more demanding GPS-based navigations, such as SAR operations, a precision-based approach, autonomous aircraft/vehicle/vessel navigation, etc., and non-navigation applications [25]. The degradation of position caused by the volcanic ash event also posed a risk for scientists using GPS to understand ionospheric phenomenon.
Table 2.
Quantification of the qualitative GNSS positioning accuracy requirements outlined in [26].
The statistical analysis of the GPS ionosphere delay is summarised in Table 3. The vertical ionospheric delay mean values and their variations were more pronounced in the southern part of the region, which was not affected (or marginally affected) by the Eyjafjallajökull volcanic ash [28]. This is consistent with the vertical ionospheric delay characterisation during quiet ionospheric conditions, when southern reference stations encountered higher values of both vertical ionospheric delays compared to the northern stations. This may be explained by the difference in the energy received both directly from the Sun and from the processes of free electrons transfer from subequatorial region [16,33].
Table 3.
Statistics of vertical GPS ionospheric delays during days 100–120 in 2010.
However, the evidence for increased vertical ionospheric delay in days 110–115 suggests another, slightly less dominant ionospheric process that caused the increase in the maximum vertical ionospheric values. After excluding the other potential causes, the Eyjafjallajökull volcanic ash remains the only underlying factor that may explain these enhanced variations. The observed VTEC increase also fits into the model (2) as a spatially and temporarily constrained addition to the VTEC dynamics. It has an evident, but minor effect on the majority of unassisted, single-frequency, GPS-based navigation applications. Nonetheless, it should be noted that the contribution of the GPS ionospheric delay to the total GPS positioning error can be amplified by up to three times, depending on the local topology and constrains in the clear sky visibility, both characterised by the dilution of precision.
6. Conclusions and Future Work
This study focused on the assessment of the Eyjafjallajökull volcanic ash crisis on unassisted, single-frequency GPS positioning accuracy in Europe in the spring of 2010. This unique event not only affected transport and traffic systems and services, but also caused extraordinary atmospheric conditions, which impacted technology systems, such as GPS. This paper aimed to study the volcanic ash ionospheric effects on the GPS positioning performance of unaided, commercial, single-frequency GPS receivers utilising the essential position estimation algorithm. This application scenario was selected to encompass a wide population of users with smartphone-based telecommunications applications. In due course, we assumed the utilisation of a standard set of GPS observation corrections (ionospheric, tropospheric and satellite clocks) provided by the operator of GPS.
In this paper, we post-processed data from IGS stations in the vicinity of the volcanic eruption. We analysed the vertical Total Electron Content (VTEC) and the GPS positioning errors during the period of the Eyjafjallajökull volcanic ash crises from the perspective of the GPS-based navigation applications.
The analysis revealed a period of increased VTEC, spatiotemporally correlated with the propagation of the Eyjafjallajökull volcanic ash. In the period of concern, VTEC observations were occasionally compromised with the additional contribution of short-term and moderate natural geomagnetic events. However, we identified events and estimate d their effects, which allowed for identification of the contribution of the Eyjafjallajökull volcanic ash to VTEC production. The observed VTEC increase was super-imposed onto the common ionospheric processes of a more pronounced intensity. The analysis revealed ionosphere delay enhancements of up to 15%, resulting from Eyjafjallajökull volcanic ash ionisation processes. We find inconclusive evidence on the bias (mean error) effects of the volcanic ash on GPS positioning performance. However, we find an increased variance in position component error estimates of up to 100% for vertical, and up to 20% for eastern component errors, respectively.
Our results suggest that the volcanic ash effects have the potential to affect unaided, standard navigation solutions. Future research will focus on the identification and overcoming of such effects for precision navigation; the findings presented here are for the assessment of short-term ionospheric disturbances.
Author Contributions
R.F. conceived the study. M.M. and S.S. prepared the problem statement and assessed the state-of-the-art research. All three authors developed the methodology. R.F. developed software in the R environment for statistical computing. M.M. aggregated and pre-processed sets of observations using the software developed in the R environment for statistical computing, performed exploratory statistical analysis, and performed research in accordance with the methodology set. All authors contributed equally to the inference of results, and formulation of the conclusion. All authors have read and agreed to the published version of the manuscript.
Funding
R.F. acknowledge partial support of their research contribution by the research project Re-search of environmental impact on the operation of satellite navigation systems in mari-time navigation (Funding No.: uniri-tehnic-18-66, funder: University of Rijeka, Rijeka, Croatia).
Conflicts of Interest
All authors declare no conflict of interest.
References
- Schumann, U.; Weinzierl, B.; Reitebuch, O.; Schlager, H.; Minikin, A.; Forster, C.; Baumann, R.; Sailer, T.; Graf, K.; Mannstein, H. Airborne observations of the Eyjafjalla volcano ash cloud over Europe during air space closure in April and May 2010. Atmos. Chem. Phys. 2011, 11, 2245–2279. [Google Scholar] [CrossRef]
- Harrison, R.G.; Nicoll, K.; Ulanowski, Z.; Mather, T. Self-charging of the Eyjafjallajökull volcanic ash plume. Environ. Res. Lett. 2010, 5, 024004. [Google Scholar] [CrossRef]
- Klobuchar, J.A. Ionospheric time-delay algorithm for single-frequency GPS users. IEEE Trans. Aerosp. Electron. Syst. 1987, AES-23, 325–331. [Google Scholar] [CrossRef]
- Davies, K. Ionospheric Radio; Peter Peregrinus Ltd.: London, UK, 1990. [Google Scholar]
- Hunsucker, R.D.; Hargreaves, J.K. The High-Latitude Ionosphere and Its Effects on Radio Propagation; Cambridge University Press: Cambridge, UK, 2007. [Google Scholar]
- Cannon, P.; Angling, M.; Barclay, L.; Curry, C.; Dyer, C.; Edwards, R.; Greene, G.; Hapgood, M.; Horne, R.B.; Jackson, D. Extreme Space Weather: Impacts on Engineered Systems and Infrastructure; Royal Academy of Engineering: London, UK, 2013. [Google Scholar]
- Haralambous, H.; Leontiou, T.; Petrou, V.; Kumar Singh, A.; Charalambides, M.; Lithoxopoulos, N.; Agisilaou, A. Adjusting CCIR Maps to Improve Local Behaviour of Ionospheric Models. Atmosphere 2021, 12, 691. [Google Scholar] [CrossRef]
- Strang, G.; Borre, K. Linear Algebra, Geodesy and GPS, Wellesley; Cambridge Press: Cambridge, UK, 1997. [Google Scholar]
- Teunissen, P.J.; Montenbruck, O. Springer Handbook of Global Navigation Satellite Systems; Springer: Berlin/Heidelberg, Germany, 2017; Volume 1. [Google Scholar]
- Sanz Subirana, J.; Juan Zornoza, J.; Hernández-Pajares, M. GNSS Data Processing, Volume I: Fundamentals and Algorithms; ESA Communications, ESTEC: Noordwijk, The Netherlands, 2013; pp. 145–161. [Google Scholar]
- Bent, R. Bent ionospheric model (1972). Planet. Space Sci. 1992, 40, 545. [Google Scholar] [CrossRef]
- Parkinson, B.W.; Spilker, J.J., Jr. (Eds.) Global Positioning System: Theory and Applications; AIAA: Washington, DC, USA, 1996; Volume I. [Google Scholar]
- Petovello, M. How Do Measurement Errors Propagate into GNSS Position estimates? InsideGNSSs 2014, 2014, 30–34. Available online: https://www.insidegnss.com/wp-content/uploads/2018/01/IGM_julaug14-solutions.pdf (accessed on 6 November 2021).
- Filic, M.; Filjar, R. Forecasting Model of Space Weather-Driven GNSS Positioning Performance; LAP LAMBERT Academic Publishing: Chisinau, Moldova, 2018. [Google Scholar]
- Booker, H. Morphology of Ionospheric Storms. Proc. Natl. Acad. Sci. USA 1954, 40, 931. [Google Scholar] [CrossRef][Green Version]
- Mendillo, M. Storms in the ionosphere: Patterns and processes for total electron content. Rev. Geophys. 2006, 44. [Google Scholar] [CrossRef]
- Filić, M.; Filjar, R. On correlation between SID monitor and GPS-derived TEC observations during a massive ionospheric storm development. In Proceedings of the 2019 URSI Asia-Pacific Radio Science Conference (AP-RASC), New Delhi, India, 9–15 March 2019; pp. 1–4. [Google Scholar]
- Bilitza, D.; Brown, S.A.; Wang, M.Y.; Souza, J.R.; Roddy, P.A. Measurements and IRI model predictions during the recent solar minimum. J. Atmos. Sol.-Terr. Phys. 2012, 86, 99–106. [Google Scholar] [CrossRef]
- Gustaffson, F. Statistical sensor Fusion, 2nd ed.; Studentlitteratur; Linkoepping University: Linkoepping, Sweden, 2010. [Google Scholar]
- Filic, M.; Filjar, R. Modelling the Connection between GNSS Positioning Performance Degradation, and Space Weather and Ionospheric Conditions using RReliefF Features Selection. In Proceedings of the 31st International Technical Meeting of the Satellite Division of The Institute of Navigation (ION GNSS+ 2018), Miami, FL, USA, 24–28 September 2018; pp. 1999–2006. [Google Scholar]
- Radicella, S.M. The NeQuick model genesis, uses and evolution. Ann. Geophys. 2009, 52, 417–422. [Google Scholar]
- Mehmood, M.; Saleem, S.; Filjar, R.; Naqvi, N.A.; Ahmed, A. Total Electron Content (TEC) estimation over Pakistan from local GPS network using spherical harmonics. Ann. Geophys. 2021, 64, GD102. [Google Scholar] [CrossRef]
- Sandford, W. The impact of solar winds on navigation aids. J. Navig. 1999, 52, 42–46. [Google Scholar] [CrossRef]
- Filjar, R.; Huljenić, D. The importance of mitigation of GNSS vulnerabilities and risks. Coordinates 2012, 8, 14–16. [Google Scholar]
- GSA, GNSS user needs and requirements library. Prague, Czechia: EU Agency for Space Programme (EUSPA) (former: GSA), 2019. Available online: https://www.euspa.europa.eu/euspace-applications/euspace-users/user-needs-and-requirements (accessed on 6 November 2021).
- Thomas, M.; Norton, J.; Jones, A.; Hopper, A.; Ward, N.; Cannon, P.; Ackroyd, N.; Cruddace, P.; Unwin, M. Global Navigation Space Systems: Reliance and Vulnerabilities; The Royal Academy of Engineering: London, UK, 2011. [Google Scholar]
- Liu, S.; Zhao, Q.; Chen, G.; Hu, Z.; Chao, N. Comparison of Single-Site Ionospheric Delays Derived from Geometry-Free and Geometry-Based Approaches with an Analysis of Orbit and Clock Error Effects. Atmosphere 2021, 12, 703. [Google Scholar] [CrossRef]
- Metoffice. Volcanic ash Prediction Charts. 2021. Available online: http://bit.ly/1PkwRcd (accessed on 4 January 2016).
- Semaala, G. GPS-TEC Software and Documentation. Available online: seemala.blogspot.com (accessed on 5 January 2021).
- Takasu, T. RTKLIB: An Open Source Program Package for GNSS Positioning. Software and Documentation. 2013. Available online: http://www.rtklib.com/ (accessed on 6 November 2021).
- Zhizhin, M.; Kihn, E.; Redmon, R.; Medvedev, D.; Mishin, D. Space physics interactive data resource—SPIDR. Earth Sci. Inform. 2008, 1, 79–91. [Google Scholar] [CrossRef][Green Version]
- Petrovski, I.; Glonass, G. BeiDou for Mobile Devices: From Instant to Precise Positioning; Cambridge University: Cambridge, UK, 2014. [Google Scholar]
- Cheng, N.; Song, S.; Li, W. Multi-Scale Ionospheric Anomalies Monitoring and Spatio-Temporal Analysis during Intense Storm. Atmosphere 2021, 12, 215. [Google Scholar] [CrossRef]
- R Development Core Team. R: A Language and Environment for Statistical Computing; R Foundation for Statistical Computing: Vienna, Austria, 2016; ISBN 3-900051-07-0. Available online: http://www.R-project.org (accessed on 5 February 2016).
- Memarzadeh, Y. Ionospheric Modelling for Precise GNSS Applications (PhD Thesis). Technical University of Delft: Delft, The Netherlands, 2009. Available online: https://www.ncgeo.nl/index.php/en/publicatiesgb/publications-on-geodesy/item/2582-pog-71-memarzadeh-ionospheric-modeling-for-precise-gnss-applications (accessed on 6 November 2021).
- Estey, L.; Wier, S. Teqc Tutorial: Basics of Teqc Use and Teqc Products; UNAVCO Inc.: Colorado, CO, USA, 2014. [Google Scholar]
- SPIDR. Space Phyiscs Interactive Data Resource. National Geophysical Data Center, NOAA Satellite and information Service. 2016. Available online: http://spidr.ngdc.noaa.gov/spidr/home.do (accessed on 3 February 2016).


Publisher’s Note: MDPI stays neutral with regard to jurisdictional claims in published maps and institutional affiliations. |
© 2021 by the authors. Licensee MDPI, Basel, Switzerland. This article is an open access article distributed under the terms and conditions of the Creative Commons Attribution (CC BY) license (https://creativecommons.org/licenses/by/4.0/).