Abstract
This study aimed to assess the health effects of emissions released by cement industries and allied activities, such as mining and transportation, in the salt range area of district Chakwal, Pakistan. DISPER was used to estimate dispersion and contribution of source emission by cement industries and allied activities to surface accumulation of selected pollutants (PM2.5, PM10, NOx, and O3). To assess the long-term effects of pollutants on human health within the radius of 500 m to 3 km, Air Q+ software was used, which was designed by the World Health Organization (WHO). One-year average monitoring data of selected pollutants, coordinates, health data, and population data were used as input data for the model. Data was collected on lung cancer mortality among different age groups (25+ and 30+), infant post-neonatal mortality, mortality due to respiratory disease, and all-cause mortality due to PM2.5 and NO2. Results showed that PM2.5 with the year-long concentration of 27.3 µg/m3 contributes a 9.9% attributable proportion (AP) to lung cancer mortality in adults aged 25+, and 13.8% AP in adults age 30+. Baseline incidence is 44.25% per 100,000 population. PM10 with the year-long concentration of 57.4 µg/m3 contributes 16.96% AP to infant post-neonatal mortality and baseline incidence is 53.86% per 1000 live births in the country. NO2 with the year-long concentration of 14.33 µg/m3 contributes 1.73% AP to all-cause mortality. Results obtained by a simulated 10% reduction in pollutant concentration showed that proper mitigation measures for reduction of pollutants’ concentration should be applied to decrease the rate of mortalities and morbidities. Furthermore, the study showed that PM2.5 and PM10 are significantly impacting the human health in the nearby villages, even after mitigation measures were taken by the selected cement industries. The study provides a roadmap to policymakers and stakeholders for environmental and health risk management in the area.
1. Introduction
Kallar Kahar is an internationally important area—having the second-largest salt range of the world, the historic Katas Raj temple, and some associated wetlands. The area is enriched with limestone and clay; hence, it has an attraction for the establishment of cement industries due to the emerging demand for cement from the China–Pakistan Economic Corridor (CPEC). Air pollution is an emerging issue in some parts of the salt range (Kallar Kahar), due to established cement industries, and it may become worse due to some proposed cement industrial plants in the area. The area was selected to provide a road map for sustainable environmental management. The outcome of this research work will provide guidelines for sustainable solutions to the decision makers. Respiratory and some other health issues have been reported in the salt ranges of Pakistan. The health risk assessment of air pollution has been performed by using the WHO-recognized Air Q+ model in this study [1]. Globally, a huge number of countries suffers with poor air quality due to emissions of particulate matter (PM2.5 and PM10), which have adverse human health impacts [2]. PM (PM2.5 and PM10) is the main pollutant responsible for health issues in the study area. It has been assessed through pollution dispersion modeling that the main contributor in the particulate matter is the cement industry, which is going to expand in the near future due to the increasing demand for cement in the country due to CPEC projects. Positive relationships and diverse adverse effects of PM2.5 have been shown in long and short-term exposures during past epidemiological studies [3].
Chronic obstructive pulmonary disease and ischemic heart disease are caused due to short-term exposure to PM2.5 [4]. Respiratory, cardiovascular, and lung cancer problems are associated with long-term exposure of people to such toxic pollutants. An increase of 10 µg/m3 of PM2.5 results in an increase of 8% in lung cancer mortality [5]. Particulate matter is considered to be among group 1 of carcinogenic and lung cancer-causing elements by the International Agency for Research on Cancer (IARC) [6]. The number of deaths (hospital admissions) caused by a particular pollutant in a specific region is measured through numerical/mathematical modeling approaches. For proper management, the number of deaths caused by air pollution must be known for the surrounding area of the workers. The results help policymakers and authorities to assign financial resources sustainably. Extra hospital admissions, deaths, and extra medication may put health care systems under many burdens [7]. Air Q+ is a new tool proposed by the WHO for health impact assessment. This software helps to find the relationship between air pollution and public health. To get quantitative measurements of health impacts and the number of diseases caused by outdoor air pollutants (PM10, PM2.5, O3, NO2, and black carbon), Air Q+ was developed in 2016. This software evaluates both the long- and short-term mortality and morbidity of air pollutants. Household air pollution from solid fuel (SFU) can also be assessed by this mode [1] .
Exposure to ambient air pollution has caused more than 3.7 million deaths globally [8]. Low–middle-income countries in South and East Asia countries have one-fourth of air pollution-related causalities, due to having the highest levels of coarse and fine particulate matters [9]. As it is difficult to obtain data, most of the studies to assess the relationship between air pollution and health impacts have been conducted in countries that already have monitoring systems, such as China [10]. South Asian countries such as Pakistan require more attention where population increase (107 million in 1990 to 197 million in 2017) is putting pressure on economic growth, and, ultimately, air pollution due to vehicles and industries is increasing rapidly [11]. Though its relation to air pollution is very complex, an enormous increase in coronary artery disease and hypertension has been observed in urban regions of Pakistan [12,13]. Air pollution is one of the main avoidable dangers to wellbeing around the world. It has been named the “silent killer” by the WHO. As indicated by the WHO, non-communicable infections are the universally driving reason for mortality. Around 71% of 56 million mortality that happened worldwide in 2015 are ascribed to non-communicable infections, essentially cardiovascular sicknesses (31%), tumors, diabetes, and lung illnesses. In Europe, CVD represents 45% of the death rate, and inside the 28 nations of the European Union (EU-28) it is 37%. This adds up to 2.14 million and 1.85 million mortality each year respectively [14,15,16].
Sulfate, nitrate, ammonium, elemental carbon, organic carbon, silicon, and sodium ion are chemical components of PM that may contribute more than 1% of PM2.5 mass on a monthly or annual basis [17]. When NO2 is exposed to ultraviolet radiation, it undergoes a complex sequence of interactions with hydrocarbons to produce photochemical smog, which is a mixture of ozone, nitric acid, aldehydes, peroxyacyl nitrates (PANs), and other secondary pollutants, which may be present in the form of PM in the atmosphere.
Increased morbidity and mortality associated with heart and respiratory diseases are caused by air pollution with specific exposure to airborne PM. The latest data shows that ambient air pollution is a major environmental health problem. Exposure to PM2.5 has caused approximately 4.2 million premature deaths globally and 0.5 million in the European region. For non-communicable diseases (NCD), air pollution is an important risk factor. Air pollution is recognized as one of the five major risk factors along with alcohol usage, tobacco smoking, unhealthy diets, and physical inactivity. This was declared in United Nations’ high-level meetings on NCD held in September 2018. Increased global responses have been made to the adverse health effects of air pollution in 2016, which were adopted at the sixty-ninth World Health Assembly. Besides air pollution, other kinds of contamination (water, soil, etc.) are also increasing the incidence of health and wellbeing threats. The presence of pollutants in soil could clog the pores, which results in decreased aeration and water infiltration capacity, and also increased bulk density. Application of salts that are ionic in nature might improve these soil properties [18].
Due to the fundamental framework for the actions of UN member-state countries, stakeholders, and the WHO, the health department of Pakistan has taken a lead in raising awareness about the impacts of air pollution on public health. The framework has proved to be a major step in accelerated global response in four disciplines: strengthening of institutional capacity, vast knowledge base, monitoring/reporting, and global leadership and coordination. Target 3.9 of the UN sustainable development goals (SDGs) states that deaths and illnesses caused by hazardous air pollutants must be reduced by 2030. Target 7.1 ensures reliable and affordable access to modern energy services. Target 11.6 emphasizes minimizing per capita environmental impacts on cities by giving special attention to air quality, and municipal and other waste management. In Pakistan’s Mines and Minerals Department, Punjab has been declared a designated negative area in the salt range, which is limestone mountainous contour, due to water preservation, pollution, and the international importance of Katas Raj Temple. The adjacent area has been utilized by new cement industries for the lease and establishment of cement factories without keeping in view the health impacts and the contouring of the area, which is one of the factors that entraps the air pollution. The trapped air pollution in the low-lying areas impact the health of the people significantly and the number of villages has been pointed out in the study that are susceptible to be impacted in the future if new cement industries are allowed to be established without keeping in view the health risks of air pollution and contouring of the area [19]. As the air pollutants such as PM2.5, PM10, CO, CO2, SOx, and other volatile substances have numerous other health risks to the affected victims, tree plantation could be beneficial for improvement of air quality [20].
2. Materials and Methods
The health risk assessment model of the World Health Organization (WHO), the AirQ+, was used to estimate the attributable proportion of ambient pollutants (PM2.5, PM10, NO2, O3) concentration, to mortality due to lung-cancer, post-neonatal, all-cause, and respiratory-disease mortality, on the nearby residents of the selected study area. The study area is shown below in Figure 1.
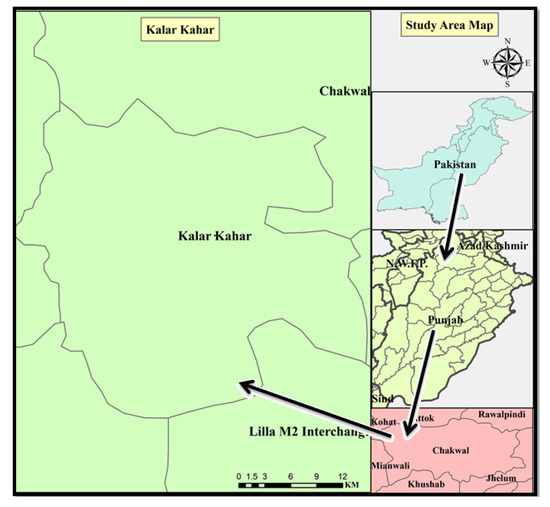
Figure 1.
Study area map of sampling site (Kalar Kahar). It is located in Chakwal district of Punjab Province in Pakistan.
Three cement industries (A, B, and C) were selected in the study area and were supposed to be possible health impactors in the nearby villages (the human settlements). Biomass and fossil fuel burning were the processes observed at the selected cement plants; source emission was correlated with actual measured data for ambient air quality data. Source emission data was modulated through the DISPER model for a possible contribution of selected three cement industries present within the radius of approximately 3 km, and there is no significant source of air pollution in the area, except allied transportation activities. Source emissions of these industries were measured with a flue gas analyzer, and an isokinetic sampler was used to measure stack PM and pollution dispersion modeling was conducted to compare the data with the measured ambient air data for a year-long period. The ambient air data was collected by an ambient air monitoring station using the US-EPA method [21], as given in Table 1.

Table 1.
Details of ambient air quality monitoring instruments.
Actual monitored data for the whole calendar year of ambient air quality was incorporated in the Air Q+ model. Mortality, morbidity, and the population of certain age groups were collected through different sources including the bureau of statistics, research study, and the health department of Punjab, Pakistan, and probable data was cross-checked by a questionnaire. Site coordinates were taken using a global positioning system (GPS) device. The health data and population data were collected through different sources like the bureau of statistics, research works, the health department of Punjab, and World Bank data on health for Pakistan.
Air Q+ software is used in ecological studies with focus on epidemiological data to estimate the effects of pollutants on the population of a specific area and period. It is recommended software by the WHO. This software is based on the gravimetric method and statistical equations. It correlates air quality data with epidemiological parameters, i.e., attributable proportion (AP), relative risk (RR), baseline incidence (BI), and percentage mortality per 100,000 persons. The RR is defined as the likelihood of disease due to exposure to a pollutant. The RR and BI values were taken from the data files of AirQ+ developed by the WHO [22]. Annual data of PM2.5, PM10, NOx, and ozone concentrations of the year 2018 were collected by monitoring in the selected areas by an ambient air quality monitoring station. The AirQ+ model does not account for the wind speed and wind direction. Inputs required for health impact assessment through the AirQ+ model are given in Figure 2 [23]. The data was processed by Microsoft Excel, and simulated results were obtained to predict the reduction in RR values by decreasing the pollutants concentrations.
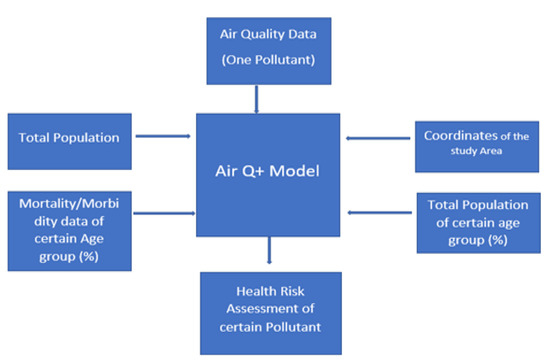
Figure 2.
Input data required for the Air Q+ model.
The instruments were dually calibrated before the monitoring and ambient air quality data were compared with source emission data. The source emission data was modeled through a dispersion model to compare the actual measured data of ambient air quality. Secondly, as there is no other industry near the selected cement industries, a possible contributor could be vehicles visiting these cement industries, which is one of the components of these cement industries contributing to air pollution which was not excluded. All calculations performed by AirQ+ are based on methodologies and concentration response functions established by epidemiological studies. The concentration–response functions used in the software are based on the systematic review of all studies available and their meta-analysis.
There are different models used for air quality. GEOS-Chem provides estimates of global annual mean concentrations of PM2.5 and other pollutants [24]. GEOSChem can be used to simulate annual average of PM, AirQ+ is used for health risk assessment using surface-measured data, and for assimilation of data the DISPER model was used in the present study. According to Lee et al., GEOSChem provides daily average concentrations of PM2.5 on surfaces [25]. The model differs from AirQ+ software, which provides the relative risk of mortality due to exposure to certain pollutants. GEOS-Chem is the chemical transport model, which provides air pollution assimilation. In the present study, the DISPER model has been used to assimilate and estimate the air pollution contribution by cement plant clusters. The model data was compared with the actual surface data of air pollution monitoring by the ambient air quality station owned by Pak Green Enviro-Engineering Pvt. Ltd., Lahore (Pakistan). BenMAP (Environmental Benefits Mapping and Analysis Program, version 4.0.67), can be used to calculate the health impacts of exposure to Black Carbon (BC), after the assimilation of data by the GEOS-Chem air quality model [26].
The research is based on “air quality data” to predict the possible impact for one year in the study area. One year of data was the requirement for the AirQ+ model, the metrological data for the last five years is available for the study area, there is a slight variation in metrological data, and the variation of ambient air pollutant concentration data depends upon mitigation taken in the air to control the pollution. Ambient air quality is directly correlated with metrological data and vice versa [27].
3. Results
Monitoring data of the ambient air pollutants released during the year 2018 was used in this study. Trends of different pollutants throughout the year are given in Figure 3.
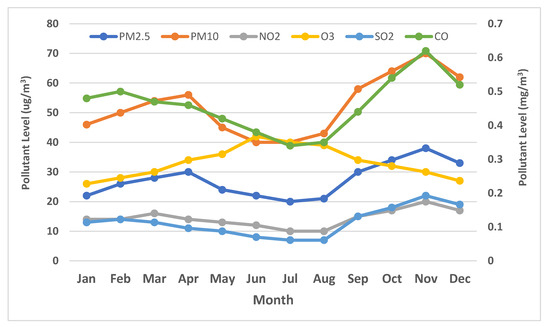
Figure 3.
Ambient air pollutants measured throughout the year. Months are given on the X-axis and pollutants’ concentration is given on the Y-axis (right side for level of CO in mg/m3 and left side for level of PM2.5, PM10, NO2, O3, and SO2 in µg/m3).
The means of measured data of each pollutant was incorporated in the AirQ+ model along with the data of mortality of certain age groups, total population, total population of certain age groups, and study area coordinates.
The calculated health impacts of the AirQ+ model of NO2 pollutants are presented in Figure 4. Results showed that the mean concentration of NO2 observed during the study was 14.33 µg/m3 and its effect on human health was determined. The total population at risk was 21,628 and relative risk (RR) was 1.01. The estimated attributable proportion was 1.73% and the estimated number of attributable cases per 100,000 population was 12.95. During the 2016–2017 period in Ahvaz, Iran, the natural all-cause mortality rate in adults aged 30+ years due to NO2 was 806.56 per 100,000 population when the population at risk was 581,881, which is quite close to the present study [28]. The estimated attributable proportion (1.73%) of NO2 is lesser than those of PM10 and PM2.5, hence the NO2 pollutant is impacting health comparatively less in all-cause mortality.
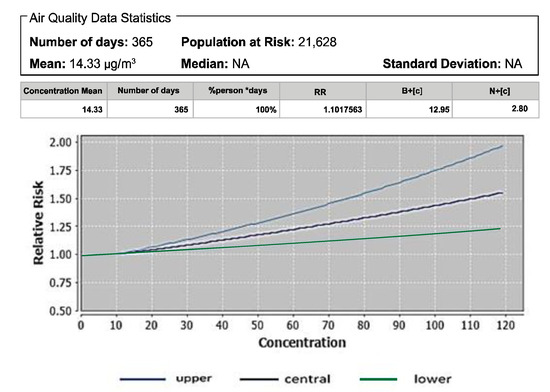
Figure 4.
Relative risk due to NO2 exposure.
The calculated health impacts of the AirQ+ model of PM2.5 was observed on adults aged 30+ for all-cause mortality after input of all data. Figure 5 shows values of RR, AP, and BI for all pollutants and their mortality rates. Results showed that the population at risk was 7786, out of which the attributable proportion was 9.9% and relative risk was 1.10. This ratio of RR showed an increased estimated number of attributable cases. The percentage of AP in the present study is in line with the study conducted by Yarahmadi et al., where all-cause mortality from PM2.5 showed AP 12.09% during the 2013–2016 period. Hence, PM2.5 is significantly contributing to the all-cause mortality among the 30+ age group.
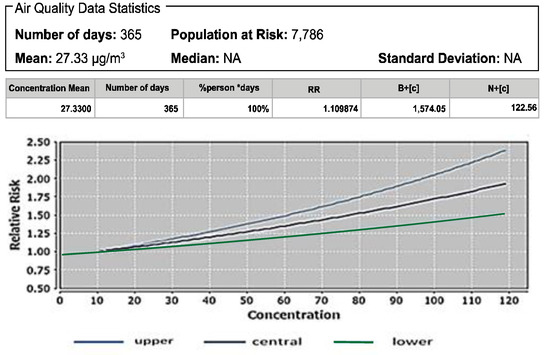
Figure 5.
Relative risk due to PM2.5 exposure (all-cause mortality in adults aged 30+).
The effect of PM2.5 was determined to evaluate lung-cancer mortality in adults aged 30+ years. The mean concentration was 27.33 µg/m3, as shown in Figure 6. The total population at risk was 7786, out of which the estimated attributable proportion was 13.88% which gave a central relative risk of 1.16. This result is in close agreement with the study conducted in Tehran, which showed RR 1.199 for the years 2015–2016 and AP 17.44% for lung cancer mortality [29]. Several studies identified PM exposure as a major cause of lung cancer and relative risks range from 3.36–0.91 [30]. During another study in the period 2014–2017 in Iran, Karimi et al. reported the effect of PM2.5 on mortality due to lung cancer among adults aged 30+ years, where the attributable proportion was 30.56 per 100,000 persons. Results are similar to the study in which Gharavandi et al. reported that PM2.5 exposure causes lung cancer mortality [31]. Hence PM2.5 is significantly contributing to lung cancer mortality in the 30+ age group.
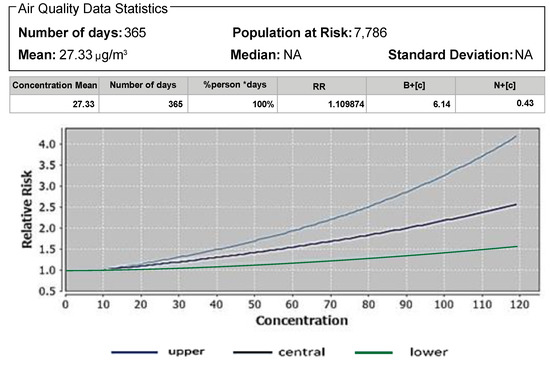
Figure 6.
The relative risk of PM2.5 exposure (lung cancer mortality in adults age 30+).
The AirQ+ model predicts the “attributable proportion” or relative risk to mortality of a certain age group due to the pollutant concentration. The attributable proportion will increase with the increase in the concentration of a certain pollutant. For example, the annual concentration of PM2.5 was 27.33 µg/m3 as compared to the WHO standard of 10 µg/m3; and mortality due to lung cancer in the 25+ age group is 44 out of 10,000 population. AirQ+ predicted that the attributable proportion of PM2.5 with a concentration of 27.33 µg/m3 will be 9.8%. If the concentration remains within the limit of 10, the WHO standard, the relative risk will be nil.
3.1. Atributale Proportion and Relative Risks of Pollutants
Attributable proportion and relative risks of each pollutant are given in Table 2, the outcomes of the AirQ+ model.

Table 2.
AP and RR of mortality resulting from pollutants.
The effect of PM2.5 was determined to evaluate lung-cancer mortality in adults aged 30+ years. The mean concentration was 27.33 µg/m3 as shown in Figure 7. The total population at risk was 7786, out of which the estimated attributable proportion was 13.88%, which gave central relative risk 1.16. The upper and lower values for RR are shown by different colors in Figure 2. Our study is in close agreement with the study conducted in Tehran, which showed RR of 1.199 for the 2015–2016 period and AP 17.44% for lung cancer mortality [34]. Several studies identified PM exposure as a major cause of lung cancer, and relative risks range from 3.36–0.91. During another study during the years 2014–2017 in Iran, Karimi et al. reported that the attributable proportion of PM2.5 on mortality due to lung cancer in adults aged 30+ years was 30.56 per 100,000 persons [35]. Our results are similar to the study reported by Gharavandi et al., that PM2.5 exposure causes lung cancer mortality. The main section of cement production during which workers are exposed to PM2.5 is raw material grinding. Cement dust contains silica that can cause silicosis, reducing the ability of the lungs to absorb oxygen [31]. Hence PM2.5 is significantly contributing to the lung cancer mortality in the 30+ age group.
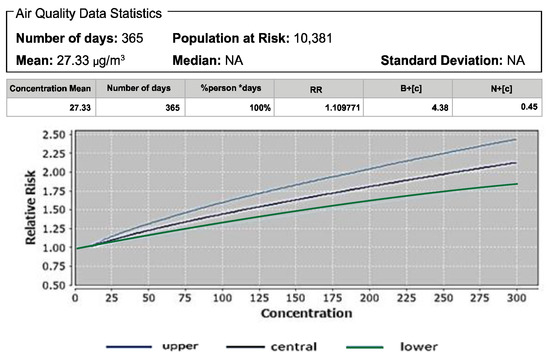
Figure 7.
Lung-cancer mortality resulting from PM2.5 exposure in adults age 30+.
3.2. Effects of PM10 on Post-Neonatal Infant Mortality
The effect of PM2.5 on mortality due to lung cancer in adults aged 25+ years was also studied. Our results demonstrated that the mean concentration of PM2.5 was 27.33 µg/m3. This effect was studied per 100,000 population, out of which 48% of the population was at risk and relative risk was 1.10. Figure 8 also shows the upper, lower, and central values for RR. The attributable proportion was 9.89%. Ansari and Ehrampoush showed the RR 1.062 due to long-term PM2.5 exposure between the years 2017–2018 at concentrations above 10 µg/m3, which is less than the RR value obtained in our study [36].
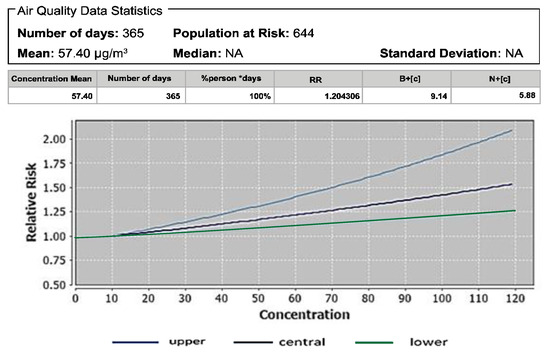
Figure 8.
Relative risk due to PM10 exposure (post-neonatal mortality).
The studies during 2006–2011 showed that the concentration of PM2.5 ranged from 14.3–52.5 µg/m3. The attributable proportion in their study for different cities was recorded, with maximum AP of 41.3% in Cracow and minimum AP 19.5% in Szczecin [37]. Pope et al. showed mortality hazard ratios due to PM2.5 exposure at 10 µg/m3 elevation, with all-cause mortality at 1.06 and cardiovascular mortality 1.34 in the adult population of the U.S. [38]. The study conducted by Guo et al., in China showed overall 51,219 deaths associated with PM2.5 in 2005 and relative risk was 1.08. The attributable proportion due to lung cancer was 13.7% with variations in age and gender. The AP and RR of our study are quite close to this study done in China [39]. Similarly, Yarahmadi et al., reported 5073 deaths due to long-term exposure to PM2.5 [29]. Faridi et al., showed a positive correlation with temperature and PM2.5 in Iran, while no correlation was found between precipitation and particulates. This is in line with the correlation observed in another study [32]. A significant increase in mortalities was observed with the increase of every 10 µg/m3 PM2.5 concentration. An increase in hypertension deaths was also observed due to PM10 exposure with increasing concentrations [40].
The effects of PM10 on post-neonatal infant mortality were studied in the present study, and Figure 8 shows an incidence rate of 53.86 per 1000 live births in a year and that 100% of the population was at risk. The mean concentration recorded was 57.39 µg/m3. The estimated number of attributable cases per 1000 population at risk was 9.14 while the relative risk was 1.20. The estimated attributable proportion was 16.96%. In Tehran, during 2006–2017 the estimated attributable proportion of PM10 ranged from 7.9–28.7% for postneonatal infant mortality [41]. Mehmood et al. reported in Pakistan that post-neonatal infant mortality due to long-term exposure to PM10 occurred 52.1 times per 100,000 population. In Islamabad, 239 deaths of post-neonatal infant mortality were observed during 2017 [42]. The concentration of PM10 was found to be 195.5 µg/m3 during 2012–13 and Habeeb Ullah et al. showed that this concentration was higher than the standards set by the Saudi Arabian Presidency of Meteorology and Environment and European Commission standards. This high concentration caused negative health in children and vulnerable groups of people [43].
3.3. Mortality Resulting from O3 Exposure
The ozone concentration was also measured in the surroundings of cement industries and Figure 9 shows that the mean concentration recorded during the entire period was 0.0909 µg/m3. The mortality rate due to respiratory diseases was estimated and it showed that 100% of the population was at risk and that relative risk was 1.00 with attributable proportion of 0.01%. The concentration was not very high; therefore, zero estimated attributable cases were observed, whereas the estimated number of attributable cases per 100,000 population at risk was 0.02. Tian et al., showed an annual mean concentration of ozone ranging between 53 µg/m3 to 117 µg/m3 and it caused a varied number of hospital admissions due to seasonal change. The study reported 24, 26, and 28 hospital admissions during the warm, full-year, and cool periods, respectively [44]. The respiratory mortality for O3 exposure caused the deaths of 173 persons with RR 1.004 and AP 6.1722% in a study conducted by other researchers. The value of RR is similar to that of our study.
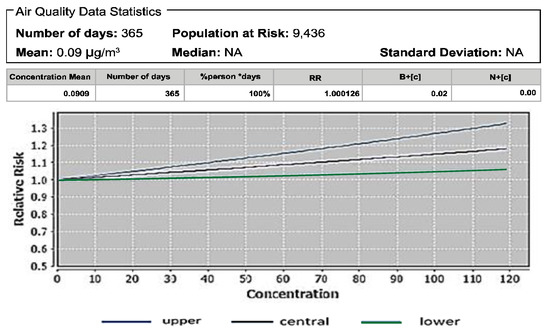
Figure 9.
Respiratory disease mortality resulting from O3 exposure.
3.4. Change in Relative Risk Value by 10% Reduction in Pollutant Concentrations
Significant relative risk was reduced by 10% reduction in pollutant concentration input to the AirQ+ model, as shown in the below Table 3. It shows the change in relative risk values by lowering the concentration of pollutants by 10%. A clear difference was observed for all-cause mortality due to PM2.5 and post-neonatal mortality due to PM10. The RR value for PM2.5 at 27.33 µg/m3 was 1.10, while at 24.60 µg/m3 the relative risk changed to 1.09. This depicts that long-term exposure to lower concentrations will cause a low health risk. For PM10, RR was 1.20 at 57.39 µg/m3, while when the concentration dropped to 47.10 the RR was found to be 1.15. It can be predicted that further reductions in pollutant concentration can surely reduce the risk factor to the lowest level.

Table 3.
Change in RR value by 10% reduction in concentrations.
4. Conclusions
Long-term effects of PM2.5, PM10, NOx, and O3 on human health were investigated by using AirQ+ software. Concentrations of PM2.5 and PM10 observed in the salt range area (Kallar Kahar) during the year 2018 were much higher than the WHO guidelines, while NOx and O3 were within safe limits. Results obtained by AirQ+ software indicated that the highest value of RR (1.20) for post-neonatal mortality was due to PM10, while lung cancer mortality due to PM2.5 in the age groups 25+ and 30+ was 1.10 and 1.16, respectively. The RR value for all-cause mortality (age 30+) due to PM2.5 was 1.10 and for NO2 was 1.01, while for respiratory disease mortality due to O3 RR value was 1.00. It means that the long-term effects of PM10 were more than those of other pollutants. In other words, attributable health effects of NO2 and O3 were lesser compared to those of PM2.5 and PM10. The estimated attributable proportion resulting from PM10 for post-neonatal infant mortality was highest, with an upper limit of 27.44%, while attributable health effects due to ozone were low (0.02%) and insignificant. Probable human health risks can be decreased if a 10% reduction in pollutant concentration is achieved by controlling pollutants and by implementing eco-friendly production strategies.
The results indicated that PM2.5 and PM10 have significant impacts on the health of the local community present in the selected study area. However, NO2 and O3 have a comparatively lesser impact on human health in the area. Hence, it has been proved by the study that ambient air pollutants primarily generated by the selected cement industries (A, B, and C) are significantly impacting the health of the local community present around the industries.
Author Contributions
Conceptualization, A.H.N.; Writing—Original draft preparation, A.H.N.; Sampling design, A.H.N.; Data Acquisition, A.H.N.; Data curation, R.H.; Supervision, R.N.; Data interpretation, R.H.; Manuscript revision, R.H., M.A.I.; Writing—Review and Editing; A.H.N., M.A.I. All authors have read and agreed to the published version of the manuscript.
Funding
The present research did not receive any grant from funding agencies in the public, commercial, or not-for-profit sectors.
Institutional Review Board Statement
Not applicable.
Informed Consent Statement
Not applicable.
Data Availability Statement
Data are contained within the article.
Acknowledgments
The authors acknowledge the Department of Environmental Management, National College of Business Administration and Economics (NCBA&E), Lahore and Department of Environmental Sciences, The University of Lahore, Lahore. Thanks are extended to Pak Green Enviro-Engineering Pvt. Ltd., Lahore Pakistan for providing technical support during this research study. This paper is part of the PhD dissertation of the first author.
Conflicts of Interest
The authors declare that no known competing, financial or personal interests could have appeared to influence the work reported in this paper.
References
- Mudu, P.; Gapp, C.; Dunbar, M.; World Health Organization. AirQ+: 1.0 Example of Calculations (No. WHO/EURO: 2016-4103-43862-61760); World Health Organization, Regional Office for Europe: Geneva, Switzerland, 2016. [Google Scholar]
- Omidi Khaniabadi, Y.; Sicard, P.; Omidi Khaniabadi, A.; Mohammadinejad, S.; Keishams, F.; Takdastan, A.; Najafi, A.; De Marco, A.; Daryanoosh, M. Air quality modeling for health risk assessment of ambient PM10, PM2.5 and SO2 in Iran. Hum. Ecol. Risk Assess. Int. J. 2019, 25, 1298–1310. [Google Scholar] [CrossRef]
- Xayasouk, T.; Lee, H.; Lee, G. Air pollution prediction using long short-term memory (LSTM) and deep autoencoder (DAE) models. Sustainability 2020, 12, 2570. [Google Scholar] [CrossRef]
- Khamutian, R.; Najafi, F.; Soltanian, M.; Shokoohizadeh, M.J.; Poorhaghighat, S.; Dargahi, A.; Sharafi, K.; Afshari, A. The association between air pollution and weather conditions with increase in the number of admissions of asthmatic patients in emergency wards: A case study in Kermanshah. Med. J. Islamic Repub. Iran 2015, 29, 229. [Google Scholar]
- Traversi, D.; Schilirò, T.; Degan, R.; Pignata, C.; Alessandria, L.; Gilli, G. Involvement of nitro-compounds in the mutagenicity of urban PM2. 5 and PM10 in Turin. Mutat. Res./Genet. Toxicol. Environ. Mutagenesis 2011, 726, 54–59. [Google Scholar] [CrossRef]
- Pope, C.A., III; Burnett, R.T.; Thun, M.J.; Calle, E.E.; Krewski, D.; Ito, K.; Thurston, G.D. Lung cancer, cardiopulmonary mortality, and long-term exposure to fine particulate air pollution. JAMA 2002, 287, 1132–1141. [Google Scholar] [CrossRef]
- Loomis, D.; Grosse, Y.; Lauby-Secretan, B.; El Ghissassi, F.; Bouvard, V.; Benbrahim-Tallaa, L.; Guha, N.; Baan, R.; Mattock, H.; Straif, K.; et al. The carcinogenicity of outdoor air pollution. Lancet Oncol. 2013, 14, 1262–1263. [Google Scholar] [CrossRef]
- Byford, S.; Torgerson, D.J.; Raftery, J. Cost of illness studies. BMJ 2000, 320, 1335. [Google Scholar] [CrossRef]
- World Health Organization. Ambient Air Pollution: A Global Assessment of Exposure and Burden of Disease; World Health Organization: Geneva, Switzerland, 2016. [Google Scholar]
- World Health Organization. Burden of Disease from Household Air Pollution for 2012; Summary of Results; World Health Organization: Geneva, Switzerland, 2014. [Google Scholar]
- Atkinson, R.W.; Mills, I.C.; Walton, H.A.; Anderson, H.R. Fine particle components and health—a systematic review and meta-analysis of epidemiological time series studies of daily mortality and hospital admissions. J. Expo. Sci. Environ. Epidemiol. 2015, 25, 208. [Google Scholar] [CrossRef]
- Yamamoto, S.; Phalkey, R.; Malik, A. A systematic review of air pollution as a risk factor for cardiovascular disease in South Asia: Limited evidence from India and Pakistan. Int. J. Hyg. Environ. Health 2014, 217, 133–144. [Google Scholar] [CrossRef]
- Irazola, V.E.; Gutierrez, L.; Bloomfield, G.; Carrillo-Larco, R.M.; Prabhakaran, D.; Gaziano, T.; Levitt, N.S.; Miranda, J.J.; Ortiz, A.B.; Steyn, K.; et al. Hypertension prevalence, awareness, treatment, and control in selected LMIC communities: Results from the NHLBI/UHG network of centers of excellence for chronic diseases. Glob. Heart 2016, 11, 47–59. [Google Scholar] [CrossRef]
- WHO (World Health Organization). Global Health Observatory. 2018. Available online: http://www.who.int/gho/ en/ (accessed on 18 October 2018).
- EHN. European Heart Network. European Cardiovascular Disease Statistics 2017; EHN: Brussels, Belgium, 2017. [Google Scholar]
- Chatkin, J.; Correa, L.; Santos, U. External environmental pollution as a risk factor for asthma. Clin. Rev. Allergy Immunol. 2021, 1–18. [Google Scholar] [CrossRef] [PubMed]
- Dominici, F.; Wang, Y.; Correia, A.W.; Ezzati, M.; Pope, C.A., III; Dockery, D.W. Chemical composition of fine particulate matter and life expectancy: In 95 US counties between 2002 and 2007. Epidemiology 2015, 26, 556. [Google Scholar] [CrossRef]
- Hayyat, M.U.; Nawaz, R.; Siddiq, Z.; Shakoor, M.B.; Mushtaq, M.; Ahmad, S.R.; Ali, S.; Hussain, A.; Irshad, M.A.; Alsahli, A.A.; et al. Investigation of Lithium Application and Effect of Organic Matter on Soil Health. Sustainability 2021, 13, 1705. [Google Scholar] [CrossRef]
- Jafar, T.H.; Qadri, Z.; Chaturvedi, N. Coronary artery disease epidemic in Pakistan: More electrocardiographic evidence of ischaemia in women than in men. Heart 2008, 94, 408–413. [Google Scholar] [CrossRef] [PubMed]
- Irshad, M.A.; Nawaz, R.; Ahmad, S.; Arshad, M.; Rizwan, M.; Ahmad, N.; Nizami, M.; Ahmed, T. Evaluation of Anticipated Performance Index of Tree Species for Air Pollution Mitigation in Islamabad, Pakistan. J. Environ. Sci. Manag. 2020, 23, 50–59. [Google Scholar]
- Gobeli, D.; Schloesser, H.; Pottberg, T. Met one instruments BAM-1020 beta attenuation mass monitor US-EPA PM2.5 federal equivalent method field test results. In Proceedings of the Air & Waste Management Association (A&WMA) Conference, Kansas City, MO, USA, 24–27 June 2008. [Google Scholar]
- Rendón, A.M.; Salazar, J.F.; Palacio, C.A.; Wirth, V.J.J. Temperature inversion breakup with impacts on air quality in urban valleys influenced by topographic shading. Climatology 2015, 54, 302–321. [Google Scholar] [CrossRef]
- Mirzaei, A.; Tahriri, H.; Khorsandi, B. Comparison between AirQ+ and BenMAP-CE in estimating the health benefits of PM 2.5 reduction. Air Qual. Atmos. Health 2021, 14, 807–815. [Google Scholar] [CrossRef]
- Shaddick, G.; Thomas, M.L.; Green, A.; Brauer, M.; Donkelaar, A.; Burnett, R.; Chang, H.H.; Cohen, A.; Dingenen, R.V.; Dora, C.; et al. Data integration model for air quality: A hierarchical approach to the global estimation of exposures to ambient air pollution. J. R. Stat. Soc. Ser. C (Appl. Stat.) 2018, 67, 231–253. [Google Scholar] [CrossRef]
- Lee, H.-M.; Park, R.; Henze, D.K.; Lee, S.; Shim, C.; Shin, H.-J.; Moon, K.-J.; Woo, J.-H. PM2.5 source attribution for Seoul in May from 2009 to 2013 using GEOS-Chem and its adjoint model. Environ. Pollut. 2017, 221, 377–384. [Google Scholar] [CrossRef]
- Li, Y. Using BenMAP (Environmental Benefits Mapping and Analysis Program) to Evaluate Health Benefits of Air Pollution Control; East Tennessee State University: Johnson City, TN, USA, 2017. [Google Scholar]
- Baldauf, R.W.; Lane, D.D.; Marote, G.A. Ambient air quality monitoring network design for assessing human health impacts from exposures to airborne contaminants. Environ. Monit. Assess. 2001, 66, 63–76. [Google Scholar] [CrossRef]
- Karimi, A.; Shirmardi, M.; Hadei, M.; Birgani, Y.T.; Neisi, A.; Takdastan, A.; Goudarzi, G. Concentrations and health effects of short-and long-term exposure to PM2. 5, NO2, and O3 in ambient air of Ahvaz city, Iran (2014–2017). Ecotoxicol. Environ. Saf. 2019, 180, 542–548. [Google Scholar] [CrossRef] [PubMed]
- Yarahmadi, M.; Hadei, M.; Nazari, S.S.H.; Conti, G.O.; Alipour, M.R.; Ferrante, M.; Shahsavani, A. Mortality assessment attributed to long-term exposure to fine particles in ambient air of the megacity of Tehran, Iran. Environ. Sci. Pollut. Res. 2018, 25, 14254–14262. [Google Scholar] [CrossRef] [PubMed]
- Adeyanju, E.; Okeke, C.A. Exposure effect to cement dust pollution: A mini review. SN Appl. Sci. 2019, 1, 1572. [Google Scholar] [CrossRef]
- Gharavandi, S.; Nasori, M.; Ghobadi, M.; Besharatipur, M.; Jabari, M.; Omidianidost, A. Exposure to Respirable Dust and Crystalline Silica in a Cement Plant. Arch. Occup. Health 2019, 3, 366–370. [Google Scholar] [CrossRef]
- Majeed, F.A.; Azeem, A.R.; Farhan, N. Lung cancer in Pakistan, where do we stand? JPMA J. Pak. Med. Assoc. 2019, 69, 405–408. [Google Scholar] [PubMed]
- Sultana, T.; Afzal, A.; Sultana, S.; Al-Ghanim, K.; Shahid, T.; Jabeen, Z.; Turab, N.; Ahmed, Z.; Mahboob, S. Epidemiological estimates of Respiratory diseases in the hospital population, Faisalabad, Pakistan. Braz. Arch. Biol. Technol. 2017, 60. [Google Scholar] [CrossRef]
- Ansari, M.; Ehrampoush, M.H. Meteorological correlates and AirQ+ health risk assessment of ambient fine particulate matter in Tehran, Iran. Environ. Res. 2019, 170, 141–150. [Google Scholar] [CrossRef] [PubMed]
- Badyda, A.J.; Grellier, J.; Dąbrowiecki, P. Ambient PM2.5 exposure and mortality due to lung cancer and cardiopulmonary diseases in Polish cities. In Respiratory Treatment and Prevention; Springer: Berlin/Heidelberg, Germany, 2016; pp. 9–17. [Google Scholar]
- Pope, C.A.; Ezzati, M.; Cannon, J.B.; Allen, R.T.; Jerrett, M.; Burnett, R.T. Mortality risk and PM 2.5 air pollution in the USA: An analysis of a national prospective cohort. Air Qual. Atmos. Health 2018, 11, 245–252. [Google Scholar] [CrossRef]
- Guo, Y.; Zeng, H.; Zheng, R.; Li, S.; Pereira, G.; Liu, Q.; Chen, W.; Huxley, R. The burden of lung cancer mortality attributable to fine particles in China. Sci. Total Environ. 2017, 579, 1460–1466. [Google Scholar] [CrossRef] [PubMed]
- Faridi, S.; Shamsipour, M.; Krzyzanowski, M.; Künzli, N.; Amini, H.; Azimi, F.; Malkawi, M.; Momeniha, F.; Gholampour, A.; Hassanvand, M.S. Long-term trends and health impact of PM2.5 and O3 in Tehran, Iran, 2006–2015. Environ. Int. 2018, 114, 37–49. [Google Scholar] [CrossRef]
- Dastoorpoor, M.; Riahi, A.; Yazdaninejhad, H.; Borsi, S.H.; Khanjani, N.; Khodadadi, N.; Mohammadi, M.J.; Aghababaeian, H. Exposure to particulate matter and carbon monoxide and cause-specific Cardiovascular-Respiratory disease mortality in Ahvaz. Toxin Rev. 2020, 1–11. [Google Scholar] [CrossRef]
- Barzeghar, V.; Sarbakhsh, P.; Hassanvand, M.S.; Faridi, S.; Gholampour, A. Long-term trend of ambient air PM10, PM2. 5, and O3 and their health effects in Tabriz city, Iran, during 2006–2017. Sustain. Cities Soc. 2020, 54, 101988. [Google Scholar] [CrossRef]
- Mehmood, T.; Tianle, Z.; Ahmad, I.; Li, X. Integration of AirQ+ and particulate matter mass concentration to calculate health and ecological constraints in Islamabad, Pakistan. In Proceedings of the 2019 16th International Bhurban Conference on Applied Sciences and Technology (IBCAST), Islamabad, Pakistan, 8–12 January 2019. [Google Scholar]
- Habeebullah, T.M. Modeling particulate matter (PM10) in Makkah, Saudi Arabia—A viewpoint of health impact. J. Clean Energy Technol. 2014, 2, 196–200. [Google Scholar] [CrossRef]
- Amoatey, P.; Takdastan, A.; Sicard, P.; Hopke, P.K.; Baawain, M.; Omidvarborna, H.; Allahyari, S.; Esmaeilzadeh, A.; De Marco, A.; Khanaibadi, Y.O.; et al. Short and long-term impacts of ambient ozone on health in Ahvaz, Iran. Hum. Ecol. Risk Assess. Int. J. 2019, 25, 1336–1351. [Google Scholar] [CrossRef]
- Tian, Y.; Wu, Y.; Liu, H.; Si, Y.; Wu, Y.; Wang, X.; Wang, M.; Wu, J.; Chen, L.; Wei, C.; et al. The impact of ambient ozone pollution on pneumonia: A nationwide time-series analysis. Environ. Int. 2020, 136, 105498. [Google Scholar] [CrossRef] [PubMed]
Publisher’s Note: MDPI stays neutral with regard to jurisdictional claims in published maps and institutional affiliations. |
© 2022 by the authors. Licensee MDPI, Basel, Switzerland. This article is an open access article distributed under the terms and conditions of the Creative Commons Attribution (CC BY) license (https://creativecommons.org/licenses/by/4.0/).