Abstract
Climate models participated in the High Resolution Model Intercomparison Project (HighResMIP) of Coupled Model Intercomparison Project 6 (CMIP6) are evaluated to reveal the impact of enhanced resolution in simulating the climatological distribution of precipitation over China. The multi-model mean (MME) of five models with 30–50 km horizontal resolution in the atmosphere (MME-50) had a better performance in reproducing the observed spatial patterns of precipitation over Northwest China and Southwest China than the MME of their lower-resolution (70–140 km) models (MME-100). Such an improvement is mainly attributed to the topographical rainfall reproduced by the higher-resolution models, which have the superiority of reproducing the local vertical circulation over the complex terrain. The MME-50 also improves the skill score of the 850-hPa southwesterly of the Indian-Burma trough relative to the MME-100, which may contribute to better simulation skill of precipitation over Southwest China. The MME-50 (0.92) has a close skill score to the MME-100 (0.91) in the simulation of East Asian summer monsoon, which explains why the MME-50 cannot improve the simulation skill of the precipitation over Southeast China and Northern China. The skill score of the precipitation over the Tibetan Plateau (TP) simulated by the MME-50 is even lower than the MME-100, revealing that simulating the climate over the high plateau is still a challenge for the high-resolution models.
1. Introduction
Reproducing the distribution of the precipitation over China is still a challenge for global climate models because of the complex terrain and the East Asian summer monsoon (EASM) system. The Tibetan Plateau (TP) is the highest elevation in the world and accounts for one-fourth of the area of China. The interaction between airflow and topography may affect the rainfall through changing the stability and convergence patterns in the low troposphere [1]. High mountains can induce local circulation such as mesoscale mountains-valley wind. Models with a coarse horizontal resolution are not able to resolve the complex terrain and the related local circulation. Climate models in Climate Model Intercomparison Project phase 5 (CMIP5) showed a poor performance in the simulations of precipitation and wind speed over the TP [2,3].
Increased horizontal resolution in climate models is of growing interest because higher resolution allows the model to better simulate small scale structure of synoptic and mesoscale systems of a region. Studies have shown that as the resolution increases, global climate models improve the monsoon regimes affected by mesoscale terrains, especially along the steep slope of the Tibetan Plateau [4]. Using regional climate models nested in a global climate models, Gao et al. [5] found that the simulation ability is improved as the horizontal resolution increases, suggesting that model resolutions of 60 km or higher are needed to accurately simulate the distribution of precipitation over China.
Global climate models have increased their horizontal resolution for the last two decades. In CMIP3, the typical horizontal resolution was 250 km in the atmosphere and 1.5° in the ocean [6]. In CMIP5, the horizontal resolution of most models increased to 150 km in the atmosphere and 1° in the ocean [7]. As the increase in high-performance computing resources, the recent ongoing CMIP6 coordinated the High Resolution Model Intercomparison Project (HighResMIP) with the horizontal resolution of at least 50 km in the atmosphere and 0.25° in the ocean, aiming to assess the benefits of increased horizontal resolution in climate models [8]. Evaluations showed that the simulation skill of EASM rainfall is improved from CMIP3 to CMIP5 [9], as well as from CMIP5 to CMIP6 [10]. Global high-resolution climate models in CMIP6 HighResMIP at 25–50 km outperform the CMIP5 models in simulating regional-scale precipitation distribution over Europe [11]. The high-resolution model of CMIP6 HighResMIP also performs well in reproducing West African precipitation [12].
Few studies explore the impact of higher resolution of HighResMIP models on the East Asian climate. The motivation of this study is to investigate the role of horizontal resolution in simulating the precipitation over China and the EASM through comparing five high-resolution models which participated in CMIP6 HighResMIP and their low-resolution versions. Section 2 describes the models, data, and methods used in this study. Section 3 compares different resolution models in simulating precipitation and local atmospheric circulation over China, as well as the EASM. A summary is provided in Section 4.
2. Models, Data, and Methods
Several modeling groups completed HighResMIP hist-1950 simulations with at least two horizontal resolutions. The data are archived at the Earth System Grid Federation (ESGF) website under CMIP6 HighResMIP (https://esgf-node.llnl.gov/search/cmip6/, accessed on 30 April 2021). We choose the models of five modeling groups with two horizontal resolutions at about 100 km and 50 km in the atmosphere (Table 1). The high-resolution models including BCC-CSM2-HR, CNRM-CM6-1-HR, EC-Earth3P-HR, HadGEM3-GC3-HH, and MPI-ESM1-2-XR have horizontal resolutions from 35 km to 50 km in the atmosphere. Their corresponding lower-resolution models are BCC-CSM2-MR, CNRM-CM6-1, EC-Earth3P, HadGEM3-GC31-MM, and MPI-ESM1-1-HR, respectively. Their horizontal resolutions vary from 70 km to 140 km. Most of the high-resolution models in HighResMIP have the same physics package as their lower resolution (standard) model versions, aiming to highlight the role of increased horizontal resolution [9]. BCC-CSM2-MR does not perform the hist-1950 simulations, and we use the historical simulation of CMIP6, which is the standard resolution model of BCC-CSM2-HR.

Table 1.
Details of eight climate/earth system models of CMIP6 models used in the study, including the horizontal resolution (grids) and vertical levels.
The multi-model mean (MME) of the five high-resolution models is named MME-50, while the MME of the five lower-resolution models is named MME-100. The comparison between MME-100 and MME-50 reveals the benefits of the improved horizontal resolution from 100 km to 50 km in the atmosphere. Except for the MPI models, the oceanic component of the high-resolution model also has a finer mesh than that in its lower-resolution model.
The output of hist-1950 simulations following the protocol of HighResMIP is used in this study. The monthly output of the first ensemble member of each model is used in this study, although some models provided several ensemble members. In the simulation of hist-1950, models are driven by the varying external forcings covering greenhouse gases, aerosols, ozone, solar activity, volcanoes, and land use. The external forcing data are provided by CMIP6 [8]. The climatology is adopted for the mean during 1979–2014.
The ERA5 Reanalysis dataset [19], with a horizontal resolution of 31 km in longitude and latitude, is used to verify the simulation including zonal wind, meridional wind and vertical wind, and is considered as the observation in this study. The observed precipitation data are from the 0.25° × 0.25° gridded monthly dataset of CN05.1 [20], based on 2416 station observations in China. This dataset has been widely used in the evaluations of model performances in China [21,22,23]. The observation and the output of all climate models are interpolated to a 0.5° x 0.5° common grid by bilinear interpolation.
The domain over China is divided into five sub-regions including Northwest (70°–110° E, 36°–50° N), TP (75°–100° E, 20°–36° N), Southwest China (100°–110° E, 20°–36° N), Southeast (110°–122° E, 18°–36° N), and Northern China (110°–130° E, 36°–53° N), as shown in Figure 1. Hereinto, Northwest China and Southwest China are the two regions with the topography ranging from the 400 m to 4000 m. In most areas of the TP, the altitude is above 4000 m.
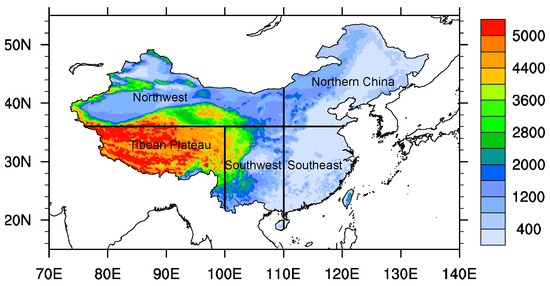
Figure 1.
The elevation (m) over China and the five sub-regions used in this study: Northwest (70°–110° E, 36°–50° N), TP (75°–100° E, 20°–36° N), Southwest (100°–110° E, 20°–36° N), Southeast (110°–122° E, 18°–36° N), Northern China (110°–130° E, 36°–53° N).
To quantitatively estimate model performances, we calculated the spatial correlation, standard deviation and skill score of the precipitation in the different domains of China. The method used to calculate the skill score was from Chen et al. [24], and was used to verify model performance of the precipitation and EASM by previous studies [9,10,25]. The formula is:
In which R denotes the spatial pattern correlation between the model and observation. SDR is the ratio of spatial standard deviation of the model against the observation. In calculating the skill of wind field, the zonal wind and meridional wind are converted into a one-dimensional array.
3. Results
3.1. Spatial Distribution of Climotological Mean Precipitation
The observed climatological annual mean precipitation over China shows a decreased rainfall amount from the southeast coast to the northwest (Figure 2a). All models can reasonably reproduce the spatial structure but with different strengths (Figure 2b–m). Among the five high-resolution models, only BCC-CSM2-HR and MPI-ESM1-2-XR improve the spatial correlation coefficient of the precipitation between the simulation and the observation relative to their lower-resolution models. HadGEM3-GC31-HH and HadGEM3-GC31-MM are the two models that perform best in reproducing the spatial distribution with the correlation coefficients of 0.91. The MME-50 has a slightly higher spatial correlation coefficient (0.89) than the MME-100 (0.88).
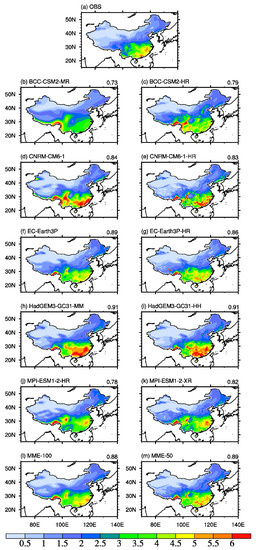
Figure 2.
Distributions of climatological annual mean precipitation (mm/day) over China in the (a) observation, (b–k) models, (l) MME-100, and (m) MME-50. The number at the upper right of each figure is the spatial correlation coefficient between the model and the observation.
Figure 3 shows the Taylor diagram of the precipitation over China and the five subregions simulated by each model relative to the observation. Most models overestimate the standard deviation of the precipitation over China except for BCC-CSM2-MR (Figure 3a). All high resolution models except for CNRM-CM6-1-HR simulate larger standard deviations of the precipitation over China than their lower-resolution models. The MME-50 also has a higher standard devotion (1.18) than the MME-100 (1.11).
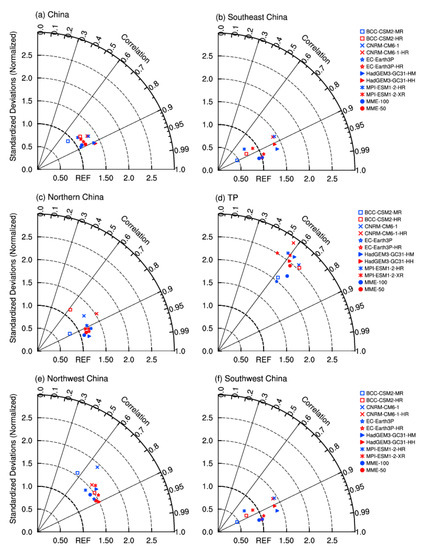
Figure 3.
Taylor diagrams of the climatological mean precipitation over (a) China, (b) Southeast China, (c) Northern China, (d) TP, (e) Northwest China, and (f) Southwest China simulated by the models.
BCC-CSM2-MR and EC-Earth3P both underestimate the precipitation over Southeast China, while the higher resolution models BCC-CSM2-HR and EC-Earth3P-HR simulate a larger standard deviation (Figure 3b). The other three pairs of models produce close standard deviations over Southeast China. An improved spatial correlation is only found in MPI-ESM1-2-XR among the high resolution models relative to their lower-resolution models. There is also no obvious improvement for the spatial correlation and standard deviation for the high resolution models over Northern China (Figure 3c). The MME-50 simulates a larger standard deviation ratio and smaller spatial correlation than the MME-100 over the TP, indicating larger model errors in the higher resolution models (Figure 3d).
Over Northwest China, most high-resolution models improve the spatial correlation relative to their lower-resolution models (Figure 3e). The MME-50 simulates a higher spatial correlation (0.88) than the MME-100 (0.82), although they both overestimate the standard deviations. Over Southwest China, all high-resolution models simulate larger standard deviations and spatial correlations than their lower-resolution models. The MME-50 also improves the simulation of the spatial correlation relative to the MME-100 (Figure 3f).
The skill scores of the precipitation over China and five sub-regions are further calculated and are shown in Figure 4. BCC-CSM2-HR and MPI-ESM1-2-XR both have higher skill scores than their lower-resolution models for the precipitation over China. The skill scores of the MME-100 and MME-50 are 0.87 and 0.86, respectively. Similar results are found in the skill scores of the precipitation over Southeast China (Figure 4b). BCC-CSM2-HR (0.78) and MPI-ESM1-2-XR (0.84) both improve the skill scores of Southeast China relative to BCC-CSM2-MR (0.52) and MPI-ESM1-2-HR (0.72), respectively. The MME-100 and MME-50 have the same skill score (0.96) for the precipitation in Southeast China. Two higher resolution models (EC-Earth3P-HR and MPI-ESM1-2-XR) improve the simulation skill of precipitation in Northern China compared to their lower resolution models (Figure 4c). Over the TP, almost all high-resolution models show a decreased skill relative to their lower resolution models (Figure 4d). The MME-50 has lower skill scores in Northern China and the TP than the MME-100. This indicates that with the horizontal resolution increasing from 100 km to 50 km, no improvement of the simulation skill is found for the precipitation over Southeast China, Northern China, and the TP. A previous study found that CMIP5 models presented a poor performance in the simulations of precipitation in the TP [3]. Our analysis shows that improvements merely in the horizontal resolution could not solve this problem.
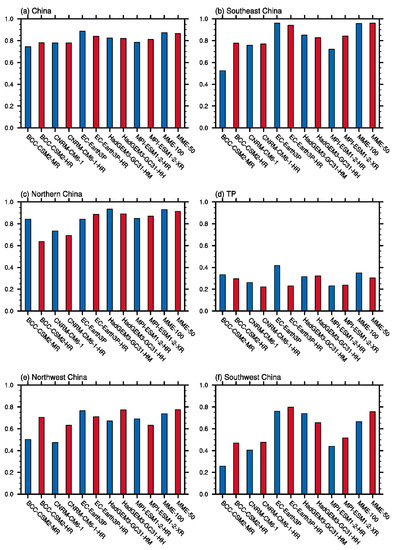
Figure 4.
Skill scores of the precipitation over (a) China, (b) Southeast China, (c) Northern China, (d) TP, (e) Northwest China, and (f) Southwest China are simulated by the models.
In Northwest China, three of the five high-resolution models improve their skill scores in simulating the precipitation relative to the corresponding lower-resolution models, including BCC-CSM2-HR, CNRM-CM6-1-HR, and HadGEM3-GC31-HH (Figure 4e). The largest improvement is the BCC model, which is improved from 0.50 (BCC-CSM2-MR) to 0.70 (BCC-CSM2-HR). The MME-50 (0.77) has a higher skill score than the MME-100 (0.73) in Northwest China. In Southwest China, all high-resolution models have higher skill scores than their lower-resolution models except for HadGEM3-GC31-HH (Figure 4d). The MME-50 (0.76) also improves the skill score relative to the MME-100 (0.66) in Southwest China. Therefore, climate models with a finer resolution tend to have a higher reproduction skill of the precipitation over Southwest China and Northwest China. Based on the previous analysis, this is because of the better simulation in the spatial distribution of the precipitation over these regions with the high-resolution models. Since these two sub-regions both have complex terrains with elevations varying from 400 m to 4000 m, the improvement may be attributed to the detailed representation of topography in the higher-resolution models.
3.2. Time-Evolution of Precipitation in Southwest China
In Southwest China, there are the Hengduan Mountain, the Sichuan Basin, and the Wushan Mountain from the west to the east. The observed monthly precipitation averaged along 29°–30° N presents maximum centers related to the terrain, which are at about 102° E (eastern slope of the Hengduan Mountain) in July–August, at 110° E (the eastern slope of the Wushan Mountain) in July, and at 115°–120° E (the Yangtze River valley) in June (Figure 5a). BCC-CSM2-MR cannot produce the rainfall center at 110° E and have dry biases in the Yangtze River valley, while BCC-CSM2-HR has a much better performance (Figure 5b,c). CNRM-CM6-1-HR also performs better in capturing the timing and strength of the rainfall centers at the latitudes of 110° E and 115°–120° E. The other three higher-resolution models all show some improvement in the simulation of the time and strength of the rainfall at the latitude of 110° E, but not in the Yangtze River valley (Figure 5h–k).
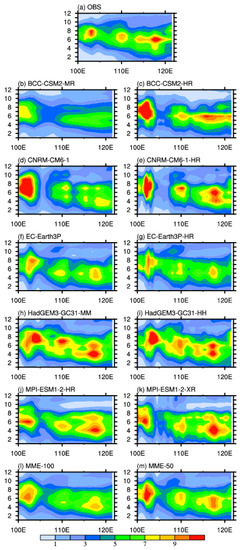
Figure 5.
Longitude-month cross-sections of the climatological mean precipitation (mm day−1) averaged along 29°–30° N in the (a) observation, (b–k) models, (l) MME-100, and (m) MME-50.
The time evolution of the precipitation and the location of the rainfall centers are much better simulated by the MME-50 than the MME-100, especially the rainfall at 110° E in summer (Figure 5l,m). This indicates the benefits of the increased horizontal resolution in capturing the precipitation over Southwest China. But the MME-50 still overestimates the spring rainfall at the latitude of 102° E and underestimates the summer rainfall in the Sichuan Basin.
3.3. Summer Vertical Circluation in Southwest China
We further explore whether the improvement in the simulation of Southwest China precipitation is related to the topography. The vertical velocity and meridional wind averaged along 29°–30° N in summer are shown in Figure 6. There is a strong ascending motion at the eastern periphery of the Wushan Mountain at about 110° E, corresponding to the maximum rainfall center. The ascending motions may act as a triggering mechanism for the rainfall. The strength of the ascending motion can be better simulated by all the five higher-resolution models than their corresponding lower-resolution models. Higher-resolution models also have better performance in reproducing the descending motion at about 115° E, comprising a local vertical circulation with the rising at 110° E. The MME-50 has advantages in reproducing the local atmospheric circulation in comparison with the MME-100 (Figure 6l,m). This explains why the higher-resolution models have a more reasonable simulation in the summer strong rainfall at 110° E. This is also consistent with the earlier analysis that the higher-resolution models have a better ability to reproduce the precipitation over Southwest China.
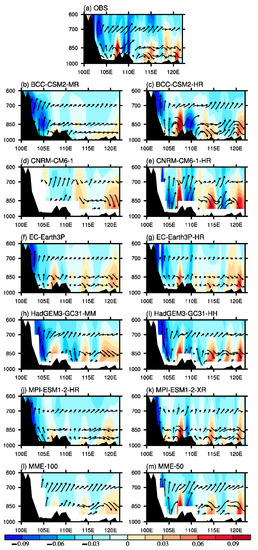
Figure 6.
Latitude-height cross sections of climatological mean vertical velocity and meiridonal wind (vectors) averaged along 29°–30° N in the (a) observation, (b–k) models, (l) MME-100, and (m) MME-50. The shaded represent the vertical wind (Pa s−1) with upward motions in negative values.
Similar results are found for the precipitation in Northwest China. There is a maximum rainfall center at the latitude of 100° E in summer, which is related to the local vertical circulation to the east of the Qilian Mountain. The high-resolution models BCC-CSM2-HR, CNRM-CM6-1-HR, and HadGEM3-GC31-HH all have better capability in simulating the vertical circulation than the lower-resolution models (Figures not shown). Therefore, the improved simulation skills of the high-resolution models in Northwest China and Southwest China are related to their detailed descriptions of the complex terrain and the related local vertical circulation.
3.4. East Asian Summer Monsoon
The generation of the EASM is related to the high plateau [26]. We further investigate whether the high-resolution models of HighResMIP can improve the simulation of the climatological mean EASM. As shown in Figure 7, the models can all reproduce the monsoon systems in East Asia, including the westerly in the front of the Indian-Burma trough, the southwesterly from the South China Sea, and the southwesterly to the west of the Western Pacific Subtropical High (WPSH). The WPSH in the lower-resolution models, including EC-Earth3P, HadGEM3-GC31-MM, and MPI-ESM1-2-HR, is located to the north of the observation, leading to a weakened southwesterly in Southeast China. Their corresponding higher-resolution models show similar results, indicating no benefits from the increased horizontal resolution. The two CNRM models both well reproduce the location of the WPSH and the strength of the southwesterly in Southeast China. BCC-CSM2-HR can well simulate the southwesterly over Southeast China, but overestimate the southwesterly in Northern China. That is why BCC-CSM2-HR simulates a stronger rainfall in Northern China than the observation. The MME-100 and MME-50 simulate similar distributions of the WPSH and southwesterly in East Asia.
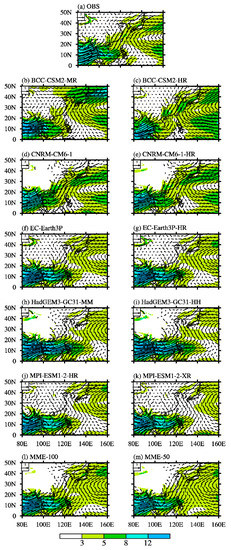
Figure 7.
The climatological distributions of summer climatological mean 850-hPa horizontal winds (vectors, m s−1) and wind speed (shaded, m s−1) in the (a) observation, (b–k) models, (l) MME-100, and (m) MME-50.
Skill scores of the horizontal winds at 850 hPa are calculated over the Northern Bay of Bengal (80°–110° E, 5°–25° N) where the India-Burma trough dominates, and over East Asia (0–50° N, 110°–160° E) where the EASM dominates (Figure 8). It is shown that the skill score of the winds over the Northern Bay of Bengal is better simulated in all higher-resolution models than their lower-resolution models except for BCC-CSM2-HR. The MME-50 achieves a higher skill score (0.97) than the MME-100 (0.93). This may contribute to the improved skill of the precipitation over Southwest China, since southwesterly in the front of the India-Burma trough transports water vapor to Southwest China.
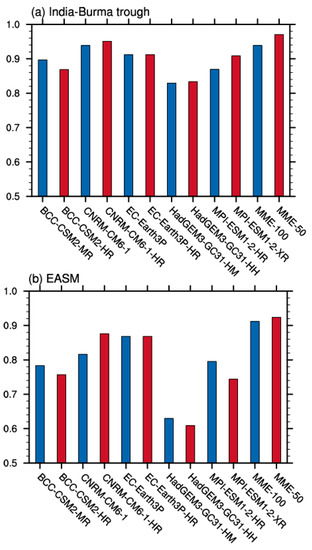
Figure 8.
Skill scores of the climatological mean 850-hPa horizontal winds over (a) the Northern Bay of Bengal (80°–110° E, 5°–25° N) and (b) East Asia (0–50° N, 110°–160° E) in the observation, models, MME-100, and MME-50.
Among the five higher-resolution models, only CNRM-CM6-1-HR has a higher score than its lower-resolution model (CNRM-CM6-1) in the simulation of the EASM. The MME-50 has a close skill score (0.92) to the MME-100 (0.91). Therefore, the increased resolution from 100 km to 50 m may not be efficient in improving the simulation skill of the EASM. This is consistent with the similar performances of MME-50 and MME-100 in reproducing precipitation over Southeast China and Northern China, where the monsoon precipitation dominates.
4. Conclusions
Five high-resolution models with resolution of 30–50 km participated in CMIP6 HighResMIP are compared with their lower resolution models (70–140 km) in simulating the precipitation over China. The multi-model mean (MME) of models with 30–50 km mesh (MME-50) and with 70–140 km mesh (MME-100) have close skill scores in simulating the spatial distribution of the precipitation over the whole of China. There is also no improvement for the precipitation over Southeast China and Northern China for the MME-50 relative to the MME-100. The skill score of the precipitation over the TP even shows a decrease in the higher-resolution models. An obvious increase in the skill scores is found for the precipitation over Northwest China, which is improved from 0.73 in MME-100 to 0.77 in MME-50. The skill score of the precipitation over Southwest China is improved from 0.66 in MME-100 to 0.76 in MME-50.
The improvements in the precipitation over Southwest China are related to the local vertical circulation over the complex terrain in summer. The higher-resolution models have a better performance in reproducing the ascending motion to the eastern slope of the Wushan Mountain (110° E), comprising a local vertical circulation with the downward motion at about 115° E. This is why all higher-resolution models have a better ability in simulating the summer abundant rainfall at 110° E in Southwest China. Our results therefore suggest that relatively high resolutions (50 km or higher) are required to accurately simulate the precipitation over the complex terrain area. The wind skills over the Northern Bay of Bengal also improve in the high-resolution models, where the India-Burma trough dominates. This may also contribute to the improved precipitation skill over southwest China in the higher-resolution models. The improvements in the precipitation and atmospheric circulation may indicate more credible future projection and predictions, which need to be verified in further work.
There is no significant improvement in the skill score in simulating the EASM by the MME-50 (0.92) relative to the MME-100 (0.91), which explains why the MME-50 cannot improve the simulation of the precipitation over Southeast China and Northern China. This implies that the increased resolution from 100 km to 50 m may not be efficient in improving the simulation skill of the EASM and the monsoon rainfall. Further work needs to be done to resolve the physical and dynamical processes in climate models to improve the simulation of the EASM. The climatology is only one aspect of the model performance. More evaluations should be done to know about other advantages of the increased horizontal resolution in the model.
Author Contributions
Methodology, T.W.; data curation, W.J.; writing—original draft, X.X.; writing—review & editing, J.Z. All authors have read and agreed to the published version of the manuscript.
Funding
This research was jointly supported by the National Key Research and Development Program of China under grant number 2016YFA0602103, and the National Natural Science Foundation of China grant number 42077427.
Institutional Review Board Statement
Not applicable.
Informed Consent Statement
Not applicable.
Data Availability Statement
CMIP6 dataset was downloaded from the Earth System Grid Federation (ESGF) (https://esgf-node.llnl.gov/search/cmip6/, accessed on 30 April 2021). ERA5 dataset was downloaded from European Center for Medium-Range Weather Forecasts (https://cds.climate.copernicus.eu/cdsapp#!/dataset/reanalysis-era5-pressure-levels-monthly-means?tab=form, accessed on 30 April 2021).
Acknowledgments
We acknowledge the World Climate Research Program for coordinating and promoting CMIP6. We thank the climate modeling groups for producing and making available their model output, and the Earth System Grid Federation (ESGF) for archiving the dataset and providing access. We thank ECMWF for providing the ERA5 dataset in Copernicus Climate Change Service (C3S) Climate Data Store.
Conflicts of Interest
The authors declare no conflict of interest.
References
- Rotunno, R.; Ferretti, R. Mechanisms of intense alpine rainfall. J. Atmos. Sci. 2001, 58, 1732–1749. [Google Scholar] [CrossRef]
- Gu, H.; Yu, Z.; Wang, J.; Wang, G.; Yang, T.; Ju, Q.; Yang, C.; Xu, F.; Fan, C. Assessing CMIP5 General Circulation Model Simulations of Precipitation and Temperature over China. Int. J. Climatol. 2014, 35, 2431–2440. [Google Scholar] [CrossRef]
- Su, F.; Duan, X.; Chen, D.; Hao, Z.; Cuo, L. Evaluation of the Global Climate Models in the CMIP5 over the Tibetan Plateau. J. Clim. 2013, 26, 3187–3208. [Google Scholar] [CrossRef]
- Kim, H.J.; Wang, B.; Ding, Q. The global monsoon variability simulated by CMIP3 coupled climate models. J. Clim. 2008, 21, 5271–5294. [Google Scholar] [CrossRef]
- Gao, X.; Xu, Y.; Zhao, Z.; Pal, J.S.; Giorgi, F. On the role of resolution and topography in the simulation of East Asia precipitation. Theor. Appl. Climatol. 2006, 86, 173–185. [Google Scholar] [CrossRef]
- Meehl, G.A.; Covey, C.; Delworth, T.; Latif, M.; Mcavaney, B.; John, F.B.; Mitchell, R.J.; Stoer, K.; Taylor, E. The WCRP CMIP3 multimodel dataset-A new era in climate change research. Bull. Am. Meteorol. Soc. 2007, 88, 1383–1394. [Google Scholar] [CrossRef]
- Taylor, K.E.; Stouffer, R.J.; Meehl, G.A. An overview of CMIP5 and the experiment design. Bull. Am. Meteorol. Soc. 2012, 93, 485–498. [Google Scholar] [CrossRef]
- Haarsma, R.; Roberts, M.; Vidale, P.L.; Senior, C.A.; Bellucci, A.; Bao, Q.; Chang, P.; Corti, S.; Fuckar, N.S.; Guemas, V.; et al. High resolution model intercomparison project (HighResMIP v1.0) for CMIP6. Geosci. Model Dev. 2016, 9, 4185–4208. [Google Scholar] [CrossRef]
- Song, F.; Zhou, T. Interannual variability of East Asian summer monsoon simulated by CMIP3 and CMIP5 AGCMs: Skill dependence on Indian Ocean–Western Pacific anticyclone teleconnection. J. Clim. 2014, 27, 1679–1697. [Google Scholar] [CrossRef]
- Xin, X.G.; Wu, T.W.; Zhang, J.; Yao, J.C.; Fang, Y.J. Comparison of CMIP6 and CMIP5 simulations of precipitation in China and the East Asian summer monsoon. Int. J. Climatol. 2020, 40, 6423–6440. [Google Scholar] [CrossRef]
- Demory, M.; Berthou, S.; Fernandez, J.; Sorland, S.; Brogli, R.; Roberts, M.; Beyerle, U.; Seddon, J.; Haarsma, R.; Schar, C.; et al. European daily precipitation according to EURO-CORDEX regional climate models (RCMs) and high-resolution global climate models (GCMs) from the High-Resolution Model Intercomparison Project (HighResMIP). Geosci. Model Dev. 2020, 13, 5485–5506. [Google Scholar] [CrossRef]
- Ajibola, F.O.; Zhou, B.; Gnitou, G.T.; Onyejuruwa, A. Evaluation of the performance of CMIP6 HighResMIP on West African precipitation. Atmosphere 2020, 11, 1053. [Google Scholar] [CrossRef]
- Wu, T.; Lu, Y.; Fang, Y.; Xin, X.; Li, L.; Li, W.; Jie, W.; Zhang, J.; Liu, Y.; Zhang, L. The Beijing Climate Center Climate System Model (BCC-CSM): The main progress from CMIP5 to CMIP6. Geosci. Model Dev. 2019, 12, 1573–1600. [Google Scholar] [CrossRef]
- Wu, T.W.; Yu, R.C.; Lu, Y.X.; Jie, W.H.; Fang, Y.J.; Zhang, J.; Zhang, L.; Xin, X.G.; Li, L.; Wang, Z.Z.; et al. BCC-CSM2-HR: A high-resolution version of the Beijing Climate Center Climate System Model. Geosci. Model Dev. 2021, 14, 2977–3006. [Google Scholar] [CrossRef]
- Voldoire, A.; Saint-Martin, D.; Senesi, S.; Decharme, B.; Alias, A.; Chevallier, M.; Colin, J.; Gueremy, J.-F.; Michou, M.; Moine, M.-P.; et al. Evaluation of CMIP6 DECK Experiments with CNRM-CM6-1. J. Adv. Model. Earth Syst. 2019, 11, 2177–2213. [Google Scholar] [CrossRef]
- Haarsma, R.; Acosta, M.; Bakhshi, R.; Bretonnière, P.-A.; Caron, L.-P.; Castrillo, M.; Corti, S.; Davini, P.; Exarchou, E.; Fabiano, F.; et al. HighResMIP versions of EC-Earth: EC-Earth3P and EC-Earth3P-HR—description, model computational performance and basic validation. Geosci. Model Dev. 2020, 13, 3507–3527. [Google Scholar] [CrossRef]
- Williams, K.D.; Copsey, D.; Blockley, E.W.; Bodas-Salcedo, A.; Calvert, D.; Comer, R.; Davis, P.; Graham, T.; Hewitt, H.T.; Hill, R.; et al. The Met Office Global Coupled Model 3.0 and 3.1 (GC3.0and GC3.1) configurations. J. Adv. Model. Earth Syst. 2018, 10, 357–380. [Google Scholar] [CrossRef]
- Gutjahr, O.; Purtrasahan, D.; Lohmann, K.; Jungclaus, J.; von Storch, J.-S.; Bruggemann, N.; Haak, H.; Stossel, A. Max Planck Institute Earth System Model (MPI-ESM1.2) for the High-Resolution Model Intercomparison Project (HighResMIP). Geosci. Model Dev. 2020, 12, 3241–3281. [Google Scholar] [CrossRef]
- Hersbach, H.; Bell, B.; Berrisford, P.; Hirahara, S.; Horanyi, A.; Munoz-Sabater, J.; Peubey, C.; Radu, R.; Schepers, D.; Simmons, A.; et al. The ERA5 global reanalysis. Q. J. R. Meteorol. Soc. 2020, 146, 1999–2049. [Google Scholar] [CrossRef]
- Wu, J.; Gao, X. A gridded daily observation dataset over China region and comparison with the other datasets. Chin. J. Geophys. 2013, 56, 1102–1111. (In Chinese) [Google Scholar]
- Sun, B.; Wang, H.J. Interdecadal transition of the leading mode of interannual variability of summer rainfall in East China and its associated atmospheric water vapor transport. Clim. Dyn. 2015, 44, 2703–2722. [Google Scholar] [CrossRef]
- Bucchignani, E.; Zollo, A.L.; Cattaneo, L.; Montesarchio, M.; Mercogliano, P. Extreme weather events over China: Assessment of COSMO-CLM simulations and future scenarios. Int. J. Climatol. 2016, 37, 1578–1594. [Google Scholar] [CrossRef]
- Wu, J.; Gao, X.; Giorgi, F.; Chen, D. Changes of effective temperature and cold/hot days in late decades over China based on a high resolution gridded observation dataset. Int. J. Climatol. 2017, 37, 788–800. [Google Scholar] [CrossRef]
- Chen, L.; Yu, Y.; Sun, D. Cloud and water vapor feedbacks to the El Niño warming: Are they still biased in CMIP5 models? J. Clim. 2013, 26, 4947–4961. [Google Scholar] [CrossRef]
- He, C.; Zhou, T. The two interannual variability modes of the western North Pacific subtropical high simulated by 28 CMIP5–AMIP models. Clim. Dyn. 2014, 43, 2455–2469. [Google Scholar] [CrossRef]
- Wu, G.; Liu, Y.; He, B.; Bao, Q.; Duan, A.; Jin, F.-F. Thermal controls on the Asian summer monsoon. Sci. Rep. 2012, 2, 404. [Google Scholar] [CrossRef]
Publisher’s Note: MDPI stays neutral with regard to jurisdictional claims in published maps and institutional affiliations. |
© 2021 by the authors. Licensee MDPI, Basel, Switzerland. This article is an open access article distributed under the terms and conditions of the Creative Commons Attribution (CC BY) license (https://creativecommons.org/licenses/by/4.0/).