Abstract
With the rapid development of the social economy in China, numerous Chinese cities are facing high levels of particulate matter (PM) pollution problems. In this study, high-resolution ZY-3 images and GIS techniques were used to establish the emission inventory of total suspended particle (TSP), particulate matter 10 (PM10) and particulate matter 2.5 (PM2.5) from fugitive dust sources in May 2016, and a spatial grid of 3 km × 3 km resolution was established to demonstrate the spatial distribution of PM emission. Results showed that the total emissions of TSP, PM10 and PM2.5 in Zhengzhou city were 237.5 kt·a−1, 103.7 kt·a−1 and 22.4 kt·a−1, respectively. Construction dust source was the main fugitive dust emission source in Zhengzhou city—the TSP, PM10 and PM2.5 emission of which account for 76.42%, 89.68% and 88.39%, respectively, of the total emission, followed by road dust source and soil dust source. PM emission was higher in Zhongyuan, Huiji, Jinshui and Zhengdong New District, while Zhongmou, Xingyang, Dengfeng and other remote areas had low PM emissions. Compared to other Chinese cities or regions, the PM emission from the construction dust source was at a high level in Zhengzhou city, while the PM emissions from the soil dust source and road dust source were at moderate levels.
1. Introduction
With the rapid industrialization and urbanization of Chinese cities, air pollution has been recognized to be one of the most serious environmental problems [1]. Haze weather frequently occurs in autumn and winter, and air quality has become a major concern in many developed cities [2,3,4,5]. This serious air pollution issue not only restricts the sustainable development of the regional economy but also brings negative influences on human health [6]. Particulate matter (PM), a major component of atmospheric pollutants, has received much attention in the field of atmospheric environment research [7,8,9]. There are various sources of PM emission, of which fugitive dust source is one of the most common sources in urban areas [10]. Fugitive dust is generated from a variety of exposed surfaces, including bare grounds, construction sites, and roads; it can be divided into soil dust, construction dust and road dust according to the sources of emissions [11,12]. Studies have shown that about 20 percent of PM2.5 emission was derived from fugitive dust sources in most of the developed Chinese cities [13]. For example, the contribution rates of PM2.5 and PM10 emissions from fugitive dust sources account for 41.8% and 60.0%, respectively, in Nanchong [14], 22.1% and 28.7% in Qingdao [15], and 30% and 42% in Tianjin [16]. Thus, a good understanding of the characteristics and distributions of PM emission from fugitive dust sources is crucial for developing effective mitigation strategies for PM pollution control in urban areas.
Previous studies have made great efforts on the estimation of PM emission. The emission factor method, a traditional approach for establishing emission inventory, has been widely used before the rapid development of remote sensing technology. The traditional method is effective but requires a mass of field investigation and statistical data, and it is more and more difficult to develop emission inventories with the expansion of the research region [17,18,19]. The rapid development of remote sensing technology (RS) and geographic information system (GIS) provides an efficient approach for estimating and demonstrating PM emission from fugitive dust sources. According to the specific spectral characteristics of ground objects, different PM emission sources can be identified clearly with RS images. In addition, the powerful spatial analysis function of GIS can provide an accurate representation of the spatial distribution of PM emission for a certain region. In recent years, the combination of RS and GIS techniques has been gradually used for establishing pollutant emission inventories from different sources. However, the existing research has focused more on the PM emission from industrial and vehicle sources [20,21,22], while the PM emission from fugitive dust sources has received far less attention. In addition, moderate and low-resolution RS data, such as MODIS and Landsat, were usually adopted for PM emission estimation because they are easy to acquire [23,24,25], but these data were insufficient in establishing accurate PM emission inventories at city scale since these moderate and low-resolution images could not provide detailed ground information.
In this study, based on the high-resolution RS data from the ZY-3 satellite and the Technical Guideline for Compiling Emission Inventory of Particulate Matter from Dust Sources, an RS–GIS-based approach was used to establish PM emission inventory from fugitive dust sources at the city scale. The fugitive dust sources of PM emission were identified accurately from the high-resolution ZY-3 images, and a grid model of 3 km × 3 km resolution was established to demonstrate and analyze the spatial distribution of PM emission from fugitive dust sources. It is expected that the results of this study could provide scientific reference for atmospheric pollution prevention and control.
2. Materials and Methods
2.1. Study Area
Zhengzhou City, the capital of Henan Province, is a new first-tier city with an area of 7446 km2. The geographic location is between 112°42′~114°14′ E and 34°16′~34°58′ N (Figure 1). The city is characterized by the north temperate continental monsoon climate. According to the meteorological data and the Statistical Yearbook of Henan province in 2016, the mean temperature of Zhengzhou was 15.9 °C, the annual average precipitation was 684.3 mm, and the average wind speed was 2.6 m/s.
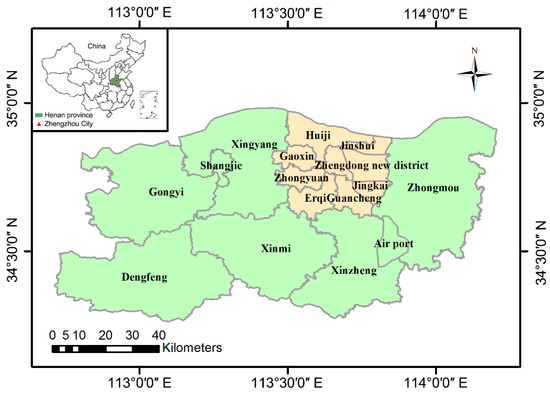
Figure 1.
Geographic location and administrative district of Zhengzhou city.
As a fast-growing city in the central area of China, Zhengzhou city is facing serious air pollution issues along with the rapid economic development and expansion of the urban area. Previous research has pointed out that the maximum mass concentration of PM10 and PM2.5 in Zhengzhou city was averagely 3.7 and 5.8 times greater than the national standard from 2014 to 2017 [26]. An investigation conducted by the Ministry of Environment Protection of China showed that the air quality of Zhengzhou city was at the 7th from the bottom among 74 major cities of China; the percentage of the days exceeding the national air quality standard was more than 70% for both PM10 and PM2.5 in 2016. For better implementation of the action plan for the prevention and control of atmospheric pollution issued by the State Council of China, it is urgent to obtain more information about PM emission characteristics to enhance the pertinence and effectiveness of the prevention and control of atmospheric pollution.
2.2. Data Processing and Spatial Mapping
Data used in this study come from different sources, including RS image, meteorological data, statistical data, monitoring experiment data, and the Technical Guideline for Compiling Emission Inventory of Particulate Matter from Dust Sources, which was issued by the Ministry of Environment Protection of China (MEP) (hereafter referred to as “Guideline”).
Remote sensing data were acquired from the Chinese resource satellite ZY-3. ZY-3 is China’s first three linear array stereo mapping satellite, the maximum spatial resolution of which is 2.1 m. Since the launch of the satellite in January of 2012, images from ZY-3 have been widely used in land surveying, territorial mapping, and ground information extraction [27,28]. Before identifying the distribution of dust emission sources in Zhengzhou city, the original ZY-3 image was spliced and clipped based on the administrative map, then the RS data sets were ortho-rectified based on the 1:50,000-scale topographic map with an accuracy of 0.5 pixels. The preprocessing work of RS images was operated in ENVI 5.3.
A field investigation was conducted to evaluate whether the types of ground objects identified by RS are consistent with the results of the field survey. We randomly selected 50 samples of each type of ground object (bare ground, construction site, and road) for the accuracy test; results showed that the visual interpretation performed well with an overall accuracy of 96%. After manual identification, every piece of emission source was extracted as a shapefile, which contains information including name, location, length, area and other association attributes. Then, shapefiles of each category of dust sources were overlaid to calculate the emission of TSP, PM10 and PM2.5 from soil dust source, construction dust source and road dust source with the formulas proposed in “Guideline”. Finally, a grid map of 3 km × 3 km resolution was established using the spatial analysis function.
2.3. Methodology
2.3.1. The RS–GIS Approach
Figure 2 shows the technical procedures of the RS–GIS-based approach for PM estimation. Firstly, different spectral bands were enhanced with the band math function in ENVI 5.3 to enhance the spectral characteristics of bare grounds, construction sites, and roads in the preprocessed RS images. Secondly, the location, boundary, area and other information of these dust emission sources was obtained from the enhanced high-resolution RS image by experienced researchers. Then, the TSP, PM10, PM2.5 emissions from each source were calculated based on the meteorological data, statistical data, experiment data, and the formulas proposed in “guideline”. Finally, the distribution of PM emission was demonstrated in a grid of 3 km × 3 km resolution in ArcGIS 10.2.
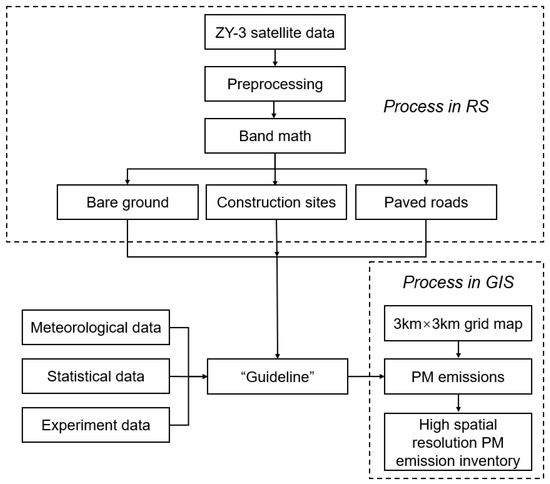
Figure 2.
Technical procedures of the RS–GIS approach for establishing PM emission inventory.
2.3.2. Soil Dust
Soil dust is generated from the bare ground such as uncultivated farmland, exposed mountains, tidal flats, dry river valleys and unhardened spaces. The influence factors of emission from soil dust include particle size distribution of surface soil, surface roughness, vegetation coverage, unsheltered field width and meteorological conditions. Bare ground in this study mainly refers to the farmland without cultivation in the surrounding urban areas and the open land without hardening or greening.
The formulas for calculating emission of PM from soil dust source are as follows:
where is the total PMi emission, t/a; is the PMi emission coefficient, t/(m2·a); is the area of soil dust source, m2, which was obtained from RS data; is the dust emission factor of PMi, t/(104 m2·a); is the dust removal efficiency by pollution control technology, %. Since only the dust emission of the exposed ground was considered in this study, the removal efficiency of the exposed ground control efficiency was set to 0.
where is the percentage of PMi in soil dust. The recommended values of TSP, PM10 and PM2.5 are 1, 0.30 and 0.05, respectively; is the soil wind erosion index, which is 331 for TSP, 99 for PM10 and 17 for PM2.5 according to the soil texture of Zhengzhou city. is the ground roughness factor, the value of which is 0.5; is the unshielded width factor, and the value is 1.0; is the vegetation coverage factor, and the value is 0.9. Values of the parameters, including , , , and are based on the recommended value in “Guideline”. is the climatic factor, is the annual average wind speed, m/s; is the Thomthwaite Precipitation Index (evaporation index), and the formula is as follows:
where is the annual precipitation, mm; is the annual average temperature, °C.
2.3.3. Construction Dust
Construction dust is generated from the construction process including building construction, equipment installation, decoration engineering and renovation projects. It is mainly affected by factors such as the construction area, construction time and PM emission coefficient. The calculation formulas for PM emission from construction dust source are as follows:
where is the total PMi emission of the construction dust, t/a; is the average PMi emission coefficient of the entire construction zone, t/(m2·month); is the area of the construction zone, m2, which was obtained from RS data; is the period of construction activities, which is generally calculated by the number of construction days/30 (according to the survey, the average construction days in Zhengzhou city were 179 d); is the removal efficiency by pollution control technology, %, which is determined by the “Guideline” according to the control technology of construction dust.
2.3.4. Paved Road Dust
Road dust refers to the dust generated from paved roads and entering the ambient air under dynamic conditions (wind power, motor vehicle rolling, crowd activities, etc.). The paved roads can be divided into four categories including national roads, provincial roads, township roads and county roads. The calculation formulas of PM emission from each category of the paved roads are as follows:
where i is the total emission of PMi from road dust, t/a; is the average emission coefficient of PMi from different categories of paved roads, g/VKT; is the length of road, km, which was obtained from RS data; is the number of dust-free days (note that days with precipitation exceeding 0.25 mm/d were recognized as dust-free days according to the meteorological data); is the particle size multiplier of PMi, the recommended value is 3.23 g/km (TSP), 0.62 g/km (PM10) and 0.15 g/km (PM2.5) on the basis of the “Guideline”; is the removal efficiency by pollution control technology, %, which is taken as 0 because there were no control measures on most roads except for several main roads in central urban area; is the average traffic flow on the road during a certain period, vehicle/a; is road dust load, g/m2; is the average vehicle weight, t. In this study, a 10-day-long monitoring experiment was carried out on each category of paved roads to obtain traffic flow () and the road dust load (), the average vehicle weight () and other traffic information were estimated according to the observation data. Emission parameters of different levels of roads are shown in Table 1.

Table 1.
Emission parameters of different levels of paved roads.
3. Results
3.1. Emission Inventory and Spatial Distribution of PM from Soil Dust Source
Bare grounds were mainly distributed in Zhongmou and Xinzheng districts with a total area of 68.97 km2 (Figure 3a). Figure 3b–d displayed the spatial distribution of TSP, PM10 and PM2.5 emission from soil dust source with a grid of 3 km × 3 km resolution. Results showed that the emissions of TSP, PM10 and PM2.5 from soil dust source were 507.40 t·a−1, 45.53 t·a−1 and 1.30 t·a−1, respectively, in Zhengzhou city. From the spatial distribution, PM emission from soil dust source was higher in Zhongmou and Xinzheng, which is consistent with the distribution characteristic of bare grounds. Soil dust emission is strongly under the influence of meteorological conditions and human activities [29]. In addition, soil texture and topography are also important factors that affect PM emission from soil dust source [30]. The airport economy zone also had high PM emission from soil dust source—the reason is that the soil type is mainly silt soil, which can be easily raised into the air by wind and human activities and, therefore, lead to a high emission coefficient. Dengfeng and Xinmi have complex mountainous terrain that decreases from north to south. Affected by topographic conditions, although the area of bare ground was not small in the two regions, the reduced effects of wind and less human activities are the main reasons for low PM emission. Xingyang, Gongyi and the central urban area of Zhengzhou had minimum PM emission from soil dust source, it is mainly due to the small area of bare grounds.
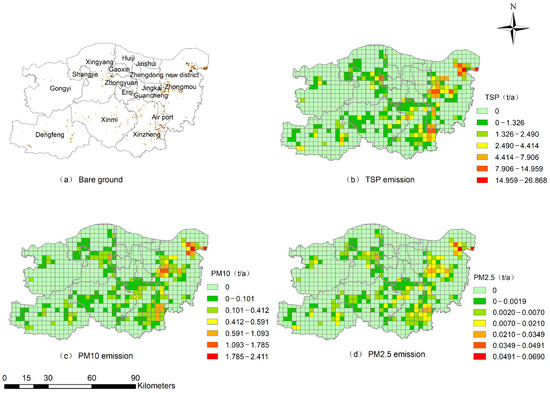
Figure 3.
Spatial distribution of PM emission from soil dust source.
3.2. Emission Inventory and Spatial Distribution of PM from Construction Dust Source
There were 1793 plots of construction sites in Zhengzhou city with a total area of 145.25 km2, which was mainly distributed in the central urban area (Figure 4a). The emission of TSP, PM10 and PM2.5 from the construction dust source was calculated to be 181.5 kt·a−1, 93.0 kt·a−1and 19.8 kt·a−1, respectively. The spatial distribution of TSP, PM10 and PM2.5 emission indicated that PM emission from the construction dust source is closely related to the population density and the regional development degree (Figure 4b–d). Emissions of TSP, PM10 and PM2.5 were mainly distributed in districts with high developed culture and economics, including Zhongyuan, Huiji, Jinshui and Zhengdong New District. The large population and high economic development in these regions bring about lots of construction activities, which induced an urban-area-centered high PM emission circle. Zhongmou, Xingyang and Xinzheng, bordering the main urban area, also have high PM emission. It is mainly due to the influence of urban expansion and economic radiation. The low PM emission area was located at Gongyi and Dengfeng, which is far away from the main urban zone of Zhengzhou. The lack of leading industries and small stress on housing supply resulted in less construction activity, which is assumed to be the main reason for lower PM emission from construction dust source [31].
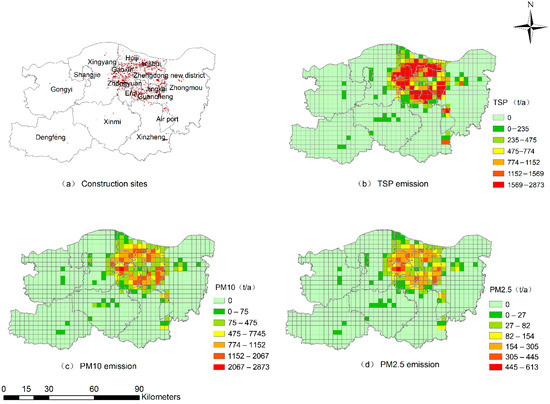
Figure 4.
Spatial distribution of PM emission from construction dust source.
3.3. Emission Inventory and Spatial Distribution of PM from Road Dust Source
Figure 5a shows the distribution of roads in Zhengzhou city, and the total length of paved roads was 10,601.50 km, of which the lengths of the national road, provincial road, county road and township road were 396.30 km, 901.40 km, 2439.88 km and 6863.92 km, respectively. It has been calculated that the total emissions of TSP, PM10 and PM2.5 from paved roads were 55.5 kt·a−1, 10.7 kt·a−1 and 2.6 kt·a−1, respectively (Table 2). Among different levels of roads, township road has the highest PM emission, followed by the provincial road, county road and national road. One reason for this phenomenon is that the township road is more densely distributed than that of other types of road; the other reason is that the road dust load of the township road is relatively large (Table 1). As for the provincial road, although the dust load of the provincial road is small, the heavy traffic volume leads to a high emission coefficient, which resulted in the high PM emission.
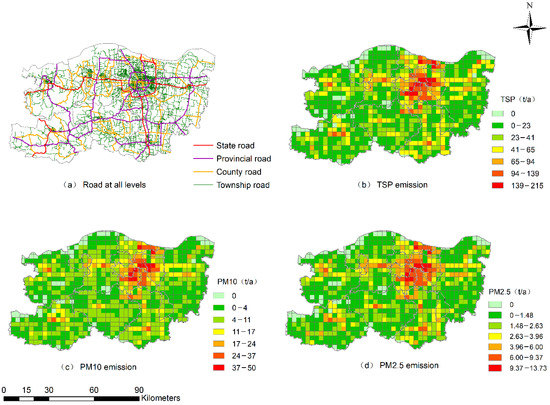
Figure 5.
Spatial distribution of PM emission from road dust source.

Table 2.
Emission of TSP, PM10 and PM2.5 from road dust source.
The spatial characteristics of TSP, PM10 and PM2.5 emission from the road dust source in Zhengzhou city were shown in Figure 5b–d. For different levels of roads, high PM emission mainly concentrated in Zhongyuan, Huiji, Jinshui and Zhengdong New District; this is because these regions are the intersection of the Longhai Railway and the Beijing-Guangzhou Railway, and also 107 National Highway, 310 National Highway, Beijing-Hongkong-Macao Expressway and Lianhuo Expressway all pass through the area. Dense road networks and heavy traffic flow induced high PM emission from road dust source in these areas. Conversely, PM emission from paved roads was small in remote areas such as Shangjie and Dengfeng due to the sparse road networks.
3.4. Total PM Emission from Dust Sources
Table 3 shows the area or length of each dust source in different districts, and the distribution and total PM emission from dust sources are shown in Figure 6. Results showed that the total emissions of TSP, PM10 and PM2.5 from dust sources in Zhengzhou city were 237.5kt·a−1, 103.7kt·a−1 and 22.4 kt·a−1, respectively. Among various dust sources, the construction dust source was the main source of PM emission, the TSP, PM10 and PM2.5 emission of which accounted for 76.43%, 89.69% and 88.50%, respectively, of the total PM emission (Table 4).

Table 3.
Area or length of each dust source in different districts.
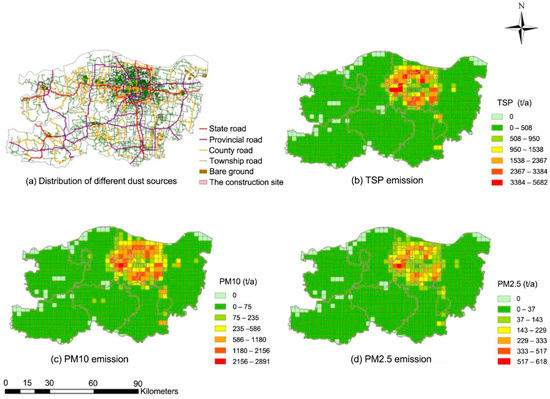
Figure 6.
Spatial distribution of total PM emission from dust sources.

Table 4.
Total emission of TSP, PM10 and PM2.5 from dust sources.
Spatially, emissions of TSP, PM10 and PM2.5 were concentrated in Zhongyuan, Huiji, Jinshui, Zhengdong New District and other main urban areas. Zhongmou, Xingyang and Xinzheng, which border the main urban area, were also regions of high PM emission. The areas that were far away from the main urban zone had low PM emissions, such as Shangjie and Dengfeng. The main reasons for the spatial distribution characteristics include three aspects: Firstly, the majority of construction sites were distributed in the main urban area. Secondly, the dense road network and heavy traffic flow of the main urban area increased the PM emission. Moreover, although soil dust was more prevalent in the suburbs than in the urban area, due to the low PM emission coefficient of soil dust, it had little effect on the characteristic of total PM emission.
4. Discussion
4.1. Comparisons
Table 5 and Figure 7 show the comparisons between our results and the previous emission inventories that have been established in other cities of China. The results suggested that there is not much difference in PM emission from soil dust source between Zhengzhou and Wuhan in 2016 [32]. However, the PM emission from soil dust source in this study is much lower than a previous study conducted in 2013 [33], which showed that the TSP, PM10 and PM2.5 emissions in Zhengzhou were as much as 11,937 t·a−1, 3581 t·a−1, and 597 t·a−1, respectively. Part of the explanation for this discrepancy is the significant differences in climate factors between 2013 and 2016 (2013 was a drought year, with only half as much rainfall as 2016); the other reason is that Xu et al. defined a large area of the Yellow River tidal flat as bare ground. In fact, the tidal flat of the Yellow River has been used for agricultural purposes for a long time because of the fertile soil and excellent irrigation conditions. Previous studies have shown that the soil dust emission from the bare ground is 20 times as much as from cropland within the same area [34]. Thus, the overestimation of bare ground resulted in an appreciable difference between the two studies.

Table 5.
The comparation between this study and the previous emission inventories.
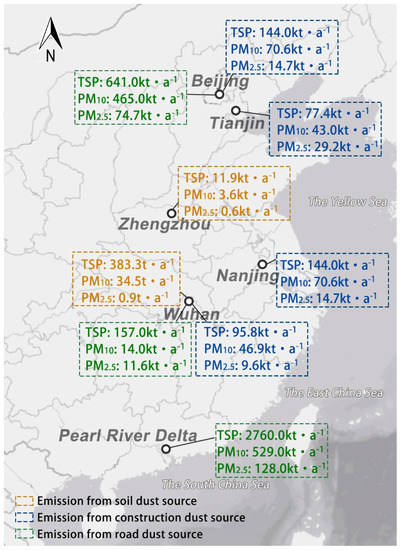
Figure 7.
PM emission from dust sources in different cities or regions of China.
The PM emission from the construction dust source in Zhengzhou is a little higher than in other cities including Beijing, Wuhan, Tianjin and Nanjing. For example, TSP emission from the construction dust source in Zhengzhou is 1.26 times of Beijing and 1.89 times of Wuhan, PM10 emission is 1.32 times of Beijing and 0.98 times of Wuhan, and PM2.5 emission is 0.35 times of Beijing and 1.06 times of Wuhan [31,35]. One reason for this phenomenon is that the emission coefficient was higher in Zhengzhou city due to the deficient dust control measures in construction sites. In addition, the year 2016 is the last year for the urban village renovation project, numbers of construction projects were crashing the schedule, and the sharp increase in construction area is considered the main reason for the high PM emission from the construction dust source.
It was observed that the TSP, PM10 and PM2.5 emissions from the road dust source were high in Zhengzhou city, but compared with other cities of similar size in China, the emission inventory of road dust source obtained in this study is at a low level. There’s little doubt that the capital, Beijing, has the highest PM emission from paved roads, with TSP, PM10 and PM2.5 of 641 kt·a−1, 465 kt·a−1 and 74.7 kt·a−1, respectively. Followed by Nanjing and Wuhan, the PM emissions of which are about three times as much as Zhengzhou. The length and density of road networks are the primary factors that result in such differences [36].
4.2. Source of Uncertainty
Since most of the emission parameters, such as surface roughness factor, unsheltered field width factor, and meteorological factor, do not vary much with regions in the urban-scale research, uniform values for these factors were applied in this study. However, in practice, the uniform values of parameters bring uncertainty to the calculation result of PM emission from dust sources to a certain degree [37]. Another source of uncertainty was generated from the activity level, which is related to the RS interpretation error of the bare ground, construction sites and different types of roads. To improve recognition accuracy, visual interpretation was used to extract ground information from the high-resolution RS image of the high-resolution ZY-3 satellite, and an accuracy test was conducted based on 150 samples that were randomly selected in the study area. Although the accuracy has reached a relatively high level, there would still be some inevitable omissions in the identification process, and this may result in an underestimate of the activity level of PM emission from dust sources.
5. Conclusions
This study investigated the emission of TSP, PM10 and PM2.5 from soil dust, construction dust and road dust in Zhengzhou city according to the RS–GIS-based approach and the Technical Guideline for Compiling Emission Inventory of Particulate Matter from Dust Sources that was issued by China’s Ministry of Environmental Protection. The observations suggest that the total emission of TSP, PM10 and PM2.5 in Zhengzhou city was 237.5 kt·a−1, 103.7 kt·a−1 and 22.4 kt·a−1, respectively, in 2016. Among various PM emission sources, construction dust source was the main emission source, followed by road dust source and soil dust source. Meteorological conditions, human activities, and the regional development degree were assumed to be the main influencing factor of dust emissions. High emission of TSP, PM10 and PM2.5 concentrated in the main urban areas, including Jinshui, Zhongyuan, Erqi, and Jingkai, while Zhongmou, Xingyang, Dengfeng and other remote areas had relatively low PM emission. Compared to the previous emission inventories of other cities, the PM emission from construction dust source was at a high level in Zhengzhou city (TSP: 181.5 kt·a−1, PM10:93.0 kt·a−1, PM2.5: 19.8 kt·a−1), and the PM emissions from soil dust source (TSP: 507.40 t·a−1, PM10: 45.53 t·a−1, PM2.5: 1.30 t·a−1) and road dust source (TSP: 55.5 kt·a−1, PM10: 10.7 kt·a−1, PM2.5: 2.6 kt·a−1) were at moderate levels. It is expected that the PM emission inventory and its spatial distribution are of important value in atmospheric pollution control, and the combination of high-resolution ZY-3 data and GIS technology could provide dependable PM emission inventories in urban regions.
Author Contributions
Conceptualization, X.S.; methodology, H.Y.; software, H.Y.; validation, Q.Z.; formal analysis, H.Y.; investigation, J.C.; resources, S.Y.; data curation, J.C. and S.Y.; writing—original draft preparation, H.Y.; writing—review and editing, L.D.; visualization, H.Y.; supervision, L.D.; project administration, S.Y.; funding acquisition, X.S. All authors have read and agreed to the published version of the manuscript.
Funding
This research was funded by [CMA/Henan Key Laboratory of Agrometeorological Support and Applied Technique] grant number [AMF201610] and [the National Key R&D Program of China] grant number [2017YFC0212401].
Institutional Review Board Statement
Not applicable.
Informed Consent Statement
Not applicable.
Data Availability Statement
The data presented in that study are available on request from the corresponding author.
Conflicts of Interest
The authors declare no conflict of interest.
References
- Chan, C.K.; Yao, X. Air pollution in mega cities in China. Atmos. Environ. 2008, 42, 1–42. [Google Scholar] [CrossRef]
- Feng, Y.L.; Chen, Y.J.; Guo, H.; Zhi, G.R.; Xiong, S.C.; Li, J.; Sheng, G.Y.; Fu, J.M. Characteristics of organic and elemental carbon in PM2.5 samples in Shanghai, China. Atmos. Res. 2009, 92, 434–442. [Google Scholar] [CrossRef]
- Tunno, B.J.; Shields, K.N.; Lioy, P.; Chu, N.; Kadane, J.B.; Parmanto, B.; Pramana, G.; Zora, J.; Davidson, C.; Holguin, F.; et al. Understanding intra-neighborhood patterns in PM2.5 and PM10 using mobile monitoring in Braddock, PA. Environ. Health 2012, 11. [Google Scholar] [CrossRef]
- Zhang, K.; Zhou, L.; Fu, Q.Y.; Yan, L.; Morawska, L.; Jayaratne, R.; Xiu, G.L. Sources and vertical distribution of PM2.5 over Shanghai during the winter of 2017. Sci. Total Environ. 2020, 706, 135683. [Google Scholar] [CrossRef] [PubMed]
- Zhang, Q.Y.; Wei, Y.M.; Tian, W.L.; Yang, K.M. GIS-based emission inventories of urban scale: A case study of Hangzhou, China. Atmos. Environ. 2008, 42, 5150–5165. [Google Scholar] [CrossRef]
- Cohen, A.J.; Anderson, H.R.; Ostro, B.; Pandey, K.D.; Krzyzanowski, M.; Kunzli, N.; Gutschmidt, K.; Pope, A.; Romieu, I.; Samet, J.M.; et al. The global burden of disease due to outdoor air pollution. J. Toxicol. Environ. Health A 2005, 68, 1301–1307. [Google Scholar] [CrossRef]
- Dappe, V.; Uzu, G.; Schreck, E.; Wu, L.; Li, X.; Dumat, C.; Moreau, M.; Hanoune, B.; Ro, C.U.; Sobanska, S. Single-particle analysis of industrial emissions brings new insights for health risk assessment of PM. Atmos. Pollut. Res. 2018, 9, 697–704. [Google Scholar] [CrossRef]
- Khanna, I.; Khare, M.; Gargava, P.; Khan, A.A. Effect of PM2.5 chemical constituents on atmospheric visibility impairment. J. Air Waste Manag. 2018, 68, 430–437. [Google Scholar] [CrossRef]
- Xu, G.Y.; Ren, X.D.; Xiong, K.N.; Li, L.Q.; Bi, X.C.; Wu, Q.L. Analysis of the driving factors of PM2.5 concentration in the air: A case study of the Yangtze River Delta, China. Ecol. Indic. 2020, 110, 105889. [Google Scholar] [CrossRef]
- Zhang, X.; Wang, Y.; Niu, T.; Zhang, X.; Gong, S.; Zhang, Y.; Sun, J. Atmospheric aerosol compositions in China: Spatial/temporal variability, chemical signature, regional haze distribution and comparisons with global aerosols. Atmos. Chem. Phys. 2012, 12, 779–799. [Google Scholar] [CrossRef]
- Cao, J.; Chow, J.; Watson, J.; Wu, F.; Han, Y.; Jin, Z.; Shen, Z.; An, Z. Size-differentiated source profiles for fugitive dust in the Chinese Loess Plateau. Atmos. Environ. 2008, 42, 2261–2275. [Google Scholar] [CrossRef]
- Zhang, Y.; Cai, J.; Wang, S.; He, K.; Zheng, M. Review of receptor-based source apportionment research of fine particulate matter and its challenges in China. Sci. Total Environ. 2017, 586, 917–929. [Google Scholar] [CrossRef] [PubMed]
- Cao, J.-J.; Shen, Z.-X.; Chow, J.C.; Watson, J.G.; Lee, S.-C.; Tie, X.-X.; Ho, K.-F.; Wang, G.-H.; Han, Y.-M. Winter and summer PM2.5 chemical compositions in fourteen Chinese cities. J. Air Waste Manag. 2012, 62, 1214–1226. [Google Scholar] [CrossRef]
- Shu, L.; Luo, B.; Hu, J.; Xia, J.; Zhang, L.; Luo, B.; Zhong, L.; Zhang, Z. Emission Inventory and Characteristics of Atmosphere PM_(2.5) and PM_(10) in Nanchong. Environ. Monit. China 2018, 34, 84–92. [Google Scholar]
- Wu, H.; Zhang, C.; Wang, J.; Xuan, Z.; Chu, C.; Feng, Y.; Xu, H. Comparative Study on Pollution Characteristics and Source Apportionment of PM_(10) and PM_(2.5) in Qingdao. Res. Environ. Sci. 2013, 26, 583–589. [Google Scholar]
- Kong, S.F.; Han, B.; Bai, Z.P.; Chen, L.; Shi, J.W.; Xu, Z. Receptor modeling of PM2.5, PM10 and TSP in different seasons and long-range transport analysis at a coastal site of Tianjin, China. Sci. Total Environ. 2010, 408, 4681–4694. [Google Scholar] [CrossRef]
- Zheng, J.; Zhang, L.; Che, W.; Zheng, Z.; Yin, S. A highly resolved temporal and spatial air pollutant emission inventory for the Pearl River Delta region, China and its uncertainty assessment. Atmos. Environ. 2009, 43, 5112–5122. [Google Scholar] [CrossRef]
- Xu, H.; Xiao, Z.; Chen, K.; Tang, M.; Zheng, N.; Li, P.; Yang, N.; Yang, W.; Deng, X. Spatial and temporal distribution, chemical characteristics, and sources of ambient particulate matter in the Beijing-Tianjin-Hebei region. Sci. Total Environ. 2019, 658, 280–293. [Google Scholar] [CrossRef]
- Xue, Y.; Zhang, S.; Zhou, Z.; Wang, K.; Liu, K.; Wang, X.; Shi, A.; Xu, K.; Tian, H. Spatio-temporal variations of multiple primary air pollutants emissions in Beijing of China, 2006–2015. Atmosphere 2019, 10, 494. [Google Scholar] [CrossRef]
- Maricq, M.M.; Szente, J.J.; Harwell, A.L.; Loos, M.J. Impact of aggressive drive cycles on motor vehicle exhaust PM emissions. J. Aerosol Sci. 2017, 113, 1–11. [Google Scholar] [CrossRef]
- Mousavi, A.; Sowlat, M.H.; Hasheminassab, S.; Pikelnaya, O.; Polidori, A.; Ban-Weiss, G.; Sioutas, C. Impact of particulate matter (PM) emissions from ships, locomotives, and freeways in the communities near the ports of Los Angeles (POLA) and Long Beach (POLB) on the air quality in the Los Angeles county. Atmos. Environ. 2018, 195, 159–169. [Google Scholar] [CrossRef]
- Wang, X.Y.; Lei, Y.; Yan, L.; Liu, T.; Zhang, Q.; He, K.B. A unit-based emission inventory of SO2, NOx and PM for the Chinese iron and steel industry from 2010 to 2015. Sci. Total Environ. 2019, 676, 18–30. [Google Scholar] [CrossRef] [PubMed]
- Lee, S.-S.; Lim, Y.-K.; Cho, J.H.; Lee, H.C.; Ryoo, S.-B. Improved dust emission reduction factor in the ADAM2 model using real-time MODIS NDVI. Atmosphere 2019, 10, 702. [Google Scholar] [CrossRef]
- Bullard, J.; Baddock, M.; McTainsh, G.; Leys, J. Sub-basin scale dust source geomorphology detected using MODIS. Geophys. Res. Lett. 2008, 35. [Google Scholar] [CrossRef]
- Moawad, M.B.; Youssief, A.A.; Madkour, K. Modeling and Monitoring of Air Quality in Greater Cairo Region, Egypt Using Landsat-8 Images, HYSPLIT and GIS Based Analysis. In Climate Change Research at Universities; Springer: Berlin/Heidelberg, Germany, 2017; pp. 37–54. [Google Scholar]
- Guo, M.-M.; Jiang, N.; Wang, S.-B.; Duan, S.-G.; Zhang, R.-Q. Analysis of Air Pollution Characteristics and Meteorological Conditions in Zhengzhou from 2014 to 2017. Huan Jing Ke Xue Huanjing Kexue 2019, 40, 3856–3867. [Google Scholar] [CrossRef]
- Ni, W.J.; Sun, G.Q.; Ranson, K.J.; Pang, Y.; Zhang, Z.Y.; Yao, W. Extraction of ground surface elevation from ZY-3 winter stereo imagery over deciduous forested areas. Remote Sens. Environ. 2015, 159, 194–202. [Google Scholar] [CrossRef]
- Yang, B.; Wang, M.; Xu, W.; Li, D.R.; Gong, J.Y.; Pi, Y.D. Large-scale block adjustment without use of ground control points based on the compensation of geometric calibration for ZY-3 images. ISPRS J. Photogramm. 2017, 134, 1–14. [Google Scholar] [CrossRef]
- Lambert, F.; Delmonte, B.; Petit, J.-R.; Bigler, M.; Kaufmann, P.R.; Hutterli, M.A.; Stocker, T.F.; Ruth, U.; Steffensen, J.P.; Maggi, V. Dust-climate couplings over the past 800,000 years from the EPICA Dome C ice core. Nature 2008, 452, 616–619. [Google Scholar] [CrossRef]
- Li, T.; Bi, X.; Dai, Q.; Liu, B.; Han, Y.; You, H.; Wang, L.; Zhang, J.; Cheng, Y.; Zhang, Y. Improving spatial resolution of soil fugitive dust emission inventory using RS-GIS technology: An application case in Tianjin, China. Atmos. Environ. 2018, 191, 46–54. [Google Scholar] [CrossRef]
- Xue, Y.-F.; Zhou, Z.; Huang, Y.-H.; Wang, K.; Nie, T.; Nie, L.; Qin, J.-P. Fugitive Dust Emission Characteristics from Building Construction Sites of Beijing. Huan Jing Ke Xue Huanjing Kexue 2017, 38, 2231–2237. [Google Scholar] [CrossRef]
- Huang, Y.; Hu, C.; Cheng, H.; Wang, Z. Emission Inventory and Spatial Distribution Characteristics of Particulate Matters from Dust Source in Wuhan, China. J. Wuhan Univ. 2018, 64, 354–362. [Google Scholar] [CrossRef]
- Xu, Y.; Jiang, N.; Yan, Q.; Zhang, R.; Chen, L.; Li, S. Research on emission inventory of bareness wind erosion dust Zhengzhou. Environ. Pollut. 2016, 38, 22–27. [Google Scholar]
- Cui, M.; Lu, H.; Etyemezian, V.; Su, Q. Quantifying the emission potentials of fugitive dust sources in Nanjing, East China. Atmos. Environ. 2019, 207, 129–135. [Google Scholar] [CrossRef]
- Huang, C.; Tao, S.K.; Lou, S.R.; Hu, Q.Y.; Wang, H.L.; Wang, Q.; Li, L.; Wang, H.Y.; Liu, J.G.; Quan, Y.F.; et al. Evaluation of emission factors for light-duty gasoline vehicles based on chassis dynamometer and tunnel studies in Shanghai, China. Atmos. Environ. 2017, 169, 193–203. [Google Scholar] [CrossRef]
- Li, L.; Wang, K.; Sun, Z.; Wang, W.; Zhao, Q.; Qi, H. Bottom-up Emission Inventory and Its Spatio-Temporal Distribution from Paved Road Dust Based on Field Investigation: A Case Study of Harbin, Northeast China. Atmosphere 2021, 12, 449. [Google Scholar] [CrossRef]
- Sun, W.; Liu, Z.; Zhang, Y.; Xu, W.; Lv, X.; Liu, Y.; Lyu, H.; Li, X.; Xiao, J.; Ma, F. Study on land-use changes and their impacts on air pollution in Chengdu. Atmosphere 2020, 11, 42. [Google Scholar] [CrossRef]
Publisher’s Note: MDPI stays neutral with regard to jurisdictional claims in published maps and institutional affiliations. |
© 2021 by the authors. Licensee MDPI, Basel, Switzerland. This article is an open access article distributed under the terms and conditions of the Creative Commons Attribution (CC BY) license (https://creativecommons.org/licenses/by/4.0/).