Abstract
Squall lines (SLs) are convective systems that cause heavy precipitation and consequently modify the atmospheric thermodynamic structure near the surface. SLs generated along the northern coast of Brazil and their effect upon atmospheric structure during their westward displacement into the Amazon are studied. Satellite imagery was employed to identify an SL above two experimental sites in the central Amazon and to characterize differences in the near-surface turbulent and ozone exchange during the passage of the SLs. The two sites, which are separated by about 100 km, feature contrasting vegetation. One site is tall canopy rainforest and the other is deforested. From our case study, it is noted that: equivalent potential temperature significantly drops, principally in the forested region; the average near-surface wind speed increases 5 fold; the skewness of vertical wind velocity becomes considerably negative; significant increases in turbulence intensity are observed. These changes suggest the presence of strong downdrafts generated by the SL. Shear production and dissipation rate of turbulent kinetic energy are considerably larger during the SL when compared to periods with absence of SL. In this study, we show that SLs are capable of modifying the vertical organization of the turbulence over forested and deforested areas, leading to changes in certain chemical processes that occur near the surface. To the best of our knowledge, this study represents a first in demonstrating that near-surface turbulent flow in the Amazon region is modified by the presence of SLs.
1. Introduction
Approximately two-thirds of the global precipitation occurs in tropical regions, primarily caused by Mesoscale Convective Systems (MCSs) ([1,2,3], among others). MCSs are characterized as organized propagating storms that can last for at least several hours resulting in intense rain events, strong winds and, in many cases, hail storms [4]. Squall lines (SLs) are a common type of MCSs, in which a series of storms are arranged in a linear manner, at scales greater than 100 km [4,5]. Such SLs can be identified using satellite images and their displacement can be tracked. In the Amazon, SLs often originate along the northern Atlantic coast. These storms may either propagate very large distances (greater than 1000 km) from the region of origin or they may dissipate close to the coast [6,7,8].
Several studies have shown that SLs can cause intense downdrafts in the Amazon region [9,10,11,12]. It is already known that these downdrafts produce a rapid decrease in surface values of the equivalent potential temperature () ([13,14], among others). Furthermore, multiple authors have documented that such downdrafts can alter Ozone () levels close to the surface [15,16,17,18]. Scala et al. [16] used data from the second NASA Amazon Boundary Layer Experiment [19], to estimate transport during an SL occurrence. They observed that updrafts and downdrafts altered levels in both the lower and upper troposphere. Using data from the Large-Scale Biosphere-Atmosphere experiment [10], Betts et al. [17] showed that surface measurements of and were altered by convective downdrafts. This downward movement, as they describe, had the ability to transport air from higher altitudes to the surface, with a higher concentration and a lower relative to values at the surface. Recent experimental studies have shown that downdraft-mediated transport from the free atmosphere to the atmospheric boundary layer (ABL) can increase the surface levels of by 20 to 30 ppbv [18,20,21].
In the literature, there are multiple studies that address additional aspects, characteristics, and environmental conditions associated with the occurrence of SLs in the Amazon ([6,9,22,23], among others). Negron-Juarez et al. [23] showed that patches of collapsed trees had a relationship with the so-called “blowdowns”, which are generated during the passage of SLs.
Various studies employing experimental observations or numerical models have shown that the presence of SLs intensify the turbulence in its vicinity [5,24,25,26]. However, to date, there is no study detailing the role of SLs in the turbulent exchange processes and in the structure of turbulence at the forest–atmosphere interface, such as the Amazon region. Therefore, this work presents the first detailed case-study investigating how the presence of SL-generated-downdrafts alters the processes of turbulent exchange and transport of [27] over forested and deforested surfaces.
2. Materials And Methods
2.1. Experimental Site
The data used in this work were collected at the Cuieiras (S–W) and Manacapurú (S–W) sites, hereafter designated T0k and T3, respectively (Figure 1). The site T3 is approximately 70 km from the city of Manaus, State of Amazonas, Brazil, in a grassland region of 2.5 by 2 km, surrounded by old-growth forest [28]. The data were obtained as part of the US Atmospheric Radiation Measurement (ARM, https://www.arm.gov/, accessed on 1 March 2021) program, during the GoAmazon (Observing and Modeling of the Green Ocean Amazon) experiment [28].
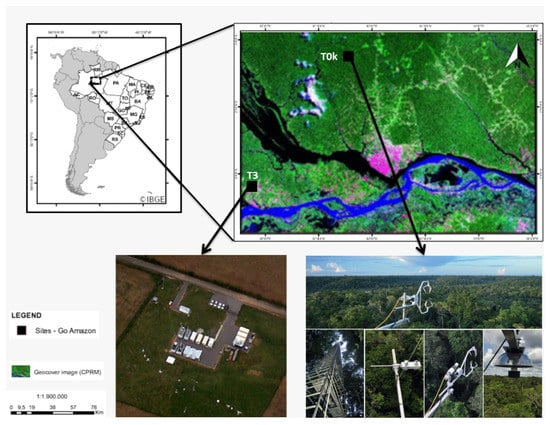
Figure 1.
Map of South America highlighting the central Amazon, where the experimental sites (T0k and T3) are shown. The two sites are 100 km away from each other.
The T0k site is located approximately 60 km Northwest of the city of Manaus in an area of dense tropical rainforest with a complex topography composed by valleys and plateaus, with a maximum height difference of 60 m. The plateaus have a maximum tree height of about 30–40 m and the soil is dominated by clay. In the valleys, the vegetation grows over sandy soils and is less dense as well as having a lower canopy height [18]. The experimental data were collected between March and December 2014, during the GoAmazon Project experimental campaigns [27].
2.2. Satellite Imagery, Ozone, and Meteorological Variables
Satellite imagery data are used to identify and monitor the propagation of SLs. The GOES-13 (Geostationary Operational Environmental Satellites) channel 4 enhanced infrared images were obtained from the website of the Comprehensive Larga Array-data Stewardship System of National Oceanic and Atmospheric Administration (CLASS-NOAA, http://www.avl.class.noaa.gov, accessed on 1 March 2021). The satellite images used to identify convective clouds and SL are in the infrared band often referred to as cloud top temperature and have been employed in numerous studies of deep atmospheric convection [29,30,31].
SLs were identified and classified following [6]. This classification depends on the horizontal displacement of the SLs into the continent, being: (1) Coastal squall lines (CSL): those whose horizontal propagation to the interior of the continent but not exceeding 170 km. (2) Type 1 Squall lines (SL1) have horizontal displacement between 170 and 400 km. (3) Type 2 Squall lines (SL2) travel more than 400 km inland. In this study, an SL2, which occurred on 20 April 2014, was investigated as a case study. The SL2 selected formed on the northern coast of Brazil and traveled towards the sites under study (≈1350 km). It should be noted that the intense rainfall associated with the SLs impairs the performance of sonic anemometors used to estimate turbulent intensity near the surface. As a result, we have selected this SL2 for our case study because during its passage all surface sensors, located in both experimental sites, performed well, thus providing good characterization with these observations.
At site T0k, measurements of (model 49i, Thermo Fischer Scientific Inc., Waltham, MA, USA) were performed at a sampling rate of 1 Hz at 40 m above ground in the K34 tower (located at S–W; see Figure 1). The analyzer was installed inside a container with a controlled environment, located at ground level, approximately 5 m from the tower. The air was pumped at a rate of 12 L/min, from the inlet to the analyzer using a 9.8 mm diameter teon tube [18].
At the T3 site, measurements of concentration were performed with an ultraviolet light absorbing gas analyzer (the same model was utilized at the T0k site). The instrument generates a new measurement every 4 s, and was installed at a height of 3.5 m above the ground. To ensure good data quality, the analyzer was calibrated prior to its installation and regularly reset. The processing of data was carried out following [21].
The micrometeorological variables measured at T0k (at the K34 tower) were the three wind speed components (u, v, and w) and the virtual temperature for the heights of 1.5, 7.0, 13.5, 18.4, 22.1, 24.5, 31.6, 34.9, 40.4, and 48.2 m, utilizing a sampling rate of 20 Hz (model CSAT3, Campbell Scientific, Inc., Logan, UT, USA). We emphasize that fast response data from a sonic anemometer were measured only at the T0k site.
At site T3, the air temperature was measured at 2.5 m above ground (microwave radiometer, MWRP), as well as profiles of variance and skewness of the vertical wind velocity using a DLPROF (Doppler LiDAR profiles). This device generates temporal and spatial estimates every 1 s, with a vertical resolution of 30 m. For more details regarding the instrumentation used at the T0k and T3 sites and, in general, during the GoAmazon project, see [28,32].
To identify downdraft events, the equivalent potential temperature () was calculated from the data of air temperature, water vapor mixing ratio and barometric pressure [33]:
with (), the latent heat of vaporization, (), the heat capacity of dry air, (), the gas constant of dry air, (), a reference pressure of 1000 hPa, and (r), the water vapor mixing ratio.
2.3. Turbulent Parameters
The data from our case study (April 20) were visually inspected to eliminate faulty data before estimating turbulent parameters. In addition, spike detection and elimination was applied in the fast response data to correct common faults in the time series of turbulent variables [34]. The time interval used to estimate the turbulent statistical moments was 5 min for the night-time period [35] and 30 min for the daytime period [36].
The mean horizontal wind speed was obtained starting from the equation where u and v are horizontal components of the wind. The standard deviation of the vertical wind, w, was defined as . We also calculated the turbulent fluxes of momentum and sensible heat, . Where is the density of air; is the specific heat of the air at constant pressure; is the virtual temperature, in addition to higher-order statistical moments, such as the skewness of w, [37].
The turbulent kinetic energy (TKE) was also estimated using a simplified form of the balance equation, which assumes horizontal homogeneity and absence of advection [37]:
where is the TKE, p is the atmospheric pressure, is the mean potential temperature, is the virtual potential temperature, the terms with () represent the fluctuation of the turbulent quantity with respect to its mean according to the “Reynolds mean” procedure [37]. Term I represents the temporal variation of TKE, term II is the production of TKE by vertical wind shear, term III is TKE production due to buoyancy, terms IV and V are the turbulent and pressure correlation of TKE, respectively, and the term VI expresses the dissipation of TKE into heat.
In this work, only the terms II, III, and VI of the TKE balance equation (Equation (2)) were used to investigate the SLs role in both TKE production via wind shear (I) and buoyancy (II), and TKE dissipation per unit mass (). To calculate the vertical gradient of mean wind velocity in term II, we used the wind speed values provided by the sonic anemometers located at heights between 34.9 and 48.2 m. The vertical momentum flux was calculated at the 40.4 m level. The value of the term III was calculated using data from the sonic anemometer placed at a height of 48.2 m. To obtain the dissipation rate of TKE per unit mass, , the properties of the inertial subdomain of the power spectra established by Kolmogorov [38] were used and the validity of the Taylor Hypothesis [37] was accepted, in order to derive the following equation:
where f is the frequency, is the power spectral density of the horizontal component of wind speed in the direction of the mean wind, U is the mean wind speed, and is the Kolmogorov constant [39]. To select only values that were within the inertial subrange of the developed turbulence, values of the frequency range Hz were used [40].
3. Results
3.1. Case Study of a Squall Line
Using 30-min GOES satellite images for 2014, it was possible to observe that between January and December 2014, 13 SL2 events occurred. The months of March and April showed the highest frequency of occurrence of this phenomenon. These months are during the rainy season of the central Amazon region, when the intertropical convergence zone is well established over the N-NE coast of Brazil [41].
After identifying all SL2 events during the selected period, one was selected for the case study (on 20 April). The main reason for using only one case, is that for a better understanding of the SL role in organizing turbulence close to the surface we needed a profile of sonic anemometers working reasonably well during the occurrence of these events. Unfortunately, this only happened in just one case. The SL’s events are accompanied by heavy rains, which impairs a good measurement.
This SL2 formed around 18 UTC (UTC = local time + 4 h), extending from the Brazilian state of Maranhão W to Guyana W (Figure 2a, red line). The SL2 propagated inland toward the continent during the early morning. It is also noted that at this moment its intensity was reduced (Figure 2b). Still in Figure 2b, it is possible to observe that there were some intense convective cells (red circles) southwest of SL2. At 0715 UTC (Figure 2c) it is observed that there was a integration of SL2 with these convective cells, making SL2 more intense and well defined. Between 0715 and 0815 UTC (Figure 2d), it is noted that the first branch, which we will call branch 1, arrived at the T3 and T0k sites. This SL2 continues its propagation inland (Figure 2e), with the second branch, called here branch 2, arriving at around 1640 UTC to the both sites (Figure 2f). This SL2 continued to propagate into the continent and lost its linear definition as of 18 UTC.
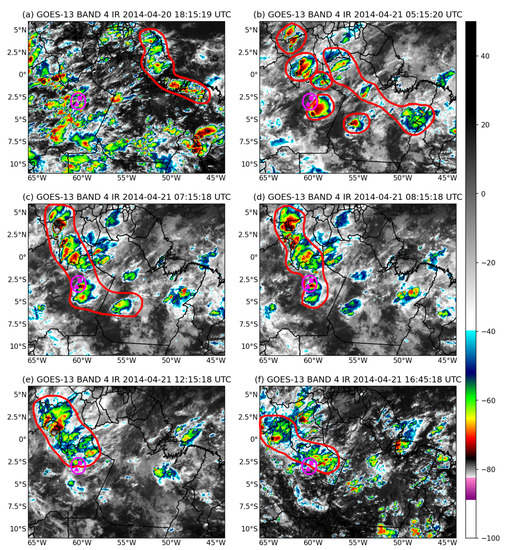
Figure 2.
Satellite images showing the presence of Type 2 Squall lines (SL2) above the analyzed regions: (a) during its onset, on April 20 at 1815 UTC; (b,c) propagating toward the continent (d) branch 1 arrival at the T3 and T0k sites on 21 April 2014; (e) SL2 continues its propagation inland and (f) branch 2 arrival at the T3 and T0k sites. The red lines indicates the outline of SL2. The triangle and square inside the pink circle indicate the location of the T3 and T0k sites, respectively.
Based on the methodology of [6], the SL2 event selected for this study had an approximate lifetime of 22 h from its origin until its dissipation. The propagation mean velocity from its origin (in the north coast of South America) around 1800 UTC, until its arrival into the central Amazon region (≈1350 km apart), around 0800 UTC was ≈27 , with length of 825 km and width of 200 km. Beginning here, we discuss how this SL2 event occurrence may have modulated the organization of the atmospheric turbulence, thermodynamics, and concentration of superficial levels of in both sites analyzed.
3.2. Surface Values of Ozone, Wind Speed, and Temperature during the Squall Line
During the SL2 passage above both sites, T3 and T0k, there was an increase in wind speed (U) and concentration and at the same time a decrease in at around 0815 and 1640 UTC (Figure 3a). The latter suggests the occurrence of downdrafts above the sites during these events.
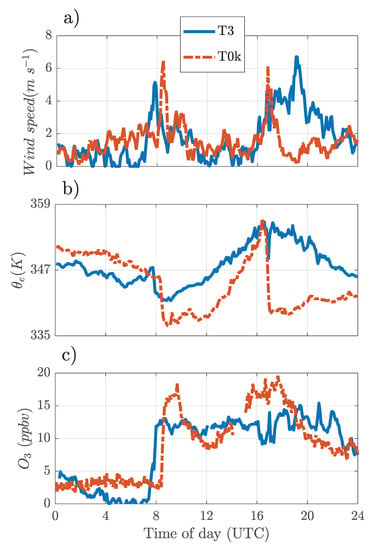
Figure 3.
Time series of: (a) Horizontal wind speed, (b) equivalent potential temperature (), and (c) ozone () measured on 21 April 2014, above the Manacapuru-T3 experimental site (blue line) and T0k (dashed red line), during the displacement of squall lines above the analyzed sites.
It is believed that the first downdraft occurred when SL2-branch 1 was above T3 (at 0745 UTC) and T0k (0815 UTC). The second downdraft probably occurred when SL2 branch 2 was overhead at both sites (1640 UTC). Note that the U values (Figure 3a) were quite similar for the two sites, oscillating between 0 and during the absence of downdrafts and above during the occurrence of downdrafts. The maximum values of U were: 5.15 and during branch1 for T0k and T3 sites, respectively. For the 30 min period before these values were 1.10 and . During branch 2, the maximum values of U were 4.60 and for T0k and T3, respectively, for the 30 min period prior, these values were 1.19 and , that is, the U values increase around five times during the presence of SL2.
Figure 3b shows that the first observed downdraft produced a decrease in values of approximately 6 and 10 K, for T3 and T0k, respectively. During the second downdraft the fall of was considerably stronger above T0k (≈16 K) than above T3 (6 K). We believe that the proximity of the T3 site to the very wide Solimões River, played an important role. Being in the proximity of a large water body generates greater thermal inertia (in this case T3), which means that there will be smaller decreases in during downdraft episodes, when compared to the T0k site, which is located in a region of primary forest relatively distant from wide rivers.
Figure 3c shows that during the first downdraft, values increased by 13 and 15 ppbv, for T3 and T0k, respectively. However, it is not possible to observe significant increases in the concentration close to the surface during the occurrence of the second downdraft. We believe that on this occasion the concentration gradient between the air transported by the downdraft and that at the observation level was small, resulting in no evident changes in the concentration at both sites. Attention should be drawn to the fact that after the occurrence of the first downdraft, the T0k site showed a decrease in the concentration (≈10 ), while in the T3 site the concentration practically did not change, fluctuating very close to 13 ppbv. This contrasting response can be explained by the fact that the T0k site is located in a forest area, in which the oxidation of sesquiterpenes (emitted by vegetation) represent a sink for during both daytime and nighttime. According to Freire et al. [27], this oxidation sink would account for about 40% of loss overnight at T0k.
Several studies have already shown that, during the occurrence of downdrafts, it is possible to observe an increase in the superficial levels of in the Amazonian forest [15,17,18,21,42,43,44]. According to Betts et al. [17], this increase is probably due to the action of an air parcel, rich in , from the middle and upper troposphere, moving via the downdraft towards the ground. This would account for the concentration increase at the two sites during the occurrence of the first analyzed downdraft. In addition, these downdrafts are also capable of transporting cool dry air from the upper atmosphere to near the surface and, as a consequence, produce a decrease in surface [15,17]. According to Dias-Júnior et al. [21], once this denser air reaches the atmospheric layers near the surface it diverges and propagates horizontally in the form of density current causing increases in the U values. These results are consistent with those of Melo et al. [43] through results of numerical simulations.
3.3. Turbulent Parameters
3.3.1. Skewness and Variance of the Vertical Wind Velocity
Figure 4a,b show the temporal variation of the vertical profiles of and respectively, measured above the T3 site. These profiles extend to 1 km above the measurement level with a vertical resolution of 30 m. It is possible to observe that around 0740 and 1640 UTC (these times are delimited by gray dashed lines) and were close to and , respectively. These values indicate the presence of strong downdrafts and intense turbulence at the same times that the two branches of SL2 are located exactly above the T3 site.
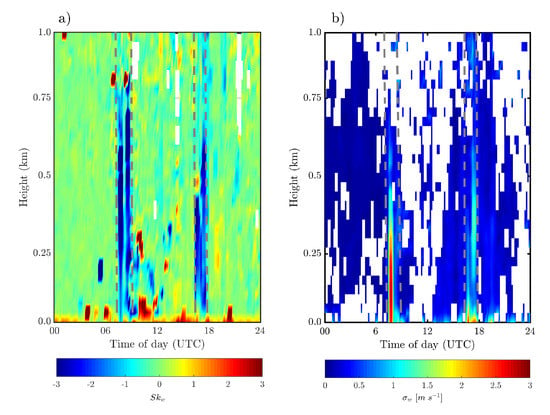
Figure 4.
Temporal variation of the vertical profiles of: (a) skewness () and (b) standard deviation () of the vertical wind velocity, during 21 April 2014 measured above the T3 site. The gray dashed lines indicate the time of occurrence of the downdrafts coming from the squall line.
Figure 5 shows temporal variations of the vertical profiles of now for the region within and immediately above the forest canopy at T0k site. It is evident that the values of increased considerably when branch 1 (around 0815 UTC, Figure 5a) and branch 2 (around 1640 UTC, Figure 5b) of SL2 were passing over the T0k site. Note that intense turbulence is observed only during the presence of the downdrafts, in the absence of an SL and in particular SL2 it is difficult to notice the presence of strong turbulence at depths greater than 0.5 h (where h is the canopy height).
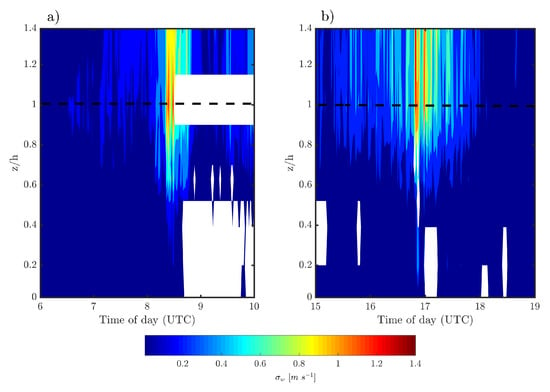
Figure 5.
Temporal variation of the vertical profile of on 21 April 2014 measured at site T0k during: (a) the passage of branch 1, and (b) of the branch 2 of SL2. The dashed black line corresponds to the top of the canopy. The white rectangle indicates the absence of data.
It is noted that the presence of an SL accompanied by its downdrafts can potentially increase the turbulence intensity in almost the entire observed atmospheric boundary layer (Figure 4). In addition, above forested areas such downdrafts generate a significant increase in turbulence intensity in almost the entire interior of the forest canopy (Figure 5). Santana et al. [45], used an extensive dataset from different Amazonian experimental sites and obtained average profiles of various statistical moments associated with the atmospheric turbulence. In their analysis, they demonstrated that the higher density of leaf area of the forest canopy is responsible for filtering practically all the turbulence that would reach the region located below z < 0.5 h. However, here we show that such filtering is insufficient to prevent the turbulent action in the presence of an SL.
3.3.2. Sensible Heat Fluxes
We now pay special attention to the turbulent vertical profiles observed within and immediately above the forest canopy at site T0k. Figure 6 show sensible heat flux (H) values for the periods in which branch 1 (Figure 6a) and branch 2 (Figure 6b) of SL2 passed above the site T0k. It is possible to have an overall view of the temporal variation of the vertical profile of H during the displacement of SL2 above the experimental site. The gray dashed lines indicate the time when SL2 passed above the site.
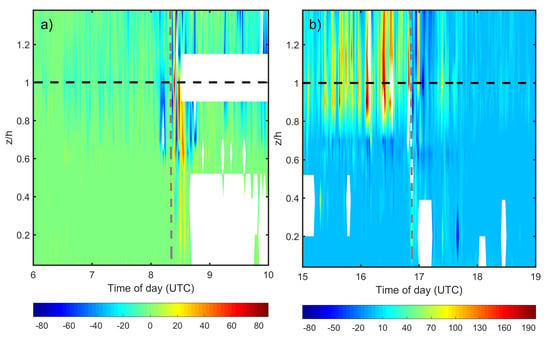
Figure 6.
Temporal variation of the vertical profile of the sensible heat flux, H, (), on 21 April 2014, measured at site T0k, during the passage of branch 1 (a) and branch 2 (b) of the SL2. The dashed black line indicates the forest canopy-top height. The dashed gray line indicates the arrival time of the downdrafts near the top of the forest trees.
The H values, when the branch 1 of SL2 arrived at T0k, changed from being close to zero to strong oscillations between positive and negative values. During daytime, before the arrival of branch 2 of SL2, the values of H are positive above the forest canopy and in the within-canopy upper part (located between 1.0 and 0.8 h). Similarly to what we saw during nighttime, during the presence of branch 2 (daytime), the H values oscillated between positive and negative.
Several studies have shown that H values above the Amazon rainforest are positive during the daytime and negative at nighttime [39,45,46,47], corroborating the results found here for situations in the absence of SL2.
In the presence of strong winds, in this case due to the arrival of SL2, (Figure 3a) it was observed that the magnitude of H increased substantially during the nocturnal period. Fitzjarrald and Moore [48] observed H values 10 times higher in conditions of strong winds when compared to the average for all nocturnal periods above their experimental site, the Duke Reserve (55′51″ S, 58′59″ W) in the Amazon very close to Manaus. Dias-Júnior et al. [39] have observed that for situations of high winds and high values of , H corresponds to about of the total turbulent heat flux observed for the entire analyzed nighttime period at the Rebio-Jarú (Amazon) site. Santana et al. [45] observed that the highest values of H occur during the presence of strong winds for both daytime and nighttime conditions.
In the present study, we observe that at the forest–atmosphere interface and within the canopy H oscillates between positive and negative values in the presence of an SL. This leads to an important observation regarding the general formulations of the flux–gradient relationship, as studied in Monin–Obukhov’s Similarity Theory [36,37]. One of its assumptions is that the sensible heat flux is approximately constant with the height in the atmospheric surface layer (ASL), a condition that is clearly not verified in the presence of SLs as shown above.
3.3.3. Multiresolution Analysis and Atmospheric Turbulent Regimes
In this section, we focus on the event that occurred during nighttime (branch 1). The data provided by sonic anemometer and sonic thermometer located at the highest available measuring level above the forest canopy were used. At this height, H did not change sign and became strongly negative during the occurrence of the SL2 during the nighttime period (Figure 6a). Therefore, it would be possible to observe the effect of the SL arrival on the H values using multiresolution decomposition [49].
Figure 7 shows the multiresolution w’T’-cospectra for the period of 3 h before the arrival of branch 1 (blue line) and during the passage of branch 1 (red dashed line) at site T0k. The cospectra were calculated using data points, which is equivalent to approximately 28 min of data recorded at 20 Hz.
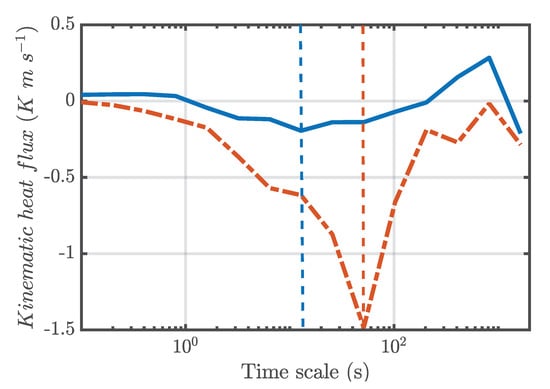
Figure 7.
Kinematic heat flux multiresolution decomposition for branch 1 of SL2. The blue line and red dashed line correspond to the periods before (≈3 h) and during (≈30 min) the presence of branch 1 of SL, respectively, above T0k, during the early hours of 21 April 2014. The vertical blue and red dashed lines indicate, respectively, the -cospectral peaks before and during the SL2 displacement above the site.
The cospectral peak time scale will be considered as the time scale associated with the highest sensible heat flux [50]. It is observed that the cospectral peak of H for the 3 h period before branch 1 presents a time scale of approximately 13 s. On the other hand, the temporal scale of the cospectral peak during the presence of branch 1 was of approximately 52 s. The larger time scale associated to the spectral peak during the SL2 passage is associated with the presence of larger vortices compared to those that frequently populate the Amazon nocturnal boundary layer in the absence of the SL2. In addition, these vortices present a larger temporal scale and certainly a larger spatial scale being more energetic (greater amplitude of the cospectra), and thus justifying the greater heat exchanges between the forest and the atmosphere during the presence of the SL2 above the site.
Figure 8 shows the relationship between and the mean horizontal wind speed (U) obtained through the fast response data measured at the highest level above the T0k site. Each point corresponds to a 5 min average of data, as suggested by [35]. The blue circles and red asterisks correspond to periods of absence and presence of SL2, respectively. The black dashed line indicates the wind speed threshold below which only points belonging to the SL2-absence period were found. Values above this threshold only occurred in the presence of SL2. The value of the wind speed threshold () splits the available data into two subsets: data with weak and strong turbulence regimes, which have been determined according to the methodology used by Dias-Júnior et al. [39]. In this way, all situations where the wind speed was greater than were associated with the strong turbulence regime. In Figure 8, a clear distinction can be noted between the points corresponding to the strong and weak turbulence regimes. The slope of the line corresponding to the weak turbulence regime (blue solid line) is clearly smaller than the slope of the line corresponding to the strong turbulence regime (red line).
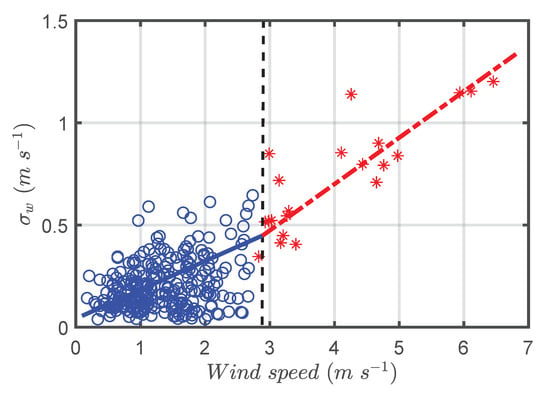
Figure 8.
Standard deviation of the vertical wind speed () as a function of the mean horizontal wind speed (U). Each point corresponds to averages of 5 min of data. The blue circles and red asterisks correspond to periods of absence and presence of SL2, respectively. The black dashed line indicates the threshold below, where only points belonging to the absence period of SL2 (weak turbulent regime) are found and above that threshold corresponds to periods of the presence of SL2 (strong turbulent regime). The red dashed and blue lines correspond to least squares fits.
It is observed that during the presence of SL2 only the occurrence of the strong turbulence regime (red asterisks) was observed, whereas in the absence of SL2 only the occurrence of weak turbulence regime was verified. A physical explanation for the shift from a weak to strong turbulence regime and vice-versa was provided by Sun et al. [51]. They showed that in the weak turbulence regime, the increase of TKE near the surface is controlled by the energy used to increase the potential turbulent energy (PTE) through the buoyancy flux. Under such conditions, TKE does not increase significantly with U. Still according to Sun et al. [51], in the strong turbulence regime, the potential temperature gradient below a height z is suppressed by the presence of large turbulent vortices, and wind shear generates TKE directly without being consumed by the increase in PTE. This change in the mechanism of PTE consumption in the strong turbulence regime generates a considerable increase of TKE with respect to U. Similar results were found here, as shown on Figure 6, Figure 7 and Figure 9.
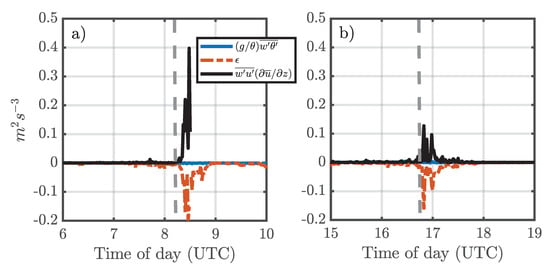
Figure 9.
Estimates of thermal (blue line), mechanical (black line), and dissipation (red dashed line) terms of the turbulent kinetic energy (TKE)’s budget calculated at the highest measuring level of site T0k during passage: (a) of branch 1 and (b) branch 2 of a squall line at 21 April 2014.
3.3.4. Turbulence Kinetic Energy (TKE)
Figure 9 shows some TKE balance terms, such as the TKE production rates by wind shear (black line) and buoyancy (blue line), as well as the TKE dissipation rate per unit mass (red dashed line), obtained during the passages of the first (Figure 9a) and the second (Figure 9b) branch of SL2 above the site T0k, respectively. It can be observed that the values of TKE production by wind shear and TKE dissipation are significantly higher during the periods in which SL2 passes above the site, than those in the absence of SL2. This behavior is not observed for the buoyancy TKE production values, which only slightly increase during the passage of SL2. It was also noted that the magnitude of the TKE production by wind shear and TKE dissipation rate were greater during branch 1, than during branch 2 of the SL2 above the T0k site. In other words, the production and dissipation of TKE were stronger during the nighttime period than during daytime period. These results suggest that TKE production by wind shear is the dominant mechanism in the generation of turbulence during the passage of the squall line.
4. Conclusions
We have studied a squall line (SL2) that originated in the north coast of South America and traveled (≈1350 km) into the central Amazon region. This SL2 caused a significant impact in the vertical exchange processes between the surface and the atmosphere at both, a forested (T0k) and a pasture (T3) site. With the arrival of SL2, the presence of downdrafts were observed, and well characterized by measurements at the surface, mainly: (1) the values of became considerably larger, both in the forested region and in the deforested region; (2) sudden drops in potential equivalent temperature values (); (3) significant increases in surface ozone levels () and horizontal wind velocity, U, (five times higher), which persisted during the passage of SL2 above the experimental sites. It was also observed that SL2 has the potential to transport from the high–medium troposphere downwards into the atmospheric boundary layer.
This study represents a first over the Amazon region, showing that the presence of an SL can produce significant changes in the organization of atmospheric turbulence near the surface. It was noted that the turbulent vortices associated with the presence of SL2 have a considerably longer time scale and are more energetic compared to those that are present in the absence of SL2. Sensible heat exchanges during the presence of SL2, both at the forest-atmosphere interface and within the forest canopy, oscillated between positive and negative values during both nighttime and daytime.
It was also observed that the presence of the SL2 above the site modifies the background turbulence regime, causing a transition from a weak to a strong turbulent state. Furthermore, we showed that the TKE production is almost exclusively of mechanical origin. A better understanding of these processes of interaction between forest–atmosphere–squall line are fundamental for obtaining more realistic parameterizations to represent the surface processes in numerical models, since the presence of such lines is quite common in the Amazon.
Author Contributions
All authors contributed to the research and to the elaboration of this manuscript; conceptualization, C.Q.D.-J., V.L.B., R.S.V., and H.S.M.; data curation, M.C., J.D.F., and A.O.M.; formal analysis and methodology, C.Q.D.-J., S.B., V.L.B., R.A.S., and J.C.P.C.; writing—original draft, C.Q.D.-J., V.L.B., R.S.V., and S.B. All authors have read and agreed to the published version of the manuscript.
Funding
This research received no external funding.
Institutional Review Board Statement
Not applicable.
Informed Consent Statement
Not applicable.
Data Availability Statement
Not applicable.
Acknowledgments
The first author is grateful for the scholarship awarded by Coordenação de Aperfeiçoamento de Pessoal de Nível Superior (CAPES), through the Postgraduate Program in Climate and Environment, INPA/UEA. We are grateful for the institutions that provided financial and human resources to obtain the data of this study, namely: Fundação de Amparo á Pesquisa do Estado do Amazonas—FAPEAM; Fundação de Amparo á Pesquisa do estado de São Paulo—FAPESP; Department of Energy—DOE; National Science Foundation—NSF; Financiadora de Estudos e Projetos—FINEP; Department of Science and Aerospace Technology; Universidade Federal do Amazonas—UFAM; Max Planck—Institute for Chemistry; Instituto Nacional de Pesquisas da Amazônia—INPA; Instituto Nacional de Pesquisas Espaciais—INPE; Universidade de São Paulo—USP; Universidade do Estado do Amazonas—UEA; Fundação Amazônica de Defesa da Biosfera—FDB, among other institutions. Publication supported by PAPAC/FAPEAM-062.00859/2019. Special thanks to David Adams for fruitful discussions.
Conflicts of Interest
The authors declare no conflict of interest. The funders had no role in the design of the study; in the collection, analyses, or interpretation of data; in the writing of the manuscript, or in the decision to publish the results.
References
- Houze, R.A., Jr. Observed structure of mesoscale convective systems and implications for large-scale heating. Q. J. R. Meteorol. Soc. 1989, 115, 425–461. [Google Scholar] [CrossRef]
- Nesbitt, S.W.; Cifelli, R.; Rutledge, S.A. Storm Morphology and Rainfall Characteristics of TRMM Precipitation Features. Mon. Weather Rev. 2006, 134, 2702–2721. [Google Scholar] [CrossRef]
- Peters, O.; Neelin, J.D.; Nesbitt, S.W. Mesoscale convective systems and critical clusters. J. Atmos. Sci. 2009, 66, 2913–2924. [Google Scholar] [CrossRef]
- Houze, R.A., Jr.; Rasmussen, K.L.; Zuluaga, M.D.; Brodzik, S.R. The variable nature of convection in the tropics and subtropics: A legacy of 16 years of the Tropical Rainfall Measuring Mission satellite. Rev. Geophys. 2015, 53, 994–1021. [Google Scholar] [CrossRef]
- Skamarock, W.C.; Weisman, M.L.; Klemp, J.B. Three-dimensional evolution of simulated long-lived squall lines. J. Atmos. Sci. 1994, 51, 2563–2584. [Google Scholar] [CrossRef]
- Cohen, J.C.P.; Dias, M.A.F.S.; Nobre, C.A. Environmental Conditions Associated with Amazonian Squall Lines: A Case Study. Mon. Weather Rev. 1995, 123, 3163–3174. [Google Scholar] [CrossRef]
- Adams, D.; Fernandes, R.; Holub, K.; Gutman, S.; Barbosa, H.; Machado, L.; Calheiros, A.; Bennett, R.; Kursinski, E.R.; Sapucci, L.; et al. The Amazon dense gnss meteorological network a new approach for examining water vapor and deep convection interactions in the tropics. Bull. Am. Meteorol. Soc. 2015, 96, 2151–2165. [Google Scholar] [CrossRef]
- Schiro, K.A.; Neelin, J.D.; Adams, D.K.; Lintner, B.R. Deep convection and column water vapor over tropical land versus tropical ocean: A comparison between the Amazon and the tropical western Pacific. J. Atmos. Sci. 2016, 73, 4043–4063. [Google Scholar] [CrossRef]
- Garstang, M.; Massie, H.L., Jr.; Halverson, J.; Greco, S.; Scala, J. Amazon Coastal Squall Lines. Part I: Structure and Kinematics. Mon. Weather Rev. 1994, 122, 608–622. [Google Scholar] [CrossRef]
- Silva Dias, M.A.F.; Rutledge, S.; Kabat, P.; Silva Dias, P.L.; Nobre, C.; Fisch, G.; Dolman, A.J.; Zipser, E.; Garstang, M.; Manzi, A.O.; et al. Cloud and rain processes in a biosphere-atmosphere interaction context in the Amazon Region. J. Geophys. Res. Atmos. 2002, 107, LBA 39-1–LBA 39-18. [Google Scholar] [CrossRef]
- Machado, L.; Laurent, H.; Dessay, N.; Miranda, I. Seasonal and diurnal variability of convection over the Amazonia: A comparison of different vegetation types and large scale forcing. Theor. Appl. Climatol. 2004, 78, 61–77. [Google Scholar] [CrossRef]
- Anselmo, E.M.; Schumacher, C.; Machado, L.A. The Amazonian Low-level Jet and Its Connection to Convective Cloud Propagation and Evolution. Mon. Weather Rev. 2020, 148, 4083–4099. [Google Scholar] [CrossRef]
- Zipser, E.J. The role of organized unsaturated convective downdrafts in the structure and rapid decay of an equatorial disturbance. J. Appl. Meteorol. Climatol. 1969, 8, 799–814. [Google Scholar] [CrossRef]
- Betts, A.K. The thermodynamic transformation of the tropical subcloud layer by precipitation and downdrafts. J. Atmos. Sci. 1976, 33, 1008–1020. [Google Scholar] [CrossRef]
- Garstang, M.; Scala, J.; Greco, S.; Harriss, R.; Beck, S.; Browell, E.; Sachse, G.; Gregory, G.; Hill, G.; Simpson, J.; et al. Trace gas exchanges and convective transports over the Amazonian rain forest. J. Geophys. Res. Atmos. 1988, 93, 1528–1550. [Google Scholar] [CrossRef]
- Scala, J.R.; Garstang, M.; Tao, W.K.; Pickering, K.E.; Thompson, A.M.; Simpson, J.; Kirchhoff, V.W.J.H.; Browell, E.V.; Sachse, G.W.; Torres, A.L.; et al. Cloud draft structure and trace gas transport. J. Geophys. Res. Atmos. 1990, 95, 17015–17030. [Google Scholar] [CrossRef]
- Betts, A.K.; Gatti, L.V.; Cordova, A.M.; Dias, M.A.S.; Fuentes, J.D. Transport of ozone to the surface by convective downdrafts at night. J. Geophys. Res. Atmos. 2002, 107, LBA–13. [Google Scholar] [CrossRef]
- Gerken, T.; Wei, D.; Chase, R.J.; Fuentes, J.D.; Schumacher, C.; Machado, L.A.; Andreoli, R.V.; Chamecki, M.; de Souza, R.A.F.; Freire, L.S.; et al. Downward transport of ozone rich air and implications for atmospheric chemistry in the Amazon rainforest. Atmos. Environ. 2016, 124 Pt A, 64–76. [Google Scholar] [CrossRef]
- Harriss, R.; Garstang, M.; Wofsy, S.; Beck, S.; Bendura, R.; Coelho, J.; Drewry, J.; Hoell, J.; Matson, P.; McNeal, R.J.; et al. The Amazon boundary layer experiment: Wet season 1987. J. Geophys. Res. Atmos. 1990, 95, 16721–16736. [Google Scholar] [CrossRef]
- Hu, X.M.; Fuentes, J.D.; Zhang, F. Downward transport and modification of tropospheric ozone through moist convection. J. Atmos. Chem. 2010, 65, 13–35. [Google Scholar] [CrossRef]
- Dias-Júnior, C.Q.; Dias, N.L.; Fuentes, J.D.; Chamecki, M. Convective storms and non-classical low-level jets during high ozone level episodes in the Amazon region: An ARM/GOAMAZON case study. Atmos. Environ. 2017, 155, 199–209. [Google Scholar] [CrossRef]
- Garstang, M.; White, S.; Shugart, H.H.; Halverson, J. Convective cloud downdrafts as the cause of large blowdowns in the Amazon rainforest. Meteorol. Atmos. Phys. 1998, 67, 199–212. [Google Scholar] [CrossRef]
- Negrón-Juárez, R.I.; Chambers, J.Q.; Guimaraes, G.; Zeng, H.; Raupp, C.F.M.; Marra, D.M.; Ribeiro, G.H.P.M.; Saatchi, S.S.; Nelson, B.W.; Higuchi, N. Widespread Amazon forest tree mortality from a single cross–basin squall line event. Geophys. Res. Lett. 2010, 37. [Google Scholar] [CrossRef]
- Meischner, P.; Baumann, R.; Höller, H.; Jank, T. Eddy dissipation rates in thunderstorms estimated by Doppler radar in relation to aircraft in situ measurements. J. Atmos. Ocean. Technol. 2001, 18, 1609–1627. [Google Scholar] [CrossRef]
- Verrelle, A.; Ricard, D.; Lac, C. Evaluation and improvement of turbulence parameterization inside deep convective clouds at kilometer-scale resolution. Mon. Weather Rev. 2017, 145, 3947–3967. [Google Scholar] [CrossRef]
- Alfaro, D.A. Low-tropospheric shear in the structure of squall lines: Impacts on latent heating under layer-lifting ascent. J. Atmos. Sci. 2017, 74, 229–248. [Google Scholar] [CrossRef]
- Freire, L.S.; Gerken, T.; Ruiz-Plancarte, J.; Wei, D.; Fuentes, J.D.; Katul, G.G.; Dias, N.L.; Acevedo, O.C.; Chamecki, M. Turbulent mixing and removal of ozone within an Amazon rainforest canopy. J. Geophys. Res. Atmos. 2017, 122, 2791–2811. [Google Scholar] [CrossRef]
- Martin, S.T.; Artaxo, P.; Machado, L.A.T.; Manzi, A.O.; Souza, R.A.F.; Schumacher, C.; Wang, J.; Andreae, M.O.; Barbosa, H.M.J.; Fan, J.; et al. Introduction: Observations and Modeling of the Green Ocean Amazon (GoAmazon2014/5). Atmos. Chem. Phys. 2016, 16, 4785–4797. [Google Scholar] [CrossRef]
- Maddox, R.A. Mesoscale convective complexes. Bull. Am. Meteorol. Soc. 1980, 61, 1374–1387. [Google Scholar] [CrossRef]
- Adams, D.K.; Gutman, S.I.; Holub, K.L.; Pereira, D.S. GNSS observations of deep convective time scales in the Amazon. Geophys. Res. Lett. 2013, 40, 2818–2823. [Google Scholar] [CrossRef]
- Machado, L.A.T.; Dias, M.A.F.S.; Morales, C.; Fisch, G.; Vila, D.; Albrecht, R.; Goodman, S.J.; Calheiros, A.J.P.; Biscaro, T.; Kummerow, C.; et al. The Chuva Project: How Does Convection Vary across Brazil? Bull. Am. Meteorol. Soc. 2014, 95, 1365–1380. [Google Scholar] [CrossRef]
- Fuentes, J.D.; Chamecki, M.; dos Santos, R.M.N.; Randow, C.V.; Stoy, P.C.; Katul, G.; Fitzjarrald, D.; Manzi, A.; Gerken, T.; Trowbridge, A.; et al. Linking Meteorology, Turbulence, and Air Chemistry in the Amazon Rain Forest. Bull. Am. Meteorol. Soc. 2016, 97, 2329–2342. [Google Scholar] [CrossRef]
- Emanuel, K.A. Atmospheric Convection; Oxford University Press on Demand: Oxford, UK, 1994. [Google Scholar]
- Vickers, D.; Mahrt, L. Quality Control and Flux Sampling Problems for Tower and Aircraft Data. J. Atmos. Oceanic Technol. 1997, 14, 512–526. [Google Scholar] [CrossRef]
- Sun, J.; Mahrt, L.; Banta, R.M.; Pichugina, Y.L. Turbulence Regimes and Turbulence Intermittency in the Stable Boundary Layer during CASES-99. J. Atmos. Sci. 2012, 69, 338–351. [Google Scholar] [CrossRef]
- Arya, P.S. Introduction to Micrometeorology; Elsevier: Amsterdam, The Netherlands, 2001; Volume 79. [Google Scholar]
- Stull, R.B. An Introduction to Boundary Layer Meteorology; Springer: Dordrecht, The Netherlands, 1988. [Google Scholar]
- Kaimal, J.C.; Finnigan, J.J. Atmospheric Boundary Layer Flows: Their Structure and Measurement; Oxford University Press: New York, NY, USA, 1994. [Google Scholar]
- Dias-Júnior, C.Q.; Sá, L.D.; Filho, E.P.M.; Santana, R.A.; Mauder, M.; Manzi, A.O. Turbulence regimes in the stable boundary layer above and within the Amazon forest. Agric. For. Meteorol. 2017, 233, 122–132. [Google Scholar] [CrossRef]
- Bolzan, M.J.A.; Vieira, P.C. Wavelet analysis of the wind velocity and temperature variability in the Amazon Forest. Braz. J. Phys. 2006, 36, 1217–1222. [Google Scholar] [CrossRef]
- Rao, V.B.; Sá, L.D.; Franchito, S.H.; Hada, K. Interannual variations of rainfall and corn yields in Northeast Brazil. Agric. For. Meteorol. 1997, 85, 63–74. [Google Scholar] [CrossRef]
- Betts, A.; Fisch, G.; Von Randow, C.; Silva Dias, M.; Cohen, J.; Da Silva, R.; Fitzjarrald, D. The Amazonian boundary layer and mesoscale circulations. In Amazonia and Global Change; AGU: Washington, DC, USA, 2009. [Google Scholar]
- Melo, A.M.; Dias-Junior, C.Q.; Cohen, J.C.; Sá, L.D.; Cattanio, J.H.; Kuhn, P.A. Ozone transport and thermodynamics during the passage of squall line in Central Amazon. Atmos. Environ. 2019, 206, 132–143. [Google Scholar] [CrossRef]
- Miranda, F.O.; Ramos, F.M.; von Randow, C.; Dias-Júnior, C.Q.; Chamecki, M.; Fuentes, J.D.; Manzi, A.O.; de Oliveira, M.E.; de Souza, C.M. Detection of Extreme Phenomena in the Stable Boundary Layer over the Amazonian Forest. Atmosphere 2020, 11, 952. [Google Scholar] [CrossRef]
- Santana, R.A.; Dias-Júnior, C.Q.; Tóta, J.; Fuentes, J.D.; do Vale, R.S.; Alves, E.G.; dos Santos, R.M.N.; Manzi, A.O. Air turbulence characteristics at multiple sites in and above the Amazon rainforest canopy. Agric. For. Meteorol. 2018, 260–261, 41–54. [Google Scholar] [CrossRef]
- Kruijt, B.; Malhi, Y.; Lloyd, J.; Norbre, A.D.; Miranda, A.C.; Pereira, M.G.P.; Culf, A.; Grace, J. Turbulence Statistics Above And Within Two Amazon Rain Forest Canopies. Bound. Layer Meteorol. 2000, 94, 297–331. [Google Scholar] [CrossRef]
- von Randow, C.; Manzi, A.O.; Kruijt, B.; de Oliveira, P.J.; Zanchi, F.B.; Silva, R.L.; Hodnett, M.G.; Gash, J.H.C.; Elbers, J.A.; Waterloo, M.J.; et al. Comparative measurements and seasonal variations in energy and carbon exchange over forest and pasture in South West Amazonia. Theor. Appl. Climatol. 2004, 78, 5–26. [Google Scholar] [CrossRef]
- Fitzjarrald, D.R.; Moore, K.E. Mechanisms of nocturnal exchange between the rain forest and the atmosphere. J. Geophys. Res. Atmos. 1990, 95, 16839–16850. [Google Scholar] [CrossRef]
- Mallat, S.G. A theory for multiresolution signal decomposition: The wavelet representation. IEEE Trans. Pattern Anal. Mach. Intell. 1989, 11, 674–693. [Google Scholar] [CrossRef]
- Vickers, D.; Mahrt, L. The Cospectral Gap and Turbulent Flux Calculations. J. Atmos. Sci. 2003, 20, 660–672. [Google Scholar] [CrossRef]
- Sun, J.; Lenschow, D.H.; LeMone, M.A.; Mahrt, L. The Role of Large-Coherent-Eddy Transport in the Atmospheric Surface Layer Based on CASES-99 Observations. Bound. Layer Meteorol. 2016, 160, 83–111. [Google Scholar] [CrossRef]
Publisher’s Note: MDPI stays neutral with regard to jurisdictional claims in published maps and institutional affiliations. |
© 2021 by the authors. Licensee MDPI, Basel, Switzerland. This article is an open access article distributed under the terms and conditions of the Creative Commons Attribution (CC BY) license (https://creativecommons.org/licenses/by/4.0/).