Abstract
Diesel-powered agricultural machinery (AM) is a significant contributor to air pollutant emissions, including nitrogen oxides (NOx) and particulate matter (PM). However, the fuel consumption and pollutant emissions from AM remain poorly quantified in many countries due to a lack of accurate activity data and emissions factors. In this study, the fuel consumption and air pollutant emission from AM were estimated using a survey and emission factors from the literature. A case study was conducted using data collected in Anhui, one of the agricultural provinces of China. The annual active hours of AM in Anhui ranged 130 to 175 h. The estimated diesel fuel consumption by AM was 1.45 Tg in 2013, approximately 25% of the total diesel consumption in the province. The air pollutants emitted by AM were 57 Gg of carbon monoxide, 14 Gg of hydrocarbon, 74 Gg of NOx and 5.7 Gg of PM in 2013. The NOx and PM emissions from AM were equivalent to 17% and 22% of total on-road traffic emissions in Anhui. Among nine types of AM considered, rural vehicles are the largest contributors to fuel consumption (31%) and air emissions (33–45%).
1. Introduction
The transportation sector, including on-road and off-road vehicles, is one of the largest contributors to fuel consumption and air pollution, including greenhouse gases [,]. It was estimated that in 2016 vehicular emissions contributed 10% of primary PM (particulate matter), 19% of CO (carbon monoxide) and 30% of NOx (nitrogen oxides) emissions in European Union (EU) Member States []. In the past three decades, aggressive measures for on-road vehicles have been carried out to save fuel and control emissions [,,], while efforts to conserve energy and reduce emissions from non-road vehicles have been limited [,].
Agricultural machinery (AM) is a major emission source, especially in some developing countries, such as China and India, where AM has become an essential tool for transportation, planting and harvesting, most of which were fueled with diesel and have been poorly maintained []. Regulatory bodies, such as the EU and US Environmental Protection Agency (US EPA), have introduced standards to regulate the exhaust emissions from non-road vehicles including AM [,]. The European legislation standards refer to Emission Stages, while in the US they are identified as Tiers []. In China, several National Emission Standards for diesel engines of non-road mobile machinery have been implemented since 2007. The most recent emission standard was the National Emission Standards III, implemented on 1 October 2014 [], while the National Emission Standards Ⅳ will be carried out at the end of 2022 [].
Studies focusing on air emissions from non-road mobile sources including AM have been carried out in some developed countries since 1990. One of the methods employed is the use of engine population, rated power, annual active hours and emission factors to estimate emissions. The method was used to calculate annual exhaust emissions from off-road mobile sources (agriculture, forestry, industry, household, railway and inland waterways) in Europe in 1990 [] and in the USA for off-road diesel equipment used for agriculture, construction, logging and mining in 1996 [].
In China, the estimation of non-road mobile source emissions has gained more attention during the past decade. Zhang et al. [] estimated the total emissions from non-road mobile sources (plane, agriculture, construction equipment, railway and inland waterways) in the Pearl River Delta region in 2006. A nationwide estimate of AM emissions in 2014 indicates that PM2.5, THC and NOx were approximately equal to 83%, 36% and 35% of the emissions from the on-road vehicles []. With advancement in technical and regulations, AM emissions have been declining. A study of pollutant emissions of AM in Beijing, China found that the total emissions decreased over 60% during the 11-year study period of 2006 to 2016 []. However, there were large uncertainties in the estimation of AM emissions.
Errors in AM population, emission factor and activity data may hinder the accuracy of emission estimates. Due to logistical difficulty in collecting data from a large number of farmers scattered over rural areas, data (e.g., activity hours) from technical guidelines or statistical yearbooks have been used [,]. Another alternative is questionnaire surveys. Jin et al. [] estimated the emissions of AM in Tianjin in 2010 by using questionnaires. The survey method has also been used in other fields. For example, a bottom-up Chinese rural residential energy consumption database was developed with questionnaire survey data [,].
In this study, the questionnaire survey approach was employed. In a case study conducted in Anhui, China, fuel consumption by and air emissions from diesel AM in 2013 were estimated using data collected in a survey. The objectives of this study were (1) to investigate fuel consumption rate and annual active time of AM; (2) to calculate annul fuel consumption of AM by category; and (3) to estimate annual CO, HC, NOx, and PM emissions of AM.
Anhui, located in the center-east of China, covers an area of approximately 140 thousand square kilometers with a population of 60 million in 2013, whose GDP in 2013 was 303 billion USD. Anhui is a large agricultural province with a wide use of AM, mainly for growing grain, use in oil plants and in the cotton sector. As shown in Figure S1, there is a steady increase in the total power and diesel power of AM in the province from 2002 to 2015 []. In 2013, Anhui ranked fourth in China in terms of total power of AM, after Shandong, Hebei and Henan []. Table 1 shows the population and diesel power of nine types of AM in Anhui in 2013.

Table 1.
Population and power of diesel agricultural machinery (AM) in Anhui in 2013 [].
2. Method
2.1. Survey Questionnaire
The contents of the questionnaire include type, rated power, average volume of every refueling, average working time for every refueling and the total fuel consumption (busy and slack season) of each AM (Table S1). The questionnaires were distributed by undergraduate students of Anqing Normal University. Students whose home towns were in rural area of Anhui distributed the questionnaires in their villages at the beginning of their winter school break in early 2013 and collected the filled questionnaires at the end of the break.
A total of 350 questionnaires were distributed to 16 different towns in Anhui (Figure 1). Among those, 166 filled questionnaires from 13 towns were deemed valid (Table S2). The evaluation criteria were the fuel consumption rates (FR) calculated using rated power and hourly fuel consumption (Equation (1)) from the questionnaire should be in the range of 200 to 500 g/kWh []. Tao et al. [] quantified the rural residential energy transition in China through a national survey, whose average sample size was 97 for individual municipalities.

Figure 1.
Location of 16 sampling sites in Anhui, China.
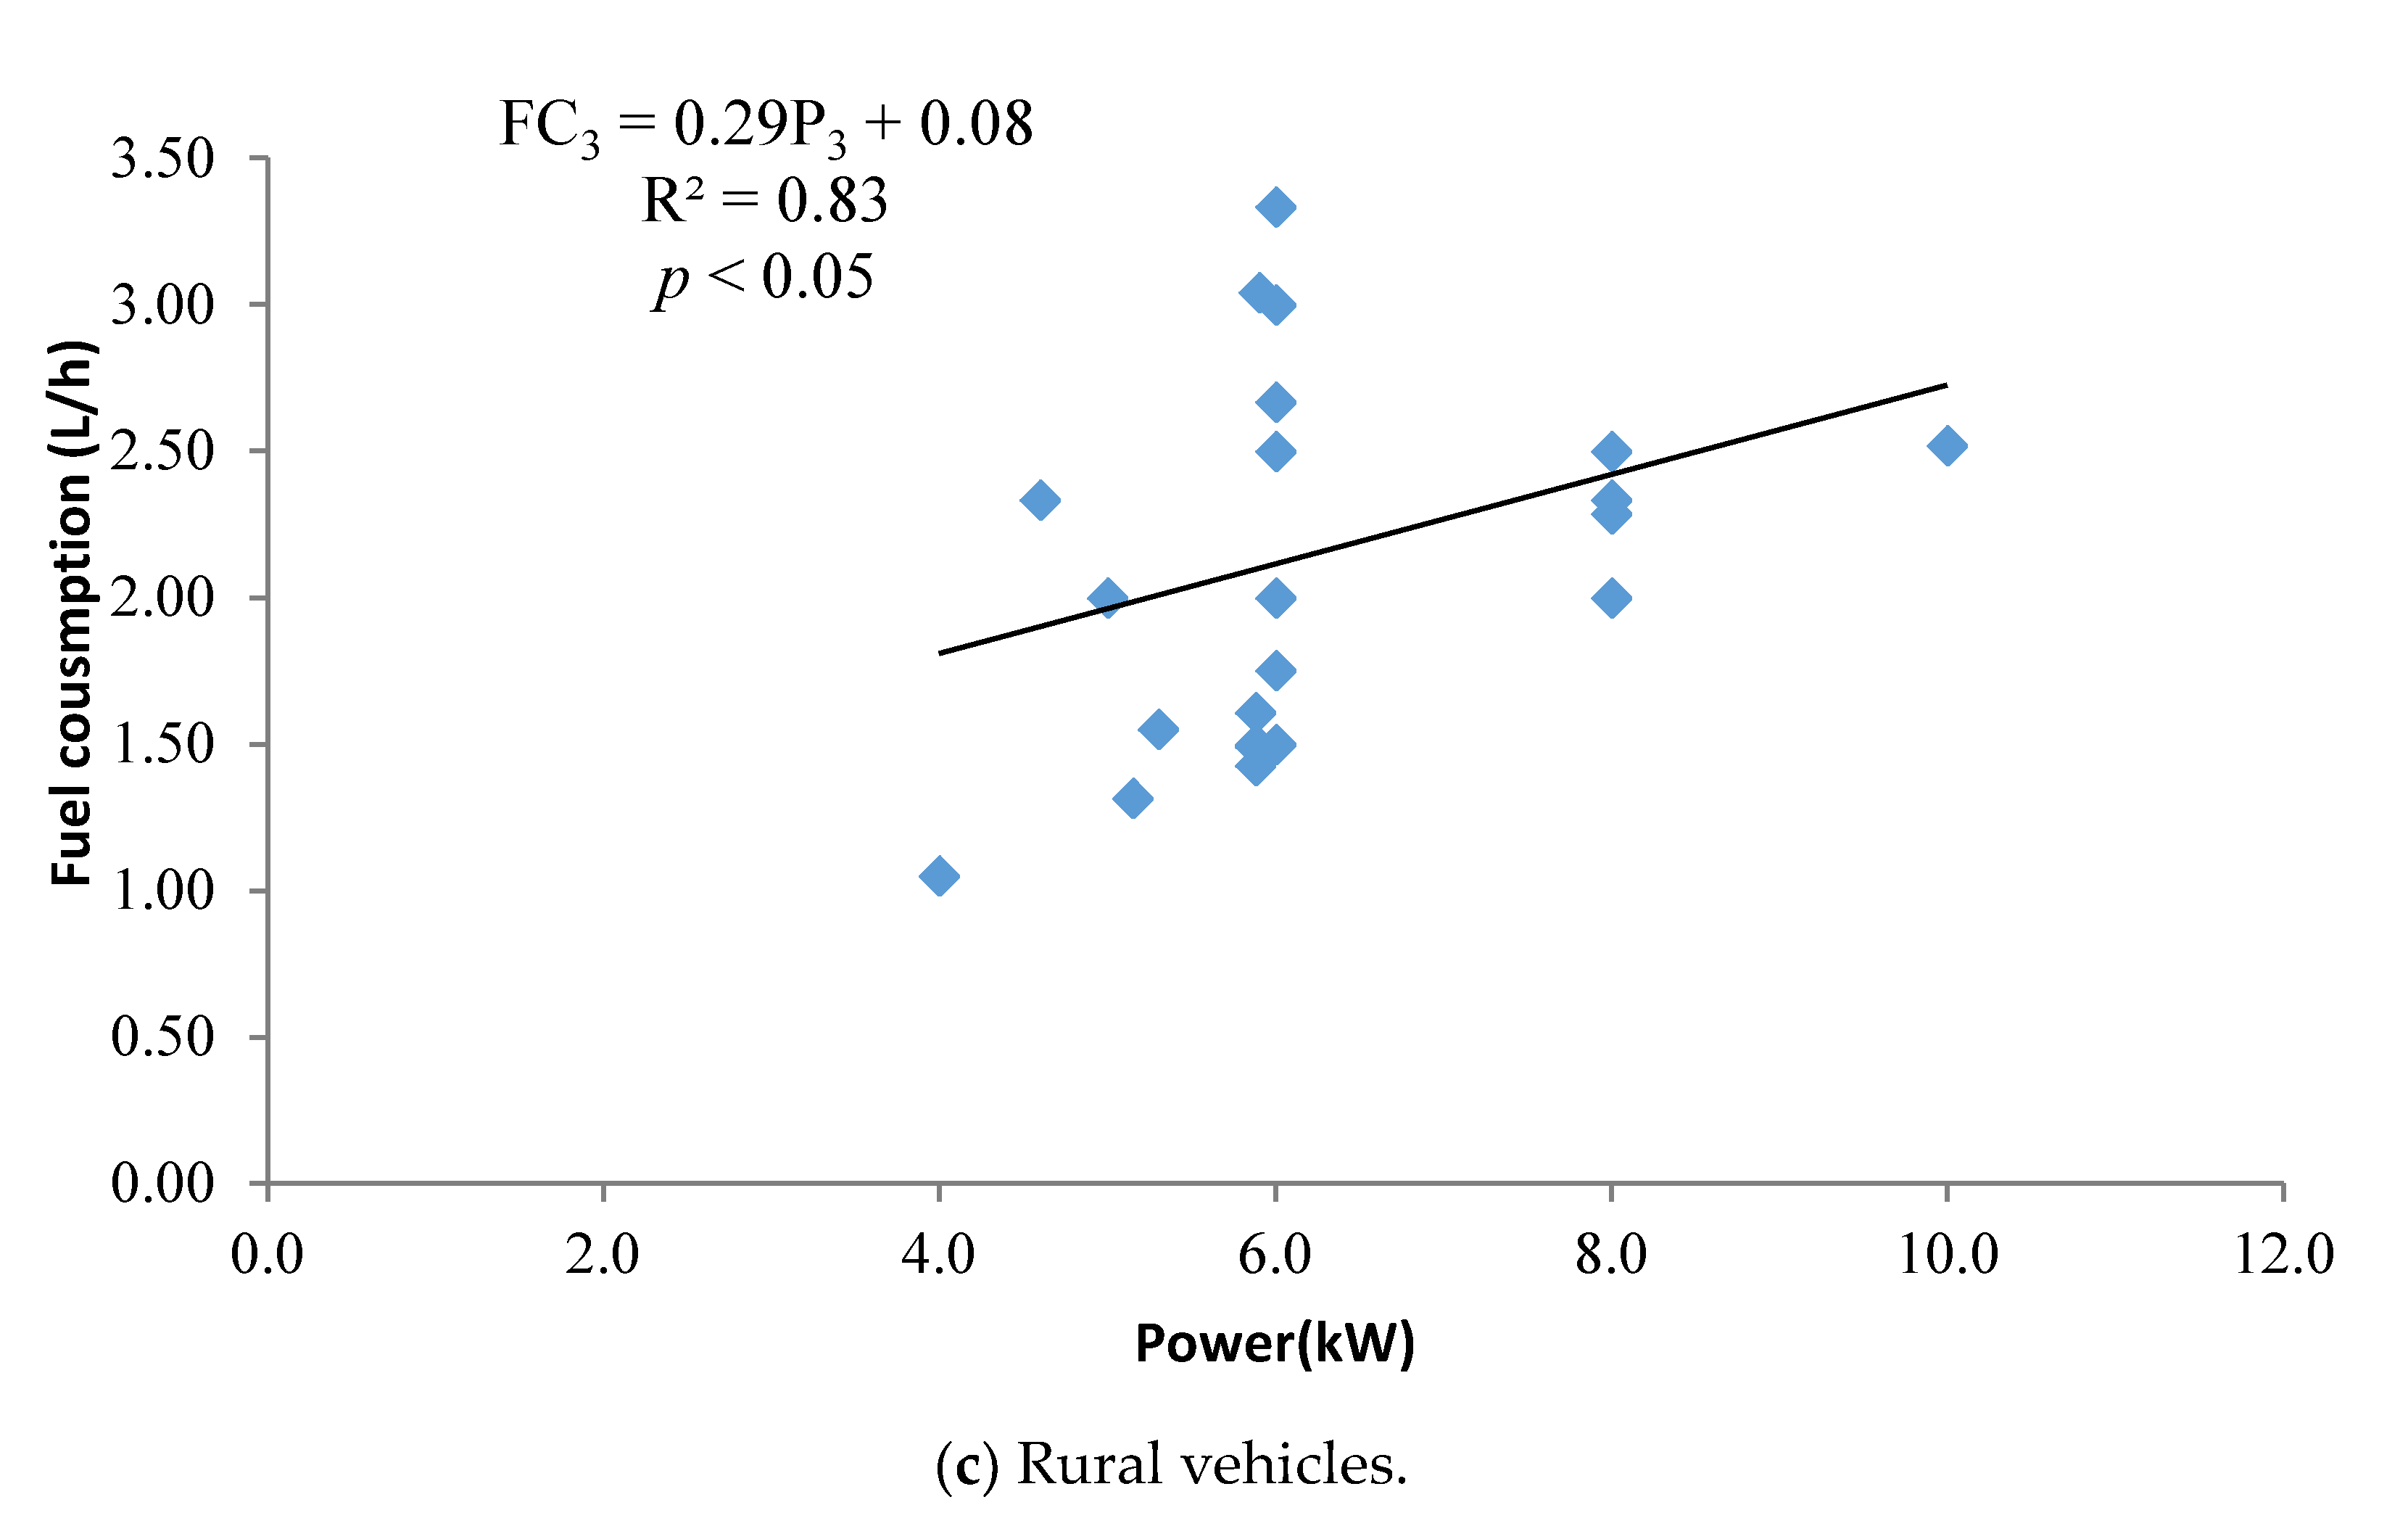
2.2. Fuel Consumption
In this study, FR (fuel consumption rate, g/kWh) of each type (i) of AM was calculated using Equation (1):
where ρ = density of diesel (0.85 kg/L), P = rated power (kw) of the engine, CP = hourly fuel consumption (L/h).
For small tractors, rural vehicles and planting equipment, the CP values were calculated using the average volume of every refueling (L) divided by the average working time of refueling (h) from the questionnaire. For the other six types, the CP values were estimated as follows: (1) to obtain a relationship between rated power and hourly fuel rate data collected in the questionnaire: one each for small tractors, planting equipment, and rural vehicles, respectively; (2) as seen, the slopes that reflect the relationship between hourly fuel consumption rates and power are 0.35, 0.27, 0.29 from the three datasets (Figure 2), which are fairly close; (3) based on the three regression equations and the average power (Table 2), the hourly fuel consumption was calculated for each of the other six types of AM, in consideration of the similarity of activity levels.


Figure 2.
The relationship between power and hourly fuel consumption for three kinds of agricultural machinery.

Table 2.
Hourly fuel consumption estimates.
Annual fuel consumptions (D, ton) of each type of AM (i) were calculated as follows:
where Pi is the diesel power of each type of AM (kW), LF is the load factor of 0.65 (working power being 65% of the rated power) [], Ti is the average annual active time (h), FRi is fuel consumption rate (g/kWh). For small tractors, rural vehicles and planting machineries, data collected in the questionnaire were used (Table 3); for the other six types of AM, data from MEEPRC [] and Fan et al. [] were used (Table 4).

Table 3.
Annual active time and fuel consumptions of three types of AM in Anhui, China.

Table 4.
Total fuel consumption of diesel AM in Anhui in 2013.
2.3. Effective Powers
Only the AMs in service were considered in this study. Pang et al. [] assumed a useful life of 15 years for AMs. In view of stricter standards, the useful life of agricultural machineries was assumed to be 10 or 12 years []. The effective diesel powers of the nine categories of AM in Anhui in 2013 were estimated by using the following equation:
where Pei is the effective diesel power of ith type of AM (kW), Pi,2013 is the statistical diesel power of ith type (kW) in 2013, Pi,2003 is the statistical diesel power of ith type of (kW) in 2003 []. R is the ratio of machinery in idle to total, which is usually more than 0.5, and the value of R is 0.8 in this paper.
2.4. Pollutant Emission Estimates
Annual air emissions (Ej, tons) were estimated as follows:
where j is type of pollutants, NOx, HC, CO, or PM; i is type of AM; D is the fuel consumption (kg); EF is the emission factor (g/kg fuel, hereafter referred as g/kg) listed in Table 5. The emission factors of large and medium tractors, rural vehicles, and planting equipment were obtained from previous studies [,,,], while those of the other six categories were based on the regulations of MEEPRC [].

Table 5.
Fuel-based emission factors of AM used in this study (g/kg).
3. Results
3.1. Total and Effective Power
The total diesel power of AM in Anhui was estimated to be 53 GW in 2013 with small tractors having the largest total power and forestry equipment having the least (Table 1). Small tractors, rural vehicles for transportation, planting equipment (mainly harvester and irrigation equipment) and large and middle tractors accounted for approximately 95% of the total power []. The average power can be calculated according to the total power and population of every category of AM, and the results showed that the average power of farmland construction equipment and large and middle tractors reached more than 40 kW per unit, while the average power of raw agricultural products equipment, planting equipment and small tractors were about 10 kW per unit. The total effective diesel power of AM in 2013 in Anhui was 30.7 GW (Table 1), which meant the effective power ratio was 0.58.
3.2. Fuel Consumption Rate and Annual Active Time
Using data from the questionnaires, the average annual active times of small tractors, rural vehicles and planting equipment were calculated as 276, 303 and 225 h, respectively (Table 3). The fuel consumption rates calculated using Equation (1) had a narrow range which was between 261 and 295 (Table 3).
The hourly fuel consumption rates of small tractors, planting equipment and rural vehicles could be obtained from the equations in Figure 2. Table 2 presents estimated fuel consumption rates of the other six types of AM which were not covered in the survey responses. Thus, an average value was obtained for each type of AM (Table 1) and used in the calculation of annul fuel consumption (Table 4).
Our results were in broad agreement with and Fu et al. [] and Ge et al. [], who reported that the annual active time of harvesters and large tractors were 150 h and 400–430 h, respectively. There are many kinds of AM in China, and different usage frequencies cause different annual active times. Some hired harvesters were used for different customs during busy time (usually from June to October), so their annual active time was likely to be much higher, e.g., more than 1000 h. On the other hand, the active time of idle AM was almost zero. This will inevitably cause uncertainty in the estimation. Considering that 42% of the AM is idle (the effective power ratio was 0.58), the effective average annual active time of AM in Anhui was estimated to be from 130 to 175 h (the results of our questionnaire were from 225 to 303 h).
3.3. Annual Fuel Consumption
The annual fuel consumptions of AM in Anhui in 2013 are in Table 4. Among the nine types of AM, rural vehicles such as low-speed vehicles [] accounted for 31% of the total fuel consumption, followed by planting equipment (23%), small tractors (22%) and large and medium tractors (19%), while the other five types combined contributed 6%.
The estimated total diesel consumption by all AM was 1.45 Tg in 2013. This value is greater than that in 2014 China Agricultural Statistical Yearbook (0.73 Tg) [] but close to that in Anhui Agricultural Mechanization Network (1.46 Tg) []. Our AM diesel consumption was one-fourth of diesel consumption by all sectors in Anhui in 2013 (5.76 Tg) [].
Fuel consumption was also closely related to annual active time. As the effective power was 30.7 GW and fuel consumption rates were about 290 g/kwh (our survey data were from 261 to 323), 1.45 Tg of fuel consumption corresponded to 163 h of annual active time in total, while 0.73 Tg [] of fuel consumption corresponded to 82 h of annual active time.
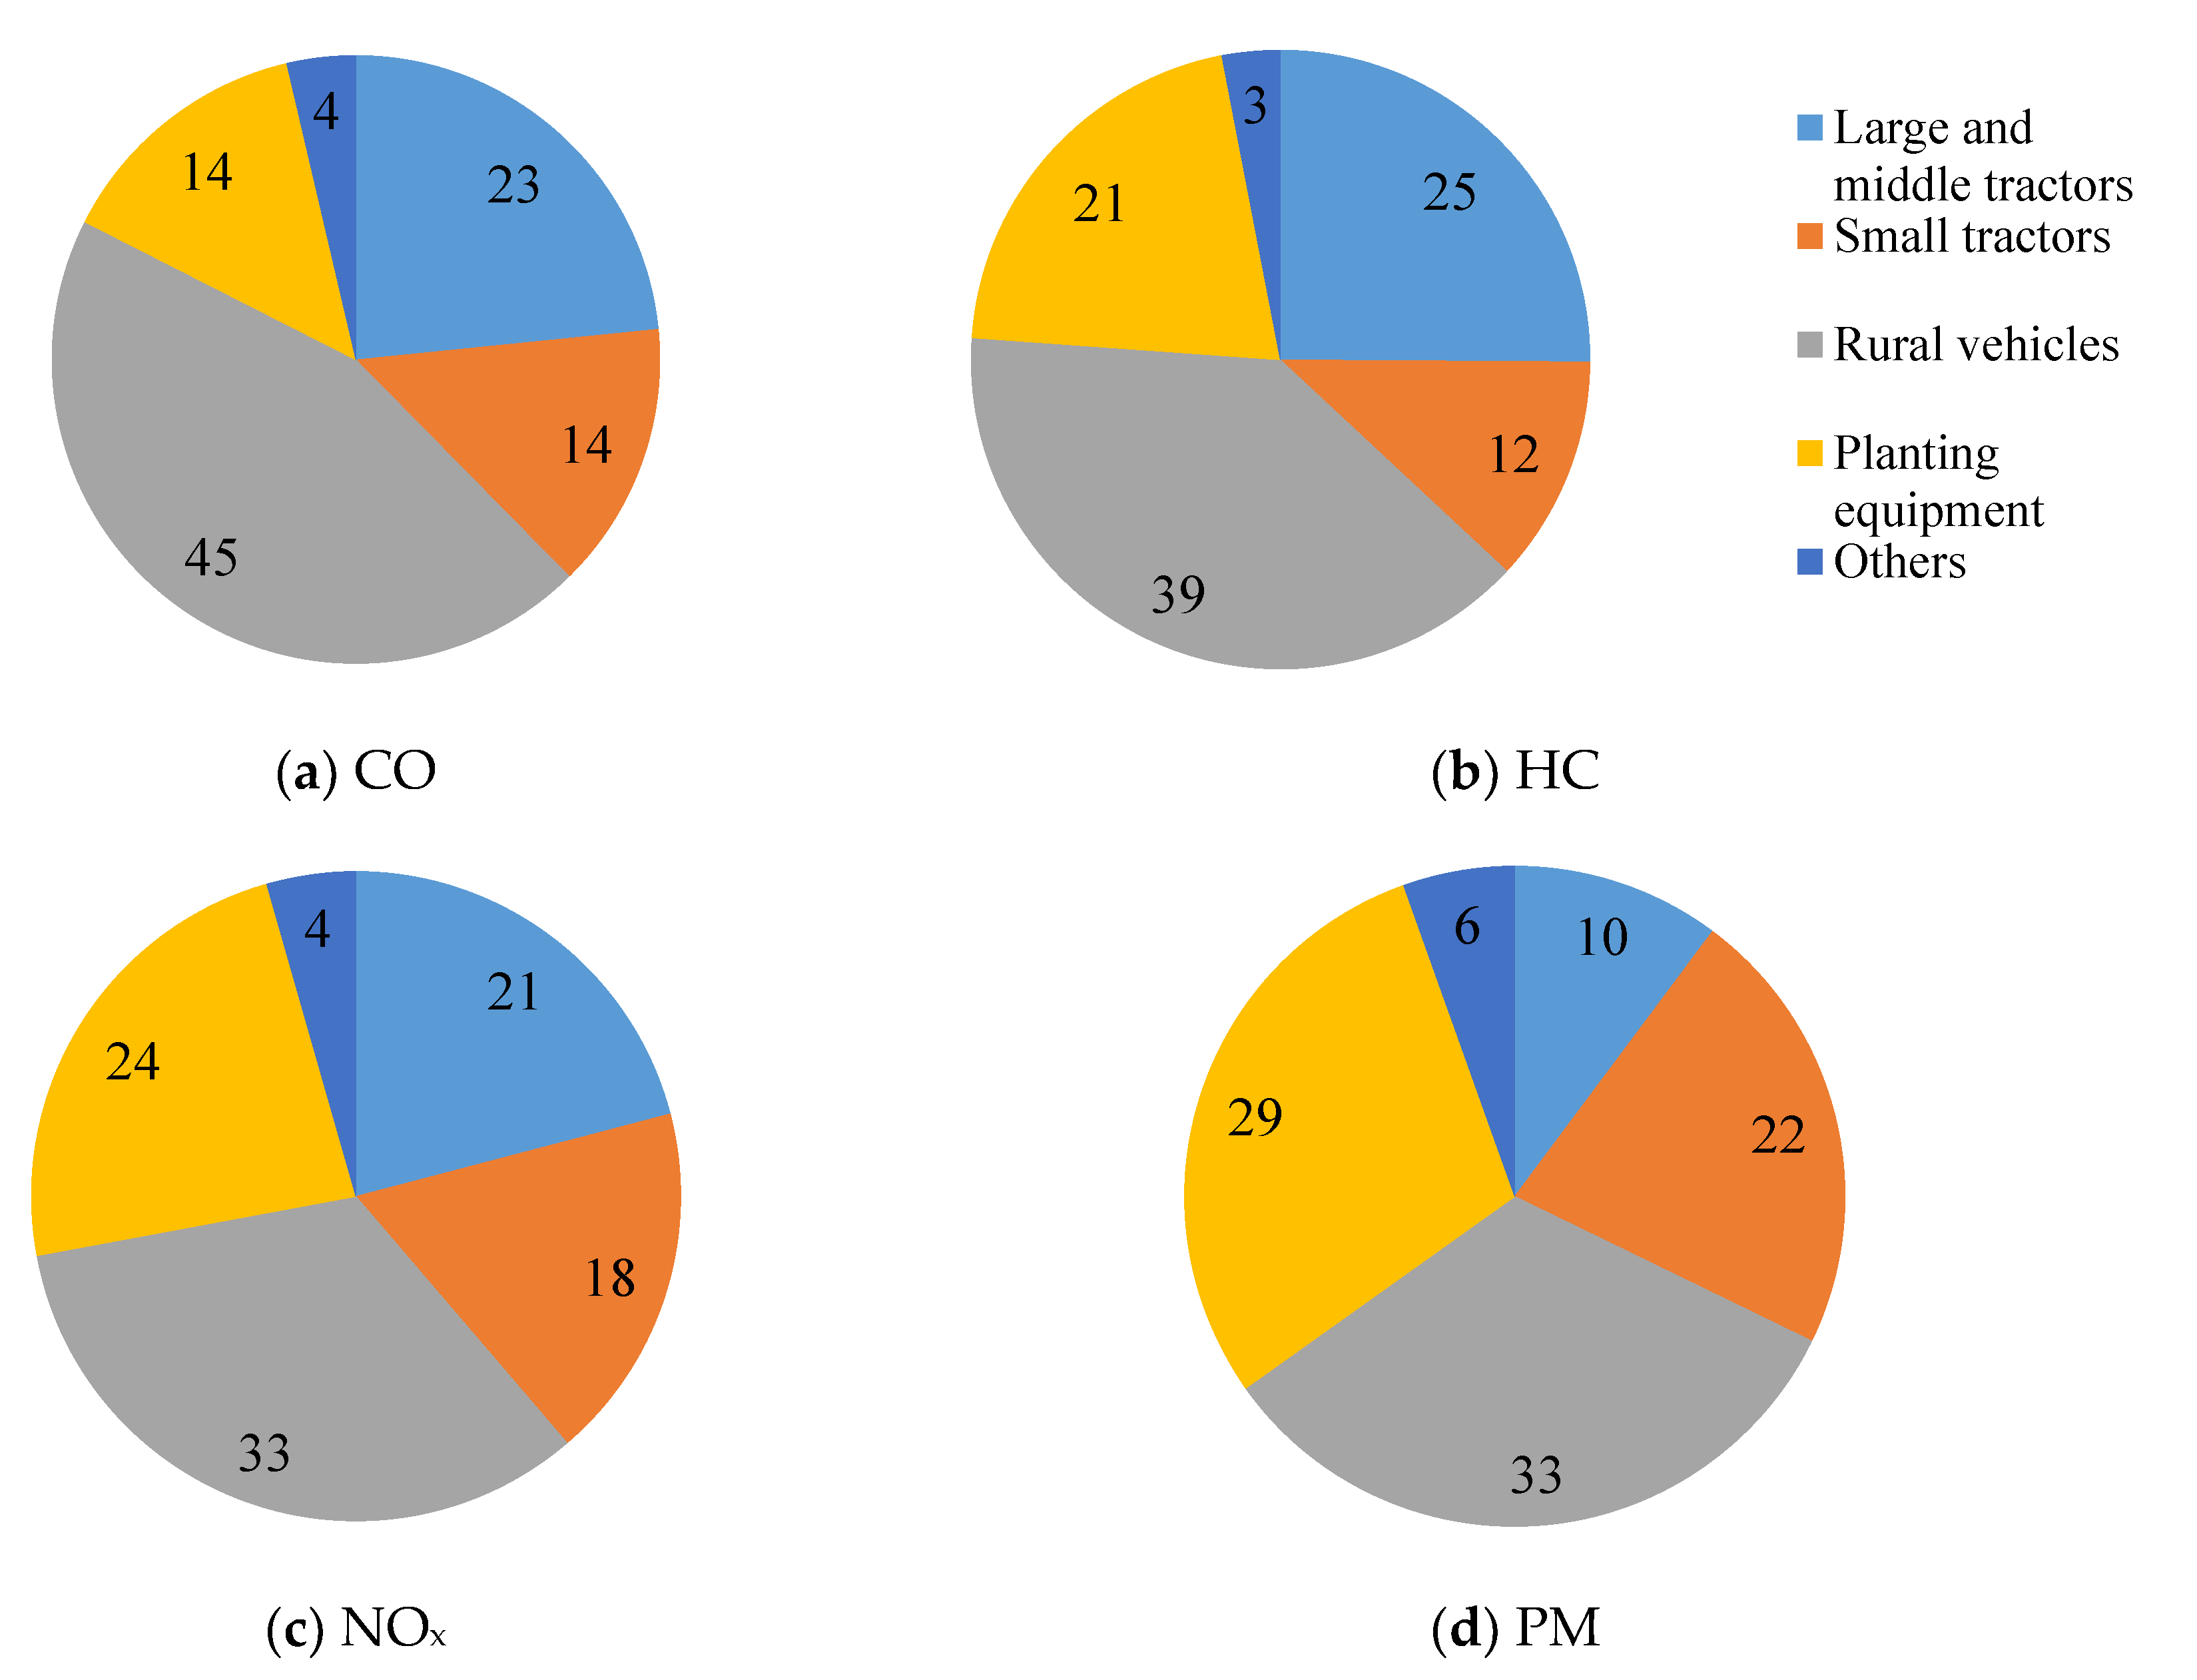
3.4. Air Pollutant Emissions
Based on the annual fuel consumption (Table 4) and corresponding emission factors (Table 5), the estimated air emissions for 2013 from AM were 57 Gg of CO, 14 Gg of HC, 74 Gg of NOx and 5.7 Gg of PM in Anhui. As shown in Figure 3, the vast majority (94%) of total emissions were from four AM types: large and medium tractors, small tractors, rural vehicles and planting machineries. Among these four AMs, rural vehicles ranked first in all four pollutants, and accounted for at least 33% of total emissions.

Figure 3.
Contributions (%) of emission from different agricultural machinery types to total emissions in Anhui in 2013.
Table 6 compares pollutant emissions in Anhui in this and other studies. Our emission estimates are much lower than those by Lang et al. [], especially HC. The large discrepancy could be attributable to many factors. One of them is different methodologies. Another is the activity time. Annual active hours of tractor and planting equipment in Lang et al. [] were mainly from 380 to 500 h, while those in this study were less than 300 h.

Table 6.
Pollutant emissions from AM and on road traffic in Anhui (Gg).
The large discrepancy in HC emission between this study and Lang et al. [] could also be due to the apparently higher HC emission factor in the latter. This is evident by a much higher nationwide HC emission in Lang et al. [] than that in Wang et al. [] (Table 7), while the emissions of NOx, PM and CO are similar in those two studies. Taking farm transport vehicles (called rural vehicles in this study) as an example, the ratios of HC emission factors to NOx emission factors were 3 in Lang et al. [], while the ratios were much smaller in Wang et al. [] (0.1) and in this study (0.12 to 0.22).

Table 7.
Pollutant emissions from AM in China (Gg).
Based on our estimates, the ratios of emissions from AM to emissions from on-road vehicles were 0.17 for NOx and 0.22 for PM, while they were 0.07 for CO and 0.08 for HC in the study region (Table 6). This is consistent with another study that reported NOx and PM emissions from AM (1.74 Tg and 0.15 Tg, respectively) were one-fourth of those from road traffic (6.4 Tg and 0.62 Tg, respectively) in China in 2012 []. Our results indicate that AM is a significant contributor to air emissions in Anhui, especially NOx and PM.
4. Conclusions and Suggestions
In this study, fuel consumption and air pollutant emissions, NOx, PM, HC and CO from AM in Anhui in 2013 were estimated using data collected from questionnaires and the literature. Our results showed that AM consumed 25% of provincial level diesel fuel in 2013. AM is also a significant contributor to air pollutants emissions, with NOx and PM emissions from AM being equivalent to 17% and 22% of provincial on-road traffic emissions, respectively. Among the nine types of AM, large and medium tractors, small tractors, rural vehicles and planting machineries accounted for the lion’s share of fuel consumption and air emission (more than 94%).
Although provincial level total fuel consumption and emission by AM are available in Chinese government reports, there is no breakdown by the type of AM. Our survey-based analysis filled in data gaps in fuel consumption and air pollutant emissions by each of the nine types of AM and the dominant contributors to emissions. The information could aid the improvement of emission estimates and the development of emission control strategies. The approach is low in cost and with acceptable accuracy. Therefore, it can also be employed in developing countries where emission inventory is less advanced. The limitations of our study include a relatively small sample size. Future studies may also include more provinces to take into consideration regional characteristics, such as climate, type of crops and degree of utilization of AM.
Our results are helpful for policy makers. In China, the emission limits lagged behind USA and Europe for about eight years (NOx limits is 3.3 g/kwh for China in 2020 and for Europe in 2012 with the power between 75 and 130 kw, respectively). The regulatory framework would be more sound with more eco-friendly limits adopted in developed countries. In addition, some policies regarding energy saving and emission reduction of AMs should pay more attention to tractors and rural vehicles, since they account for the lion’s share of fuel consumption and air emission from AMs.
Supplementary Materials
The following are available online at https://www.mdpi.com/article/10.3390/atmos12040440/s1, Figure S1: Total and diesel power of agricultural machinery in Anhui from 2002 to 2015 [], Table S1: Questionnaire, Table S2: Numbers of questionnaire.
Author Contributions
Conceptualization, Y.G., H.M. and T.J.; methodology, Y.C., X.X., Z.S. and T.J.; software, X.M.; investigation, Y.A., Z.R., Z.X. and X.M.; resources, Z.X. and Z.S.; data curation, Y.A., Z.R. and X.L.; writing-original draft preparation, Y.A.; writing-review & editing, X.X., H.M. and T.J.; supervision, Y.G., Y.C., X.X., H.M. and Z.S.; funding acquisition, T.J. and X.X.. All authors have read and agreed to the published version of the manuscript.
Funding
This study was sponsored by the National Key Research and Development Program of China (2017YFC0212100), Energy Foundation of China (G-1110-15063), National Engineering Laboratory for Mobile Source Emission Control Technology (NELMS2019A09), the Mitacs Globalink Research Internship Program, and Natural Science and Engineering Research Council of Canada.
Institutional Review Board Statement
Not applicable.
Informed Consent Statement
Not applicable.
Data Availability Statement
The load factor and annual activity time are openly provided by Ministry of Ecology and Environment of the People’s Republic of China (MEEPRC), available online: http://www.mee.gov.cn/gkml/hbb/bgg/201501/t20150107_293955.htm?COLLCC=4091198132& (accessed on 10 March 2021). Emission factors of part of AM are openly provided by Ministry of Ecology and Environment of the People’s Republic of China (MEEPRC), available online: http://datacenter.mee.gov.cn/websjzx/report!list.action?xmlname=1520238134405 (accessed on 10 March 2021). Pollutant emissions from on-road vehicles in 2012 and 2014 are openly provided by Tsinghua University (THU), available online: http://www.meicmodel.org/ (accessed on 10 March 2021).
Conflicts of Interest
The authors declare no conflict of interest.
References
- Fontaras, G.; Zacharof, N.G.; Ciuffo, B. Fuel consumption and CO2 emissions from passenger cars in Europe—Laboratory versus real-world emissions. Prog. Energy Combust. Sci. 2017, 60, 97–131. [Google Scholar] [CrossRef]
- Fan, Y.V.; Perry, S.; Klemeš, J.J.; Lee, T.C. A review on air emissions assessment: Transportation. J. Clean. Prod. 2018, 194, 673–684. [Google Scholar] [CrossRef]
- EEA (European Environment Agency). Emissions of Air Pollutants from Transport. 2019. Available online: https://www.eea.europa.eu/data-and-maps/indicators/transport-emissions-of-air-pollutants-8/transport-emissions-of-air-pollutants-6 (accessed on 10 March 2021).
- Weiss, M.; Bonnel, P.; Hummel, R.; Provenza, A.; Manfredi, U. On-road emissions of light-duty vehicles in Europe. Environ. Sci. Technol. 2011, 45, 8575–8581. [Google Scholar] [CrossRef]
- May, A.A.; Nguyen, N.T.; Chang, O.; Shiyan, C.; Cicero-Fernandez, P.; Dikins, L.; Fuentes, M.; Huang, S.; Ling, R.; Long, J.; et al. Gas- and particle-phase primary emissions from in-use, on-road gasoline and diesel vehicles. Atmos. Environ. 2014, 88, 247–260. [Google Scholar] [CrossRef]
- Wu, Y.; Zhang, S.J.; Hao, J.M.; Liu, H.; Wu, X.M.; Hu, J.N.; Walsh, M.P.; Wallington, T.J.; Zhang, K.M.; Stevanovic, S. On-road vehicle emissions and their control in China: A review and outlook. Sci. Total Environ. 2017, 574, 332–349. [Google Scholar] [CrossRef] [PubMed]
- Waluś, K.J.; Warguła, Ł.; Krawiec, P.; Adamiec, J.M. Legal regulations of restrictions of air pollution made by non-road mobile machinery—The case study for Europe: A review. Environ. Sci. Pollut. Res. 2018, 25, 3243–3259. [Google Scholar] [CrossRef] [PubMed]
- MEEPRC (Ministry of Ecology and Environment of the People’s Republic of China). Non-Road Mobile Source Emissions Inventory Compiled Technical Guidelines (Draft). 2019. Available online: http://www.mee.gov.cn/gkml/hbb/bgg/201501/t20150107_293955.htm?COLLCC=4091198132& (accessed on 10 March 2021). (In Chinese)
- Hou, X.N.; Tian, J.L.; Song, C.B.; Wang, J.; Zhao, J.Y.; Zhang, X.M. Emission inventory research of typical agricultural machinery in Beijing, China. Atmos. Environ. 2019, 216, 116903. [Google Scholar] [CrossRef]
- Pouliot, G.; Pierce, T.; Denier van der Gon, H.; Schaap, M.; Moran, M.; Nopmongcol, U. Comparing emission inventories and model-ready emission datasets between Europe and North America for the AQMEII project. Atmos. Environ. 2012, 53, 4–14. [Google Scholar] [CrossRef]
- Lovarelli, D.; Bacenetti, J. Exhaust gases emissions from agricultural tractors: State of the art and future perspectives for machinery operators. Biosyst. Eng. 2019, 186, 204–213. [Google Scholar] [CrossRef]
- Delphi. Delphi Technologies Global Emission Standards 2020. Available online: https://www.delphi.com/innovations (accessed on 10 March 2021).
- MEEPRC (Ministry of Ecology and Environment of the People’s Republic of China). Limits and Measurement Methods for Exhaust Pollutants from Diesel Engines of Non-Road Mobile Machinery (China III, IV). 2014. Available online: http://datacenter.mee.gov.cn/websjzx/report!list.action?xmlname=1520238134405 (accessed on 10 March 2021). (In Chinese)
- MEEPRC (Ministry of Ecology and Environment of the People’s Republic of China). Non-Road Mobile Machinery Diesel Engine exhaust Pollutant Emission Limits and Measurement Methods (China III, IV) Amendments and Non-Road Diesel Mobile Machinery Pollutant Emission Control Technical Requirements Interpretation. 2021. Available online: http://www.mee.gov.cn/zcwj/zcjd/202101/t20210104_816001.shtml?keywords=%E9%9D%9E%E9%81%93%E8%B7%AF% (accessed on 10 March 2021). (In Chinese)
- Samaras, Z.; Zierock, K.-H. Off-road vehicles: A comparison of emissions with those from road transport. Sci. Total Environ. 1995, 169, 249–255. [Google Scholar] [CrossRef]
- Kean, A.; Sawyer, R.; Harley, R. A fuel-based assessment of off-road diesel engine emissions. Air Waste Manag. Assoc. 2000, 50, 1929–1939. [Google Scholar] [CrossRef]
- Zhang, L.J.; Zheng, J.Y.; Yin, S.S.; Peng, K.; Zhong, L.J. Development of Non-road Mobile Source Emission Inventory for the Pearl River Delta Region. Environ. Sci. 2010, 31, 886–891. (In Chinese) [Google Scholar]
- Lang, J.L.; Tian, J.J.; Zhou, Y.; Li, K.H.; Chen, D.S.; Huang, Q.; Xing, X.F.; Zhang, Y.Y.; Cheng, S.Y. A high temporal-spatial resolution air pollutant emission inventory for agricultural machinery in China. J. Clean. Prod. 2018, 183, 1110–1121. [Google Scholar] [CrossRef]
- Wang, F.; Li, Z.; Zhang, K.S.; Di, B.F.; Hu, B.M. An overview of non-road equipment emissions in China. Atmos. Environ. 2016, 132, 283–289. [Google Scholar] [CrossRef]
- Jin, T.S.; Chen, D.; Fu, X.M.; Li, Y.Q.; Yi, Z.Q.; Lu, K.B. Estimation of agricultural machinery emissions in Tianjin in 2010 based on fuel consumption. China Environ. Sci. 2014, 34, 2148–2152. (In Chinese) [Google Scholar]
- Ru, M.Y.; Tao, S.; Smith, K.; Shen, G.F.; Shen, H.Z.; Huang, Y.; Chen, H.; Chen, Y.L.; Chen, X.; Liu, J.F.; et al. Direct Energy Consumption Associated Emissions by Rural-to-Urban Migrants in Beijing. Environ. Sci. Technol. 2015, 45, 8575–8581. [Google Scholar] [CrossRef] [PubMed]
- Tao, S.; Ru, M.Y.; Du, W.; Zhu, X.; Zhong, Q.R.; Li, B.G.; Shen, G.F.; Pang, X.L.; Meng, W.J.; Chen, Y.L.; et al. Quantifying the rural residential energy transition in China from 1992 to 2012 through a representative national survey. Nat. Energy 2018, 3, 567–573. [Google Scholar] [CrossRef]
- AAMN (Anhui Agricultural Mechanization Network). Statistical Data: The Provincial Quantity of Agricultural machinery. 2018. Available online: http://www.ahnjh.gov.cn/info/item.asp (accessed on 15 May 2018). (In Chinese)
- NBSRSEIDC (National Bureau of Statistics of Rural Social Economic Investigation Department of China). China Rural Statistical Yearbook; NBSRSEIDC: Beijing, China, 2014. (In Chinese) [Google Scholar]
- Gu, Q. Analysis and Prediction of Fuel Consumption Rate for Non-Road Diesel Engine. Chin. Inter. Combust. Engine Eng. 2010, 31, 7–10. (In Chinese) [Google Scholar]
- Fan, S.B.; Nie, L.; Gan, R.B.; Li, X.F.; Yang, T. Estimation of agricultural machinery emissions in Beijing based on fuel consumption. J. Saf. Environ. 2011, 2, 145–148. (In Chinese) [Google Scholar]
- Pang, K.L.; Zhang, K.S.; Di, B.F.; Ma, S. Cost-Benefit Analysis of Emission Control Measures for Agricultural and Industrial Equipment in China. Chin. Environ. Manag. 2019, 11, 55–61. (In Chinese) [Google Scholar]
- Bacenetti, J.; Lovarelli, D.; Facchinetti, D.; Pessina, D. An environmental comparison of techniques to reduce pollutants emissions related to agricultural tractors. Biosyst. Eng. 2018, 171, 30–40. [Google Scholar] [CrossRef]
- Fu, M.L.; Ding, Y.; Yin, H.; Ji, Z.; Ge, Y.S.; Liang, B. Emission Characteristics of Agricultural Tractors Under the Actual Operating Condition. J. Agric. Eng. 2013, 6, 42–48. (In Chinese) [Google Scholar]
- Shen, X.B. Study on Emission Characteristics for Rural Vehicles; Beijing Technology and Business University: Beijing, China, 2010. (In Chinese) [Google Scholar]
- Yao, Z.L.; Huo, H.; Zhang, Q.; Streets, D.G.; He, K. Gaseous and particulate emissions from rural vehicles in China. Atmos. Environ. 2011, 45, 3055–3061. [Google Scholar] [CrossRef]
- Ge, Y.S.; Liu, H.K.; Ding, Y.; Yin, H.; Fu, M.L.; Li, J.Q. A Study on the Characteristics of the Emissions and Fuel Consumption of Combined Harvester. J. Agric. Eng. 2013, 19, 41–47. (In Chinese) [Google Scholar]
- MEEPRC (Ministry of Ecology and Environment of the People’s Republic of China). China Vehicle Environmental Management Annual Report. 2020. Available online: http://www.mee.gov.cn/hjzl/sthjzk/ydyhjgl/202008/P020200811521365906550.pdf (accessed on 10 March 2021). (In Chinese)
- THU (Tsinghua University). Multi-resolution Emission Inventory for China. 2019. Available online: http://www.meicmodel.org/ (accessed on 10 March 2021).
Publisher’s Note: MDPI stays neutral with regard to jurisdictional claims in published maps and institutional affiliations. |
© 2021 by the authors. Licensee MDPI, Basel, Switzerland. This article is an open access article distributed under the terms and conditions of the Creative Commons Attribution (CC BY) license (http://creativecommons.org/licenses/by/4.0/).