Abstract
Elements atmospheric deposition was studied by mosses method in Kosovo. Mosses are a very useful tool for atmospheric deposition of elements monitoring, owing to their physiological and morphological characteristics. Moss samples were collected from 45 locations, they were cleaned from leaves, twigs and other materials, they were grinded, digested in a microwave system and analyzed by spectroscopy Inductively Coupled Plasma Atomic Emission Spectroscopy (ICP-AES) and Inductively Coupled Plasma Mass Spectrometry (ICP-MS). A total of 25 elements concentration in collected moss samples was determined: Al, As, Ba, Ca, Cd, Co, Cr, Cu, Fe, Hg, K, Li, Mg, Mn, Mo, Na, Ni, P, Pb, Sb, Sr, Ti, Tl, V and Zn. Extremely high concentrations of Pb and Zn were found in moss samples from the areas of Zveçan and Stanterg where the ore processing facilities are located, as well as the tailings landfill in Mitrovica which is nearby in the south, which reflects eminent air pollution. High concentrations of As and Cd were also measured in the same sampling points. The obtained results were processed by multivariate statistical analysis/factor analysis, which resulted in four factors, one anthropogenic and three geogenic or mixed geogenic-anthropogenic. The factor analysis revealed that the area with the highest atmospheric deposition of potentially toxic elements is the basin of Kosovo, from the north in Leposaviç to the south in Hani i Elezit because of the industrial plants laying in this line.
1. Introduction
Air pollution in general is a very eminent issue globally and particularly for developing countries which do not dispose with appropriate technology to reduce gasses, dust emissions and other waste products into the atmosphere. Among chemical pollutants, heavy metals are of great concern because they are known to inflict several health disorders in humans. For illustration a few health damaging effects of some of the heavy metals are mentioned as follows. Lead is largely known for its toxicity effects in humans, such as nervous system damage in children [1], children recovered from lead encephalopathy can suffer from mental retardation, optic neuropathy and epilepsy [2], adults may develop hypertension [3]. Mercury has neurotoxic effects and even deaths are reported as a result of mercury intoxication [4]. Cadmium shows adverse effects in respiratory system, bone, cardiovascular system, liver and other health complications [5]. Exposure to arsenic can result in several health disorders including cancer [6].
Heavy metals, not only are harmful to the environment, but they also are refractory so they do not ever destroy like some of the organic pollutants do. All elements occur naturally but human activities cause them to accumulate in different areas, where as concentrated some of them can harm living organisms. All environmental compartments are subject to heavy metal pollution which originates from mining activities [7], traffic [8], fossil fuel burning [9], metal processing [10], agriculture [11], etc.
Regarding environmental pollution by heavy metals in Kosovo, there has been some research mainly concentrated in water and soil, but studies on air pollution are scarce. Potentially toxic elements such as As, Cd, Cr, Co, Cu, Ni, Pb and Zn, were analyzed in the sediments and water of Trepça and Sitnica rivers [12]. It was found that in most of the water samples the concentration of these metals was not beyond the European and Kosovo permissible limits; however, the sediments of both rivers were highly polluted. Drenica River sediment was found to be polluted with some of heavy metals with anthropogenic origin, mainly from waste water discharges from a nickel refining site “Ferronikeli” plant [13]. Soil contamination research has been performed mainly around Trepça mining and metallurgical plant [14,15,16] which is the biggest in the country, thus representing the main source of potentially toxic elements pollution. The concentration of 36 elements in surface soil (0–5 cm) was determined around the lead and zinc smelter (Trepça) in Mitrovica [17]. It was found that the anthropogenic activities resulted in elevated concentration of Ag, Pb, Sb, Bi, Zn, Cd, As, Cu, Hg, Au, Tl and Mo, which mainly reflected mining and processing activities around the location. Comparing some elements’ concentration with the European median topsoil, the concentrations of elements were much higher, i.e., Pb by 20-fold, Cd 11-fold, Hg 5.5-fold, As 4.6-fold, Zn-4.2 and Cu 3.2-fold. It was reported that agricultural soil contamination in the industrial area of Mitrovica by potentially toxic elements (As, Cd, Cu, Pb, Sb and Zn) is mainly due to the emissions from industrial plants such as Zvecan smelter and Trepča factory [18]. An elemental analysis of total suspended particulate matter in air was performed using high volume air samplers in four sites in Kosovo: Kacanik, Ferizaj (Urosevac), Pristina and Mitrovica [19]. According to this study soil dust, cement production, vehicular emissions, brake wear and fuel combustion were identified as major sources of pollution.
In this work air pollution by metals and other elements in Kosovo was investigated using mosses as biomonitors. Various plants are used as biomonitors for trace elements monitoring in air [20,21,22,23,24]. However, mosses became very important in heavy metal monitoring because they have the advantage of not taking their nutrients from the substrate as they do not have real roots, vascular system and other morphological characteristics, which facts make them dependent on atmospheric uptake of food [21,25,26,27,28]. Since their uptake is from air only, it can be expected that the quantity of elements determined in them represents that absorbed from air, hence, air pollution measurement. In comparison to conventional deposition analysis, the use of mosses as biomonitors is easier, cheaper and enables more coverage of the surveyed territory [29]. The increasing number of articles on the use of mosses as a biomonitoring tool for air pollution monitoring, strongly emphasizes their importance on the issue [30,31,32,33,34,35,36,37]. Nevertheless, in Kosovo, until now there is only one single study performed in the whole territory of Kosovo on the deposition of metals on mosses with the aim of assessing air pollution [38]. The atmospheric deposition of Cd, Cr, Cu, Fe, Hg, Ni, Mn, Pb and Zn was investigated in 25 locations, whereas samples were collected in 2010. Highly to extremely levels of pollution were measured.
The present study was performed by selecting 45 sampling points, covering the whole territory of Kosovo as homogeneously as possible. This is the second, broader and higher resolution survey of elements atmospheric deposition performed by mosses biomonitoring. Its aim was to estimate the level of air pollution, elements associations and to identify their origins as well as pollution sources through multivariate statistical analysis. The aim was also to report on temporal trends in the potentially toxic elements content in mosses in the Kosovo between 2010 and 2019, as well as to the results of this survey with those of neighboring countries (Albania and North Macedonia) and Norway as a pristine area, observed in 2015.
2. Materials and Methods
2.1. Study Area
Kosovo is situated in the Balkan Peninsula within the longitudes 41°50′58″ and 43°15′42″ and within the latitudes 20°01′30″ and 21°48′02″. It lies over a surface of 10,900 km2 and it is characterized by an average altitude of about 800 m above sea level. Geologically Kosovo is composed of a complex setting of formations. There is also a high mineral activity of Pb-Zn, Cu, Ni and Cr positioned in different parts of the territory. The total estimated land is at 858,063 ha and about 63.3% is agricultural land area and 35% is forest area. The geology of Kosovo is complex, with formations created at different intervals of geological timeline (Figure 1). Metamorphic, flysch, carbonate rocks and clastic sediments appear to cover most of the area. Then, there are deluvial/proluvial sediments mostly in the west, south and to the east of the territory, magmatic rocks mostly are found in the north and the east and magmatic rocks mostly in the north and north/east. There are also alluvial sediments which lie along the river basins, such as Drin, Sitnica and Morava rivers.
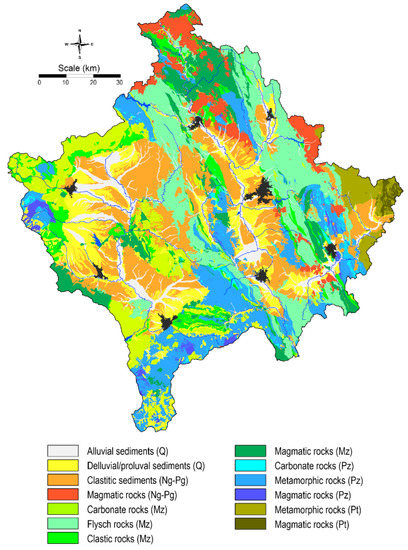
Figure 1.
The geological map of Kosovo.
2.2. Sampling
The collection of moss samples was performed during the dry season of summer, August to September in 2019. The homogeneity of sampling points was to the maximum the presence of mosses allowed, as can be seen in Figure 2. The procedure of sampling was in accordance with the Monitoring Manual of “International Cooperative Programme on Effects of Air Pollution on Natural Vegetation and Crops, 2020”. There were collected three types of mosses (Figure 3), Homalothecium sericeum (Hedw.) Schimp. 1851, Hypnum cupressiforme Hedwig, 1801 and Pseudoscleropodium purum (Hedw.) M.Fleisch. Three to ten (most of them over five) samples were collected in each sampling site, in an area of 50 × 50 m² and they were put in paper bags of 1 L which were stored for 5–7 days at ambient temperature (20–25 °C) prior to cleaning. There was no mixing of the types of mosses, in each sampling site only one type of mosses was collected. Samples were taken at least 100 m away from small roads and over 300 m away from main roads, villages and industries. All samples were collected from ground and rarely from rotten branches and trees in open fields with low shrubs or no shrubs at all. In case of forest covered areas mosses were taken from forest gaps of at least 10 m diameter and over 3 m from the nearest tree canopy drip.
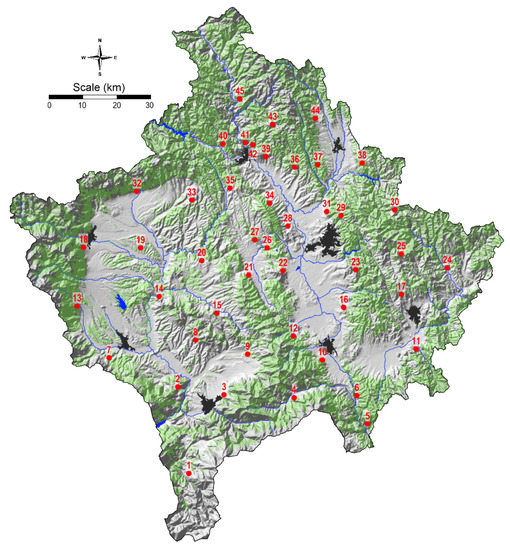
Figure 2.
The map of distribution of mosses sampling points in Kosovo.
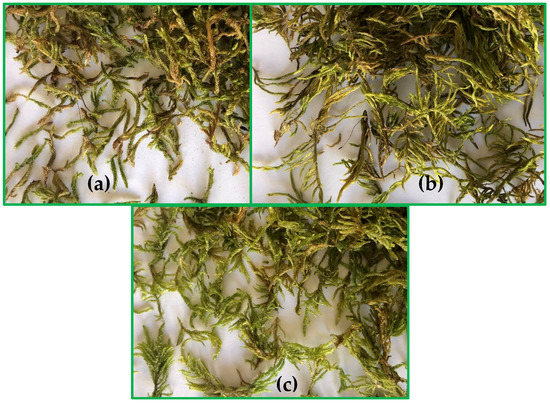
Figure 3.
Types of mosses collected: (a) Hypnum cupressiforme Hedwig, 1801, (b) Homalothecium sericeum (Hedw.) Schimp. 1851, (c) Pseudoscleropodium purum (Hedw.) M.Fleisch.
2.3. Digestion and Chemical Analysis
After cleaning mosses form other herbs, leaves, twigs and other materials, they were grinded by hand using gloves and dried at 40 °C for 48 h. Samples were digested in a microwave system by the wet digestion method. 0.5 g of only one type of mosses sample were put in the teflone tube (there was no mixing of types of mosses for sampling points, although three types of them were collected over the whole study area), where 7 mL of nitric acid and 2.5 mL of hydrogen peroxide were added. The mixture was left to react for 10 min in order to give some time reactions to take place and some gases to release, so that less pressure would develop in the teflon tube during microwave digestion. Then, Teflon tubes were put in the microwave system (Analytic Jena TOPwave) with the following program: 5 min up to 170 °C, hold time of 10 min at 170 °C, 1 min up to 200 °C, hold time of 15 min at 200 °C, 1 min down to 50 °C, hold time of 23 min at 50 °C. After digestion the obtained solutions were filtered, poured in 25 mL plastic flasks and the rest of the vessel was filled with redistilled water and sent for elements chemical analysis.
2.4. Instrumentation
For this study reagents with analytical grade or better were used: nitric acid, trace pure (Merck, Germany) and hydrogen peroxide, p.a. (Merck, Germany). Redistilled water was used for the preparation of all solutions. Standard solutions of metals were prepared by dilution of 1000 mg/L solutions (11355-ICP multi Element Standard).
By the application of inductively coupled plasma—atomic emission spectrometry (ICP-AES) and inductively coupled plasma—mass spectrometry (ICP-MS) the following 25 elements were determined: Al, As, Ba, Ca, Cd, Co, Cr, Cu, Fe, Hg, K, Li, Mg, Mn, Mo, Na, Ni, P, Pb, Sb, Sr, Ti, Tl, V and Zn. ICP-AES (Varian, model 715ES) was used for the analysis of Al, Ba Ca, Co, Cr, Cu, Fe, K, Mn, Na, P, Sr, V and Zn. The QC/QA of the applied technique was performed by standard addition method and it was found that the recovery for the investigated elements ranges for ICP-AES was 98.5–101.2%. Quality control was also ensured by standard moss reference materials M2 and M3, which are prepared for the European Moss Survey [39]. The measured concentrations were in good agreement with the recommended values. Fourteen isotopes 7Li, 49Ti, 59Co, 60Ni, 75As, 78Se, 98Mo, 107Ag, 114Cd, 118Sn, 121Sb, 202Hg, 205Tl and Pb including the isotopes 206Pb, 207Pb, 208Pb were determined using inductively coupled plasma mass spectrometry (Plasma Quant ICP-MS, Analytic Jena, Germany). External calibration was performed by measuring standard solutions containing these elements at 0.5, 1, 2, 5, 10 and 100 µg/L concentrations for following isotopes 7Li, 49Ti, 59Co, 65Cu, 75As, 98Mo, 107Ag, 114Cd, 118Sn, 121Sb, 205Tl and Pb (206Pb, 207Pb, 208Pb). For 202Hg, external calibration was performed by measuring standards 0.5, 1, 2, 5 and 10 µg/L. No internal standards were used. Detector attenuation mode was used to cover wide range of linearity without of collision gas. For the problematic isotopes such as 60Ni and 78Se, He was used as a collision gas. 60Ni was determinate by external calibration in range of 1, 5, 10, 50 100 and 500 µg/L. The 78Se was determinate in range of 1–50 µg/L. The limit of detection and quantification was automatically calculated by the instrument software (Aspect MS 4.3, 2017). Standard solutions were inserted into the sample sequence at every 20 samples to verify sensitivity and repeatability. The recoveries of these elements were 82.1–105.1%.
2.5. Statistical Analysis
The data obtained from chemical analysis of mosses samples were statistically processed. Statistical analysis was performed by Statistica 13 software package (StatSoft, Inc., Tulsa, OK, USA), whereas the date visualization was performed by means of several software packages: Statistica 13 (StatSoft, Inc., Tuls, OK, USA), QGIS and Surfer 17 (Golden Software, Inc., Golden, CO, USA). Some of the basic statistical quantities calculated, were the mean, Box–Cox transformed data mean, median, minimum, maximum, tenth percentile, ninetieth percentile, standard deviation, coefficient of variation, standard deviation (standard error), MAD (median absolute deviation), skewness, kurtosis, skewness for Box–Cox transformed data and kurtosis for Box–Cox transformed data. Pearson correlation coefficients were calculated for all the elements concentration in samples and values 0.30 and higher were considered as significant. In order to reveal the possible associations between elements throughout the sampling area and reduce the number of variables, multivariate cluster and factor analysis was performed. Then, from the associations that were identified, geogenic and anthropogenic origin of elements was established.
3. Results and Discussion
A first evaluation of the results is performed by descriptive statistics shown in Table 1. The original data were transformed by the Box–Cox method to improve the normality of distribution. Clearly, after transformation the absolute values of skewness and kurtosis were significantly reduced. The highest mean and Box–Cox mean concentrations are those for Ca, K and Mg, which also are the most concentrated elements in mosses samples. The element with the highest concentration of all is K (14,000 mg/kg) at sampling point Siboc-Obiliq, although Ca concentration (maximum concentration 12,000 mg/kg) is the highest for all other mosses sampling points, except for Siboc-Obiliq. Then, Al, Fe and P follow with maximum concentrations of 2700, 2000 and 1500 mg/kg respectively and Box–Cox means of 910 mg/kg Al, 820 mg/kg Fe and 770 mg/g P. High concentration of these elements in mosses is expected as they are the most common elements of the earth’s crust and, as such, they can easily be transported by wind as dust from the surroundings and even the ground where mosses live in into the mosses surface.

Table 1.
Descriptive statistic of measurements for moss samples (in mg/kg).
The lowest minimum concentration was found for Tl 0.008 mg/kg and the Box–Cox mean of 0.016 mg/kg. Mo, Hg, Sb and as follow Tl with minimum concentrations of 0.054, 0.069, 0.073 and 0.087 mg/kg, respectively. Compared to the rest of the samples, As appears in higher concentrations in mosses from three sampling points, Zveçan, Stanterg-Mitrovicë and Cerajë-Leposaviq (6.85, 6.46 and 2.61 mg/kg), which obviously is a result of industrial processes of Trepça mines and smelters (smelter not operating since the year 2000). Then, the small number of moss samples with high content of as resulted in low value of P90 which is 0.47 mg/kg. Although the sampling point Cerajë-Leposaviq, which is 11 km to the north of Zveçan is far to the north from Trepça facilities, it still can be influenced by this facility’s emissions which can be transported by wind from the south to the north through the valley of Ibër river. Apart from Ca, K, Mg, Al, Fe and P, the minimum concentrations of which were high, all other elements minimum concentrations were ≤51 mg/ kg and most of them under 1 mg/kg (Table 1). It is worth noting the outstanding atmospheric deposition of Pb in sampling point Zveçan, 38 mg/kg and Ni in Harilaq, 79 mg/kg. Those concentrations represent also the maximum of these two elements and they can be explained by the industrial activity around the area of mosses sampling, Pb/Zn mining and ore processing activities in Zveçan and ferronickel mining processes in Harilaq. Otherwise, the Box–Cox transformed data mean for Pb is 5.2 mg/kg whereas for Ni is 1.7 mg/kg. Pb P90 is 10 mg/kg whereas that of Ni is 6.1 mg/kg, which are much lower compared to the maximum concentration, indicating much smaller concentration for the remaining samples.
In Table 2, comparatively median concentrations and ranges for Kosovo (2019 samples), two neighboring countries (2015 samples) and Norway (2015 samples) as a pristine area, are presented. Calcium, K, Mg, Al and Fe are present at highest median concentrations in all countries. In Kosovo Ca, K and Mg have the highest concentrations compared to other countries, although there is not a very big difference. Mn median concentration in Kosovo is very much lower than in Norway, lower than in North Macedonia and higher than in Albania, whereas Na median concentration in Kosovo is the lowest. Cr, Cu and Ni are found in lower median concentrations in Kosovo than in Albania and North Macedonia, but Zn and Pb median is higher in Kosovo. Those five elements (Cr, Cu, Ni, Zn and Pb) appear in this order in compared countries because of the differences in geochemistry of the countries and industrial processes involving mineral exploitation [37,40]. Arsenic has a median of 0.17 mg/kg in Kosovo, which is lower than that of Albania and North Macedonia but higher than that of Norway. However, as concentration around the polluted site of Trepça facilities in Mitrovica is the highest of all, 6.8 mg/kg. Compared to Norway, most of the elements in mosses samples in Kosovo are at greater median concentration. Only Cu, Mn, Na, Ti and Tl are found at higher medians in Norway than in Kosovo, with Mn being the most distinct element which median is more than four times higher in Norway than in Kosovo. However, although the median and minimum concentrations of most of the elements are higher in Kosovo, the maximum concentration of many of the pollution related elements such as Co, Cr, Cu, Hg, Ni, Sb, V and Zn, are higher in Norway. Pb is the most distinctive pollutant element in Kosovo with regard to concentration compared to Norway, with the minimum concentration of 0.58 mg/kg which is higher than its maximum concentration in Norway that is 0.4 mg/kg.

Table 2.
Comparison of the results obtained in present study with two neighbouring countries and Norway, (in mg/kg).
In comparison with the moss 2010 survey in Kosovo [38], the median values of, Cr (2.63 mg/kg), Ni (2.0 mg/kg), Pb (7.78 mg/kg), Zn (38.5 mg/kg) and Fe (288 mg/kg), are higher than those of the present study which are: Cr (2.6 mg/kg), Ni (1.7 mg/kg), Pb (7.3 mg/kg), Zn (31 mg/kg) and Fe (820 mg/kg); meanwhile Cd (3.053 mg/kg), Pb (47.78 mg/kg) and Fe (3082 mg/kg) have lower maximum concentration then the maximum found in the present survey, which is for Cd 2.1 mg/kg, Pb 38 mg/kg and for Fe 2000 mg/kg. However, neither reliable comparison nor any reliable trend can be established, because this is only the second survey and also none of the sampling points are the same in both surveys. It is though worth noting that the differences are not very big.
The association of elements was performed by hierarchical cluster analysis and factor analysis, based on the Pearson’s correlation coefficients between elements. The Pearson’s correlation coefficients of 25 elements analyzed in 45 moss samples are given in Table 3. There are 24 significant correlations with values of Pearson’s coefficient between 0.5 and 0.94, of which 18 have values ≥0.5 and ≤0.7, whereas six of them were ≥0.7. Since there are e lot of numbers, the significant Pearson’s coefficients shown in the table are given in bold so that they can be easily noticed. The strongest association is that of Fe and Al with a value 0.94 and they also have been found in great correlation in other works [35,36,41,42]. High correlation was found also for K and P with a value of 0.79.

Table 3.
Pearson correlation coefficient (r) between elements content in mosses in Kosovo (n = 45, 25 elements naturally and anthropogenically distributed).
Pearson’s correlation coefficients matrix was used for the calculations in multivariate factor analysis, which resulted in data reduction down to four factors, given in Table 4. The analysis was performed on Box–Cox transformed data and the factors obtained were rotated orthogonally by the varimax method. The factors produced by factor analysis, as expected, were in decreasing order from F1 to F4 by the amount of variability that each of them could explain, and the significant loadings are given in bold to stand out of the rest. The threshold of the variables loading to be taken in consideration as important for factor value construction was set as ≥0.5.

Table 4.
Matrix rotating load of the dominant factors (factor analysis).
The variables that loaded mostly on factor 1 were Al, Fe, V, Cr, Ti, Ba, Sr. This factor is the strongest and represents 24.4% of the total variability of 69.1%. The second factor groups five elements, As, Cd, Sb, Tl, Zn and it explains 21.4% of the total variance of all measured elements. Factor 3 explains 14.2% of the total variance with highest loading scores of Cu, Ca, K and P. Finally, factor 4, the weakest, explains 9.1% grouping only two elements Co and Ni. In the factor analysis seven elements were excluded (Hg, Li, Mg, Mn, Mo, Na and Pb) because they did not show any tendency to be associated to any group or other element.
The hierarchical clustering analysis is represented in a dendrogram shown in Figure 4. The clusters that can be observed were generated by taking the percentage of D(link)/D(max). Five groups of elements could be identified and they are compatible with elements association in factor analysis (except Cu that is found in two groups, 3 and 5) from which five factors or associations were extracted. Then, Al and Cr were the elements which correlated significantly with a greater number of other elements, Al correlated with six and Cr with five elements.
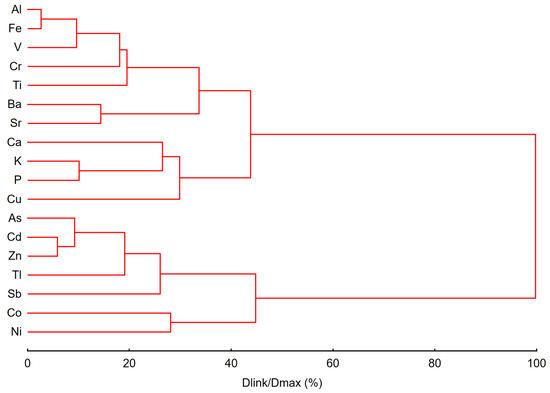
Figure 4.
The hierarchical clustering elements measured in mosses samples.
Factor analysis revealed four groups of elements which associated mostly to the given factor (four factors). Factor 2 can be considered as an anthropogenic factor, whereas factors 1, 3 and 4 are mixed factors, because they do not seem to be loaded significantly only by elements which are expected to be mostly or completely of anthropogenic origin. In Figure 5 are shown the spatial distribution map of the first extracted factor (A), and the standard factor values according to five districts of Kosovo and geological formations (B). This factor groups (Al, Ba, Cr, Fe, Sr, Ti, Tl and V), is the strongest factor as it represents the highest value of variability, 24.4% of the total 69.1% explained variance by all four factors. The highest values of this factor score appears in the east of Kosovo. The elements of this factor are considered as naturally distributed as common earth crust’s components. Their provenance can be explained by the settlement of local fine soil particles previously airborne as dust during winds. Heavy rains can send soil particles into the mosses also. The presence of Cr though, can partly be as a result of mining in Novobërdë, cement facility in Hani i Elezit, ferronickel facility in Drenas (Glogovc) and the lignite exploitation in Obiliq. Moreover, Cr was determined to be the most concentrated metal in the lignite coal (19 mg/kg), excavated in Obiliq, for the purpose of electricity generation [43]. Consequently, it can be present in fly ash and transported by winds to other areas. The highest standard values of this factor are those of the district of Prishtina and Gjilan (Figure 5). The district of Prizren represents the third highest standard value of the first factor, where traffic can be considered its main anthropogenic source, apart natural occurrence [44]. As can be seen in Figure 5, according to geological formations, this factor has the highest standard values in the clastitic rocks formed during Paleogene and Neogene periods of the Cenozoic era. These formations occur mostly in the Kosovo and Dukagjini basins but also in the center and other parts of Kosovo. High standard factor values are also found for Paleogene and Neogene magmatic rocks and Mesozoic flysch.
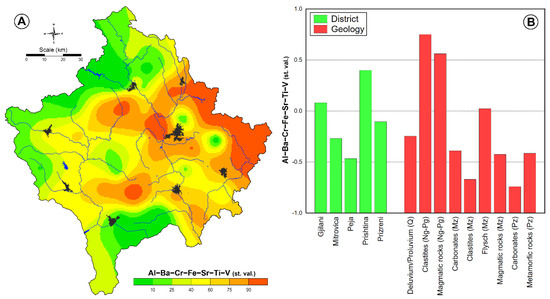
Figure 5.
Spatial distribution of F1 factor scores (A) and distribution according to the districts and geological formations (B).
Elements which load most significantly in factor 2 are As, Cd, Sb, Tl and Zn. The distribution map and the standard factor values according to districts and geology are shown in Figure 6. The element loading with the highest value is Zn and Sb load is the smallest of all. This is the second most important factor as it explains 21.4% of the total variance throughout the variables. In this group As, Cd and Zn are of anthropogenic origin as they are always associated with industrial activities [37,40,45]. However, it was found that Sb also co-exists with ores PbS and ZnS in the area of Trepça mines [46]. In a study performed in 2006 on the distribution of heavy metals in floodplain of agricultural soil along the Ibër River in the district of Mitrovica, almost the same group of elements was revealed by multivariate analysis [46]. These elements can be transported from this agricultural area by wind, to mosses locations during dry seasons lodged in fine particles of dust and this way contributing to factor 2. As can be seen in the distribution map of factor values, the highest values of this factor are spread along the Kosovo basin, it extends from Leposaviç in the north to the south in the Hani i Elezit, with a branch in the east between the city of Prishtina and Gjilan. The presence of these elements in this group clearly is a result of the pollution introduced into the atmosphere from anthropogenic activities. Industrial sites are located all along the Kosovo basin, starting in the north with the Trepça mines, lignite coal quarries and electricity generation plant, Kishnica mineral processing facility, Magnezite mine in Golesh, down to cement production plant in Hani i Elezit. The highest standard value of the second factor (Figure 6B) is for the district of Mitrovica, which is expected because of heavy mineral exploitations and processing in that area; hence, the presence of factor 2 elements in the moss samples. Prishtina and Gjilan districts have also high factor 2 standard scores, which indicates that these two regions are also exposed to air pollution from industry. Particularly, regarding Prishtina, not only is it easily accessible for polluted air coming from Obiliq (lignite powered power plants) and Mitrovica (Trepça facilities and tailings), but also there is heavy usage of lignite coal in the city for domestic heating during winter and also there is very dens traffic, which obviously increases the introduction of these elements as pollutant in the atmosphere [32,47]. According to geological formations, the highest standard value of the factor 2 is found in magmatic rocks of Neogene and Paleogene periods. These formations cover relatively small areas and are found mostly in the north and the east of Kosovo, in the districts of Mitrovica and Prishtina. Antimony and Tl are found at higher concentrations in the north in Stanterg and Zveqan, probably with both geogenic and anthropogenic origin. Paleozoic era carbonates and metamorphic rocks also show high standard values for factor 2, although much lower than magmatic rocks.
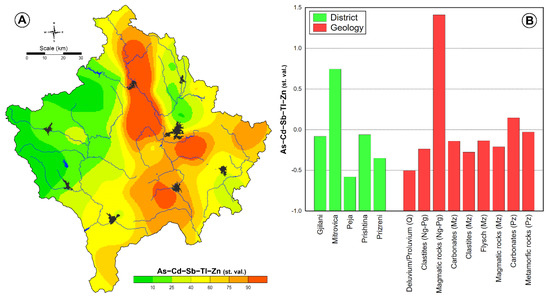
Figure 6.
Spatial distribution of factor scores of F2 (A) and standard values according to the districts and geological formations (B).
Factor 3 groups four elements, Ca, Cu, K and P, and it explains 14.2% of the total variance (Figure 7). The distribution map of the factor values, as well as its standard values according to districts and geology of the studied area, are given in Figure 8. The highest values of the third factor are concentrated in the center and the south of Kosovo, around the lignite quarry in Obiliq and the cement plant in Hani i Elezit. This factor’s standard values are the highest for the district of Gjilani, Mitrovica and Prishtina. This group is composed mostly by naturally occurring elements; however, anthropogenic origin is to be considered. K and P are widely used in agriculture as fertilizers, thus, during dry seasons K and P enriched soil particles can be carried by winds to mosses habitats. Ca, K and P are also found in significant quantities in the fly ash of Obiliq power plant [48], which regularly is spread out by winds and can contribute to the atmospheric deposition on mosses. Cu is mostly of anthropogenic origin and it is probably related to mining processes. Moreover, Cu is also found in fly ash of Obiliq power plant [48], but it can also reach mosses habitats from traffic emissions, since road environment was found to contain among other metals Cu which originates from vehicular usage [44,49,50].
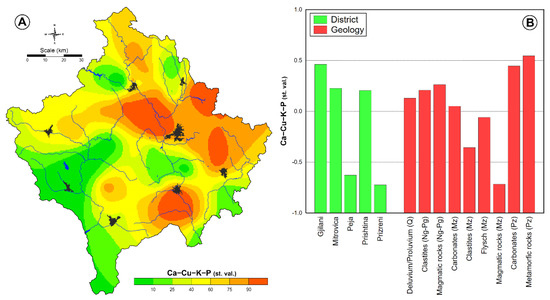
Figure 7.
Spatial distribution of factor scores of F3 (A) and standard values according to the Districts and geological formations (B).
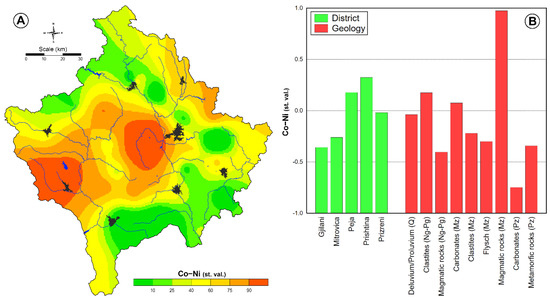
Figure 8.
Spatial distribution of factor scores of F4 (A) and standard values according to the districts and geological formations (B).
Following the geology of the studied area, this group of elements is mostly related to Paleozoic carbonates (small areas in the east center and west, Figure 3) and metamorphic rocks (in the east). Then, somewhat smaller standard factor values are found for quaternary deluvium/proluvium deposits, Paleogene and Neogene clastites and Paleogene and Neogene magmatic rocks. These rocks are weathered under atmospheric conditions and ground to fine particles of soil. Consequently, they are carried by wind into the atmosphere and then deposited over other areas and this way onto mosses also, enriching them with elements they contain.
Figure 8 shows the elements grouped by factor 4. This is the weakest factor constructed by only two elements, Co and Ni and explaining only 9.1% of the total variance. Its distribution map shows that the highest values appear in the center of Kosovo and in the west. The highest standard value is that of the district of Prishtina, then Peja and Prizren have slightly smaller values. Ni presence in this group can be explained by the ferronickel smelter in Drenas where the ore concentration takes place and its mine in Golesh (Harilaq sampling point), both of these located around the center of Kosovo. However, no Co involving industry or processing of ore containing Co takes place in Kosovo, probably its origin is mostly natural, as it may be for Ni in the west of Kosovo. The geological formation with the highest standard value of the fourth factor is magmatic rock of Mesozoic era. Neogene and Paleogene clastites come second, then Mesozoic carbonates and Quaternary deluvial/proluvial deposits also show high standard factor values.
4. Conclusions
The atmospheric deposition of elements was studied by moss biomonitoring method in order to estimate air pollution in Kosovo. After the element’s determination in 45 moss samples, variations of concentrations throughout the country were observed for each element. Peaks of concentrations in moss samples were detected for Pb, Zn, As and Cd, in the district of Mitrovica around the Trepça Pb-Zn ore processing unit and tailings dump as well as smelter plant with a landfill of slag deposit. In comparison to Norway and neighboring countries Albania and North Macedonia, mosses have higher Ca, K and Mg concentrations in Kosovo. Cr, Cu and Ni are found in lower median concentrations in Kosovo than in Albania and North Macedonia, but Zn and Pb median is higher in Kosovo. In fact, compared to all countries Pb, Zn, Hg and Cd are the heavy metals mostly polluting the atmosphere as they are found with the highest median concentration in mosses samples. Factor analysis revealed four factors, of them three were geogenic or mixed and one was anthropogenic. The anthropogenic factor includes As, Cd, Sb, Tl and Zn and is mostly present along the Basin of Kosovo. The most polluted districts of Kosovo are Mitrovica, Prishtina, Gjilan and Ferizaj, as a result of industry, traffic and domestic routines.
Author Contributions
Conceptualization, M.P. and T.S.; methodology, T.S.; M.P. and F.S.; software, R.Š.; investigation, M.P.; F.S.; T.S. and K.T.; data curation, R.Š.; writing—original draft preparation, F.S.; writing—review and editing, M.P.; T.S. and R.Š.; visualization, R.Š. All authors have read and agreed to the published version of the manuscript.
Funding
This research received no external funding.
Institutional Review Board Statement
Not applicable.
Informed Consent Statement
Not applicable.
Data Availability Statement
Data of this manuscript are original and all other data used for comparisson or other discutions are cited in the manuscript. Everything is acording to MDPI Research Data Policies.
Conflicts of Interest
The authors declare no conflict of interest.
References
- Needleman, H.L.; Gatsonis, C.A. Low-Level Lead Exposure and the IQ of Children: A Meta-analysis of Modern Studies. JAMA J. Am. Med. Assoc. 1990. [Google Scholar] [CrossRef]
- Perlstein, M.A.; Attala, R. Neurologic Sequelae of Plumbism in Children. Clin. Pediatr. 1966. [Google Scholar] [CrossRef]
- Tyroler, H.A. Epidemiology of hypertension as a public health problem: An overview as background for evaluation of Blood Lead-Blood Pressure Relationship. Environ. Health Perspect. 1988. [Google Scholar] [CrossRef]
- Clarkson, T.W.; Magos, L.; Myers, G.J. The Toxicology of Mercury—Current Exposures and Clinical Manifestations. N. Engl. J. Med. 2003. [Google Scholar] [CrossRef] [PubMed]
- Friberg, L.; Elinder, C.; Kjellstrom, T.; Nordberg, G.F. Cadmium and Health: A Toxicological and Epidemiological Appraisal Volume II: Effects and Response; CRC: Boca Raton, FL, USA, 1985. [Google Scholar]
- Hughes, M.F. Arsenic toxicity and potential mechanisms of action. Toxicol. Lett. 2002. [Google Scholar] [CrossRef]
- Kapusta, P.; Sobczyk, Ł. Effects of heavy metal pollution from mining and smelting on enchytraeid communities under different land management and soil conditions. Sci. Total Environ. 2015. [Google Scholar] [CrossRef]
- Golokhvast, K.S.; Chernyshev, V.V.; Chaika, V.V.; Ugay, S.M.; Zelinskaya, E.V.; Tsatsakis, A.M.; Karakitsios, S.P.; Sarigiannis, D.A. Size-segregated emissions and metal content of vehicle-emitted particles as a function of mileage: Implications to population exposure. Environ. Res. 2015. [Google Scholar] [CrossRef] [PubMed]
- Yue, Y.; Liu, Z.; Liu, Z.; Zhang, J.; Lu, M.; Zhou, J.; Qian, G. Rapid evaluation of leaching potential of heavy metals from municipal solid waste incineration fly ash. J. Environ. Manag. 2019, 238, 144–152. [Google Scholar] [CrossRef]
- Seignez, N.; Gauthier, A.; Bulteel, D.; Damidot, D.; Potdevin, J.L. Leaching of lead metallurgical slags and pollutant mobility far from equilibrium conditions. Appl. Geochem. 2008, 23, 3699–3711. [Google Scholar] [CrossRef]
- Pi, H.; Sharratt, B.; Schillinger, W.F.; Bary, A.; Cogger, C. Chemical composition of windblown dust emitted from agricultural soils amended with biosolids. Aeolian Res. 2018, 32, 102–115. [Google Scholar] [CrossRef]
- Ferati, F.; Kerolli-Mustafa, M.; Kraja-Ylli, A. Assessment of heavy metal contamination in water and sediments of Trepça and Sitnica rivers, Kosovo, using pollution indicators and multivariate cluster analysis. Environ. Monit. Assess. 2015, 187. [Google Scholar] [CrossRef] [PubMed]
- Gashi, F.; Frančišković-Bilinski, S.; Bilinski, H.; Kika, L. Assessment of the effects of urban and industrial development on water and sediment quality of the Drenica River in Kosovo. Environ. Earth Sci. 2016, 75. [Google Scholar] [CrossRef]
- Stafilov, T.; Aliu, M.; Sajn, R. Arsenic in surface soils affected by mining and metallurgical processing in K. Mitrovica region, Kosovo. Int. J. Environ. Res. Public Health 2010, 7, 4050–4061. [Google Scholar] [CrossRef] [PubMed]
- Kerolli-Mustafa, M.; Ćurković, L.; Fajković, H.; Rončević, S. Ecological risk assessment of jarosite waste disposal. Croat. Chem. Acta 2015. [Google Scholar] [CrossRef]
- Borgna, L.; Di Lella, L.A.; Nannoni, F.; Pisani, A.; Pizzetti, E.; Protano, G.; Riccobono, F.; Rossi, S. The high contents of lead in soils of northern Kosovo. J. Geochem. Explor. 2009, 101, 137–146. [Google Scholar] [CrossRef]
- Šajn, R.; Aliu, M.; Stafilov, T.; Alijagić, J. Heavy metal contamination of topsoil around a lead and zinc smelter in Kosovska Mitrovica/Mitrovicë, Kosovo/Kosovë. J. Geochem. Explor. 2013, 134, 1–16. [Google Scholar] [CrossRef]
- Nannoni, F.; Rossi, S.; Protano, G. Potentially toxic element contamination in soil and accumulation in maize plants in a smelter area in Kosovo. Environ. Sci. Pollut. Res. 2016, 23, 11937–11946. [Google Scholar] [CrossRef] [PubMed]
- Arditsoglou, A.; Samara, C. Levels of total suspended particulate matter and major trace elements in Kosovo: A source identification and apportionment study. Chemosphere 2005, 59, 669–678. [Google Scholar] [CrossRef]
- De Nicola, F.; Spagnuolo, V.; Baldantoni, D.; Sessa, L.; Alfani, A.; Bargagli, R.; Monaci, F.; Terracciano, S.; Giordano, S. Improved biomonitoring of airborne contaminants by combined use of holm oak leaves and epiphytic moss. Chemosphere 2013, 92, 1224–1230. [Google Scholar] [CrossRef]
- Sardans, J.; Peñuelas, J. Trace element accumulation in the moss Hypnum cupressiforme Hedw. and the trees Quercus ilex L. and Pinus halepensis Mill. in Catalonia. Chemosphere 2005, 60, 1293–1307. [Google Scholar] [CrossRef]
- Gerdol, R.; Marchesini, R.; Iacumin, P.; Brancaleoni, L. Monitoring temporal trends of air pollution in an urban area using mosses and lichens as biomonitors. Chemosphere 2014, 108, 388–395. [Google Scholar] [CrossRef]
- Calzoni, G.L.; Antognoni, F.; Pari, E.; Fonti, P.; Gnes, A.; Speranza, A. Active biomonitoring of heavy metal pollution using Rosa rugosa plants. Environ. Pollut. 2007, 149, 239–245. [Google Scholar] [CrossRef] [PubMed]
- Ngayila, N.; Basly, J.P.; Lejeune, A.H.; Botineau, M.; Baudu, M. Myriophyllum alterniflorum DC., biomonitor of metal pollution and water quality. Sorption/accumulation capacities and photosynthetic pigments composition changes after copper and cadmium exposure. Sci. Total Environ. 2007, 373, 564–571. [Google Scholar] [CrossRef] [PubMed]
- Rühling, Å.; Tyler, G.; Ruhling, A. Sorption and Retention of Heavy Metals in the Woodland Moss Hylocomium splendens (Hedw.) Br. et Sch. Oikos 1970. [Google Scholar] [CrossRef]
- Čeburnis, D.; Steinnes, E.; Kvietkus, K. Estimation of metal uptake efficiencies from precipitation in mosses in Lithuania. Chemosphere 1999, 38, 445–455. [Google Scholar] [CrossRef]
- Di Palma, A.; González, A.G.; Adamo, P.; Giordano, S.; Reski, R.; Pokrovsky, O.S. Biosurface properties and lead adsorption in a clone of Sphagnum palustre (Mosses): Towards a unified protocol of biomonitoring of airborne heavy metal pollution. Chemosphere 2019, 236. [Google Scholar] [CrossRef] [PubMed]
- Fernández, J.A.; Carballeira, A. Biomonitoring metal deposition in Galicia (NW Spain) with mosses: Factors affecting bioconcentration. Chemosphere 2002, 46, 535–542. [Google Scholar] [CrossRef]
- Harmens, H.; Norris, D.A.; Steinnes, E.; Kubin, E.; Piispanen, J.; Alber, R.; Aleksiayenak, Y.; Blum, O.; Coşkun, M.; Dam, M.; et al. Mosses as biomonitors of atmospheric heavy metal deposition: Spatial patterns and temporal trends in Europe. Environ. Pollut. 2010, 158, 3144–3156. [Google Scholar] [CrossRef]
- Nickel, S.; Schröder, W. Reorganisation of a long-term monitoring network using moss as biomonitor for atmospheric deposition in Germany. Ecol. Indic. 2017, 76, 194–206. [Google Scholar] [CrossRef]
- Calabrese, S.; D’Alessandro, W.; Bellomo, S.; Brusca, L.; Martin, R.S.; Saiano, F.; Parello, F. Characterization of the Etna volcanic emissions through an active biomonitoring technique (moss-bags): Part 1—Major and trace element composition. Chemosphere 2015, 119, 1447–1455. [Google Scholar] [CrossRef]
- Kapusta, P.; Stanek, M.; Szarek-Łukaszewska, G.; Godzik, B. Long-term moss monitoring of atmospheric deposition near a large steelworks reveals the growing importance of local non-industrial sources of pollution. Chemosphere 2019, 230, 29–39. [Google Scholar] [CrossRef]
- Di Palma, A.; Capozzi, F.; Spagnuolo, V.; Giordano, S.; Adamo, P. Atmospheric particulate matter intercepted by moss-bags: Relations to moss trace element uptake and land use. Chemosphere 2017, 176, 361–368. [Google Scholar] [CrossRef] [PubMed]
- Balabanova, B.; Stafilov, T.; Šajn, R.; Bačeva, K. Comparison of response of moss, lichens and attic dust to geology and atmospheric pollution from copper mine. Int. J. Environ. Sci. Technol. 2014, 11, 517–528. [Google Scholar] [CrossRef]
- Qarri, F.; Lazo, P.; Stafilov, T.; Frontasyeva, M.; Harmens, H.; Bekteshi, L.; Baceva, K.; Goryainova, Z. Multi-elements atmospheric deposition study in Albania. Environ. Sci. Pollut. Res. 2014, 21, 2506–2518. [Google Scholar] [CrossRef] [PubMed]
- Barandovski, L.; Frontasyeva, M.V.; Stafilov, T.; Šajn, R.; Ostrovnaya, T.M. Multi-element atmospheric deposition in Macedonia studied by the moss biomonitoring technique. Environ. Sci. Pollut. Res. 2015, 22, 16077–16097. [Google Scholar] [CrossRef] [PubMed]
- Stafilov, T.; Šajn, R.; Barandovski, L.; Andonovska, K.B.; Malinovska, S. Moss biomonitoring of atmospheric deposition study of minor and trace elements in Macedonia. Air Qual. Atmos. Health 2018, 11, 137–152. [Google Scholar] [CrossRef]
- Maxhuni, A.; Lazo, P.; Kane, S.; Qarri, F.; Marku, E.; Harmens, H. First survey of atmospheric heavy metal deposition in Kosovo using moss biomonitoring. Environ. Sci. Pollut. Res. 2016, 23, 744–755. [Google Scholar] [CrossRef] [PubMed]
- Steinnes, E.; Rühling, Å.; Lippo, H.; Mäkinen, A. Reference materials for large-scale metal deposition surveys. Accredit. Qual. Assur. 1997, 2, 243–249. [Google Scholar] [CrossRef]
- Lazo, P.; Stafilov, T.; Qarri, F.; Allajbeu, S.; Bekteshi, L.; Frontasyeva, M.; Harmens, H. Spatial distribution and temporal trend of airborne trace metal deposition in Albania studied by moss biomonitoring. Ecol. Indic. 2019, 101, 1007–1017. [Google Scholar] [CrossRef]
- Barandovski, L.; Stafilov, T.; Šajn, R.; Frontasyeva, M.; Andonovska, K.B. Atmospheric heavy metal deposition in north macedonia from 2002 to 2010 studied by moss biomonitoring technique. Atmosphere 2020, 11, 929. [Google Scholar] [CrossRef]
- Vasilevska, S.; Stafilov, T.; Šajn, R. Distribution of trace elements in sediments and soil from Crn Drim River Basin, Republic of Macedonia. SN Appl. Sci. 2019, 1. [Google Scholar] [CrossRef]
- Kittner, N.; Fadadu, R.P.; Buckley, H.L.; Schwarzman, M.R.; Kammen, D.M. Trace Metal Content of Coal Exacerbates Air-Pollution-Related Health Risks: The Case of Lignite Coal in Kosovo. Environ. Sci. Technol. 2018, 52, 2359–2367. [Google Scholar] [CrossRef]
- Adamiec, E. Chemical fractionation and mobility of traffic-related elements in road environments. Environ. Geochem. Health 2017, 39, 1457–1468. [Google Scholar] [CrossRef] [PubMed]
- Lazo, P.; Steinnes, E.; Qarri, F.; Allajbeu, S.; Kane, S.; Stafilov, T.; Frontasyeva, M.V.; Harmens, H. Origin and spatial distribution of metals in moss samples in Albania: A hotspot of heavy metal contamination in Europe. Chemosphere 2018, 190, 337–349. [Google Scholar] [CrossRef]
- Barać, N.; Škrivanj, S.; Bukumirić, Z.; Živojinović, D.; Manojlović, D.; Barać, M.; Petrović, R.; Ćorac, A. Distribution and mobility of heavy elements in floodplain agricultural soils along the Ibar River (Southern Serbia and Northern Kosovo). Chemometric investigation of pollutant sources and ecological risk assessment. Environ. Sci. Pollut. Res. 2016, 23, 9000–9011. [Google Scholar] [CrossRef] [PubMed]
- Ávila-Pérez, P.; Ortiz-Oliveros, H.B.; Zarazúa-Ortega, G.; Tejeda-Vega, S.; Villalva, A.; Sánchez-Muñoz, R. Determining of risk areas due to exposure to heavy metals in the Toluca Valley using epiphytic mosses as a biomonitor. J. Environ. Manag. 2019, 241, 138–148. [Google Scholar] [CrossRef]
- Morina, I.; Dragusha, B.; Dvorani, S.; Riesbeck, F. Chemical characteristics of lignite ash from Power Plant Kosova a and local geological settings in Kosova near Prishtina. WSEAS Trans. Environ. Dev. 2013, 8, 168–178. [Google Scholar]
- Santos, A.P.M.; Segura-Muñoz, S.I.; Nadal, M.; Schuhmacher, M.; Domingo, J.L.; Martinez, C.A.; Magosso Takayanagui, A.M. Traffic-related air pollution biomonitoring with Tradescantia pallida (Rose) Hunt. cv. purpurea Boom in Brazil. Environ. Monit. Assess. 2015, 187. [Google Scholar] [CrossRef] [PubMed]
- Moreira, T.C.L.; Amato-Lourenço, L.F.; da Silva, G.T.; de André, C.D.S.; de André, P.A.; Barrozo, L.V.; Singer, J.M.; Saldiva, P.H.N.; Saiki, M.; Locosselli, G.M. The use of tree barks to monitor traffic related air pollution: A case study in São Paulo-Brazil. Front. Environ. Sci. 2018, 6, 1–12. [Google Scholar] [CrossRef]
Publisher’s Note: MDPI stays neutral with regard to jurisdictional claims in published maps and institutional affiliations. |
© 2021 by the authors. Licensee MDPI, Basel, Switzerland. This article is an open access article distributed under the terms and conditions of the Creative Commons Attribution (CC BY) license (http://creativecommons.org/licenses/by/4.0/).