Article

Analyzing and Visualizing Spatiotemporal Patterns of El Niño Teleconnections Using Attribute Trajectories

1
Department of Geographical Information Science, School of Geography, Nanjing Normal University, Nanjing 210023, China
2
Department of Geography, Ghent University, 9000 Ghent, Belgium
3
Department of Meteorological Research and Development, Royal Meteorological Institute of Belgium, 1180 Brussels, Belgium
4
Department of Physics and Astronomy, Ghent University, 9000 Ghent, Belgium
*
Author to whom correspondence should be addressed.
Atmosphere 2021, 12(4), 414; https://doi.org/10.3390/atmos12040414
Submission received: 30 January 2021 / Revised: 16 March 2021 / Accepted: 19 March 2021 / Published: 24 March 2021
(This article belongs to the Special Issue ENSO Prediction)

Abstract

:
El Niño influences the global climate through teleconnections that are not constant in space and time. In order to study and visualize the spatiotemporal patterns of the El Niño teleconnections, a new method inspired by the concept of attribute trajectories is proposed. The coordinates of the trajectories are the normalized anomalies of the relevant meteorological variables in El Niño. The data structures called flocks are extracted from the trajectories to indicate the regions that are subject to the same type of El Niño teleconnection for a certain period. It is then shown how these structures can be used to get a detailed, spatiotemporal picture of the dynamics of the El Niño teleconnections. The comparison between the flocks of the same temporal scale reveals the general dynamics of the teleconnection, while the analysis among the flocks of different temporal scales indicates the relationship between the coverage and their duration. As an illustration of this method, the spatiotemporal patterns of the anomalous temperature increase caused by El Niño are presented and discussed at the monthly and seasonal scales. This study demonstrates the capability of the proposed method in analyzing and visualizing the spatiotemporal patterns of the teleconnections.

1. Introduction

El Niño, which is the warm phase of the El Niño Southern Oscillation (ENSO), is an important climate phenomenon. By altering the large-scale atmospheric conditions worldwide, El Niño impacts both ecosystem and human society. It changes the spatiotemporal pattern of temperature and precipitation in several regions of the world, leading to complicated responses of the ecosystem [1,2]. El Niño not only threatens human lives in a direct way by droughts and floods, but also indirectly through its impact on disease epidemics [3,4] or crop production, which leads to famine [3,5,6,7]. Thus, the study of El Niño is of strong societal importance and its changes in frequency and intensity is the subject of intense ongoing research.
El Niño originates from coupled ocean–atmosphere interactions in the equatorial Pacific and is often characterized by elevated sea surface temperature (SST) in this region [8,9,10,11]. It disrupts the regular pattern of atmospheric circulation over the Pacific [7,10,11], and influences the climate through teleconnections, which is the phenomenon that the meteorological conditions in one location are related to those far away [11,12]. The El Niño teleconnections exist far away from the equatorial Pacific. Indeed, even regions such as Africa, Europe and Antarctica are also associated with the El Niño signals [13,14,15,16].
The El Niño teleconnections have been widely studied using different techniques. A basic indicator of El Niño teleconnections is the anomaly of a climate variable. The positive and negative anomalies represent opposite El Niño teleconnections, while the absolute values of the anomalies indicate the degree of the teleconnections [15,16]. Based on this idea, the correlations between the anomalies of the climate variables and the anomalies of tropical SST are investigated to qualify the impact of El Niño [17,18]. Besides the linear relation, studies also report non-linearity between the El Niño indices and the climate variables and methods such as neural network are used to study the non-linear pattern of El Niño teleconnections [19,20]. Other methods that are applied to investigate El Niño include regression [9], clustering [16] and climate modeling [9,21]. Even though each technique highlights different aspects, they consistently conclude that the El Niño teleconnections are global, but vary in space and time.
This paper intends to analyze and visualize the spatiotemporal patterns of the El Niño teleconnections, which is important in the domain of El Niño study because the patterns illustrate how the El Niño teleconnections behave with time. A key question to conduct this study is to find an appropriate way to represent the dynamics of the teleconnections. In the domain of geographical information science, a technical framework called attribute trajectory analysis was proposed to represent and analyze the dynamics of non-spatial data [22]. Inspired by this technical framework, a new method is proposed here to study the spatiotemporal pattern of the El Niño teleconnections. It uses the normalized anomalies of two climate variables (temperature and precipitation) as the indicators of El Niño teleconnections. Thus, the El Niño teleconnections can be represented by the trajectories and spatiotemporal dynamics of the teleconnections can be studied by analyzing these trajectories. More specifically, a data structure called flock is introduced to analyze the trajectories. In this paper, a flock indicates the regions under the same type of El Niño teleconnection for a certain period. The flocks, together with the spatiotemporal relations among them, characterize the spatiotemporal pattern of the El Niño teleconnections. Different from conventional techniques used to investigate El Niño teleconnections, the method proposed here concentrates on the spatiotemporal dynamics, thereby providing a novel perspective to understand and interpret El Niño teleconnections.
This paper is organized as follows. Section 2 introduces the dataset and the methodology. Section 3 presents the results obtained from the analysis. The methodology and the results are discussed in Section 4. Finally, the conclusions are drawn in Section 5.

2. Data and Methodology

2.1. Observations and Definitions

The El Niño teleconnections are investigated here using gridded observations taken from the Climatic Research Unit dataset CRU TS v4.02 [23], which is commonly used as a reference dataset for investigating El Niño teleconnections [19,24]. As a grid dataset, CRU TS v4.02 covers the global land mass (excluding Antarctica) at a grid resolution of 0.5° and temporal resolution of 1 month during the period 1951–2017. The global land area was therefore divided into 67,420 grid points, and each grid point contained records of 804 months (12 months for 67 years). Two variables TMP (temperature) and PRE (precipitation) were involved in this study. In this paper results for an anomalous temperature increase are presented and discussed, but the results for other anomalies are provided in the supplementary material.
Different definitions exist to quantify El Niño. A widely used descriptor is the SST (sea surface temperature) averaged over the Niño 3.4 region (5° S–5° N, 170° W–120° W) [25]. In line with the NOAA (National Oceanic and Atmospheric Administration) of the USA [26], this paper used the 3-month running-mean SST anomalies in the Nino 3.4 region, also termed the ONI (oceanic Niño index). Note that the seasonal cycle and global-warming trends have been removed from the ONI dataset [27]. Specifically, an El Niño event is defined as a period when the ONI remained greater than 0.5 for at least 5 consecutive months, and strong El Niño months were those in El Niño events and with the ONI exceeding 0.8. Table 1 lists the strong El Niño months in the period 1951–2017, categorized by month.
The study area of this paper covered both the northern and southern hemisphere, where the seasons were opposite. In the remainder of this paper and the Supplementary Materials, the seasons are indicated by the boreal seasons. For example, when the study period is boreal spring, it indicates the three months of March, April and May, which is austral autumn. In order to keep the paper concise, this issue will not be repeatedly emphasized in the reminder of the paper. Note that both hemispheres were studied in all the analyses of this paper, although the austral seasons were not mentioned.

2.2. Preprocessing of the Data

The CRU TS v4.02 data were preprocessed before constructing attribute trajectories. Firstly, the anomalies were calculated for each of the 12 months. We henceforth considered the temperature variable as an example. For each grid point r in month m (m = 1, …, 12), the temperature anomaly A r ,   m T was calculated via the formula
A r , m T = M r , m T , E N μ r , m T
Here M r , m T , E N is the monthly mean temperature at r in the strong El Niño months m (i.e., the months listed in Table 1), while μ r , m T is the monthly mean temperature at r over all the months m from 1951 to 2017. Note that A r ,   m T did not average to zero since it is an anomaly for strong El Niño months only. For example, m = 1 means January. As listed by the first row of Table 1, there were 14 years in which January was classified as a strong El Niño month. For each grid point, M r , m T , E N was the average of the 14 monthly temperatures of the strong El Niño January, while μ r , m T was the average of the 67 monthly temperatures of January from 1951 to 2017. Since the anomalies were calculated for each month, the results were free of the seasonal signal. The precipitation anomalies were calculated in the same way. Basically, the anomaly quantified the difference between the strong El Niño records and the average records.
Subsequently, the anomalies were normalized. For a temperature anomaly A r ,   m T , the normalized anomaly V r , m T was
V r , m T = A r , m T σ r , m T
Here σ r , m T is the standard deviation of all the records at r in month m. If m = 1, σ r , m T is the standard deviation of the 67 January temperatures from 1951 to 2017 at the corresponding grid point r. The precipitation anomalies are normalized in the same way. The normalization removes the local effect from the anomalies, and thus makes the comparison between different grid points possible.
The last step is an extra normalization, intending to adjust both variables to the same scale. This study involved 67,420 grid points over the 12 months. So, after the first normalization, every variable got 809,040 (67,420 × 12) normalized anomalies. For temperature, let σ V T be the standard deviation of the 809,040 normalized temperature anomalies. Then each normalized temperature anomaly V r , m T was normalized again to V r , m T
V r , m T = V r , m T σ V T
The normalized precipitation anomalies were normalized again in the same way. The second normalization is an important procedure if the two variables are analyzed together. So, it is a recommended step in attribute trajectory analysis and thus it is performed in this study. However, the second normalization is technically not essential if the two variables are analyzed independently. If the second normalization is omitted, the threshold in the following section should also be adjusted.

2.3. El Niño Attribute Trajectories and Sequences

The double normalized anomalies V r , m T and V r , m P are used as coordinates to construct attribute trajectories for each grid point [22]. Every trajectory contains 12 vertices, one for each month. All trajectories together indicate the El Niño teleconnections over the global land area.
In order to interpret the dynamics, the trajectories are transformed into sequences. The threshold of the transformation is ±0.84 corresponding to an occurrence probability of around 20% following a standard normal distribution. Although the double normalized anomalies do not necessarily follow the standard normal distribution, this threshold is still an objective reference to distinguish anomalous values against normal values. So, both temperature and precipitation are transformed based on this threshold. Table 2 shows the rules of transformation for temperature. The double normalized temperature anomalies V r , m T are classified into three categories: Warm, cool and neutral, corresponding to three teleconnection types: Anomalous temperature increase caused by El Niño, anomalous temperature decrease caused by El Niño, no anomalous temperature difference, respectively. The three categories are represented by three labels respectively: w, c and n, which are the elements of the sequences. The double normalized precipitation anomalies V r , m P are also classified into three categories: Wet, dry and neutral, in a similar way, represented by labels: w, d and n, respectively. In the remainder of the paper, the names of the categories are occasionally used to indicate corresponding teleconnection types. For example, if a region is subject to the anomalous temperature increase, it is sometimes referred to as a “warm region”. Note that “warm” here means this region is warmer than normal in El Niño. It does not necessarily mean that this region is warmer than the other regions. Based on the rules of transformation, every trajectory is transformed into two sequences of 12 labels. For example, the temperature sequence “ww-wnn-nnn-nnn-n” implies that under the El Niño teleconnections, the corresponding grid point is anomalously warm from January to March, but could be considered normal in the other nine months when El Niño occurs. Note that the sequence is split by bar “-” to indicate the seasons.
In order to extract a smoother signal, an additional filtering step was performed. For the temperature of a certain month, the set of temperature categories of that very month, one month before and one month after were examined. The final temperature category of the central month was neutral in case the set contains two or three neutral months, or, contains two non-neutral months that are not identical. A non-neutral final temperature category was therefore found in case that the three months in the set were non-neutral and identical, or one month was neutral and two months were non-neutral and identical. For example, in order to find the final temperature category of February, examine the temperature category set of January, February and March. If the set was “warm, warm, warm” or “warm, neutral, warm”, the final category of February was warm. If the set was “warm, warm, cold”, “neutral, warm, neutral” or “cold, warm, neutral”, the final category of February became neutral. The categories of the precipitation are filtered in the same way. After filtering, some sequences are modified while others remain unchanged. For example, the sequence “ww-wnn-nnn-nnn-w” remains unchanged, while the sequence “wn-wnn-nnn-nnw-w” becomes “ww-nnn-nnn-nnw-w”.

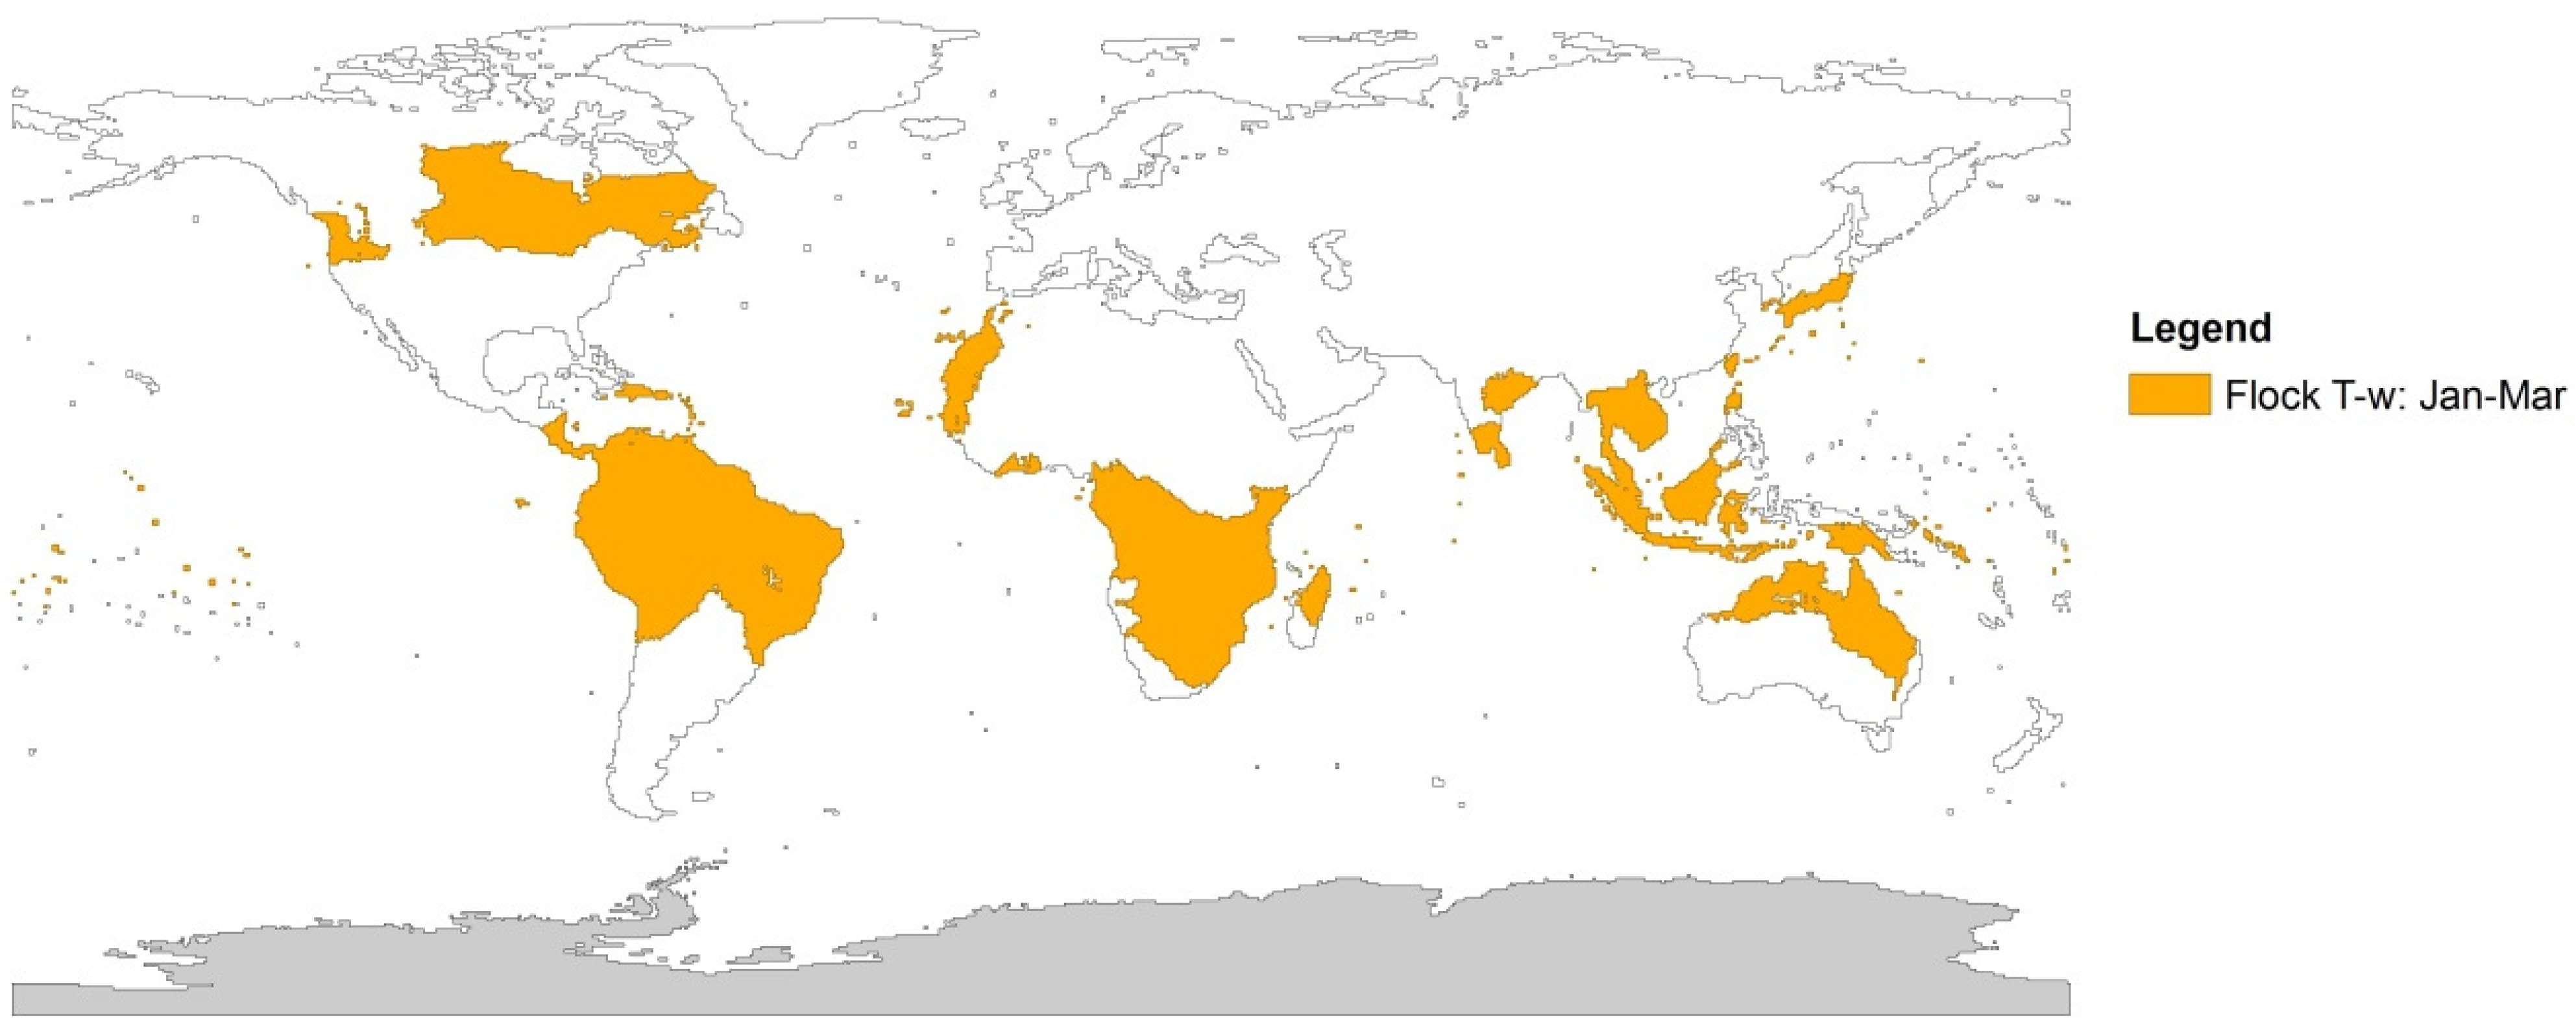
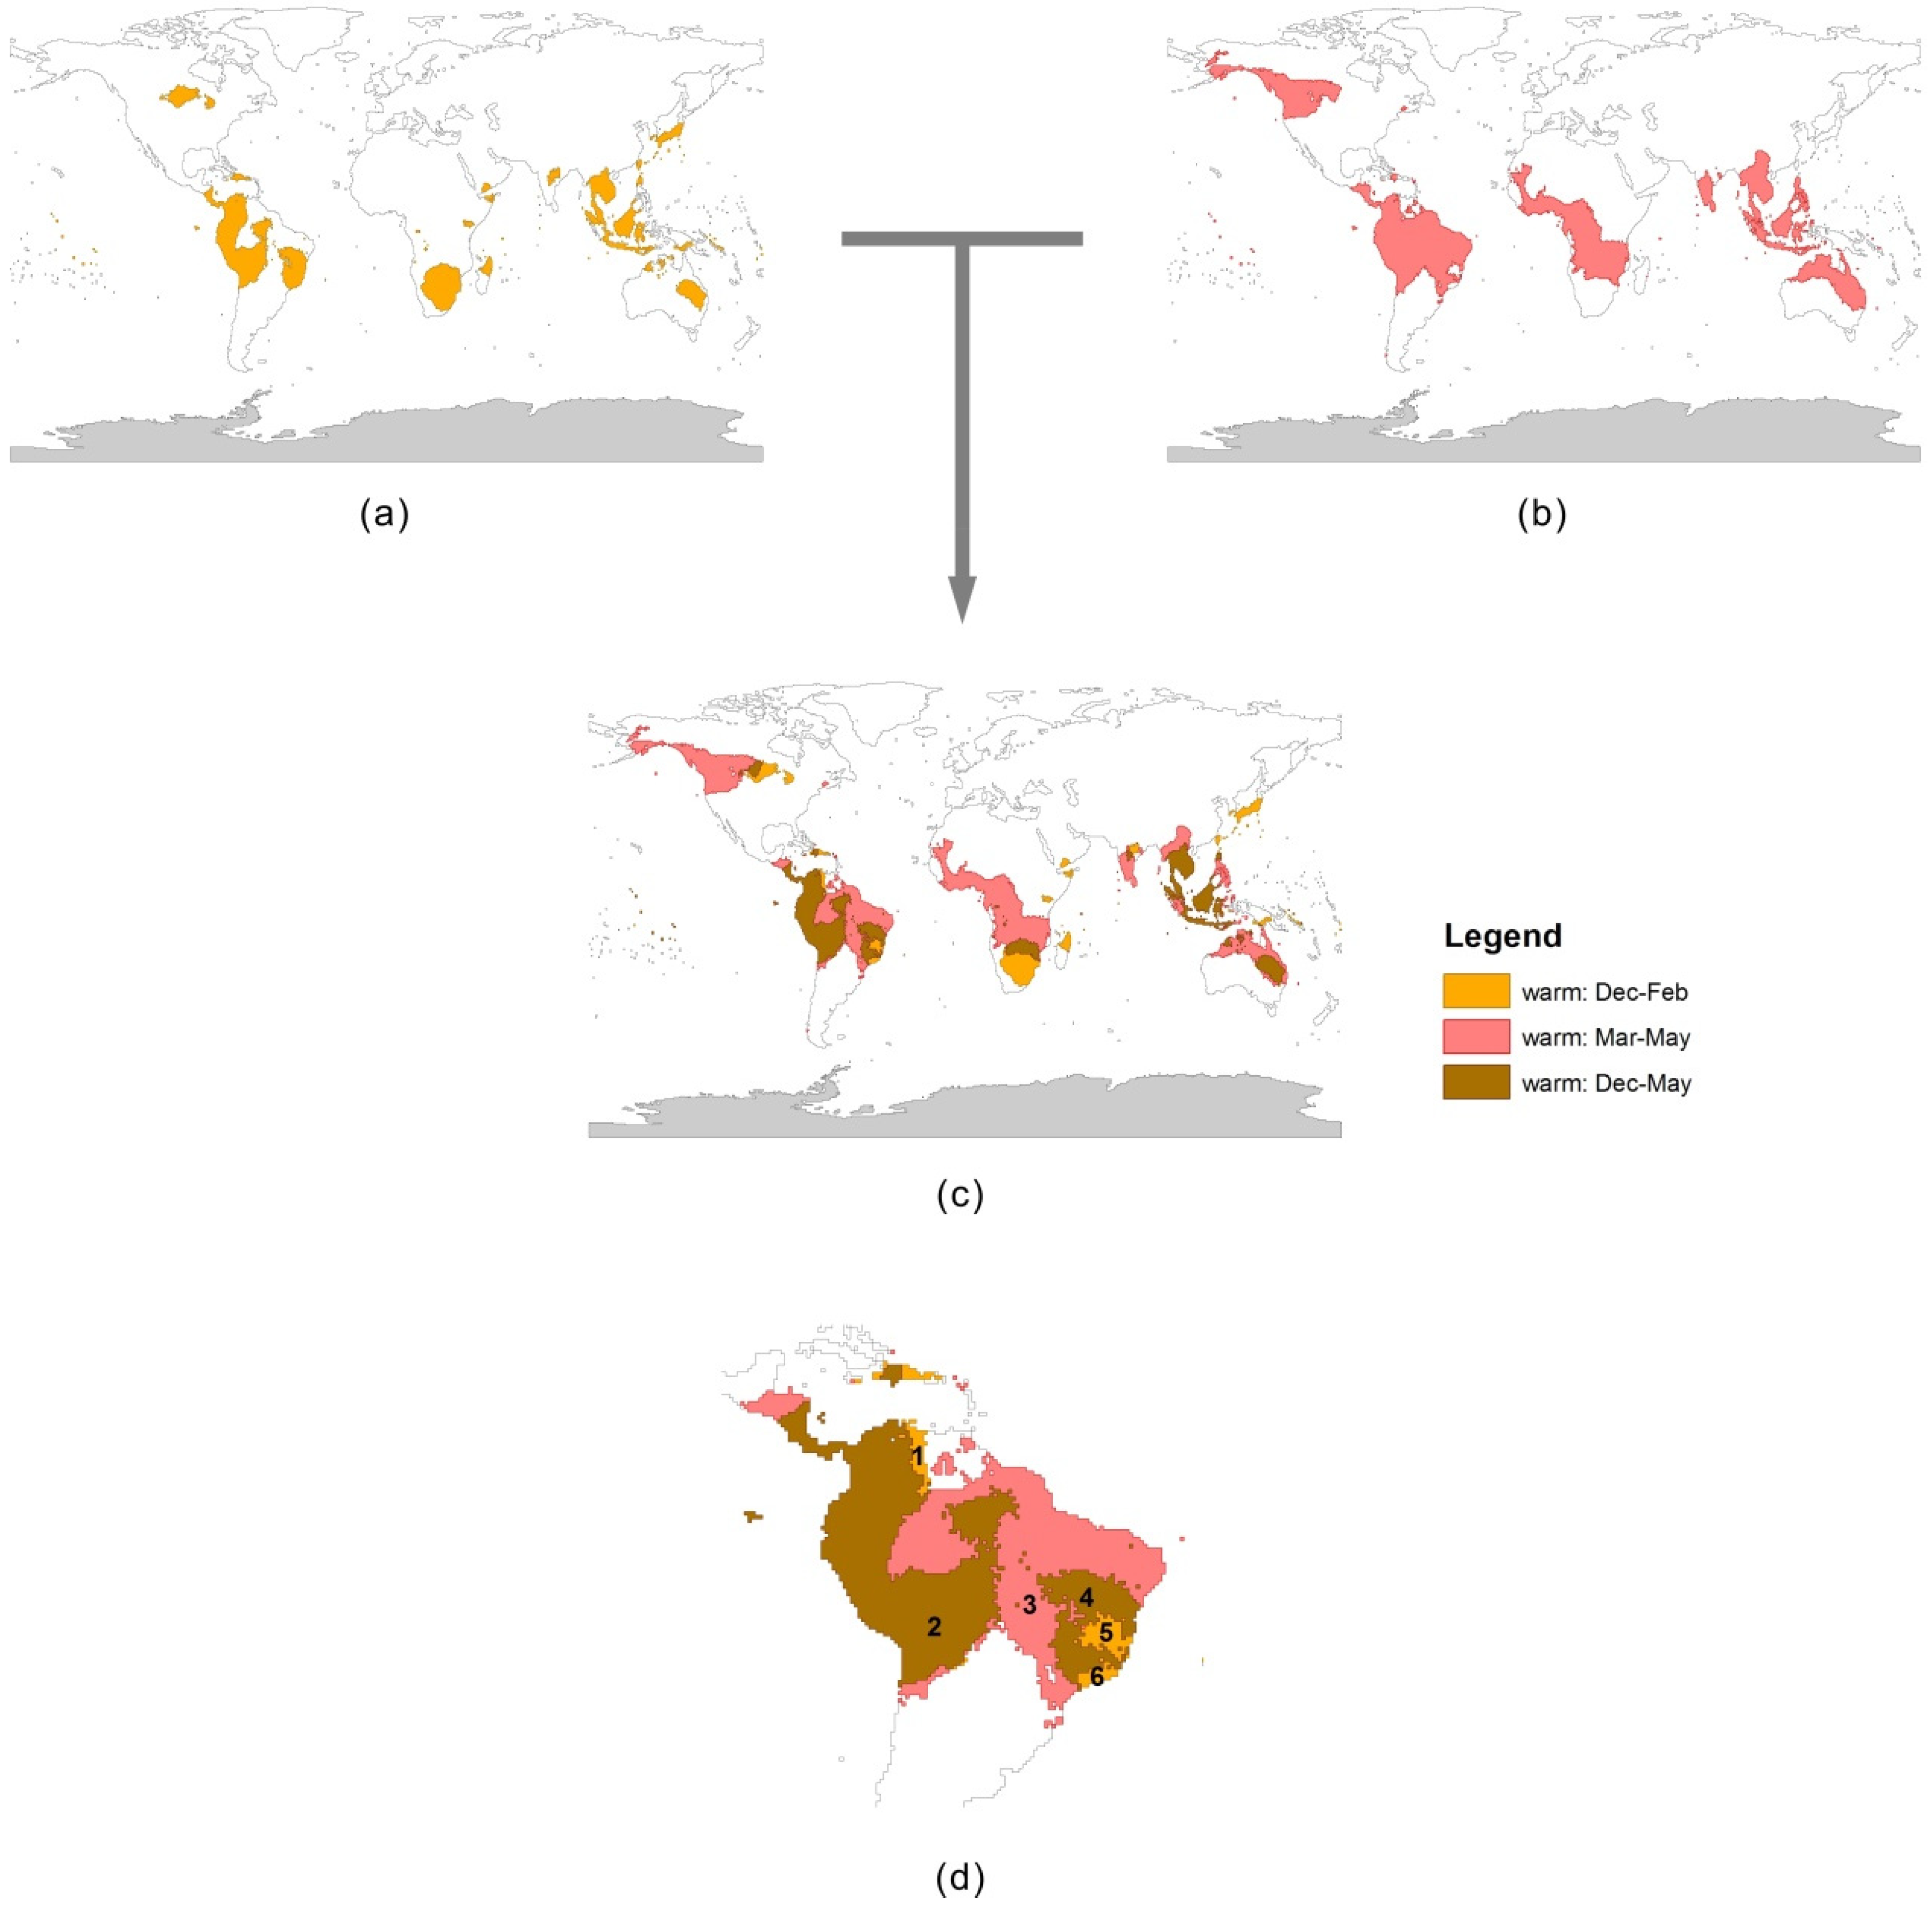
2.4. Flock Extraction

A flock is a well-known data structure in the context of the moving-object trajectory analysis [28]. In general, a moving-object flock refers to a group of moving objects, which remain close to each other for a period. In this study, a flock is defined as a group of grid points whose teleconnection types remain identical but non-neutral for several consecutive months. The months associated with a certain flock are defined as the flock period, the flock length is the length of this period (in months) and, finally, the flock coverage is its spatial extent. Note that coverage may be a combination of several disjoint polygons. No lower limit is imposed to the flock length so the shortest flock periods cover only one month. Given a flock period, the flock contains all the grid points fulfilling certain criteria. For instance, Figure 1 shows a flock denoted as “Flock T-w: Jan-Mar”. This notation indicates the variable (T) and teleconnection type (w). The period of this flock is from January to March, i.e., it covers three months, and so the length of the flock is 3. The coverage of the flock is the combination of the yellow regions in Figure 1. Note that a flock is unconstrained by the teleconnection type outside the flock period, so the teleconnection type of the other nine months can be arbitrary. In summary, a flock characterizes the El Niño teleconnections in the sense that it is a spatial region with identical teleconnection type during a fixed period. Based on this definition, flocks have been extracted from the sequences. Note that the flock extraction is a step of information distillation rather than data processing, i.e., the data is organized using a new data structure (flock).

2.5. Flock Analysis

An important feature of the flocks as defined here is that the flocks often overlap with one another both spatially and/or temporally. These overlapping relations are important in studying the pattern of El Niño teleconnections. As an example, Figure 2a,b shows two flocks, which are the warm flocks in boreal winter (Flock T-w: Dec-Feb) and in boreal spring (Flock T-w: Mar-May), respectively. Figure 2c combines these two flocks. The intersected regions of the two flocks, which are the brown parts, make up another flock (Flock T-w: Dec-May). Note that the boreal winter flock (Flock T-w: Dec–Feb) and the boreal spring flock (Flock T-w: Mar-May) overlapped spatially but not temporally, while the six-months flock (Flock T-w: Dec-May) overlapped with the other two flocks both spatially and temporally. Additionally, note that the colors in Figure 2 did not necessarily indicate flocks. For example, Flock T-w: Dec-Feb includes both yellow and brown regions in Figure 2c. So, the legend of Figure 2 does not list the raw flocks although they can be easily derived. In order to interpret the figures in a clearer way, Figure 2d provides a zoom of South America, a region known to feature strong El Niño teleconnections.
The overlapping relations among the flocks can be interpreted in different ways. On the one hand, the flocks can be analyzed at the same temporal scale. The two flocks in Figure 2a,b were at the seasonal scale, so the analysis between them revealed the dynamics of El Niño teleconnections from boreal winter to boreal spring. For instance, Figure 2d shows two warm boreal wintertime regions in South America: One at the east-coast (Regions 4, 5 and 6) and one at the west-coast (Regions 1 and 2). From boreal winter to boreal spring, the extent of these two regions is reduced since Regions 1, 5 and 6 are no longer warm in boreal spring, and expanded since Region 3 is not warm in boreal winter but warm in boreal spring. Region 3 connects the two boreal wintertime warm regions, thereby forming one big warm boreal springtime region in South America. On the other hand, the flocks can also be analyzed at different time scales. In Figure 2, the boreal winter flock (Flock T-w: Dec–Feb) and the boreal spring flock (Flock T-w: Mar–May) were at the seasonal scale, while the six-months flock (Flock T-w: Dec-May) was at the half-year scale. The analysis among them shows the multitemporal dynamical aspects of El Niño teleconnections from December to May. Figure 2d shows that Regions 2 and 4 were the core warm regions during the entire six-months period. During the first three months, the core regions slightly expanded along the coast (Regions 1, 5 and 6), while in the last three months, the core regions significantly expanded inland. Therefore, for the six months from December to May, the warm regions expanded more in the second half of the period than in the first half. In summary, the use of flock analysis allowed the investigation of the spatiotemporal behavior of El Niño teleconnections.

3. Results

This study involved two variables (TMP and PRE), thus four types of El Niño teleconnections were analyzed: Anomalous temperature increase (warm), anomalous temperature decrease (cool), anomalous precipitation increase (wet) and anomalous precipitation decrease (dry). The spatiotemporal patterns of the four teleconnections were different, but the way to interpret them was the same. This section presents and discusses the patterns of one teleconnection: The anomalous temperature increase (warm). The interested reader can find the results of the other teleconnections in the Supplementary Materials. The patterns were analyzed at two temporal scales: Monthly scale and seasonal scale, because they are common temporal scales in the studies of El Niño teleconnections. Nevertheless, it is technically possible to analyze the data at other scales, although not discussed in detail in this paper. The results presented in this section consist of two parts. Section 3.1 visualizes and discusses the single-scale analyses, which study the dynamics of El Niño teleconnections between seasons. The multiscale analyses, which study the El Niño teleconnections within the seasons, are visualized and discussed in Section 3.2.

3.1. The Dynamics between Seasons

The dynamics of El Niño teleconnections between seasons can be studied by comparing the flocks of adjacent seasons. Figure 3 visualizes the warm flocks and their relations in adjacent seasons. Each map in Figure 3 shows the flocks of two adjacent seasons: The yellow regions were warm in the former season, while the red regions were warm in the latter season. The brown regions remained warm in the two seasons. Again note that, due to the overlap of flocks, the colors in Figure 3 did not necessarily indicate the flocks.
The flocks in Figure 3 illustrate the spatiotemporal pattern of the anomalously high temperatures in El Niño. At the seasonal level, the regions subject to warm teleconnections were mainly situated in five regions: South America, North America, Africa, South Asia and the west coast of the Pacific (including Southeast Asia, East Asia and Oceania).
As a region known to be seriously influenced by El Niño, the west coast of South America is subject to an anomalous temperature increase throughout the entire year. Other South American regions are subject to the teleconnections only in certain seasons. In boreal winter, the warm regions in South America consisted of a part on the west coast and a part on the east coast. From boreal winter to boreal spring, the two parts expanded and connected, making a big region in the north of South America. Then, in the next two seasons, the warm regions kept shrinking from east to west. As a result, the teleconnection on the east coast disappeared while the teleconnection on the west coast remained. This trend stopped when a region on the east becomes warm in boreal winter. The west coast of the Pacific was also close to the source of El Niño, but the spatiotemporal behavior of the teleconnection was different. The anomalously high temperature in the west coast of the Pacific existed mainly in boreal winter and boreal spring. A large part of this region was warmer than usual in boreal winter, and the warm regions even expanded in boreal spring. However, the teleconnection stopped in boreal summer and boreal autumn. Only a very small part of the west coast of the Pacific was warmer than usual in boreal summer and boreal autumn. Thus the spatiotemporal pattern of the anomalously high temperatures in the west coast of the Pacific was different from South America.
In North America, an anomalous temperature increase existed in the boreal wintertime El Niño months in some central regions. From boreal winter to boreal spring, the regions under warm teleconnections move to the west coast. However, the teleconnection stopped in boreal summer and did not recover until boreal spring. So, at the seasonal scale, North America was subject to the anomalously high temperatures only in boreal winter and boreal spring. In Africa, the warm teleconnections from boreal winter to boreal summer corresponded to a movement from south to north across the equator with no temperature anomaly in boreal autumn. In South Asia the northeast part was anomalously warm in boreal wintertime El Niño months. Subsequently, the warm region moved southward in boreal spring and remained in Southern South Asia in boreal summer. After boreal summer, there was a movement backwards from the south to the northwest part.

3.2. The Dynamics within One Season

The dynamics of El Niño teleconnections within one season can be studied by comparing the seasonal flock and the monthly flocks within each season. Figure 4 visualizes the warm flocks of the four seasons and the corresponding monthly flocks in the seasons. The brown regions show the seasonal flocks, while the lines of different colors indicate the monthly flocks. Note that the widths of the three colorful lines were different, so that one could identify them when the monthly flocks share boundaries. The widths of the lines implied no other information.
Figure 4 also contains important information. As discussed in the previous section, at the seasonal timescale, the regions subject to the anomalously high temperature in El Niño months were situated in the five major regions. In addition, Figure 4 revealed more warm regions, which were not included in Figure 3 because the corresponding teleconnections did not remain for one complete season. The extra information in Figure 4 was important in the study of El Niño teleconnections. For instance, there is well-known warm El Niño teleconnection over North America [29] in boreal winter. However, in Figure 3a,d, the warm region in North America during boreal wintertime was small, which was inconsistent with the previous conclusion. This inconsistency can be explained by Figure 4. As shown by Figure 4a, the warm region in North America was large in January and February, but reduced in December, implying that North America was indeed subject to the warm teleconnections during boreal wintertime, but the teleconnection did not remain for the whole season. Thus the teleconnection can be found in Figure 4 but cannot be revealed by Figure 3.
Besides the extra information, Figure 4 also revealed the spatiotemporal pattern of the El Niño teleconnections within one season. At the local scale, one can identify three relations between the spatial coverage of the seasonal flock and the monthly flocks, which correspond to three spatiotemporal patterns. Note that this paper proposed fuzzy definitions to the three relations, without giving a quantitative threshold. So, the three spatiotemporal patterns were not strictly distinguished. Nevertheless, the semantics of the three relations were clear, thus one can generally identify the three patterns in Figure 4.
(1) The spatial coverage of the three monthly flocks is similar, thus the coverage of the seasonal flock is similar to the monthly flocks. The symbol of this situation on the maps is a brown region tightly surrounded by lines of three colors. This situation corresponds to the locally constant teleconnection in the season, that the warm regions remain the same in the three months of the season. South America in boreal spring and Southeast Asia in boreal spring and boreal winter belong to this pattern. This is not surprising due to their proximity to the Pacific. A strong and widespread El Niño teleconnection is therefore clear.
(2) The spatial coverage of the three monthly flocks is different, but they share some common areas. This situation is symbolized by a brown region surrounded by three colorful lines, but with big white regions between the brown region and the colorful lines. Such a situation indicates a varying pattern. The warm regions vary regionally in the three months of the season, but they share a core part, which remains warm in the whole season. Typical examples of this situation include North America in boreal winter and boreal spring, South America in boreal winter, Africa in boreal summer, etc. In general, this is the dominant spatiotemporal pattern for anomalously high temperatures in El Niño.
(3) The coverage of the three monthly flocks barely or not share a common area, or there merely exists one or two monthly flocks, implying the absence of the seasonal flock. This situation is shown by the white region surrounded by one or more colorful lines. Some cases of this situation could be El Niño teleconnections across the seasons, while the other cases are indicative of short-duration El Niño teleconnections or simply statistical noise. One has to check the maps of adjacent seasons to make the conclusion. For example, the Mainland Southeast Asia is warm in November, but not in September and October. However, note that the Mainland Southeast Asian is warm in the whole boreal winter. So, this situation in Mainland Southeast Asia indicates an El Niño teleconnection across the seasons rather than short duration teleconnection.
The global spatiotemporal patterns of the anomalously high temperatures in El Niño are the mixture of the three patterns above. Note that the second pattern is the dominant one, indicating that the anomalously high temperatures vary in El Niño.

4. Discussion

4.1. Other El Niño Teleconnections

The results presented above illustrate the spatiotemporal patterns of the anomalous temperature increases in El Niño, thus demonstrating the attribute-trajectory-based method of the teleconnection analysis. In order to keep the article concise, the results of the other three types of El Niño teleconnections (anomalous temperature decrease, anomalous precipitation increase and anomalous precipitation decrease) were not presented in this paper but were included in the Supplementary Materials. Figures S1–S32 visualize the interseasonal/intraseasonal dynamics of the flocks for each type of El Niño teleconnections and each season/pair of seasons. Figures S33–S38 are the combinations of the maps in Figures S1–S32, which illustrates the dynamics in the similar format as Figure 3 and Figure 4. In general, the spatial coverages of the other three teleconnection types were smaller than the anomalous temperature increases, and the spatiotemporal patterns of the four teleconnection types were different. Few regions were subject to anomalously low temperature for two consecutive seasons, so the interseason spatiotemporal patterns of the cool regions were different from the movement patterns of the warm regions. The regions subject to anomalous precipitation were more fragmented than the regions subject to anomalous temperature, thus the movements of the wet and dry regions tended to be local. Although the spatiotemporal patterns were different, the results of the four teleconnection types supported a common conclusion that El Niño teleconnections are widespread but vary in space and time. More specifically, 71.7% of the grid points feature anomalous temperatures in at least one month of the year in El Niño, and the percentage for precipitation was 74.2%. If we take both variables into consideration, only 8.0% of the grid points were never subject to El Niño teleconnections. However, only 2.4% of grid points were subject to anomalously high temperatures throughout the entire year. The corresponding percentage for anomalously high precipitation was 0.2%, and for anomalously low precipitation was 0.1%. Additionally, no grid point was subject to anomalously low temperature throughout the year. So, in summary, most of the global land area was subject to El Niño teleconnections, but the teleconnections varied strongly.

4.2. The Method and the Analysis of Anomalous Temperature Increase

In general, the attribute-trajectory-based method proposed in this paper is a new approach to analyze the dynamics of the El Niño teleconnections. In most existing works, the teleconnections are usually processed and stored per month or per season [18]. The dynamics are then conventionally extracted by comparing the teleconnections of consecutive timestamps before further analysis. In the domain of geographical information science, this technique is called a spatiotemporal snapshot [30]. Although conceptually straightforward, this technique is not the best solution to study the dynamics. The attribute-trajectory-based method, proposed here, concentrates on the dynamics. More specifically, the dynamics are stored as trajectories, so they can be analyzed directly, without the step of information extraction. Moreover, the attribute-trajectory-based method makes it possible to study the teleconnections using the techniques designed for trajectory analysis, which provides a novel perspective to understand the dynamics of El Niño teleconnections.
This paper defines El Niño using ONI, which is a common indicator of El Niño. There are some other indicators of El Niño, including the SST of the other regions [8], outgoing longwave radiation (OLR) [31] and the southern oscillation index (SOI) [32]. The ENSO index can also be defined by the first principal component (obtained using empirical orthogonal function analysis) of the SSTs over the tropical Pacific [21]. These definitions are correlated, and the slight differences between these definitions are not the main source of uncertainty. So, the simple and commonly used definition of the El Niño was utilized in this study.
This paper detected the El Niño teleconnections based on a hypothesis that if the temperature/precipitation in a region was anomalously higher/lower than normal when the ONI was high/low, this region was subject to the corresponding El Niño teleconnections. The teleconnections were thereby quantified by the normalized anomalies. This is a type of composite analysis. In principle, this hypothesis does not rule out the possible impacts of the other teleconnections. However, the analyses in this paper were based on the averages of several El Niño events rather than one El Niño event. Unless the periods of the other teleconnections were associated with the periods of El Niño teleconnections, the anomalous temperatures/precipitations discovered in this paper were probably subject to El Niño teleconnections. Actually, the results of this paper were generally consistent with the other studies about El Niño influences [15]. The regions that were subject to strong El Niño influences were mostly recovered. Since the main goal of this paper was to introduce the method to study the spatiotemporal patterns, the simple methodology to detect the El Niño teleconnections was used in this paper.
The spatiotemporal pattern of the anomalously high temperatures was studied by analyzing the overlapping relations among the flocks. This method did not limit the length of the flock, so such an analysis can be performed at multiple scales. The comparison between the flocks of the same temporal scale, e.g., the seasonal flocks, revealed the movement of the teleconnection, while the analysis among the flocks of different temporal scales, e.g., the seasonal flock and the monthly flock, indicates the relationship between the coverage and the duration of the teleconnection. The capability to perform the multiscale analysis is a strong advantage of the flock analysis. In this paper we chose seasons and months as the typical timescales in line with common climatological studies. The analysis, however, should not be limited to these two scales. Actually, Section 2.5 demonstrates the analysis with an extra scale (the scale of six months), although it only acts as an example and is thus not further discussed. In some situations, season and month may even not be the most suitable scales. For example, the anomalously high temperature in the Mainland Southeast Asia starts from November and ends in June. So the best flock to represent these teleconnections might be Flock T-w: Nov-Jun. One can tailor the scale according to the teleconnections at hand.
The presented results are based on the average of all the El Niño events in 1951–2017. Therefore, the spatiotemporal patterns revealed by these analyses demonstrated the overall El Niño teleconnections rather than the evolution of any single event. In general, the dynamical evolutions of known El Niño events were different from each other, due to complex interactions with the earth system at different temporal and spatial scales. Nevertheless, the method proposed in this paper could also be used in studying the evolution of a single El Niño event. Note that the analysis was based on the flocks extracted from the attribute trajectories, whose coordinates are the normalized anomalies. Therefore, by replacing the average anomalies of all the El Niño events in 1951–2017 by the anomalies of one El Niño event, one can study the development of the event using this method. Furthermore, other climatological teleconnections, such as the North Atlantic Oscillation (NAO) or the Pacific North-American Pattern (PNA), can be studied by this method.

4.3. Future Work

Although the method proposed in this paper produced promising results, it can still be optimized in different ways. Firstly, as discussed in the previous section, this paper used a simple methodology to detect the El Niño teleconnections. Although the results produced by this method are generally consistent with the other related studies, the methodology can still be improved by applying a more robust technique to detect the El Niño teleconnections. Secondly, the proposed method discretized the attribute trajectories into sequences, making the results clearer to understand. The discretization, however, eliminated the details of the data. More patterns may be discovered if one can analyze the attribute trajectories without discretization. So, it may be revenue for future study to design a method to analyze the attribute trajectories directly. Thirdly, some sequences containing both warm and cool labels were discovered during the analysis, implying that some regions were subject to two opposite teleconnections in the twelve months. The flock analysis was not specialized to analyze this phenomenon, because the flock was designed to investigate the behavior of one type of teleconnection. However, this phenomenon may be important and worth further investigation.

5. Conclusions

A method was proposed to analyze and visualize the spatiotemporal patterns of El Niño teleconnections. Four types of teleconnections (anomalous temperature increase and decrease and anomalous precipitation increase and decrease) were analyzed with a focus on anomalous temperature increases. The proposed method was derived from the attribute trajectory analysis technique. The normalized anomalies were used as coordinates to construct attribute trajectories, from which the flocks were extracted. The overlapping relations among the flocks revealed the spatiotemporal patterns of the teleconnections. The comparison between the flocks of the same temporal scale demonstrated the movement of the teleconnection, while the analysis among the flocks of different temporal scales indicates the relationship between the coverage and the duration of the teleconnection. More specifically, this study selected two temporal scales for analysis: Season and month. The seasonal analysis shows the dynamics of the five major warm regions between adjacent seasons. The multiscale analysis revealed three types of patterns between the monthly warm region and the seasonally warm region. However, note that the proposed method was capable to analyze the patterns at more temporal scales. One should choose the scale according to the required product of the analysis. The main contribution of this paper was the introduction of the method to study the spatiotemporal patterns of teleconnection. The capability to perform multiscale analysis makes it possible to identify and reveal the dynamics of the El Nino teleconnections from a novel perspective and in greater detail. Moreover, this method is capable of analyzing other teleconnections besides El Niño, making it a valuable tool in the domain of climatology.

Supplementary Materials

The following are available online at https://www.mdpi.com/article/10.3390/atmos12040414/s1. Figure S1: The dynamics of the seasonal warm flocks between boreal winter and boreal spring. Figure S2: The dynamics of the seasonal warm flocks between boreal spring and boreal summer. Figure S3: The dynamics of the seasonal warm flocks between boreal summer and boreal autumn. Figure S4: The dynamics of the seasonal warm flocks between boreal autumn and boreal winter. Figure S5: The dynamics of the seasonal cool flocks between boreal winter and boreal spring. Figure S6: The dynamics of the seasonal cool flocks between boreal spring and boreal summer. Figure S7: The dynamics of the seasonal cool flocks between boreal summer and boreal autumn. Figure S8: The dynamics of the seasonal cool flocks between boreal autumn and boreal winter. Figure S9: The dynamics of the seasonal wet flocks between boreal winter and boreal spring. Figure S10: The dynamics of the seasonal wet flocks between boreal spring and boreal summer. Figure S11: The dynamics of the seasonal wet flocks between boreal summer and boreal autumn. Figure S12: The dynamics of the seasonal wet flocks between boreal autumn and boreal winter. Figure S13: The dynamics of the seasonal dry flocks between boreal winter and boreal spring. Figure S14: The dynamics of the seasonal dry flocks between boreal spring and boreal summer. Figure S15: The dynamics of the seasonal dry flocks between boreal summer and boreal autumn. Figure S16: The dynamics of the seasonal dry flocks between boreal autumn and boreal winter. Figure S17: The dynamics of the monthly and seasonal warm flocks in boreal winter. Figure S18: The dynamics of the monthly and seasonal warm flocks in boreal spring. Figure S19: The dynamics of the monthly and seasonal warm flocks in boreal summer. Figure S20: The dynamics of the monthly and seasonal warm flocks in boreal autumn. Figure S21: The dynamics of the monthly and seasonal cool flocks in boreal winter. Figure S22: The dynamics of the monthly and seasonal cool flocks in boreal spring. Figure S23: The dynamics of the monthly and seasonal cool flocks in boreal summer. Figure S24: The dynamics of the monthly and seasonal cool flocks in boreal autumn. Figure S25: The dynamics of the monthly and seasonal wet flocks in boreal winter. Figure S26: The dynamics of the monthly and seasonal wet flocks in boreal spring. Figure S27: The dynamics of the monthly and seasonal wet flocks in boreal summer. Figure S28: The dynamics of the monthly and seasonal wet flocks in boreal autumn. Figure S29: The dynamics of the monthly and seasonal dry flocks in boreal winter. Figure S30: The dynamics of the monthly and seasonal dry flocks in boreal spring. Figure S31: The dynamics of the monthly and seasonal dry flocks in boreal summer. Figure S32: The dynamics of the monthly and seasonal dry flocks in boreal autumn. Figure S33: The cool flocks of the four pairs of adjacent seasons. Figure S34: The wet flocks of the four pairs of adjacent seasons. Figure S35: The dry flocks of the four pairs of adjacent seasons. Figure S36: The cool flocks of the four seasons and the corresponding monthly flocks. Figure S37: The wet flocks of the four seasons and the corresponding monthly flocks. Figure S38: The dry flocks of the four seasons and the corresponding monthly flocks. Dataset S1: The grid points stored in a shapefile. Dataset S2: The time series (1951–2017) of the SST in the Niño 3.4 region and the ONI.

Author Contributions

Conceptualization, P.T. and L.Z.; methodology, L.Z., B.V.S., S.C., P.T. and N.V.d.W.; software, L.Z.; validation, L.Z., B.V.S. and S.C.; formal analysis, L.Z.; investigation, L.Z.; resources, L.Z. and N.V.d.W.; data curation, L.Z.; writing—original draft preparation, L.Z.; writing—review and editing, L.Z., B.V.S., P.T. and N.V.d.W.; visualization, L.Z.; supervision, N.V.d.W. and P.T.; project administration, N.V.d.W. and P.T.; funding acquisition, L.Z. All authors have read and agreed to the published version of the manuscript.

Funding

L.Z. was funded by the China Scholarship council (CSC) (grant number 201406860007). B.V.S. was supported by URCLIM, INDECIS and MEDSCOPE that have received funding from EU’s H2020 Research and Innovation Program under Grant Agreement 690462.

Institutional Review Board Statement

Not applicable.

Informed Consent Statement

Not applicable.

Data Availability Statement

Publicly available datasets were analyzed in this study. The data can be found from the links: https://crudata.uea.ac.uk/cru/data/hrg/ (accessed on 29 January 2021); https://www.ncdc.noaa.gov/teleconnections/enso/indicators/sst/ (accessed on 29 January 2021).

Acknowledgments

The authors would like to thank the China Scholarship Council (CSC) for funding the research of L.Z.

Conflicts of Interest

The authors declare no conflict of interest.

References

  1. Anyamba, A.; Eastman, J.R. Interannual variability of NDVI over Africa and its relation to El Niño/Southern Oscillation. Int. J. Remote Sens. 1996, 17, 2533–2548. [Google Scholar] [CrossRef]
  2. Holmgren, M.; Scheffer, M.; Ezcurra, E.; Gutiérrez, J.R.; Mohren, G.M.J. El Niño effects on the dynamics of terrestrial ecosystems. Trends Ecol. Evolut. 2001, 16, 89–94. [Google Scholar] [CrossRef]
  3. Kovats, R.S. El Niño and human health. Bull. World Health Organ. 2000, 78, 1127–1135. [Google Scholar]
  4. Kovats, R.S.; Bouma, M.J.; Hajat, S.; Worrall, E.; Haines, A. El Niño and health. Lancet 2003, 362, 1481–1489. [Google Scholar] [CrossRef]
  5. Bouma, M.J.; Kovats, R.S.; Goubet, S.A.; Cox, J.S.H.; Haines, A. Global assessment of El Niño’s disaster burden. Lancet 1997, 350, 1435–1438. [Google Scholar] [CrossRef]
  6. Selvaraju, R. Impact of El Niño–southern oscillation on Indian foodgrain production. Int. J. Climatol. 2003, 23, 187–206. [Google Scholar] [CrossRef]
  7. McPhaden, M.J.; Zebiak, S.E.; Glantz, M.H. ENSO as an integrating concept in earth science. Science 2006, 314, 1740. [Google Scholar] [CrossRef] [PubMed]
  8. Trenberth, K.E. The Definition of El Niño. Bull. Am. Meteorol. Soc. 1997, 78, 2771–2778. [Google Scholar] [CrossRef]
  9. Yang, X.; DelSole, T. Systematic Comparison of ENSO teleconnection patterns between models and observations. J. Clim. 2012, 25, 425–446. [Google Scholar] [CrossRef]
  10. Wang, C.; Deser, C.; Yu, J.-Y.; DiNezio, P.; Clement, A. El Niño and Southern Oscillation (ENSO): A Review. In Coral Reefs of the Eastern Tropical Pacific; Glynn, P.W., Manzello, D.P., Enochs, C.I., Eds.; Springer: Dordrecht, The Netherlands, 2017; Volume 8, pp. 85–106. [Google Scholar]
  11. Yeh, S.-W.; Cai, W.; Min, S.-K.; McPhaden, M.J.; Dommenget, D.; Dewitte, B.; Collins, M.; Ashok, K.; An, S.-I.; Yim, B.-Y.; et al. ENSO Atmospheric teleconnections and their response to greenhouse gas forcing. Rev. Geophys. 2018, 56, 185–206. [Google Scholar] [CrossRef]
  12. Diaz, H.F.; Hoerling, M.P.; Eischeid, J.K. ENSO variability, teleconnections and climate change. Int. J. Climatol. 2001, 21, 1845–1862. [Google Scholar] [CrossRef]
  13. Cullather, R.I.; Bromwich, D.H.; Van Woert, M.L. Interannual variations in Antarctic precipitation related to El Niño-Southern Oscillation. J. Geophys. Res. Atmos. 1996, 101, 19109–19118. [Google Scholar] [CrossRef]
  14. Nicholson, S.E.; Kim, J. THE relationship of the El Niño–southern oscillation to african rainfall. Int. J. Climatol. 1997, 17, 117–135. [Google Scholar] [CrossRef]
  15. Brönnimann, S. Impact of El Niño–Southern Oscillation on European climate. Rev. Geophys. 2007, 45. [Google Scholar] [CrossRef]
  16. Brönnimann, S.; Xoplaki, E.; Casty, C.; Pauling, A.; Luterbacher, J. ENSO influence on Europe during the last centuries. Clim. Dyn. 2007, 28, 181–197. [Google Scholar] [CrossRef]
  17. Mariotti, A. How ENSO impacts precipitation in southwest central Asia. Geophys. Res. Lett. 2007, 34. [Google Scholar] [CrossRef]
  18. Yuan, Y.; Yang, S. Impacts of different types of El Niño on the east asian climate: Focus on ENSO cycles. J. Clim. 2012, 25, 7702–7722. [Google Scholar] [CrossRef]
  19. Wu, A.; Hsieh, W.W.; Shabbar, A. The nonlinear patterns of north american winter temperature and precipitation associated with ENSO. J. Clim. 2005, 18, 1736–1752. [Google Scholar] [CrossRef]
  20. Hsieh, W.W.; Wu, A.; Shabbar, A. Nonlinear atmospheric teleconnections. Geophys. Res. Lett. 2006, 33. [Google Scholar] [CrossRef]
  21. Lin, H.; Derome, J. Nonlinearity of the extratropical response to tropical forcing. J. Clim. 2004, 17, 2597–2608. [Google Scholar] [CrossRef]
  22. Zhang, L.; Van de Weghe, N. Attribute trajectory analysis: A framework to analyse attribute changes using trajectory analysis techniques. Int. J. Geograph. Inform. Sci. 2018, 32, 1043–1059. [Google Scholar] [CrossRef]
  23. Harris, I.; Osborn, T.J.; Jones, P.; Lister, D. Version 4 of the CRU TS monthly high-resolution gridded multivariate climate dataset. Sci. Data 2020, 7, 109. [Google Scholar] [CrossRef] [PubMed]
  24. Mariotti, A.; Zeng, N.; Lau, K.M. Euro-Mediterranean rainfall and ENSO—A seasonally varying relationship. Geophys. Res. Lett. 2002, 29, 51–59. [Google Scholar] [CrossRef]
  25. Bamston, A.G.; Chelliah, M.; Goldenberg, S.B. Documentation of a highly ENSO-related sst region in the equatorial pacific: Research note. Atmos. Ocean 1997, 35, 367–383. [Google Scholar] [CrossRef]
  26. NOAA. Equatorial Pacific Sea Surface Temperatures. Available online: https://www.ncdc.noaa.gov/teleconnections/enso/indicators/sst/ (accessed on 20 December 2018).
  27. NOAA. Description of Changes to Oceanic Niño Index (ONI). Available online: https://origin.cpc.ncep.noaa.gov/products/analysis_monitoring/ensostuff/ONI_change.shtml (accessed on 7 March 2021).
  28. Benkert, M.; Gudmundsson, J.; Hübner, F.; Wolle, T. Reporting flock patterns. Comput. Geom. 2008, 41, 111–125. [Google Scholar] [CrossRef]
  29. Ropelewski, C.F.; Halpert, M.S. North american precipitation and temperature patterns associated with the El Niño/Southern Oscillation (ENSO). Mon. Weather Rev. 1986, 114, 2352–2362. [Google Scholar] [CrossRef]
  30. Peuquet, D.J.; Duan, N. An event-based spatiotemporal data model (ESTDM) for temporal analysis of geographical data. Int. J. Geogr. Inf. Syst. 1995, 9, 7–24. [Google Scholar] [CrossRef]
  31. NOAA. Outgoing Longwave Radiation (OLR). Available online: https://www.ncdc.noaa.gov/teleconnections/enso/indicators/olr/ (accessed on 25 July 2020).
  32. NOAA. Southern Oscillation Index (SOI). Available online: https://www.ncdc.noaa.gov/teleconnections/enso/indicators/soi/ (accessed on 25 July 2020).
Figure 1. An example of a flock. The yellow regions show the coverage of the flock. The legend of the flock indicates the variable (T), teleconnection type (w) and the period of the flock (Jan-Mar). Note that this flock (and all the other flocks in this paper) is based on the CRU TS v4.02 dataset.
Atmosphere 12 00414 g001
Figure 2. An example of overlapping flocks. (a) The warm flock in boreal winter: Flock T-w: Dec-Feb. (b) The warm flock in boreal spring: Flock T-w: Mar-May. (c) The overlap of the two flocks above. (d) A zoom of South America.
Atmosphere 12 00414 g002
Figure 3. The warm flocks of the adjacent seasons. (a) The warm flocks of boreal winter and boreal spring. (b) The warm flocks of boreal spring and boreal summer. (c) The warm flocks of boreal summer and boreal autumn. (d) The warm flocks of boreal autumn and boreal winter.
Atmosphere 12 00414 g003
Figure 4. The warm flocks of the four seasons and the corresponding monthly flocks. (a) The flocks in boreal winter. (b) The flocks in boreal spring. (c) The flocks in boreal summer. (d) The flocks in boreal autumn. The widths of the lines for the monthly flocks are different, so that they do not cover each other when the monthly flocks share boundaries. The widths of the lines imply no other information.
Atmosphere 12 00414 g004
Table 1. The strong El Niño months in the period 1951–2017, categorized by month. Strong El Niño months are those in El Niño events and with ONI ≥ 0.8.
MonthYear with Strong El Niño Month
January1958, 1964, 1966, 1969, 1973, 1983, 1987, 1988, 1992, 1995, 1998, 2003, 2010, 2016
February1958, 1966, 1969, 1973, 1983, 1987, 1992, 1998, 2010, 2016
March1958, 1966, 1969, 1983, 1987, 1992, 1998, 2010, 2016
April1958, 1983, 1987, 1992, 1998, 2016
May1957, 1983, 1987, 1992, 2015
June1957, 1965, 1972, 1987, 1997, 2015
July1957, 1963, 1965, 1972, 1987, 1997, 2015
August1951, 1957, 1963, 1965, 1972, 1982, 1987, 1997, 2002, 2015
September1951, 1957, 1963, 1965, 1972, 1982, 1987, 1997, 2002, 2015
October1951, 1953, 1957, 1963, 1965, 1969, 1972, 1976, 1982, 1986, 1987, 1997, 2002, 2009, 2015
November1951, 1953, 1957, 1963, 1965, 1969, 1972, 1976, 1977, 1982, 1986, 1987, 1991, 1994, 1997, 2002, 2009, 2015
December1951, 1953, 1957, 1963, 1965, 1968, 1972, 1976, 1982, 1986, 1987, 1991, 1994, 1997, 2002, 2009, 2015
Table 2. The rule of transformation for temperature.
Teleconnection TypeCriterionCategoryLabel
Anomalous temperature increase V r , m T > 0.84 warmw
No anomalous temperature difference 0.84 V r , m T 0.84 neutraln
Anomalous temperature decrease V r , m T < 0.84 coolc
Publisher’s Note: MDPI stays neutral with regard to jurisdictional claims in published maps and institutional affiliations.

