Article

A Possible Linkage between Dust Frequency and the Siberian High in March over Northeast Asia

1
Department of Atmospheric Sciences, Chungnam National University, Daejeon 34134, Korea
2
Ulsan National Institute of Science and Technology, School of Urban and Environmental Engineering, Ulsan 44919, Korea
3
Department of Atmospheric Sciences, Yonsei University, Seoul 03722, Korea
*
Author to whom correspondence should be addressed.
Current address: Ulsan National Institute of Science and Technology, School of Urban and Environmental Engineering, Ulsan 44919, Korea.
Atmosphere 2021, 12(2), 176; https://doi.org/10.3390/atmos12020176
Submission received: 4 December 2020 / Revised: 25 January 2021 / Accepted: 25 January 2021 / Published: 29 January 2021
(This article belongs to the Section Air Quality)

Abstract

:
Spring dust frequency in northeast Asia has been investigated using various approaches to understand the mechanisms of dust emission and transport. However, little attention has been paid to the linkage between dust activity and the Siberian High (SH), particularly when the SH pressure system is highly variable. In this study, we characterize the possible physical mechanisms of dust emission and transport associated with the Siberian High Intensity (SHI) and Siberian High Position Index (SHPI) in March using 18 years of ground-based observations and reanalysis data. We found that when the SHI was strong and the SH’s center was farther east (“Strong–East period”), surface and atmospheric temperatures were cooler than when the SHI was weak and the SH’s center was farther west (“Weak-West period”), due to anomalous anticyclonic pressure and strong easterlies. As a result, a reduction in the meridional temperature gradient in the lower atmosphere suppressed dust emission and transport, due to stagnant atmospheric conditions. This anomalous anticyclonic pressure in the Strong-East case seems to reduce the development of extratropical cyclones (ETC) in northeast Asia, leading to a less effective dust transport. A case study with composite analysis also showed a similar physical mechanism: stagnant air accompanying weakened westerlies in the Strong-East period suppressed dust transport to South Korea. Our findings reveal that the intensity and position of the SH can be utilized to identify spring transboundary air pollutants in northeast Asia.

1. Introduction

Yellow sand, or Hwang-sa in Korean, is a frequent meteorological phenomenon in which sand dust is suspended in the air and gradually falls to the surface [1]. Although an artificial factor (e.g., urbanization) may affect dust emission in northeast Asia [2,3], the yellow sand is mainly related to atmospheric circulation changes. Dust events that occur in northeast Asia generally originate from arid or semi-arid regions such as northern China, the Gobi desert in Inner-Mongolia, the Loess Plateau, and the Taklamakan desert [4,5,6,7]. Dust storms move to eastern China, the Korean Peninsula, and Japan with strong northwesterly winds induced by atmospheric baroclinic instability in the lower atmosphere [1,8,9,10,11]. Dust aerosols contain both particulate matters (PM) with an aerodynamic diameter smaller than 10 µm (PM10) and smaller than 2.5 µm (PM2.5) [12,13]. PM10 and PM2.5 also contain other types of anthropogenic aerosols (e.g., black carbon); however, in springtime, high PM10 and PM2.5 concentrations are mostly observed due to yellow sand or dust storms [14,15,16,17,18]. The frequency of dust storms that originate in Mongolia varies seasonally: spring (61%), fall (22%), winter (10%), and summer (7%) [19]. High dust concentrations observed in Korea generally originate from the Gobi desert [20]. In South Korea, the yellow dust events are observed in all seasons except summer. Over the past 100 years, approximately 86% of the dust events observed in Seoul, South Korea, occurred in spring [21].
Dust aerosols affect air quality, visibility, public health, and a wide range of socioeconomic sectors in northeast Asian countries including eastern China, Korea, and Japan. For instance, during a severe dust storm that occurred in May 2017, visibility in Chinese desert areas dropped to below 100 m [22]. Poor air quality due to dust aerosols has increased hospitalization for respiratory and cardiovascular diseases and mortality [13,23,24,25]. Moreover, the annual economic lost caused by hazardous dust event is US $265 million in China and US $5.6 billion in South Korea [26,27]. Therefore, continuous monitoring and modelling of dust are essential to understand the mechanisms of dust emission and transport and its impacts on regional climate in northeast Asia [22,28,29,30].
Dust emissions and its transports are modulated by various meteorological and environmental factors. Several large-scale climate variabilities have been found to affect dust storm generation in the deserts of northern China and/or dust transports in northeast Asia: the polar vortex [31], the Arctic Oscillation (AO) [32,33,34,35], the North Atlantic Oscillation [36], the Antarctic Oscillation [37], and the El Niño–Southern Oscillation [34,38]. In particular, Lee et al. [34] showed observational evidence for greater spring dust activity in a year with El Niño and AO negative phase because of the enhanced meridional gradients of pressure and temperature over the dust source regions. In addition, dust activity and emissions in dust source areas are caused by combined regional meteorological, climatological, and environmental factors, including wind [39,40], precipitation [41], temperature, vegetation greenness, surface moisture [4,42,43,44,45], and Eurasian snow cover [46]. Moreover, the impacts of climate change on rapid desertification may be closely related to the recent changes in dust occurrences in East Asia [47,48]. These findings imply that dust activity is associated with complex and multiple weather, climate, and environmental factors.
Investigating synoptic meteorological patterns is an essential task to understand the physical and dynamic mechanisms of dust transports to downwind region. Dust storms are transported to eastern China, the Korean Peninsula, and Japan by strong westerly or northwesterly winds induced by atmospheric baroclinic instability in the lower atmosphere [1,8,9,30,49,50]. Therefore, analyzing synoptic meteorological fields associated with the dust incursion pathways is key to understand the mechanisms of dust transports and for dust prediction [15,51,52]. Although dust emissions and transports are connected in general, dust transports to downwind regions can be more sensitive to air pathways or the synoptic meteorological states. For example, Lee et al. [53] found that an anomalously high sea level pressure in the dust source regions led to reductions in the meridional pressure gradient, cyclogenesis, and surface winds. These anomalous anticyclonic patterns suppressed dust transports to South Korea. Furthermore, a pressure trough located over the downwind side of north of the Korean Peninsula that blocked these airmass routes resulted in no dust events in South Korea.
The Siberian High (SH) is a dominant influence on winter climate in East Asia [54,55,56]. Many previous studies have investigated the relationship between the SH and the winter monsoon, cold surges, and snowstorms [57,58,59,60,61,62]. Several authors have suggested a relationship between the SH and air quality during wintertime. Zhao et al. [62] found better air quality in northern China was caused by a strong SH resulting from a warming Arctic and reduced sea ice. The eastward expansion of the SH is also associated with better wintertime air quality in China and Korea [63,64]. Especially, Kim [64] analyzed the Siberian High Position Index (SHPI) to explain the long-term relationship between the PM10 and surface temperature over Korea. The eastward shifted SH is likely to be associated not only with air stagnation, but also with the relationship between PM10 and temperature in recent decades. However, there are no studies highlighting the effects of the Siberian High Intensity (SHI) and SHPI on spring dust events. As spring begins, the SH is weakened, but dust activity is more frequent in this season. In addition, the SH still influences surface conditions and spring climate in East Asia.
The SH system can be characterized by the intensity (i.e., pressure) and position of the center of the SH: the SHI [55,65] and the SHPI [63] (see details in Section 2). In particular, the SHPI, proposed by Jia et al. [63], is a useful index to explain why the winter haze observed in January 2013 in north China was more severe than in south China. Thus, we hypothesize that the dust frequencies in dust source regions and the receptor area (e.g., downwind country like South Korea) are substantially affected by the SHI and SHPI characteristics. Our ultimate goal is to demonstrate the possible physical effects of the SH on dust frequency for a better understanding of dust emissions and transport mechanisms in springtime. Therefore, we present changes in dust frequency and cyclone frequency associated with synoptic meteorological patterns using both SHI and SHPI.

2. Materials and Methods
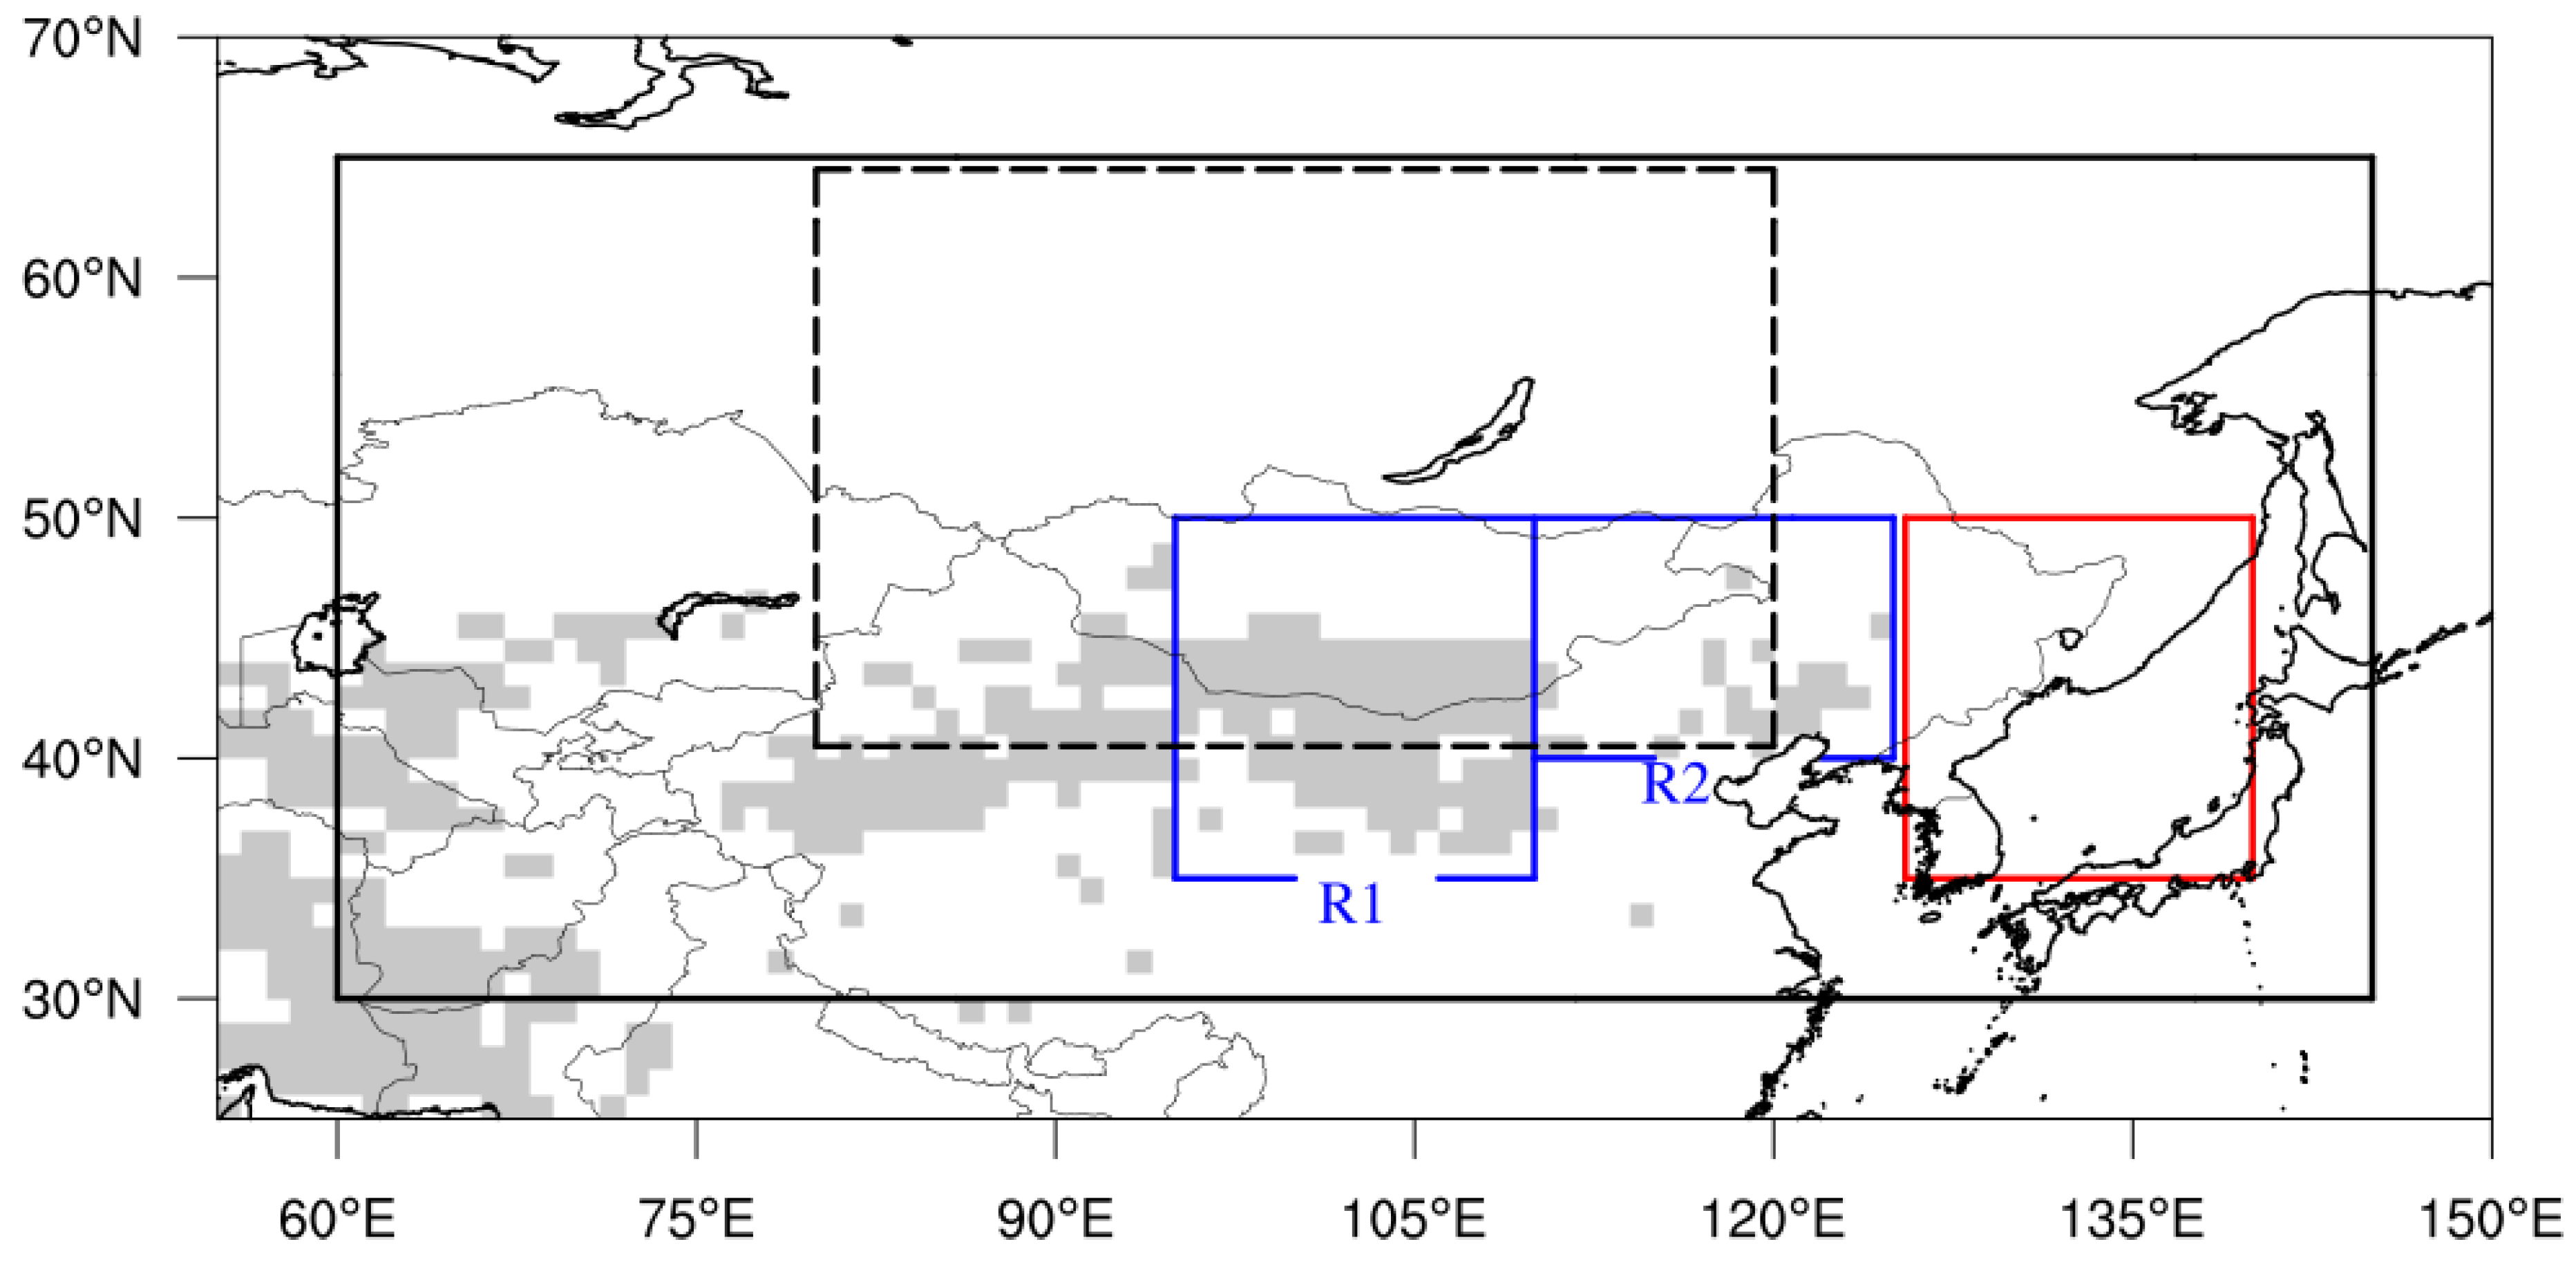
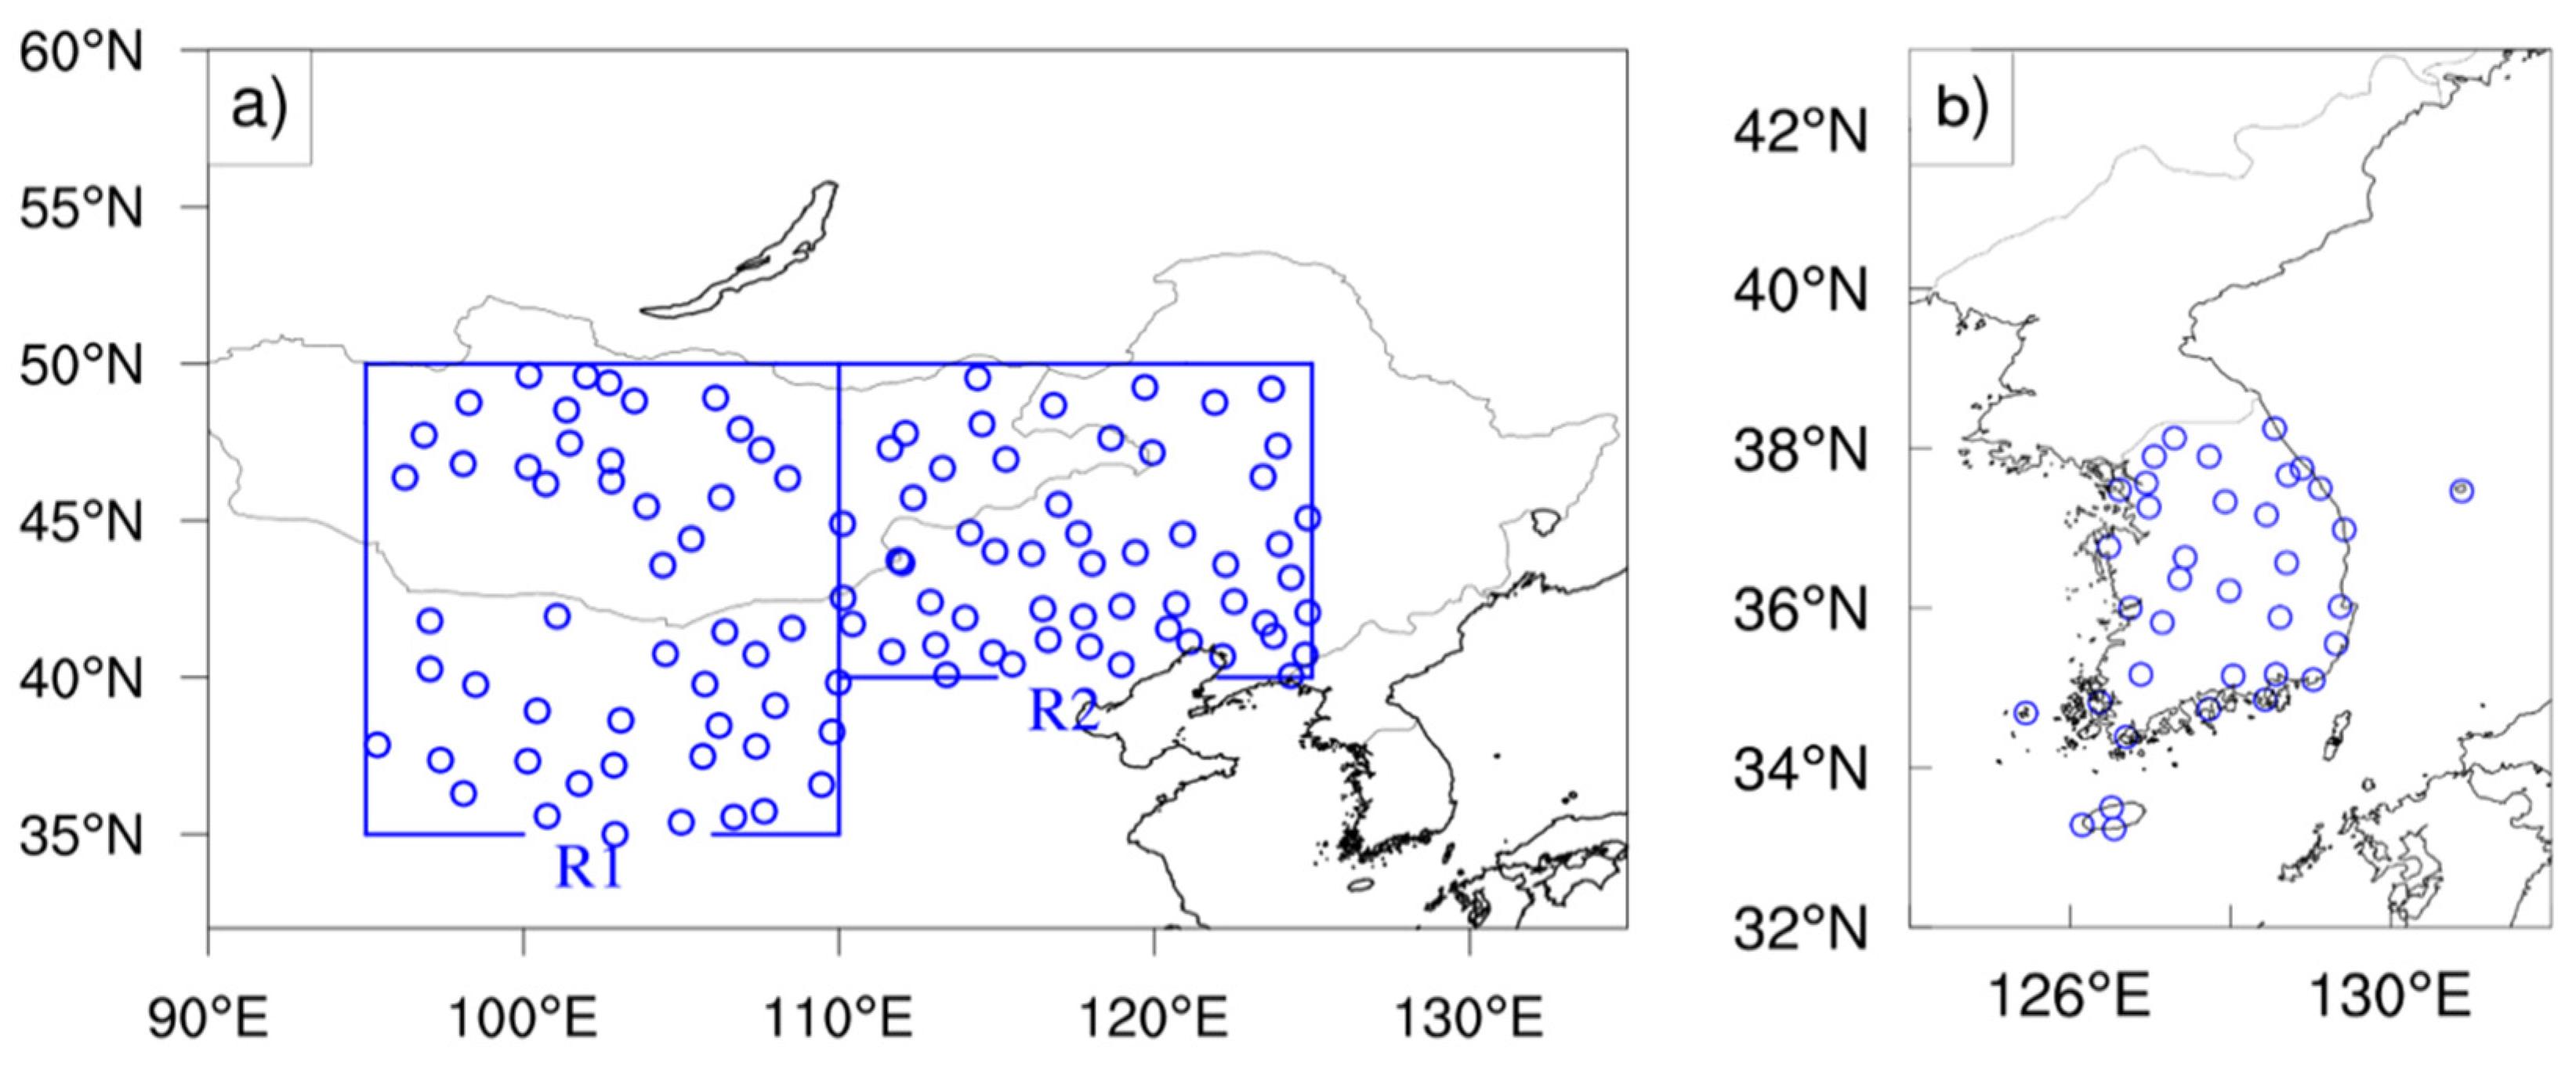
2.1. Study Domain

Our study area covers two dust source regions, R1 and R2, and a representative downwind located country, South Korea, in northeast Asia (Figure 1 and Figure 2). Dust source regions were classified in terms of dust generation mechanisms and long-term trends from the several previous studies [8,66,67]. The region R1 (95°–110° E, 35°–50° N) represents arid areas of northern China and Mongolia, including the Gobi, Bardinjaran, Tanger, and Ulanbu deserts. The region R2 (110°–125° E, 40°–50° N) covers the Othindag and Hunshudak deserts in the middle of Inner Mongolia and northeastern China. Dust aerosols lifted up in R2 are often transported to the Korean Peninsula and Japan by strong winds and results in severe dust events and poor visibility [53]. Although the largest dust source region is located in northwestern China next to the western of R1 [46,67], we selected R1 and R2 to identify dust transport and incursion into South Korea in relation to the SH pressure system. Further details of the dust source regions are described in previous studies [46,53,68].
To explain the linkage between cyclones and dust activity associated with the SH variations, we analyzed the characteristics of the extratropical cyclones (ETC) in the dust source regions and the ETC domain (125°–140° E, 35°–50° N), i.e., the area over which ETCs pass, as defined by Lee et al. [49] (red box in Figure 1). We compared differences in the ETC frequency and intense ETC frequency over the dust source regions and the ETC domain for the Strong-East and Weak-West periods).

2.2. Dataset

To explain dust frequency in relation to the characteristics of the SH, we used two SH indices: the SHI as a measure of the intensity (or strength) of the SH and the SHPI as an indicator of the location or position of the SH’s center [63,65]. The domains for calculating the SHI and SHPI are shown in Figure 1. Originally, the SHI was defined as the strength of the SH pressure system over 80°–120° E and 40°–65° N during the wintertime (December–January–February) [54,55,70]. In our study, we used the average mean sea level pressure (MSLP) in March. The SHPI represents the position of the SH in an east-west direction over 60°–145° E, 30°–60° N, an area including not only dust source regions but also downwind regions, including the Korean Peninsula and Japan (Figure 1). We calculated the SHPI for March over the same domain proposed by Jia et al. [63]. A higher SHPI value implies that the center of the SH is shifted to eastward of its climatological position (average of 18 years).
In this study, we defined dust frequency as an indicator of dust emission in the source region and transport to downwind region. Here, dust transport means dust incursion into South Korea. To calculate dust frequency, we first selected the good quality of the surface synoptic observations (SYNOP) measured in the dust source regions and South Korea (Figure 2a,b). The SYNOP dataset was obtained from the external application programming interface service webpage of the Korea Meteorological Administration (KMA) [71]. The quality criteria required that 3-hourly weather observations were made at least four times a day and that more than 330 days of daily data were available at the station. The same standard was also used by Lee et al. [53]. Next, data at each station were categorized into two values: 1 if dust was observed at least once per day from the eight 3-hourly interval daily observation data and 0 if no dust event was observed. To select the day having the dust events (i.e., dust storms and blowing sand), we applied the same dust weather codes used in previous studies [40,72]. By selecting only category 1 data, we obtained the total dust recorded by SYNOP on each day for each of R1, R2, and South Korea. Then we summed these number of stations during March from 2000 to 2017 for each of R1, R2, and South Korea. Thus, we can define the dust occurrence frequency (DOF) as the average number of dust-observing weather stations (SYNOP) in the two dust source regions by year as follows:
D O F =   i = 1 N s ( D D ) i N s ,
where Ns is the total number of the SYNOP data and DD is the total number of dust days at the ith station in March over all years. We defined a different dust frequency for South Korea as the dust event frequency (DEF), because dust days in South Korea are events or episodes. South Korea is located in downwind side and it is a dust receptor rather than a dust emission area. Therefore, the DEF indicates dust incursions from the source regions (i.e., R1 and R2). The calculation procedure for the DEF was the same as for the DOF. The total number of the SYNOP data (Ns) were 106 in dust source regions (51 for R1 and 55 for R2) and 36 for South Korea (Figure 2a,b).
In this study, we used the SYNOP for calculating the DOF and DEF. One can also use the surface PM10 measurements; however, high PM10 days do not always reflect the dust emission days or dust episodes, because they were affected by different synoptic weather patterns [73]. During the yellow sand events, a well-developed cyclone passed through the dust source regions (Mongolian deserts and northern China) and moved eastward over time. On the contrary, high-PM10 was modulated by relatively weaker cyclonic anomalies compared to the yellow sand events. Therefore, the DOF and DEF obtained from the SYNOP would give more direct information of dust activity than the surface PM10 measurements.
To investigate the changes in atmospheric circulation in northeast Asia in response to the SH variations, we used the ERA-Interim archive Version 2.0 reanalysis dataset from the European Centre for Medium-Range Weather Forecasts (ECMWF) [74]. Meteorological variables used for the analysis were the mean sea level pressure (MSLP), geopotential height (Z), temperature (T), zonal wind (u), and meridional wind (v) with a horizontal resolution of 0.75° × 0.75° on a longitude–latitude grid. To understand the features of dust transport to South Korea, we calculated the average of the MSLP and 850-hPa wind components at every 00 h (Coordinated Universal Time, UTC) for selected 12 dust days. The 12 high dust emission days for the Strong-East and Weak-West periods are listed in Table S4.
To examine the effects of snow cover on spring dust emission, we used monthly Snow Cover Extent (SCE) data version 1 from the National Oceanic and Atmosphere Administration (NOAA) Climate Data Record (CDR) [75]. Since June 1999, the satellite-derived weekly SCE product has been available at monthly resolution with National Meteorological Center (NMC) grid coordinates (88 × 88 cells) over the Northern Hemisphere on a polar stereographic projection. The SCE data for each grid cell are stored as values from 0 to 1, presenting the snow cover fraction. In our study, we converted the SCE to a percentage by multiplying by 100.
We used daily ETC data computed from the National Centers for Environmental Prediction (NCEP) and National Center for Atmospheric Research (NCAR) Reanalysis dataset [76]. The spatial resolution of the ETC data is of 2.5° × 2.5°, which is lower than the ERA-Interim reanalysis data. To calculate the ETC frequency and intense ETC frequency, we first selected data where the central pressure was lower than 1010-hPa and the Laplacian of the pressure was greater than 10 mPa/km−2, respectively, and then calculated monthly data.

2.3. Data Analysis

We performed a composite difference analysis to understand the changes in dust frequency, and the meteorological patterns associated with different SH characteristics. Interannual variations of the SHI and SHPI were high, and showed a strong positive correlation coefficient (r = +0.61, p-value < 0.01) during the study period (Figure 3a). In contrast to March, the correlation relationship between the SHI and SHPI in winter was weak (r = −0.29, p-value = 0.2519 for January, r = +0.26, p-value = 0.3112 for February) [63].
Based on the good correlation between the SHI and SHPI (Figure 3a), we used both indices to explain differences in dust frequency (i.e., DOF and DEF) and cyclone frequency (i.e., ETC frequency and intense ETC frequency) (Table S2). Here, “Strong” and “Weak” indicate the power of the SHI, whereas “East” and “West” denote the eastward and westward location of the SH’s center. We selected the top three years having both high SHI and high SHPI values (2005, 2010, and 2012) (Figure 3, Table S1). The average of datasets for three years is called the “Strong-East” period. To make composite difference, we selected the bottom three years having both low SHI and low SHPI values (2004, 2006, and 2013). The average of datasets for three years is called the “Weak-West” period (Figure 3, Table S1). For the analysis, DOF, DEF, meteorological variables (i.e., mean sea level pressure: MSLP, 850-hPa geopotential height: Z850, 850-hPa horizontal wind vectors: WV850, 850-hPa horizontal wind speed: WS850, 2-m temperature: Tsfc), the ETC frequency, and intense ETC frequency were averaged for the selected three composite years. We checked the differences of meteorological patterns with the five samples (i.e., the top(bottom) five years having both high(low) SHI and high(low) SHPI values) and performed the Student’s t-test. However, the difference of those patterns was not substantial as much as for the three samples; we decided to show the composite differences with three samples.
To better understand the dust incursion process into South Korea, we also performed a case study by selecting twelve days when high dust events occurred over the combined R1 and R2 region. We analyzed the composite difference in meteorological patterns and counts of dust-observing SYNOP for three consecutive days (Day + 1, Day + 2, Day + 3) after the start of dust emission day (Day + 0) between the Strong–East and Weak-West periods. We selected twelve days of high dust days for each Strong–East and Weak-West period (Table S4). Then we averaged twelve cases of meteorological variables and counts of SYNOP for each Day + n.
We performed the data analysis in March, 2000–2017, for the two reasons: (1) March is the month when the SH pressure weakens and fluctuations in location and intensity are greater than in other seasons in northeast Asia. (2) March is the beginning of spring dust events in South Korea, and the importance of dust prediction increases. In general, the impact of spring dust is more frequent and intense in April than in March, particularly in the downwind region [1,77]. However, we excluded data in April from the analysis to avoid discontinuity of the SHPI values during this month.

3. Results and Discussion

We examine the general synoptic meteorological characteristics of the SHI and SHPI. Then, we demonstrate a possible physical mechanism to explain differences in the DOF, DEF, ETC frequency, and intense ETC frequency associated with synoptic meteorological characteristics over the dust source regions and South Korea. Lastly, we show a case study to investigate the effects of the intensity and location of the SH on dust incursion into South Korea. Note that in this section, “dust source region” refers to R1 and R2.

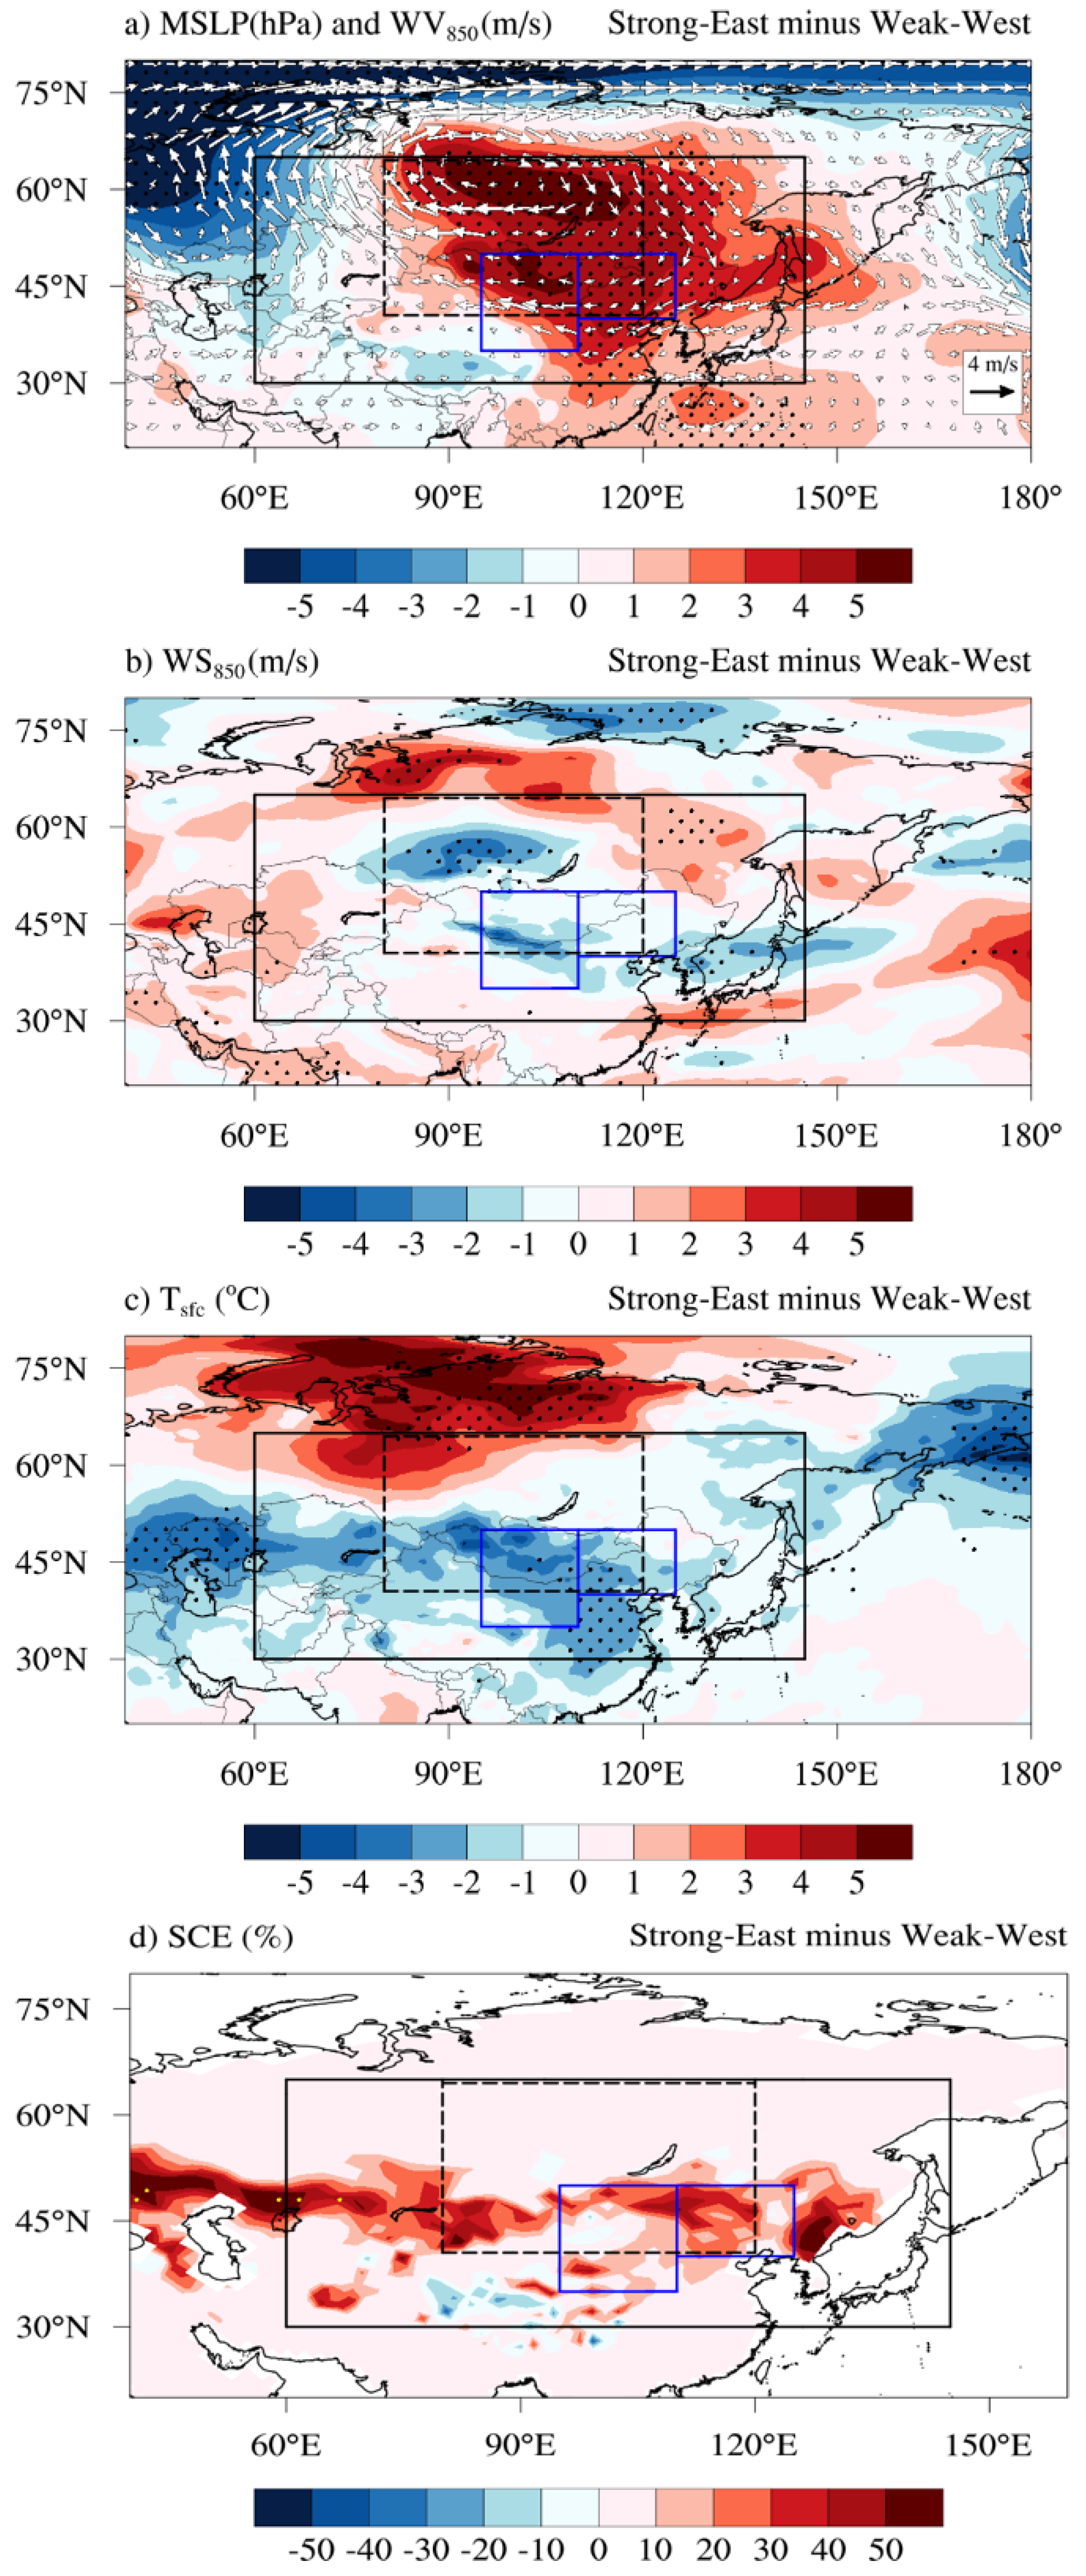
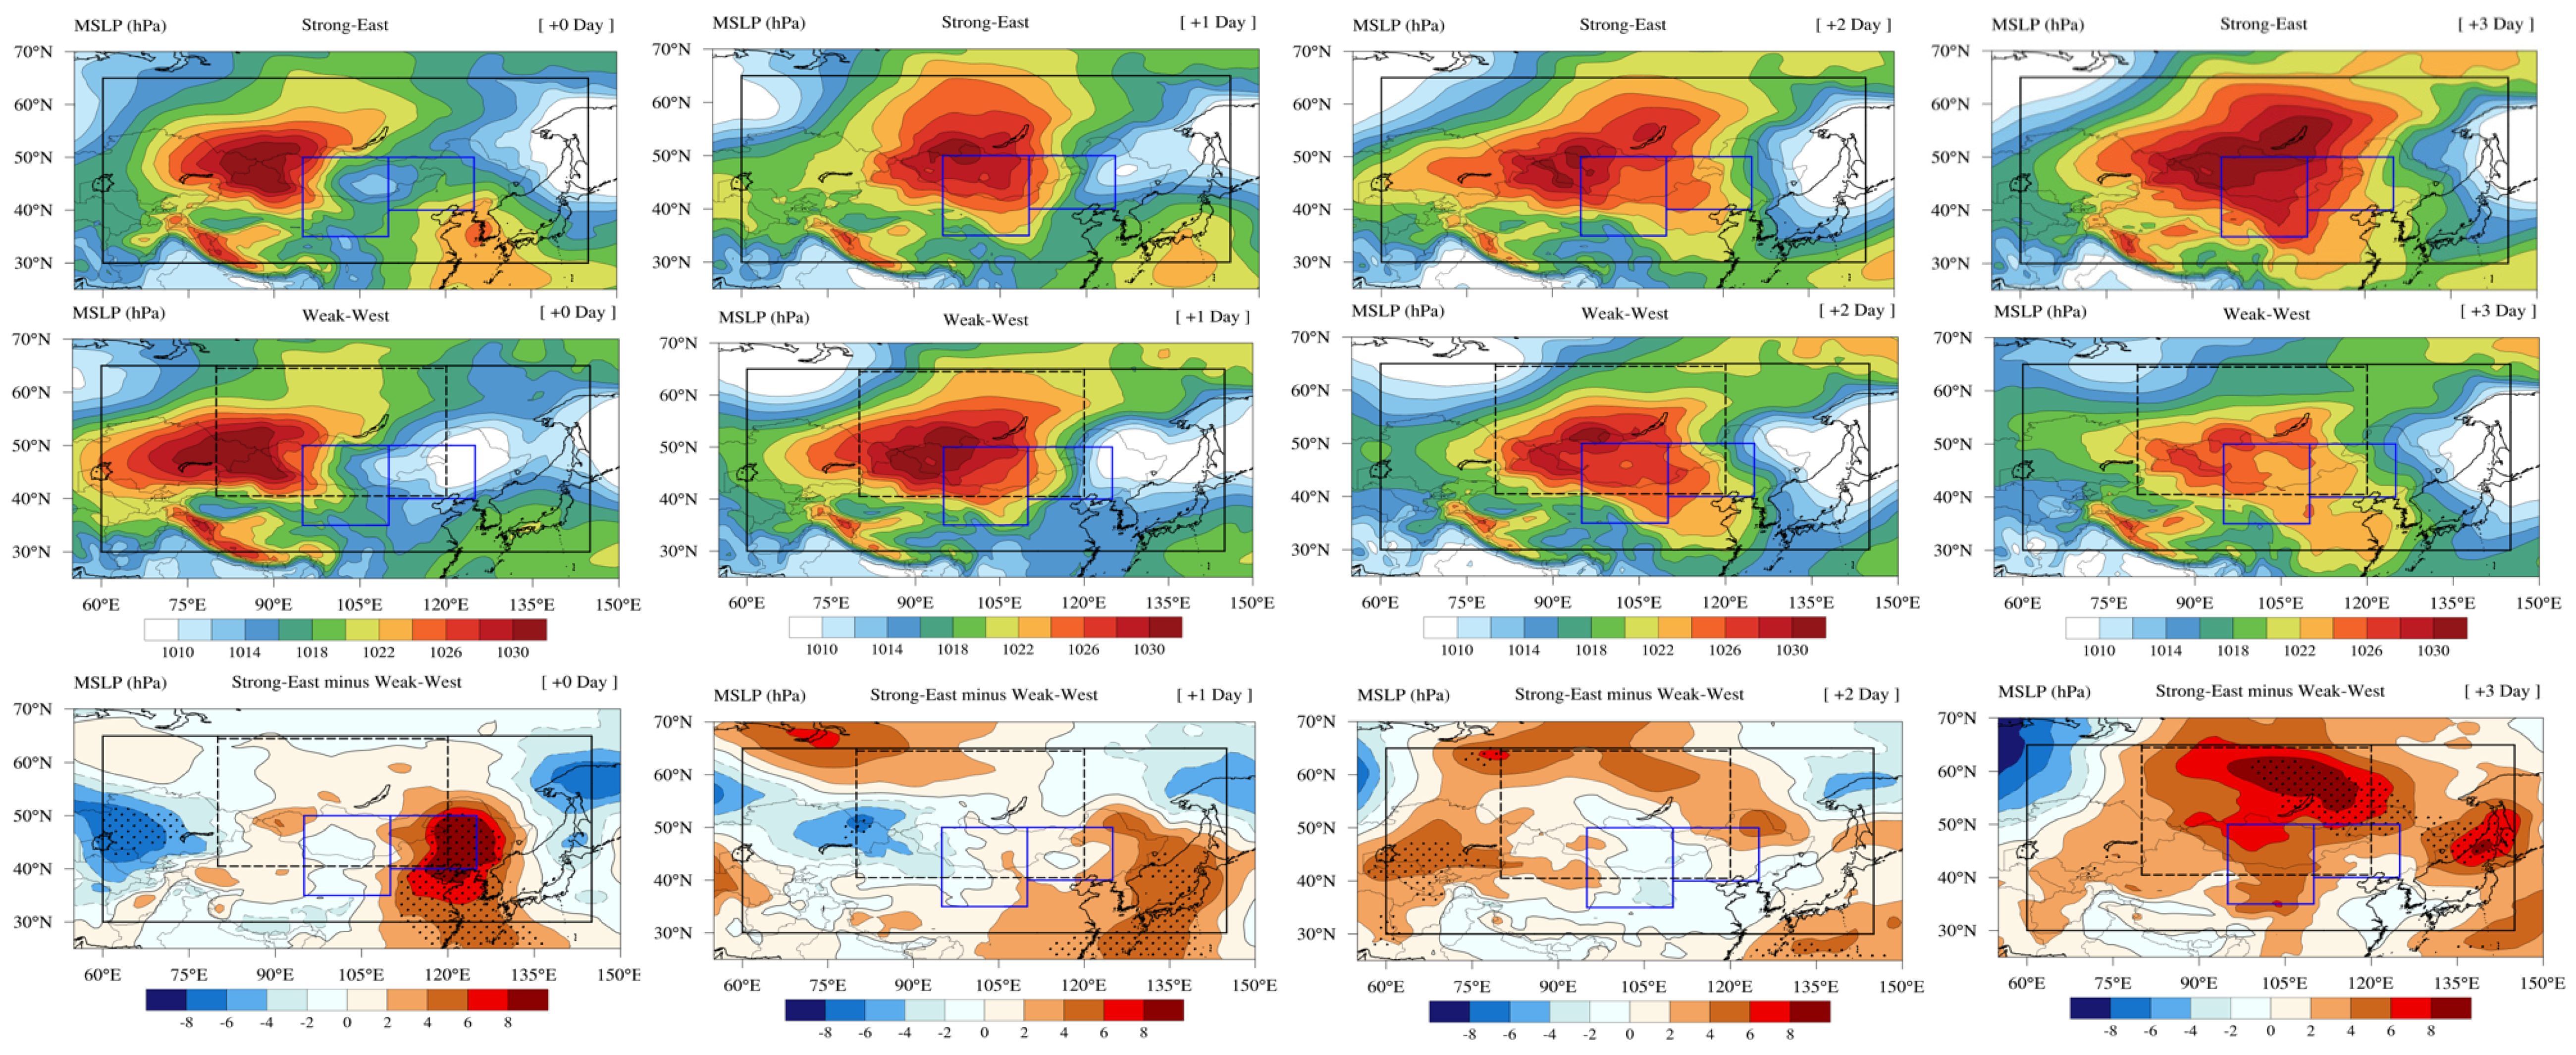
3.1. Synoptic Meteorological Characteristics of the SHI and SHPI

To understand the climatological pressure and wind patterns in March, we present the 18-year average of MSLP and wind fields (WV850, WS850) and for the composite periods (i.e., Strong-East and Weak-West) (Figure 4). The averaged MSLP and wind patterns over the 18-year period showed a strong anticyclone and strong westerlies over the Asian continent (60°–120° E). Strong northwesterly winds flowed from region R2 to the Korean Peninsula (Figure 4a). The area with pressure exceeding 1022 hPa in the study domain showed a distinct difference between the Strong-East period and West-Weak period (Figure 4b,c). The overall features of the MSLP and 850-hPa wind patterns for the Weak-West period occupied a smaller area or had weaker intensities than for the Strong-East period. For instance, compared to the 18-year meteorological patterns, the area affected by high MSLP (>1022 hPa) for the Strong-East period occupied over the full width of the SHPI calculation domain (Figure 4b). In contrast, in the Weak-West period, it was narrower in both latitude and longitudinal directions, and only the western edge of R1 was covered by strong high pressure. Compared to the Weak-West period, wind vectors flowing over the eastern edge of the high pressure (1022 hPa isobar) during the Strong-East period were stronger and moved northward (Figure 4b,c).
There are apparent differences in SHI and SHPI between the Strong-East and Weak-West periods. In the Strong-East period, the maximum value of the SHI was greater than 1027 hPa, locating within the range 45°–52.5° N and 85°–98° E. The averaged SHPI was 99.1° E, shifted approximately 10° eastward of the 18-year climatological SHPI (90.46° E). The SHI was higher than 1020 hPa over a wide area of southern China where the dust source and downwind regions are situated, and this pattern extended farther north and east in the 18-year climatology. In the Weak-West period, the average SHPI was 79.6° E, approximately 10° westward compared to Figure 4a. Areas affected by a SHI greater than 1020 hPa occupied a smaller region than the SHI calculation domain. In the Weak-West period, the SHI in the dust source region decreased, but westerly winds blew over a greater area compared to the climatology and the Strong-East period.
Overall, the synoptic meteorological patterns for the Strong-East (Weak-West) cases were a mix of the features of the Strong (Weak) SHI (i.e., SHI-only) and East (West) SHPI (i.e., SHPI-only) (Table S2, Figure S1). Synoptic meteorological patterns during the study period showed similar features as those of the winter SH. Generally, there is a high pressure system characterized by the north–south pressure gradients and prevailing northwesterly winds over 40–60° N in the central Asian continent [55,65].

3.2. Effects of the SHI and SHPI on Dust Emission in the Source Region

In the Strong-East period, both dust emission and the incursion into South Korea were reduced compared to the Weak-West period (Table 1). Although the composite differences of the DOF and DEF between the Strong-East and Weak-West periods did not appear considerable, results show a possibility that a strong and eastward shifted SH may reduce dust frequency over the dust source region and South Korea. Overall, the synoptic meteorological variables shown in Figure 5 for the SHI and SHPI combined had a weaker magnitude and showed a more central location of the SH pressure compared with the SHI-only and SHPI-only cases (Figure S1). This may cause the small reduction in u for the Strong-East period compared to the East-SHPI period (Figure 6c, Figure S3c). Since there was a clear significant difference in MSLP between the Strong-East and Weak-West periods (Figure 4b,c), this may lead to changes in synoptic meteorological patterns. Consequently, DOFs for the East-SHPI and Strong-SHI periods may be smaller than that for the Weak-SHPI and Weak-SHI periods (Table S3).
To investigate the possible physical impact of the SH characteristics on the DOF, we analyzed composite differences of synoptic meteorological patterns. The results showed that during the Strong-East period, the significant anomalously high MSLP resulted in cold air incursions from high latitudes (>60° N) to the dust source region locating around 45° N (Figure 5a). A strong pressure gradient induced prevailing northwesterly winds mainly in western China. Although the magnitude of WS850 over the source region was smaller than 2 m s−1, the overall anomalous prevailing winds were easterlies (Figure 5a). This implies that the dust-laden airmass had less chance of being transported to South Korea due to weakened westerlies. In contrast to the strong anomalous easterly winds in R1, there were relatively weaker easterlies in R2 and stronger anomalous southeasterly wind patterns (Figure 5a,b). In the Strong-East period, wind speeds in both the lower atmosphere (Figure 5b) and the near-surface (Figure S2) were reduced by approximately 2.5 m s−1, mostly in R1. Previous studies have suggested that low wind velocities near the surface and in the lower atmosphere generated a unfavorable condition for dust updrift in the dust source regions [39,40,44]. Weakened westerlies accompanied by air in the Strong-East period may generate less favorable conditions for bringing dust aerosols up to the lower atmosphere. Consequently, dust incursion into South Korea may be reduced. A similar mechanism was reported by Kusaki and Mikami [40]. They found that dust frequency and strong wind speeds (>6.5 m s−1) showed a strong positive correlation. Although the wind speed decrease found here was smaller than in the previous study, our result nevertheless shows that decreased DOF may be associated with changes in wind speed.
We also found that an anomalously high MSLP reduced the surface temperature by 3–4 °C in the dust source region, particularly in the south of R2 (Figure 5c). Temperatures at the surface and in the lower atmosphere in R1 and R2 were lower than in the north of the Korean Peninsula (>42° N). In addition, SCE remained above 30% in the source region (mostly in R2) (Figure 5d). This means that cooler surface temperatures may keep snow on the ground for a longer time period or generate good conditions for snowfall in the dust source regions. Zou [78] reported that a decrease of surface temperature in the dust source areas resulted in more snow cover on the surface, leading to much lower dust frequency in eastern China.

3.3. Effects of the SH Variations on Dust Incursion into South Korea

Similarly to the DOF, the composite mean in DEF showed that dust incursion into South Korea was reduced in the Strong-East period (Table 1). Anomalous high pressure and easterly anomalies in South Korea were very weak, and a reduction in WS850 was prominent (Figure 5a,b). Weaker wind speeds in the lower atmosphere (WS850) contrasted with stronger wind speeds near the surface (WS10) (Figure 5b, Figure S2). The decreases in both MSLP and westerlies were statistically significant over the northern part of the Korean Peninsula; thus, they are likely responsible for the smaller transport of dust aerosols to South Korea, as indicated by the decreased DEF. This may be related to the relatively weaker impact of wind speed reduction on the DEF compared to the DOF in the Strong-East period. The difference in the DEF for the SHI-only case was greater than the SHPI-only case (Table S3). WS850 was reduced considerably for the SHPI-only case, particularly over the Korean Peninsula (Figure S1). However, the decrease in WS10 was relatively small in South Korea for both SHI-only and SHPI-only cases (Figure S2). We also found that the DEF had low correlation coefficients (r in the range of −0.38–−0.36) with the SHI and SHPI (Figure 3). Since the DEF was defined for South Korea only, the discrepancy between the DEF and wind patterns associated with the SH variations may be better identified using the column-based dust aerosol and another type of reanalysis data [63,77].

3.4. Possible Effects of Cyclones on Dust Activity

We investigated the differences in the ETC frequency and intense ETC frequency over the dust source regions and the ETC passage domain (red box in Figure 1). In both dust source regions and the ETC passage domain, the ETC frequency and intense ETC frequency were higher for the Weak-West period than for the Strong-East period (Table 2 and Table 3). During the Strong-East period, there were 14 fewer ETC cyclones and 10 fewer intense ETC cyclones in the dust source region than for the Weak-West period. This implies that during the Strong-East period, it is likely that cyclone development was suppressed compared with the West-Weak period in both the dust source regions and the ETC passage domain. Although the differences in the ETC frequency and intense ETC frequency in the ETC passage domain between the Strong-East period and Weak-West period were minor, it reflects that the ETC activity in both dust source and receptor areas can be connected.
Spring dust events observed in the Korean Peninsula were affected by the characteristics of the ETCs (e.g., frequency, intensity, direction, lifetime, etc.) [49]. This study [49] showed that the characteristics of the ETCs affecting springtime dust events in Korea are generated in the Altai-Sayan mountain region located at the border of Mongolia, Russia, and Kazakhstan. The ETCs passed through northeast Asia from the dust source regions via the northwestern Korean Peninsula. As we have shown in Figure 4 and Table 1, anomalously high pressure systems generated stagnant air in R1, R2, and South Korea, and this may be linked with the inhibition of cyclogenesis in springtime for the strong and eastward shifted SH (Table 2 and Table 3).
Strong cyclones associated with cold fronts are responsible for dust weather in spring. An increase of near-surface wind speed in northern China triggers spring dust storms in arid regions, especially when the cold fronts of cyclones pass over. Thus, dust aerosols are more effectively lifted and transported to downwind countries with cyclones and westerly jets [73,79,80]. Therefore, it is likely that the less frequent dust activity for the Strong-East period is associated with the decrease in the cyclone activity (e.g., ETC frequency and intense ETC frequency).

3.5. Case Study

Dust events in South Korea are generally affected by synoptic meteorological conditions in the dust source regions 2–3 days before the dust incursion into South Korea [1,81]. Thus, we selected 12 days of high dust episodes in R1 and R2 regions to examine dust incursion into South Korea after dust emission (Table S4). Consistent with the synoptic meteorological patterns shown in Figure 4, both dust emission and transport decreased during the Strong-East period compared to the Weak-West period (Figure 7 and Figure 8). During Day + 0 of the Weak-West period, R1 was centered between high and low pressure systems, and this feature remained until the next day (Figure 7). The size and shape of the SH systems were generally similar on Day + 1. As the strong SH system moved eastward, the area affected by high pressure stretched over the Yellow Sea on Day + 2. Strong pressure gradients nearby if 100° E indicated a cold front that affected the Korean Peninsula mainly on Day + 1 and Day + 2, then it passed over Japan on Day + 3. At the 850-hPa, where dust transport is taking place in general, we confirmed that strong low pressure and anomalous easterly wind patterns were found over the boundary of R2 and South Korea for the Strong-East periods (Figure 8). These synoptic meteorological features reveal that anomalous high pressure caused air stagnation so that less dust aerosols were transported to South Korea, similar to the climatological synoptic composite patterns (Figure 4, Figure 5 and Figure 6). Overall, this feature agreed fairly well with the decrease of number of the SYNOP having dust weathers in the Strong-East period (Figure 9). During the Strong-East period, we found a distinct reduction of station numbers observing dust in both the dust source regions and South Korea compared to the Weak-West period.
In addition, we found similar features of differences in MSLP, Z850, wind patterns for the SHI-only and SHPI-only years (Figures S4–S7). Additionally, the counts of SYNOP that observed dust for the SHI-only and SHPI-only groups (Figure S8) were consistent with Figure 9. This implies that a strong and farther east SH pressure system suppresses dust activity in both the source region and South Korea (Figures S4 and S5 and Figure 7 and Figure 8). Weakened westerlies reduce airflow to the eastern boundary of the SH, which is likely to affect dust transport from the source regions to South Korea. Park et al. [82] found a longer duration of dust events over northeast China because of the strong SH system and strong pressure gradients between the eastward moving low pressure system and the winter SH pressure. This implies that the DOF can be increased when the SH system weakens and low pressure systems containing dust aerosols in the dust source regions slowly pass over the Korean Peninsula. Our findings from the case study and cyclone frequency support a possible mechanism of dust transport to the downwind area: A stronger intensity of the SH and farther eastward of the SH may reduce a speed of airflow incursion into South Korea. These synoptic meteorological conditions may affect to the weakened developments of cyclone frequency in the ETC domain (Table 3).
Dust aerosols over northeast Asia are generally observed between 1 and 3 km [83]. This height fluctuates, which means that dust aerosols travel above the boundary layer [83,84]. This suggests that deposition or sinking of dust aerosols to the surface may be affected by the atmospheric stability or synoptic meteorological conditions during the transport process. To confirm this hypothesis, one can analyze the high-resolution of the satellite-retrieved vertical distribution of dust aerosol products (e.g., aerosol optical depth or aerosol index) for the different SH characteristics and investigate the dust incursion process into South Korea.

4. Summary and Conclusions

We investigated the physical mechanisms of dust emission and transport processes for the different SH conditions at the start of the dust season in northeast Asia. Using the surface observations and a reanalysis dataset, we found a strong and eastward shifted SH suppressed both dust emission in the source regions and transport to South Korea. During the Strong-East period, an anomalously high anticyclonic circulation led to a cool surface and smaller north–south thermal gradient. Therefore, the thermal wind decreased, resulting in air stagnation and consequently less effective dust emission. Stable atmospheric conditions are likely to reduce cyclone development in both dust source and the downwind area. Since the SH’s core was mostly situated in the dust source area during our study period, the effects of the SHI on dust transport to the downwind area appears to be more discernible than those of the SHPI.
A case study also revealed that suppressed dust incursion into South Korea can be explained by the characteristics of the Strong-East SH. Surface temperatures decreased due to the enhanced surface pressure. Strong anomalous easterlies in the source region and downwind area imply that during the Strong-East case, westerlies in the dust source region and South Korea become weaker than during the Weak-West case. Overall, synoptic weather patterns in the Strong-East case seem to produce stable air conditions that are unfavorable conditions for cyclone development.
Our study provides observational evidence that the early spring dust emission and incursion into a downwind country is less effective when the SH system is strong and extends farther eastward. Our findings imply that dust activity in early springtime can be explained by both the intensity and position of the SH, but that the SHI is a better index than the SHPI for diagnosing dust emission and dust transport. To obtain robust results, the next step should be to compare results with other types of reanalysis datasets. We also suggest that a further investigation of the vertical distribution of dust aerosols over the downwind country for the Strong-East and Weak-West periods would be helpful to elucidate how much dust sinks to the ground and how much remains in the mid-troposphere. The result of our study provides useful information on dust emission and transport for the seasonal transition period when the SH is highly variable and the weather/climate conditions are anomalously cold with weakened westerlies. Moreover, the SHI and SHPI can be utilized to examine the characteristics of migrating air pollutants from emission source regions to the receptor regions in northeast Asia.

Supplementary Materials

The following are available online at https://www.mdpi.com/2073-4433/12/2/176/s1: Figure S1: As in Figure 5 but for composite differences in meteorological fields for the SHI-only (Strong-SHI minus Weak-SHI, left panels) and SHPI-only (East-SHPI minus West-SHPI, right panels) periods for March, 2000–2017. Note that the left and right panels have the same numberings. Figure S2: Composite differences in wind speed at 10 m (WS10) between the Strong-East and Weak-West period for March, 2000–2017. Figure S3: Left panels show latitude–height cross sections of composite differences in (a) geopotential height (Z; m), (b) temperature (T; °C), and (c) zonal wind velocity (u; m s–1) between Strong-SHI and Weak-SHI periods, averaged over 95–125° E, the longitude range of R1 and R2. Similarly, right panels show composite differences between East-SHPI and West-SHPI periods. Negative values are shown by dashed lines. Note that the left and right panels have the same numberings. Figure S4: Same as Figure 7 but for the SHI-only group (Strong-SHI and Weak-SHI). Figure S5: Same as Figure 7 but for the SHPI-only group (East-SHPI and West-SHPI). Figure S6: Same as Figure 8 but for the SHI-only group (East-SHI and West-SHI). Figure S7: Same as Figure 8 but for the SHPI-only group (East-SHPI and West-SHPI). Figure S8: Same as Figure 9 but for the SHI-only group (a and b) in the upper panels and SHPI-only group (c and d) in the lower panels. Table S1: Years ranked by values of the Siberian High Intensity (SHI) and Siberian High Position Index (SHPI) in March 2000–2017. Years shown in bold were selected for composite difference analysis. Table S2: Years selected for the composite analysis based on Table S1. Table S3: Same as Table 1 but for the (a) SHI-only and (b) SHPI-only periods. Table S4: A list of high dust emission dates (YYYY.DD.MM) in the dust source region during the Strong-East and Weak-West periods. We selected 12 days over the combined R1 and R2 region.

Author Contributions

Conceptualization, Y.G.L. and J.-A.C.; methodology: J.-A.C., Y.G.L., and S.-B.P.; software: S.-B.P. and J.-A.C.; validation: S.-B.P., J.-A.C., and Y.G.L.; formal analysis: J.-A.C.; investigation: S.-B.P. and J.-A.C.; data curation: S.-B.P. and J.-A.C.; writing—original draft preparation: S.-B.P. and J.-A.C.; writing—review and editing: S.-B.P., S.S.P., J.-H.K., and Y.G.L.; visualization: J.-A.C. and S.-B.P.; supervision: Y.G.L.; project administration: Y.G.L.; funding acquisition: Y.G.L. All authors have read and agreed to the published version of the manuscript.

Funding

This research was funded by the grant (NRF-2018R1C1B6008223) from the National Research Foundation of Korea (NRF).

Institutional Review Board Statement

Not applicable.

Informed Consent Statement

Not applicable.

Data Availability Statement

The data presented in this study are openly available as cited in the reference. ERA-Interim data can be found here; [https://apps.ecmwf.int/datasets/data/interim-full-daily/levtype=sfc/].

Conflicts of Interest

The authors declare no conflict of interest.

References

  1. Chun, Y.; Boo, K.O.; Kim, J.; Park, S.U.; Lee, M. Synopsis, transport, and physical characteristics of Asian dust in Korea. J. Geophys. Res. Atmos. 2001, 106, 18461–18469. [Google Scholar] [CrossRef] [Green Version]
  2. Zhang, W.; Cui, Y.; Wang, J.; Wang, C.; Streets, D.G. How does urbanization affect CO2 emissions of central heating systems in China? An assessment of natural gas transition policy based on nighttime light data. J. Clean. Prod. 2020, 276, 123188. [Google Scholar] [CrossRef]
  3. Zhang, W.; Jiang, L.; Cui, Y.; Xu, Y.; Wang, C.; Yu, J.; Streets, D.G.; Lin, B. Effects of urbanization on airport CO2 emissions: A geographically weighted approach using nighttime light data in China. Resour. Conserv. Recycl. 2019, 150, 104454. [Google Scholar] [CrossRef]
  4. Gao, T.; Han, J.; Wang, Y.; Pei, H.; Lu, S. Impacts of climate abnormality on remarkable dust storm increase of the Hunshdak Sandy Lands in northern China during 2001–2008. Meteorol. Appl. 2012, 19, 265–278. [Google Scholar] [CrossRef]
  5. Chun, Y.; Cho, H.-K.; Chung, H.-S.; Lee, M. Historical records of Asian dust events (Hwangsa) in Korea. Bull. Am. Meteorol. Soc. 2008, 89, 823–828. [Google Scholar] [CrossRef]
  6. Uno, I.; Carmichael, G.R.; Streets, D.G.; Tang, Y.; Yienger, J.J.; Satake, S.; Wang, Z.; Woo, J.H.; Guttikunda, S.; Uematsu, M.; et al. Regional chemical weather forecasting system CFORS: Model descriptions and analysis of surface observations at Japanese island stations during the ACE-Asia experiment. J. Geophys. Res. Atmos. 2003, 108. [Google Scholar] [CrossRef]
  7. Qian, W.; Tang, X.; Quan, L. Regional characteristics of dust storms in China. Atmos. Environ. 2004, 38, 4895–4907. [Google Scholar] [CrossRef]
  8. Sun, J.; Zhang, M.; Liu, T. Spatial and temporal characteristics of dust storms in China and its surrounding regions, 1960–1999: Relations to source area and climate. J. Geophys. Res. Atmos. 2001, 106, 10325–10333. [Google Scholar] [CrossRef]
  9. Shao, Y.; Wang, J. A climatology of Northeast Asian dust events. Meteorol. Z. 2003, 12, 187–196. [Google Scholar] [CrossRef] [Green Version]
  10. Hu, Z.; Huang, J.; Zhao, C.; Bi, J.; Jin, Q.; Qian, Y.; Leung, L.R.; Feng, T.; Chen, S.; Ma, J. Modeling the contributions of Northern Hemisphere dust sources to dust outflow from East Asia. Atmos. Environ. 2019, 202, 234–243. [Google Scholar] [CrossRef]
  11. Hu, Z.; Huang, J.; Zhao, C.; Ma, Y.; Jin, Q.; Qian, Y.; Leung, L.R.; Bi, J.; Ma, J. Trans-Pacific transport and evolution of aerosols: Spatiotemporal characteristics and source contributions. Atmos. Chem. Phys. Discuss. 2019, 19, 12709–12730. [Google Scholar] [CrossRef] [Green Version]
  12. Wilson, W.E.; Suh, H.H. Fine particles and coarse particles: Concentration relationships relevant to epidemiologic studies. J. Air Waste Manag. Assoc. 1997, 47, 1238–1249. [Google Scholar] [CrossRef] [Green Version]
  13. Brunekreef, B.; Forsberg, B. Epidemiological evidence of effects of coarse airborne particles on health. Eur. Respir. J. 2005, 26, 309–318. [Google Scholar] [CrossRef] [PubMed]
  14. Cho, C.; Park, G.; Kim, B. An effectiveness of simultaneous measurement of PM10, PM2.5, and PM1.0 concentrations in Asian dust and haze monitoring. J. Environ. Sci. Int. 2013, 22, 651–666. [Google Scholar] [CrossRef] [Green Version]
  15. Kim, H.-S.; Chung, Y.-S.; Yoon, M.-B. An analysis on the impact of large-scale transports of dust pollution on air quality in East Asia as observed in central Korea in 2014. Air Qual. Atmos. Health 2016, 9, 83–93. [Google Scholar] [CrossRef]
  16. Littmann, T. Dust storm frequency in Asia: Climatic control and variability. Int. J. Climatol. 1991, 11, 393–412. [Google Scholar] [CrossRef]
  17. Zhang, X.Y.; Gong, S.L.; Zhao, T.L.; Arimoto, R.; Wang, Y.Q.; Zhou, Z.J. Sources of Asian dust and role of climate change versus desertification in Asian dust emission. Geophys. Res. Lett. 2003, 30, 6–9. [Google Scholar] [CrossRef] [Green Version]
  18. Lee, S.; Ho, C.-H.; Choi, Y.-S. High-PM10 concentration episodes in Seoul, Korea: Background sources and related meteorological conditions. Atmos. Environ. 2011, 45, 7240–7247. [Google Scholar] [CrossRef]
  19. Tsedendamba, P.; Dulam, J.; Baba, K.; Hagiwara, K.; Noda, J.; Kawai, K.; Sumiya, G.; McCarthy, C.; Kai, K.; Hoshino, B. Northeast Asian dust transport: A case study of a dust storm event from 28 March to 2 April 2012. Atmosphere 2019, 10, 69. [Google Scholar] [CrossRef] [Green Version]
  20. Ha, R.; Baatar, A.; Yu, Y. Identification of atmospheric transport and dispersion of Asian dust storms. Nat. Hazards Earth Syst. Sci. 2017, 17, 1425–1435. [Google Scholar] [CrossRef] [Green Version]
  21. Choi, J.-W.; Cha, Y.; Lim, B.; Park, C.-H. Synoptic climatological characteristics of the Asian dust frequency in Seoul during spring. J. Clim. Res. 2016, 11, 1–13. [Google Scholar] [CrossRef]
  22. Zhang, X.-X.; Sharratt, B.; Liu, L.-Y.; Wang, Z.-F.; Pan, X.-L.; Lei, J.-Q.; Wu, S.-X.; Huang, S.-Y.; Guo, Y.-H.; Li, J.; et al. East Asian dust storm in May 2017: Observations, modelling and its influence on Asia-Pacific region. Atmos. Chem. Phys. Discuss. 2018, 1–31. [Google Scholar] [CrossRef] [Green Version]
  23. Majbauddin, A.; Onishi, K.; Otani, S.; Kurosaki, Y.; Kurozawa, Y. Association between Asian Dust-borne air pollutants and daily symptoms on healthy subjects: A web-based pilot study in Yonago, Japan. J. Environ. Public Health 2016, 2016, 8280423. [Google Scholar] [CrossRef] [PubMed]
  24. Kang, D.; Kim, J.E. Fine, ultrafine, and yellow dust: Emerging health problems in Korea. J. Korean Med. Sci. 2014, 29, 621–622. [Google Scholar] [CrossRef] [Green Version]
  25. Hashizume, M.; Kim, Y.; Ng, C.F.S.; Chung, Y.; Madaniyazi, L.; Bell, M.L.; Guo, Y.L.; Kan, H.; Honda, Y.; Yi, S.M.; et al. Health effects of Asian dust: A systematic review and meta-analysis. Environ. Health Perspect. 2020, 128, 1–24. [Google Scholar] [CrossRef]
  26. Jeong, D.-Y. Socio-economic costs from Yellow Dust damages in South Korea. Korean Soc. Sci. J. 2008, XXXV, 1–29. [Google Scholar]
  27. Middleton, N.J. Desert dust hazards: A global review. Aeolian Res. 2017, 24, 53–63. [Google Scholar] [CrossRef]
  28. Shao, Y.; Dong, C.H. A review on East Asian dust storm climate, modelling and monitoring. Glob. Planet. Chang. 2006, 52, 1–22. [Google Scholar] [CrossRef]
  29. Wang, X.; Dong, Z.; Zhang, J.; Liu, L. Modern dust storms in China: An overview. J. Arid Environ. 2004, 58, 559–574. [Google Scholar] [CrossRef]
  30. Kim, S.W.; Yoon, S.C.; Kim, J.; Kang, J.Y.; Sugimoto, N. Asian dust event observed in Seoul, Korea, during 29–31 May 2008: Analysis of transport and vertical distribution of dust particles from lidar and surface measurements. Sci. Total Environ. 2010, 408, 1707–1718. [Google Scholar] [CrossRef]
  31. Zhao, C.; Dabu, X.; Li, Y. Relationship between climatic factors and dust storm frequency in Inner Mongolia of China. Geophys. Res. Lett. 2004, 31. [Google Scholar] [CrossRef]
  32. Mao, R.; Ho, C.H.; Shao, Y.; Gong, D.Y.; Kim, J. Influence of Arctic Oscillation on dust activity over northeast Asia. Atmos. Environ. 2011, 45, 326–337. [Google Scholar] [CrossRef]
  33. Mao, R.; Gong, D.; Bao, J.; Fan, Y. Possible influence of Arctic Oscillation on dust storm frequency in North China. J. Geogr. Sci. 2011, 21, 207–218. [Google Scholar] [CrossRef]
  34. Lee, Y.G.; Kim, J.; Ho, C.H.; An, S.I.; Cho, H.K.; Mao, R.; Tian, B.; Wu, D.; Lee, J.N.; Kalashnikova, O.; et al. The effects of ENSO under negative AO phase on spring dust activity over northern China: An observational investigation. Int. J. Climatol. 2015, 35, 935–947. [Google Scholar] [CrossRef]
  35. Gao, H.; Washington, R. Arctic oscillation and the interannual variability of dust emissions from the Tarim Basin: A TOMS AI based study. Clim. Dyn. 2010, 35, 511–522. [Google Scholar] [CrossRef]
  36. Zhou, Y.; Zhao, Y.; Huang, A.; Zhu, X.; Huang, Y. The impact of the winter North Atlantic Oscillation on the frequency of spring dust storms over Tarim Basin in northwest China in the past half-century. Environ. Res. Lett. 2013, 8. [Google Scholar] [CrossRef] [Green Version]
  37. Fan, K.; Wang, H. Antarctic oscillation and the dust weather frequency in North China. Geophys. Res. Lett. 2004, 31, 3–6. [Google Scholar] [CrossRef] [Green Version]
  38. Hara, Y.; Uno, I.; Wang, Z. Long-term variation of Asian dust and related climate factors. Atmos. Environ. 2006, 40, 6730–6740. [Google Scholar] [CrossRef]
  39. Kurosaki, Y.; Mikami, M. Threshold wind speed for dust emission in east Asia and its seasonal variations. J. Geophys. Res. Atmos. 2007, 112, 1–13. [Google Scholar] [CrossRef]
  40. Kurosaki, Y.; Mikami, M. Recent frequent dust events and their relation to surface wind in East Asia. Geophys. Res. Lett. 2003, 30, 14–17. [Google Scholar] [CrossRef]
  41. Lee, J.-J.; Kim, C.-H. Characteristics of recent occurrence frequency of Asian dust over the source regions—Analysis of the dust occurrences since 2002. Atmosphere 2008, 18, 493–506. [Google Scholar]
  42. Guan, Q.; Sun, X.; Yang, J.; Pan, B.; Zhao, S.; Wang, L. Dust Storms in Northern China: Long-Term Spatiotemporal Characteristics and Climate Controls. J. Clim. 2017, 30, 6683–6700. [Google Scholar] [CrossRef]
  43. Qian, W.; Quan, L.; Shi, S. Variations of the dust storm in China and its climatic control. J. Clim. 2002, 15, 1216–1229. [Google Scholar] [CrossRef]
  44. Liu, X.D.; Yin, Z.Y.; Zhang, X.Y.; Yang, X.C. Analyses of the spring dust storm frequency of northern China in relation to antecedent and concurrent wind, precipitation, vegetation, and soil moisture conditions. J. Geophys. Res. Atmos. 2004, 109. [Google Scholar] [CrossRef]
  45. Ding, R.; Li, J.; Wang, S.; Ren, F. Decadal change of the spring dust storm in northwest China and the associated atmospheric circulation. Geophys. Res. Lett. 2005, 32, 1–4. [Google Scholar] [CrossRef] [Green Version]
  46. Lee, Y.G.; Ho, C.H.; Kim, J.; Kim, J. Potential impacts of northeastern Eurasian snow cover on generation of dust storms in northwestern China during spring. Clim. Dyn. 2013, 41, 721–733. [Google Scholar] [CrossRef]
  47. Liu, J.; Wu, D.; Liu, G.; Mao, R.; Chen, S.; Ji, M.; Fu, P.; Sun, Y.; Pan, X.; Jin, H.; et al. Impact of Arctic amplification on declining spring dust events in East Asia. Clim. Dyn. 2020, 54, 1913–1935. [Google Scholar] [CrossRef] [Green Version]
  48. Wang, X.; Hasi, E.; Zhou, Z.; Liu, X. Significance of variations in the wind energy environment over the past 50 years with respect to dune activity and desertification in arid and semiarid northern China. Geomorphology 2007, 86, 252–266. [Google Scholar] [CrossRef]
  49. Lee, J.; Kim, J.; Son, S.-W. Climatic features of extratropical cyclones during the spring-time Yellow dust events in Korea. Atmosphere 2016, 26, 565–576. [Google Scholar] [CrossRef] [Green Version]
  50. Kim, S.-W.; Yoon, S.-C.; Kim, J.; Kim, S.-Y. Seasonal and monthly variations of columnar aerosol optical properties over east Asia determined from multi-year MODIS, LIDAR, and AERONET Sun/sky radiometer measurements. Atmos. Environ. 2007, 41, 1634–1651. [Google Scholar] [CrossRef]
  51. Wang, W.; Fang, Z. Numerical simulation and synoptic analysis of dust emission and transport in East Asia. Glob. Planet. Chang. 2006, 52, 57–70. [Google Scholar] [CrossRef]
  52. Tsai, F.; Chen, G.T.J.; Liu, T.H.; Lin, W.D.; Tu, J.Y. Characterizing the transport pathways of Asian dust. J. Geophys. Res. Atmos. 2008, 113, 1–15. [Google Scholar] [CrossRef] [Green Version]
  53. Lee, Y.G.; Ho, C.H.; Kim, J.H.; Kim, J. Quiescence of Asian dust events in South Korea and Japan during 2012 spring: Dust outbreaks and transports. Atmos. Environ. 2015, 114, 92–101. [Google Scholar] [CrossRef]
  54. Cohen, J.; Saito, K.; Entekhabi, D. The role of the Siberian High in Northern Hemisphere climate variability. Geophys. Res. Lett. 2001, 28, 299–302. [Google Scholar] [CrossRef] [Green Version]
  55. Jeong, J.H.; Ou, T.; Linderholm, H.W.; Kim, B.M.; Kim, S.J.; Kug, J.S.; Chen, D. Recent recovery of the Siberian High intensity. J. Geophys. Res. Atmos. 2011, 116, 1–9. [Google Scholar] [CrossRef] [Green Version]
  56. Tubi, A.; Dayan, U. The Siberian High: Teleconnections, extremes and association with the Icelandic Low. Int. J. Climatol. 2013, 33, 1357–1366. [Google Scholar] [CrossRef]
  57. Wu, B.; Wang, J. Winter Arctic Oscillation, Siberian High and East Asian Winter Monsoon. Geophys. Res. Lett. 2002, 29, 3–6. [Google Scholar] [CrossRef]
  58. Ha, K.J.; Heo, K.Y.; Lee, S.S.; Yun, K.S.; Jhun, J.G. Variability in the East Asian Monsoon: A review. Meteorol. Appl. 2012, 19, 200–215. [Google Scholar] [CrossRef]
  59. Chang, C.-P.; Wang, Z.; Hendon, H. The Asian Winter Monsoon. In The Asian Monsoon; Wang, B., Ed.; Springer Praxis Books; Springer: Berlin/Heidelberg, Germany, 2006; pp. 89–127. ISBN 978-3-540-37722-1. [Google Scholar]
  60. Zhu, Y.-L.; Wang, H.-J.; Wang, T.; Guo, D. Extreme spring cold spells in North China during 1961–2014 and the evolving processes. Atmos. Ocean. Sci. Lett. 2018, 11, 432–437. [Google Scholar] [CrossRef] [Green Version]
  61. Kim, B.-M.; Jeong, J.-H.; Kim, S.-J. Investigation of stratospheric precursor for the East Asian cold surge using the potential vorticity inversion technique. Asia-Pac. J. Atmos. Sci. 2009, 45, 513–522. [Google Scholar]
  62. Zhao, S.; Feng, T.; Tie, X.; Long, X.; Li, G.; Cao, J.; Zhou, W.; An, Z. Impact of climate change on Siberian high and wintertime air pollution in China in past two decades. Earth’s Future 2018, 6, 118–133. [Google Scholar] [CrossRef] [Green Version]
  63. Jia, B.; Wang, Y.; Yao, Y.; Xie, Y. A new indicator on the impact of large-scale circulation on wintertime particulate matter pollution over China. Atmos. Chem. Phys. 2015, 15, 11919–11929. [Google Scholar] [CrossRef] [Green Version]
  64. Kim, M.J. Changes in the relationship between particulate matter and surface temperature in Seoul from 2002–2017. Atmosphere 2019, 10, 238. [Google Scholar] [CrossRef] [Green Version]
  65. Gong, D.Y.; Ho, C.H. The Siberian High and climate change over middle to high latitude Asia. Theor. Appl. Climatol. 2002, 72, 1–9. [Google Scholar] [CrossRef]
  66. Aoki, I.; Kurosaki, Y.; Osada, R.; Sato, T.; Kimura, F. Dust storms generated by mesoscale cold fronts in the Tarim Basin, Northwest China. Geophys. Res. Lett. 2005, 32. [Google Scholar] [CrossRef]
  67. Xuan, J.; Sokolik, I.N.; Hao, J.; Guo, F.; Mao, H.; Yang, G. Identification and characterization of sources of atmospheric mineral dust in East Asia. Atmos. Environ. 2004, 38, 6239–6252. [Google Scholar] [CrossRef]
  68. Kim, C.H.; Lee, H.J. Numerical simulations of Asian dust events: A Lagrangian Dust Model and its applications. Asia-Pac. J. Atmos. Sci. 2013, 49, 571–586. [Google Scholar] [CrossRef]
  69. Ginoux, P.; Chin, M.; Tegen, I.; Prospero, J.M.; Holben, B.; Dubovik, O.; Lin, S.J. Sources and distributions of dust aerosols simulated with the GOCART model. J. Geophys. Res. Atmos. 2001, 106, 20255–20273. [Google Scholar] [CrossRef]
  70. Hasanean, H.M.; Almazroui, M.; Jones, P.D.; Alamoudi, A.A. Siberian high variability and its teleconnections with tropical circulations and surface air temperature over Saudi Arabia. Clim. Dyn. 2013, 41, 2003–2018. [Google Scholar] [CrossRef]
  71. Korea Meteorological Adminstration. External API Service. Available online: http://203.247.66.28 (accessed on 17 September 2020).
  72. Park, S.U.; In, H.J. Parameterization of dust emission for the simulation of the yellow sand (Asian dust) event observed in March 2002 in Korea. J. Geophys. Res. Atmos. 2003, 108, 1–21. [Google Scholar] [CrossRef]
  73. Jung, M.I.; Son, S.W.; Kim, H.C.; Kim, S.W.; Park, R.J.; Chen, D. Contrasting synoptic weather patterns between non-dust high particulate matter events and Asian dust events in Seoul, South Korea. Atmos. Environ. 2019, 214, 116864. [Google Scholar] [CrossRef]
  74. Dee, D.P.; Uppala, S.M.; Simmons, A.J.; Berrisford, P.; Poli, P.; Kobayashi, S.; Andrae, U.; Balmaseda, M.A.; Balsamo, G.; Bauer, P.; et al. The ERA-Interim reanalysis: Configuration and performance of the data assimilation system. Q. J. R. Meteorol. Soc. 2011, 137, 553–597. [Google Scholar] [CrossRef]
  75. Robinson, D.A.; Estilow, T.W. NOAA CDR Program NOAA Climate Data Record (CDR) of Northern Hemisphere (NH) Snow Cover Extent (SCE), Version 1. Available online: https://data.nodc.noaa.gov/cgi-bin/iso?id=gov.noaa.ncdc:C00756# (accessed on 22 June 2020).
  76. Serreze, M. Northern Hemisphere Cyclone Locations and Characteristics from NCEP/NCAR Reanalysis Data, Version 1. Available online: https://nsidc.org/data/nsidc-0423 (accessed on 23 September 2020).
  77. Kim, J. Transport routes and source regions of Asian dust observed in Korea during the past 40 years (1965–2004). Atmos. Environ. 2008, 42, 4778–4789. [Google Scholar] [CrossRef]
  78. Zou, X.K.; Zhai, P.M. Relationship between vegetation coverage and spring dust storms over northern China. J. Geophys. Res. Atmos. 2004, 109. [Google Scholar] [CrossRef]
  79. Takemi, T.; Seino, N. Dust storms and cyclone tracks over the arid regions in east Asia in spring. J. Geophys. Res. Atmos. 2005, 110. [Google Scholar] [CrossRef] [Green Version]
  80. Ghim, Y.S.; Kim, J.Y.; Chang, Y.-S. Concentration variations in Particulate Matter in Seoul associated with Asian dust and smog episodes. Aerosol Air Qual. Res. 2017, 17, 3128–3140. [Google Scholar] [CrossRef] [Green Version]
  81. Lee, H.-J.; Jo, H.-Y.; Kim, S.-W.; Park, M.-S.; Kim, C.-H. Impacts of atmospheric vertical structures on transboundary aerosol transport from China to South Korea. Sci. Rep. 2019, 9, 13040. [Google Scholar] [CrossRef]
  82. Park, M.E.; Cho, J.H.; Kim, S.; Lee, S.-S.; Kim, J.E.; Lee, H.C.; Cha, J.W.; Ryoo, S.B. Case study of the heavy Asian dust observed in late February 2015. Atmosphere 2016, 26, 257–275. [Google Scholar] [CrossRef] [Green Version]
  83. Johnson, B.T.; Heese, B.; McFarlane, S.A.; Chazette, P.; Jones, A.; Bellouin, N. Vertical distribution and radiative effects of mineral dust and biomass burning aerosol over West Africa during DABEX. J. Geophys. Res. Atmos. 2008, 113. [Google Scholar] [CrossRef]
  84. Reid, J.S.; Westphal, D.L.; Livingston, J.M.; Savoie, D.L.; Maring, H.B.; Jonsson, H.H.; Eleuterio, D.P.; Kinney, J.E.; Reid, E.A. Dust vertical distribution in the Caribbean during the Puerto Rico Dust Experiment. Geophys. Res. Lett. 2002, 29, 54–55. [Google Scholar] [CrossRef] [Green Version]
Figure 1. Research domain in this study. The black solid line represents the area for calculating the SHPI. The black dashed line represents the area for calculating the SHI. The two blue solid lines (R1 and R2) denote dust source regions. The red box is the ETC domain. The grey shaded area denotes the dust area. We used the fractional dust source inventory data of 1° × 1° resolution from https://www.gfdl.noaa.gov/atmospheric-physics-and-chemistry_data/ [69].
Atmosphere 12 00176 g001
Figure 2. Locations of the SYNOP for calculating dust frequency; (a) 106 stations in the dust source regions and (b) 36 stations in South Korea.
Atmosphere 12 00176 g002
Figure 3. Time series of (a) the SHI (black dashed line with the closed circle; hPa) and SHPI (black solid line with the closed circle; ° in longitude) and (b) DOF (grey line with the closed circle) and DEF (blue line with the closed circle) in March, 2000–2017. Pearson’s correlation coefficient (r) between indices are the following: r(SHI, SHPI) = +0.62 (p < 0.05), r(SHI, DEF) = −0.38, r(SHPI, DEF) = −0.36, r(SHI, DOF) = −0.70, r(SHPI, DOF) = −0.44. Shaded orange and blue bands denote the three years used for the Strong–East and Weak–West composites, respectively. Dark red and blue colors indicate the Strong-SHI and Weak-SHI from the SHI-only group, whereas light red and blue colors indicate for the East-SHPI and West-SHPI from the SHPI-only group. See also in Tables S1 and S2.
Atmosphere 12 00176 g003
Figure 4. Composite maps of MSLP (shaded; unit: hPa) and WV850 (white arrows; unit: m s−1) for March in (a) 2000–2017, and (b) the Strong-East (average of 2005, 2010, 2012) and (c) Weak-West (average of 2004, 2006, 2013) periods. The arrow in the lower right corner denotes wind speed of 8 m s−1. Contour interval is at 2 hPa. Boxes are the same as shown in Figure 1.
Atmosphere 12 00176 g004
Figure 5. Composite differences in meteorological variables between the Strong-East and Weak-West periods. (a) MSLP (shaded; hPa) and WV850 (white arrows; m s−1), (b) WS850 (shaded; m s−1), (c) Tsfc (shaded; °C), and (d) SCE (shaded; %). Boxes are the same as shown in Figure 1. Black dotted areas (yellow dots in Figure 5d) indicate the differences are statistically significant above the 90% confidence level based on the Student’s t-test.
Atmosphere 12 00176 g005
Figure 6. Latitude–height cross sections of composite differences in (a) geopotential height (Z, m), (b) air temperature (T; °C), (c) zonal-mean wind (u; m s−1) between the Strong-East and Weak-West periods averaged over 95°–110° E (R1 and R2). Black dotted areas indicate where the differences are statistically significant above the 90% confidence level based on the Student’s t-test.
Atmosphere 12 00176 g006
Figure 7. Four-day evolution of MSLP (hPa) averaged over 12 high-dust days for the Strong-East (top panel), Weak-West (middle panel), and difference between Strong-East and Weak-West periods (bottom panel). +0 Day is the day on which dust emitted in the merged region of R1 and R2. Black dotted areas indicate where the differences are statistically significant above the 90% confidence level based on the Student’s t-test.
Atmosphere 12 00176 g007
Figure 8. Same as in Figure 7 but for Z850 (m, shaded) and WV850 (m s−1). Black dotted areas indicate where the differences are statistically significant above the 90% confidence level based on the Student’s t-test.
Atmosphere 12 00176 g008
Figure 9. Stacked bar charts of the count of SYNOP in the dust source region (black) and South Korea (grey) for the (a) Strong-East and (b) Weak-West periods, respectively. See the details in Section 2.3.
Atmosphere 12 00176 g009
Table 1. Composite means in DOF and DEF for the Strong-East and Weak-West periods.
Composite MeanStrong-East
(Average of 2005, 2010, 2012)
Weak-West
(Average of 2004, 2006, 2013)
DOF1.42.5
DEF1.62.4
Table 2. Composite means of the ETC frequency and intense ETC frequency in dust source region (combined R1 and R2) for the Strong-East and Weak-West periods over 95°–125° E, 35°–50° N in March.
Composite MeanStrong-East
(Average of 2005, 2010, 2012)
Weak-West
(Average of 2004, 2006, 2013)
ETC frequency5468
Intense ETC frequency2232
Table 3. Same as Table 2, but for the ETC domain (125°–140° E, 35°–50° N).
Composite MeanStrong-East
(Average of 2005, 2010, 2012)
Weak-West
(Average of 2004, 2006, 2013)
ETC frequency2731
Intense ETC frequency1621
Publisher’s Note: MDPI stays neutral with regard to jurisdictional claims in published maps and institutional affiliations.

