Article

Projected Direct Carbon Dioxide Emission Reductions as a Result of the Adoption of Electric Vehicles in Gauteng Province of South Africa

by
Mokhele Edmond Moeletsi
1,2,3,* and
Mphethe Isaac Tongwane
1,4
1
Agricultural Research Council—Soil, Climate and Water, Pretoria 0001, South Africa
2
Business School, Nelson Mandela University, Port Elizabeth 6001, South Africa
3
Risk and Vulnerability Assessment Centre, University of Limpopo, Polokwane 0727, South Africa
4
Department of Geography, University of the Free State, Phuthadithjaba 9866, South Africa
*
Author to whom correspondence should be addressed.
Atmosphere 2020, 11(6), 591; https://doi.org/10.3390/atmos11060591
Submission received: 2 April 2020 / Revised: 21 May 2020 / Accepted: 25 May 2020 / Published: 4 June 2020
(This article belongs to the Special Issue Greenhouse Gas Emission Mitigation: Feasibility and Economics)

Abstract

:
There are genuine worldwide concerns regarding the contribution of internal combustion engine (ICE) vehicles to greenhouse gas (GHG) emissions. Passenger electric vehicles (EVs) are considered as a viable solution to the rapidly increasing global GHG emissions from ICE vehicles. This study investigated the future impact of perceived adoption of electric vehicles in Gauteng Province of South Africa on carbon emissions. Estimations of carbon dioxide (CO2) emissions were made with data from 2000 to 2018 to provide a reference period for the analysis. Projections of CO2 emissions from 2020 to 2030 were undertaken using three future cases, namely: mitigation, business as usual, and high economic growth based on the projected 20% population of electric vehicles, and four scenarios representing varying proportions of different types of EVs. The results showed an increasingly significant trend in CO2 emissions during the reference period. CO2 emissions estimated using the mitigation case showed an overall reduction in emissions of between 30% and 35%, depending on the scenario. The business as usual case showed an increase in emissions of 1–5% by 2030. The high economic growth case showed a high increase in CO2 emissions of 35–41% by 2030. The study indicates a need to accelerate the adoption of EVs with a 20% projection of the vehicle population still not enough to make a meaningful contribution towards decreasing CO2 emissions from passenger vehicles.

1. Introduction

Climate change is a reality that is starting to have an impact on society through decreased agricultural production and increased extreme weather events, resulting in worldwide disasters [1,2]. It comes as a result of anthropogenic activities that release greenhouse gas (GHG) emissions into the atmosphere. One of the key areas of concern is the transport sector, which accounts for around 23% of the total energy use, with a GHG footprint of close to 17% of global emissions [3,4]. There is global concern about the elevation of GHG emissions resulting from the increase in internal combustion engine (ICE) vehicles, leading to the recent wave in electrifying vehicles which presents many advantages as well as major constraints [5].
South Africa is one of the world’s most carbon-intensive countries owing to the economy that is dependent on coal-fired electricity, energy-intensive mining and heavy industry [6]. As a signatory to the Kyoto Protocol and the Paris Agreement, South Africa has to demonstrate commitment towards combating climate change by embarking on mitigation and adaptation measures [7]. The country has been at the forefront in terms of rectifying historical circumstances by embarking on emission reduction initiatives like the introduction of a carbon tax [6]. Furthermore, use of technologies has the potential to decarbonize energy industries including transport by up to 50% [8,9].
The energy sector produced 83% of total GHG emissions in South Africa in 2010 where road transport accounted for 10% (or 43.5 million tonnes) of these emissions [10,11]. The transport sector is one of the main emitters of GHG emissions in South Africa, contributing around 13% of the total emissions [12]. Private motorcars are the largest emitters with 41% of total road emissions in the country [11]. With the largest economic output in the country, Gauteng Province is responsible for a third of total road emissions [11].
Switching to electro-mobility technologies, including battery electric vehicles (BEVs), hydrogen fuel cell and hybrid vehicles has a high potential to decarbonize the transport sector [8]. Hydrogen fuel cells have the potential to supply close to three quarters of freight and public transport travel demands by the middle of this century [8]. Electric vehicles (EVs) have an attractive potential of 80% of new vehicles for private passenger and light commercial modes of road transport by the same period [8]. These technologies may currently only have upstream emissions that emanate from electricity generation and production of hydrogen fuel [9].
The global industry of EVs is increasing rapidly but initial capital investments remain a challenge in many countries [13]. The efficiency of EVs has the potential to reduce GHG emissions at both local and global scale [14]. EVs were reintroduced in the market in 2013 and their population remains low [15]. Although South Africa is the leading motorcar manufacturer and user in Africa, only 79 EVs were sold in the country in 2015 [16]. Proper infrastructure including charging stations, tax incentives and consumer affordability of the vehicles are major challenges that prevent rapid absorption of EV technologies in the country [15,17,18].
The concerns raised by governments, the private sector and international organizations about energy security as well as climate change, has led to ground-breaking research and developments in the transport sector. The introduction of ICE vehicles in the 1880s and their development over the years has enabled mobility of people globally [19]. But this ground-breaking invention has been at the heart of climate change and the pollution problems that the world is facing. High GHG emissions from ICE vehicles led to the evolution of EV technology which has no tailpipe emissions. The objective of this study is to ascertain whether there will be any benefits that can be achieved by adopting electric vehicles in South Africa to assist the government in their GHG emissions reduction targets.

2. Materials and Methods
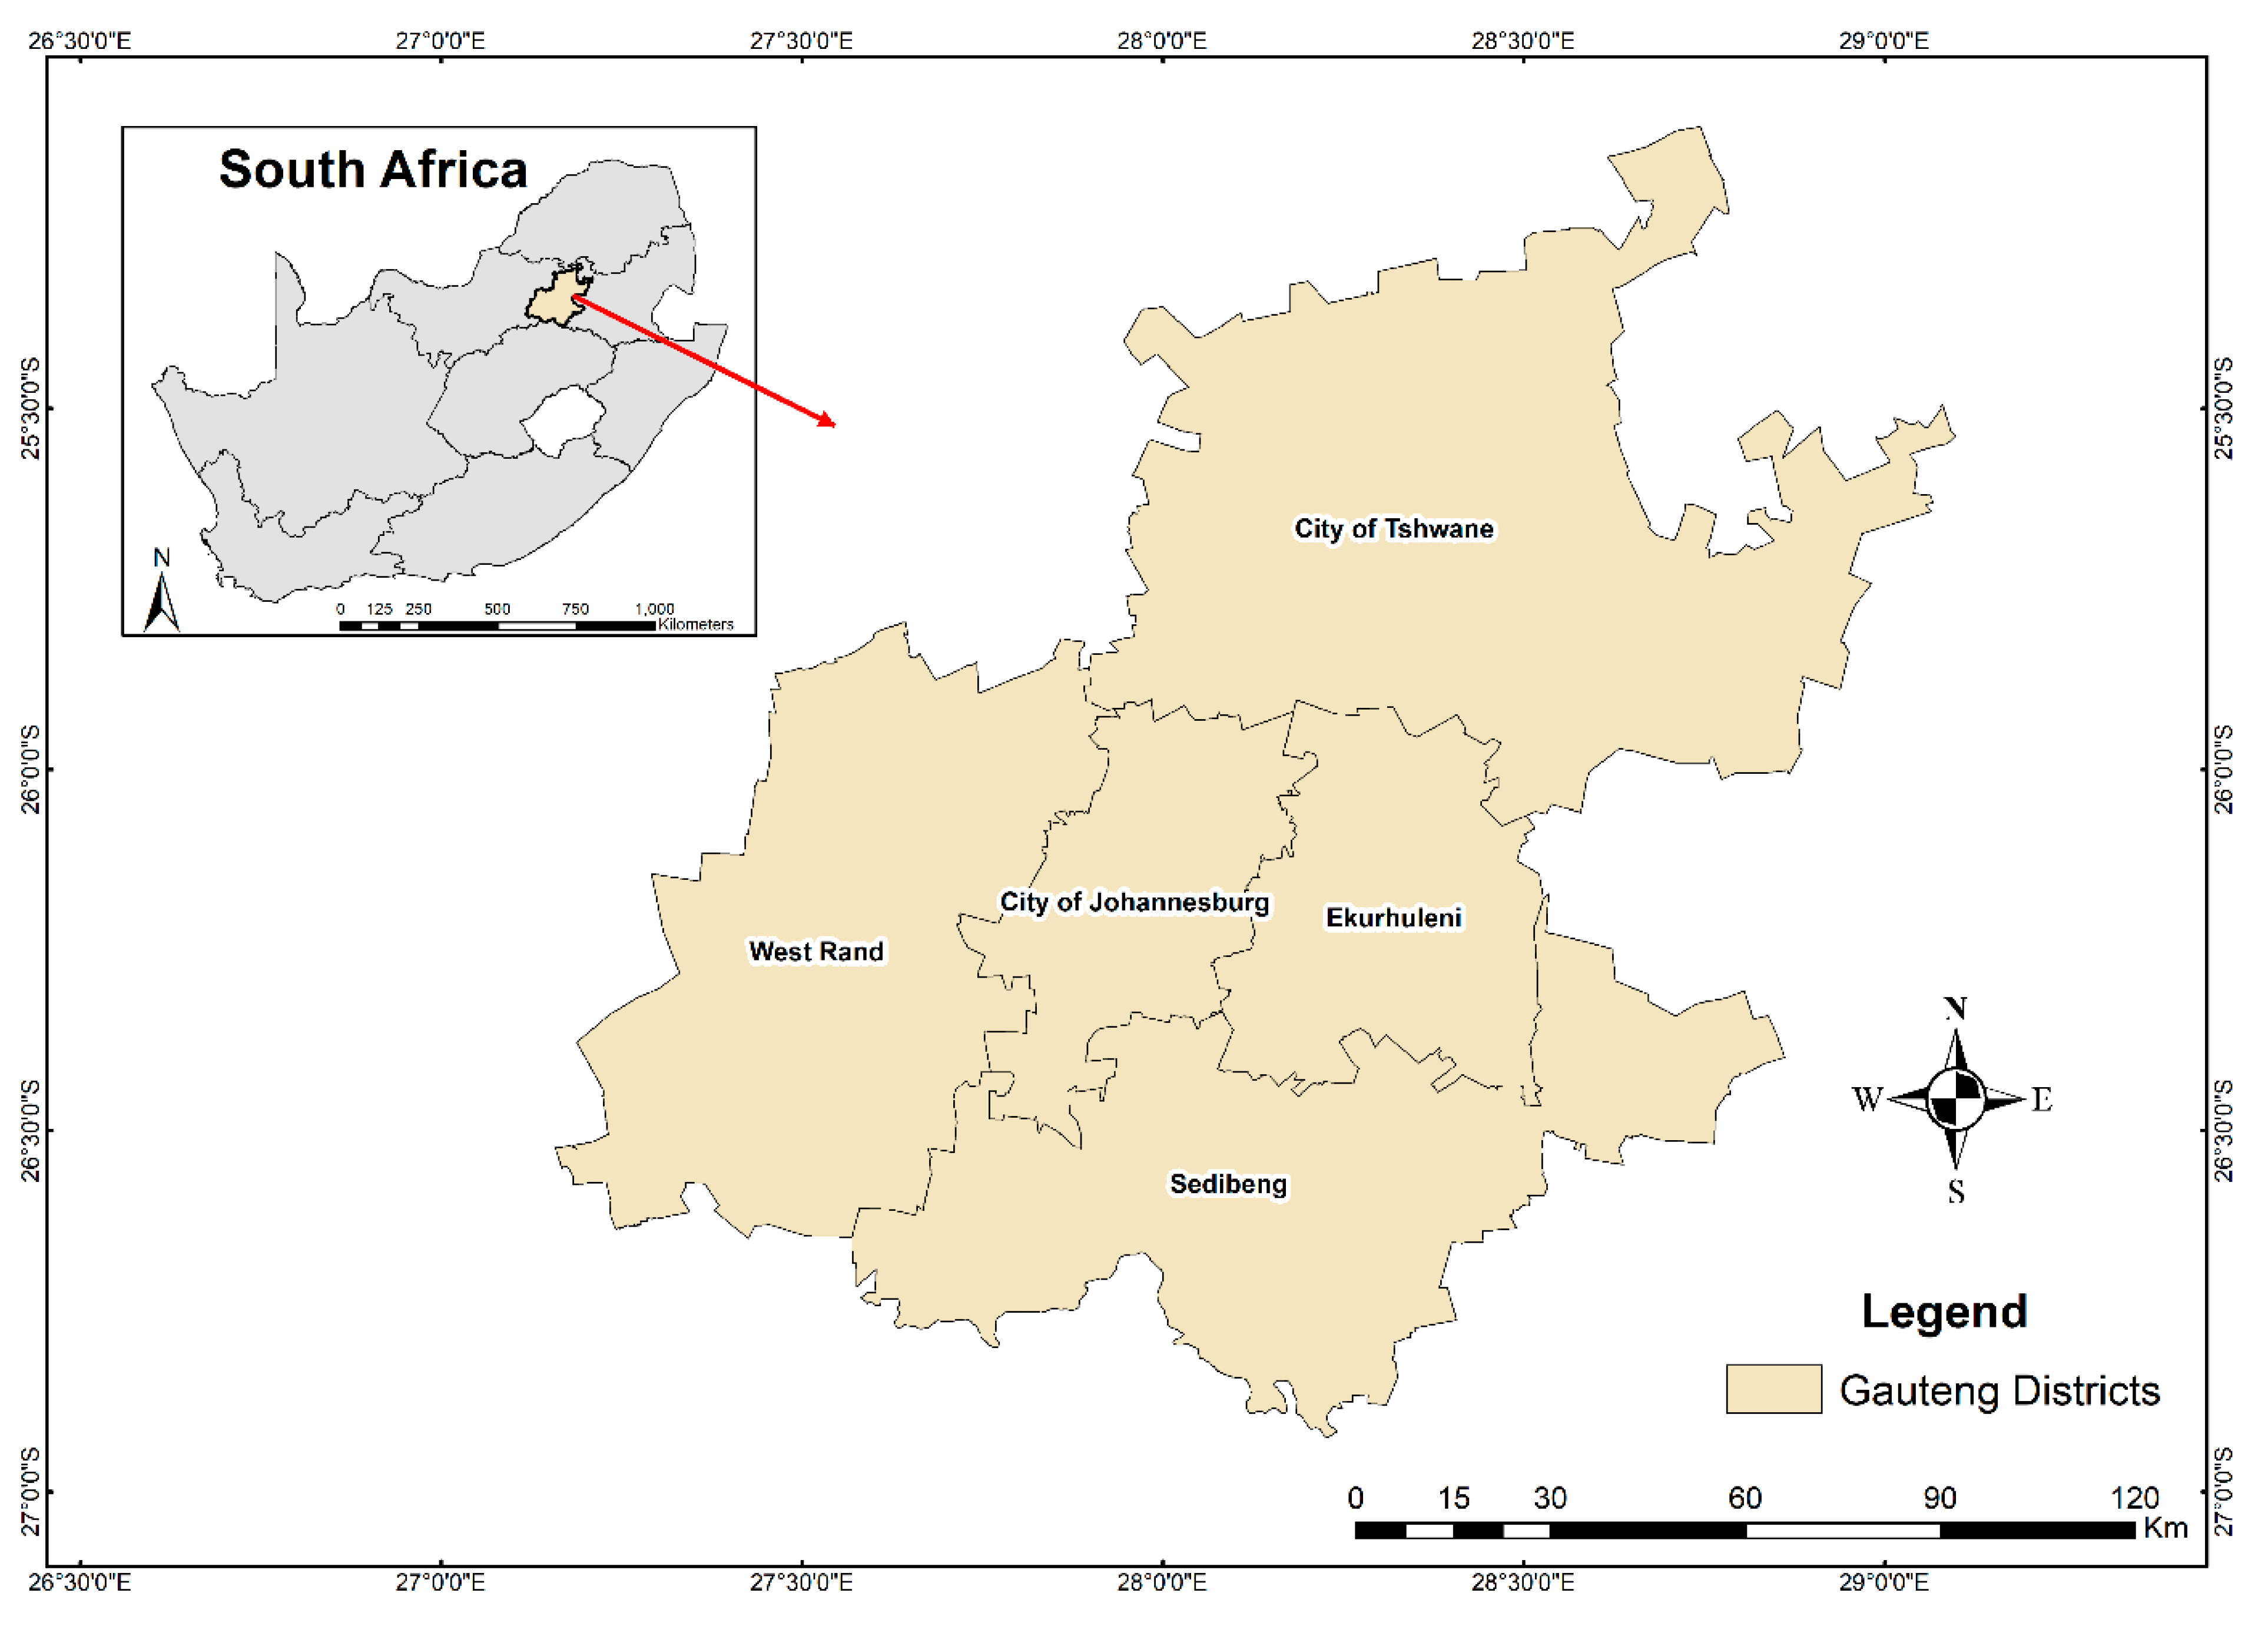
2.1. Study Area

The study was conducted in Gauteng Province of South Africa, which is divided into five municipal districts (Figure 1). There are about 14.7 million people residing in Gauteng, representing around 25.4% of the national total population [20]. Even though Gauteng is a highly populated province, it is the smallest province in terms of land size with 18,178 km2 which is equivalent to 1.49% of the total area of the country. The province also houses the country’s administrative capital, Pretoria (located in the metropolitan City of Tshwane), as well as its largest city, Johannesburg.
Gauteng is the country’s main economic hub and currently contributes 34.3% to the national gross domestic product (GDP) [21]. The province’s transport, storage and communication economic sector is responsible for 35.6% of the national total for the sector. The sector accounted for 9% of the 120 billion US dollars generated by the province to the national GDP in 2017 [20].

2.2. Methodology

The study investigated the impact of adopting electric cars on the modal GHG emissions in Gauteng. The GHG emissions were firstly estimated for previous years using vehicle statistics from 2000 to 2018 as a baseline for the investigation. The Intergovernmental Panel on Climate Change (IPCC) 2006 and 2019 guidelines together with findings of Goyns [22], Tongwane [23] and Tongwane et al. [11] were used to estimate GHG emissions from ICE vehicles.

2.2.1. Estimation of Carbon Dioxide (CO2) Emissions

In road transport, it is key to estimate CO2 carefully because this is the main GHG source and efforts to improve emissions of other gases should be minimal as they make a small contribution to the total emissions [24]. The following steps were used to estimate GHG emissions from motor vehicles in the province:
Collect fuel statistics as well as average distance travelled by passengers;
Estimate CO2 emissions using the appropriate methodology.
To estimate CO2 emissions from motor vehicles the following Equation (1) was used:
C O 2   e m i s s i o n s = N a , b × D i s t a , b × E F a , b
where Na,b is the annual number of vehicles per fuel type (a) and engine size (b); Dista,b is the average annual distance travelled per fuel type and engine size; EFa,b is the emissions factor for a vehicle per fuel type.
The vehicle types were categorized according to the proportions obtained in Posada [16] as shown in Table 1. It is estimated that 83% of the cars run on petrol while 17% of the vehicles use diesel, but the proportion of hybrids and EVs was negligible in 2015 [11,16]. The distance travelled for motorcars was estimated based on the average distance travelled obtained from the data used by Tongwane et al. [11] whilst distances after 2009 were kept constant at the 2009 value throughout the period of the study based on the assumptions of Van Rensberg and Krygsman [25]. Estimated emission factors for all the motorcar categories were obtained from Posada [16].
These vehicle categories are discussed in the study as: 1 = mini car (petrol); 2 = small vehicle (diesel); 3 = small vehicle (petrol); 4 = lower medium vehicle (diesel); 5 = lower medium vehicle (petrol); 6 = medium vehicle (diesel); 7 = medium vehicle (petrol); 8 = upper medium vehicle (diesel); 9 = upper medium vehicle (petrol); 10 = sport vehicle (diesel); 11 = sport vehicle (petrol); 12 = offroad vehicle (diesel); 13 = offroad vehicle (petrol); 14 = multi-purpose vehicle (MPV, diesel); 15 = MPV (petrol); 16 = sport utility vehicle (SUV, diesel); 17 = SUV (petrol).

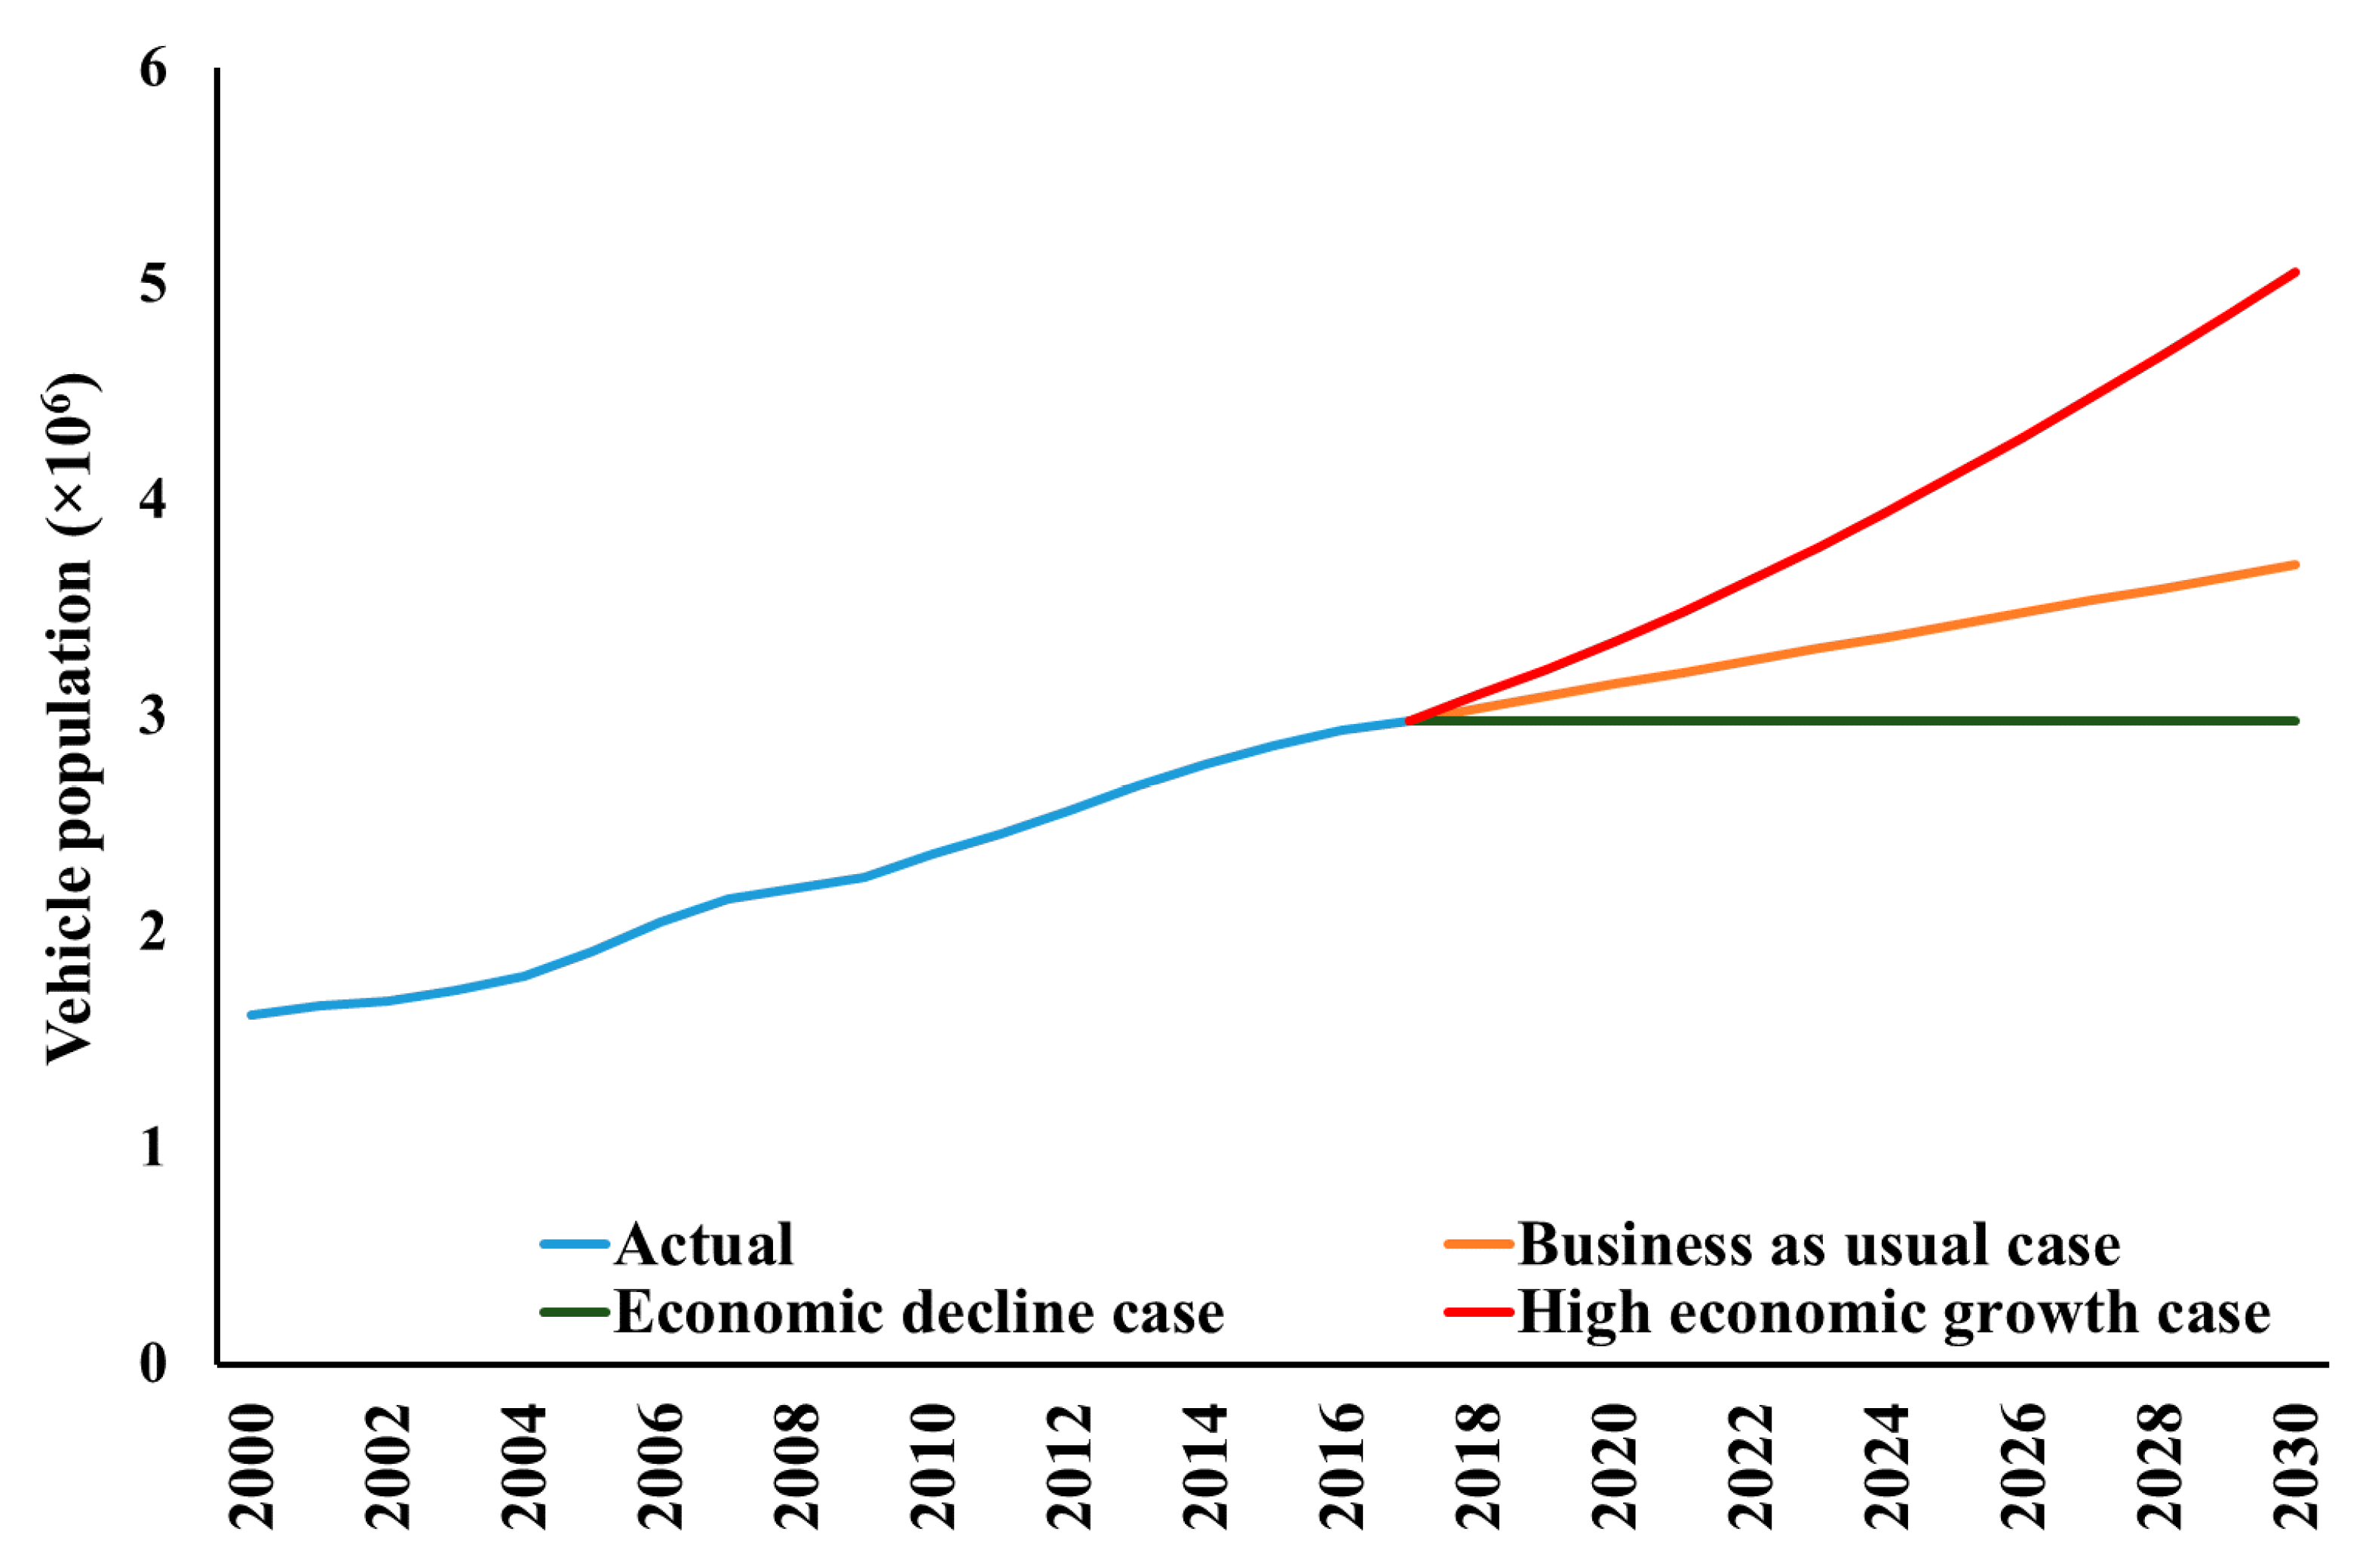
2.2.2. Forecasting of Vehicle Population

In order to assess the impact of the introduction of EVs on South African passenger vehicle GHG emissions, the following steps were undertaken:
Use of statistical tools to forecast vehicle population until 2030;
Assumptions on the desired proportions of EVs in the future based on government policy;
Estimation of the number of EVs based on desired proportions until 2030;
Calculate direct emissions reduction based on the desired EV proportions.
The XLSTAT ARIMA model was used to forecast the vehicle population from 2019 to 2030 (Figure 2) based on the trend recognized from the reference values from 2000 to 2017 [26]. The forecast yielded three cases, namely:
  • Mitigation case (constant number of vehicles);
  • Business as usual (rate of increase in vehicles based on autoregressive moving averages of data from year 2000 to 2017);
  • High economic growth case (upper boundary of the 95% confidence interval around the moving averages).

2.2.3. Developing Future Electric Vehicle Scenarios

Based on the South African nationally intended contributions which projects investment in EVs and hybrid vehicles, the study made the ambitious assumption of 20% population growth by 2030 from the reference year 2018 [27]. The exponential model to the adoption of EVs was used in this study (Table 2). This model was chosen based on the fact that currently in South Africa there is no enabling environment for the uptake of the technology, with the expectation that when the current policies are implemented the growth will increase tremendously. The current market penetration percentage is around 0.008%, 0.012% and 0.037% for plugin EV (PHEV), full battery EVs (BEVs) and hybrid (HEV) cars respectively [16,28]. The coefficients for the exponential equation will be used to estimate annual market penetration between 2020 and 2030. The study employs three scenarios used to measure the effect of electric vehicles in reducing GHG emissions. These scenarios use Scenario B which has a factor of zero for all the three coefficients (i.e., HEV, PHEV and BEV) as a base. The base scenario assumes a continuation of the use of ICE cars with no effort to promote zero exhaust vehicles or high energy-efficient cars.
The GHG emissions savings were then calculated on the assumption that the difference of upstream emissions between ICE cars and electric cars is negligible. It was also assumed that electricity usage by EVs is purely renewable (i.e., charging stations are operated by renewable energy). This assumption is based on the fact that there is a massive movement in South Africa to install solar-powered EV charging stations all over the country [29,30]. Furthermore, the national Green Transport Strategy proposes to develop a renewable biomethane technology to charge EVs [12].

2.3. Data

2.3.1. Data Sources

The number of motorcars in Gauteng Province has been increasing linearly from the year 2000 to 2018. This is shown by data in Table 3 obtained from eNatis (electronic National Administration Traffic Information System) [31,32,33,34,35,36]. By the end of September 2018, the province’s motorcars were 38.8% of the total motorcars in the country [31]. The Road Traffic Management Corporation [36] provided annual distances travelled by motorcars between 2000 and 2009.

2.3.2. Data Analysis

The time series of CO2 emissions from burning of fossil fuels by passenger vehicles in Gauteng underwent a trend analysis using the Mann–Kendall trend test. This was done through the use of XLSTAT software [26]. The trend test was based on the following assumptions:
H0: There is no trend in the time series data (Null Hypothesis)
Ha: There is a trend in the time series data (Alternative Hypothesis).
Descriptive statistics of STATISTICA software were used to compare emissions estimates obtained from different scenarios.

3. Results and Discussion

3.1. Carbon Dioxide Emissions from 2000 to 2018

Carbon dioxide emissions emanating from motorcars in Gauteng have been increasing steadily from the year 2000 to 2018 (Table 4). Most of the emissions are from small petrol cars, SUVs and lower medium vehicles with around 28%, 23% and 19%, respectively. Even though the estimated population of SUVs is similar to lower medium cars, it is their high emission intensity that results in the 4% GHG emissions contribution. The contribution of other vehicles is lower than 8%. As shown in Table 5, the results obtained from trend analysis, the p-value is lower than the significance level (α = 0.05) and thus one should reject the null hypothesis H0 (there is no trend in the time series) in favour of the alternative hypothesis Ha (there is a trend in the time series).
Total CO2 emissions from motorcars in Gauteng ranged from 3871 Gg CO2 in 2000 to 7256 Gg CO2 in 2018. The emissions were 6300 Gg for motorcars in 2009 [11], representing an increase of 15% in 2018. Small vehicles (petrol), lower medium vehicles (petrol) and SUVs (petrol) were the major producers of the emissions. In the period 2000 to 2010, CO2 emissions from motorcars in Gauteng account for around 13% of total national road transport emissions stated in the GHG inventory for South Africa 2000–2010 [5,11], which is comparable to the results of this study. The discrepancy could, however, be mainly caused by the use of different emission factors. It can also be stated that motorcar CO2 emissions rate of increase was estimated to be 3.8% from 2000 to 2018. In their study, Tongwane et al. [11] obtained a rate of increase of 2.6% in South Africa. A rapid increase in the number of vehicles, particularly the three major emitting types, is the main source of the higher rate of increase in emissions.

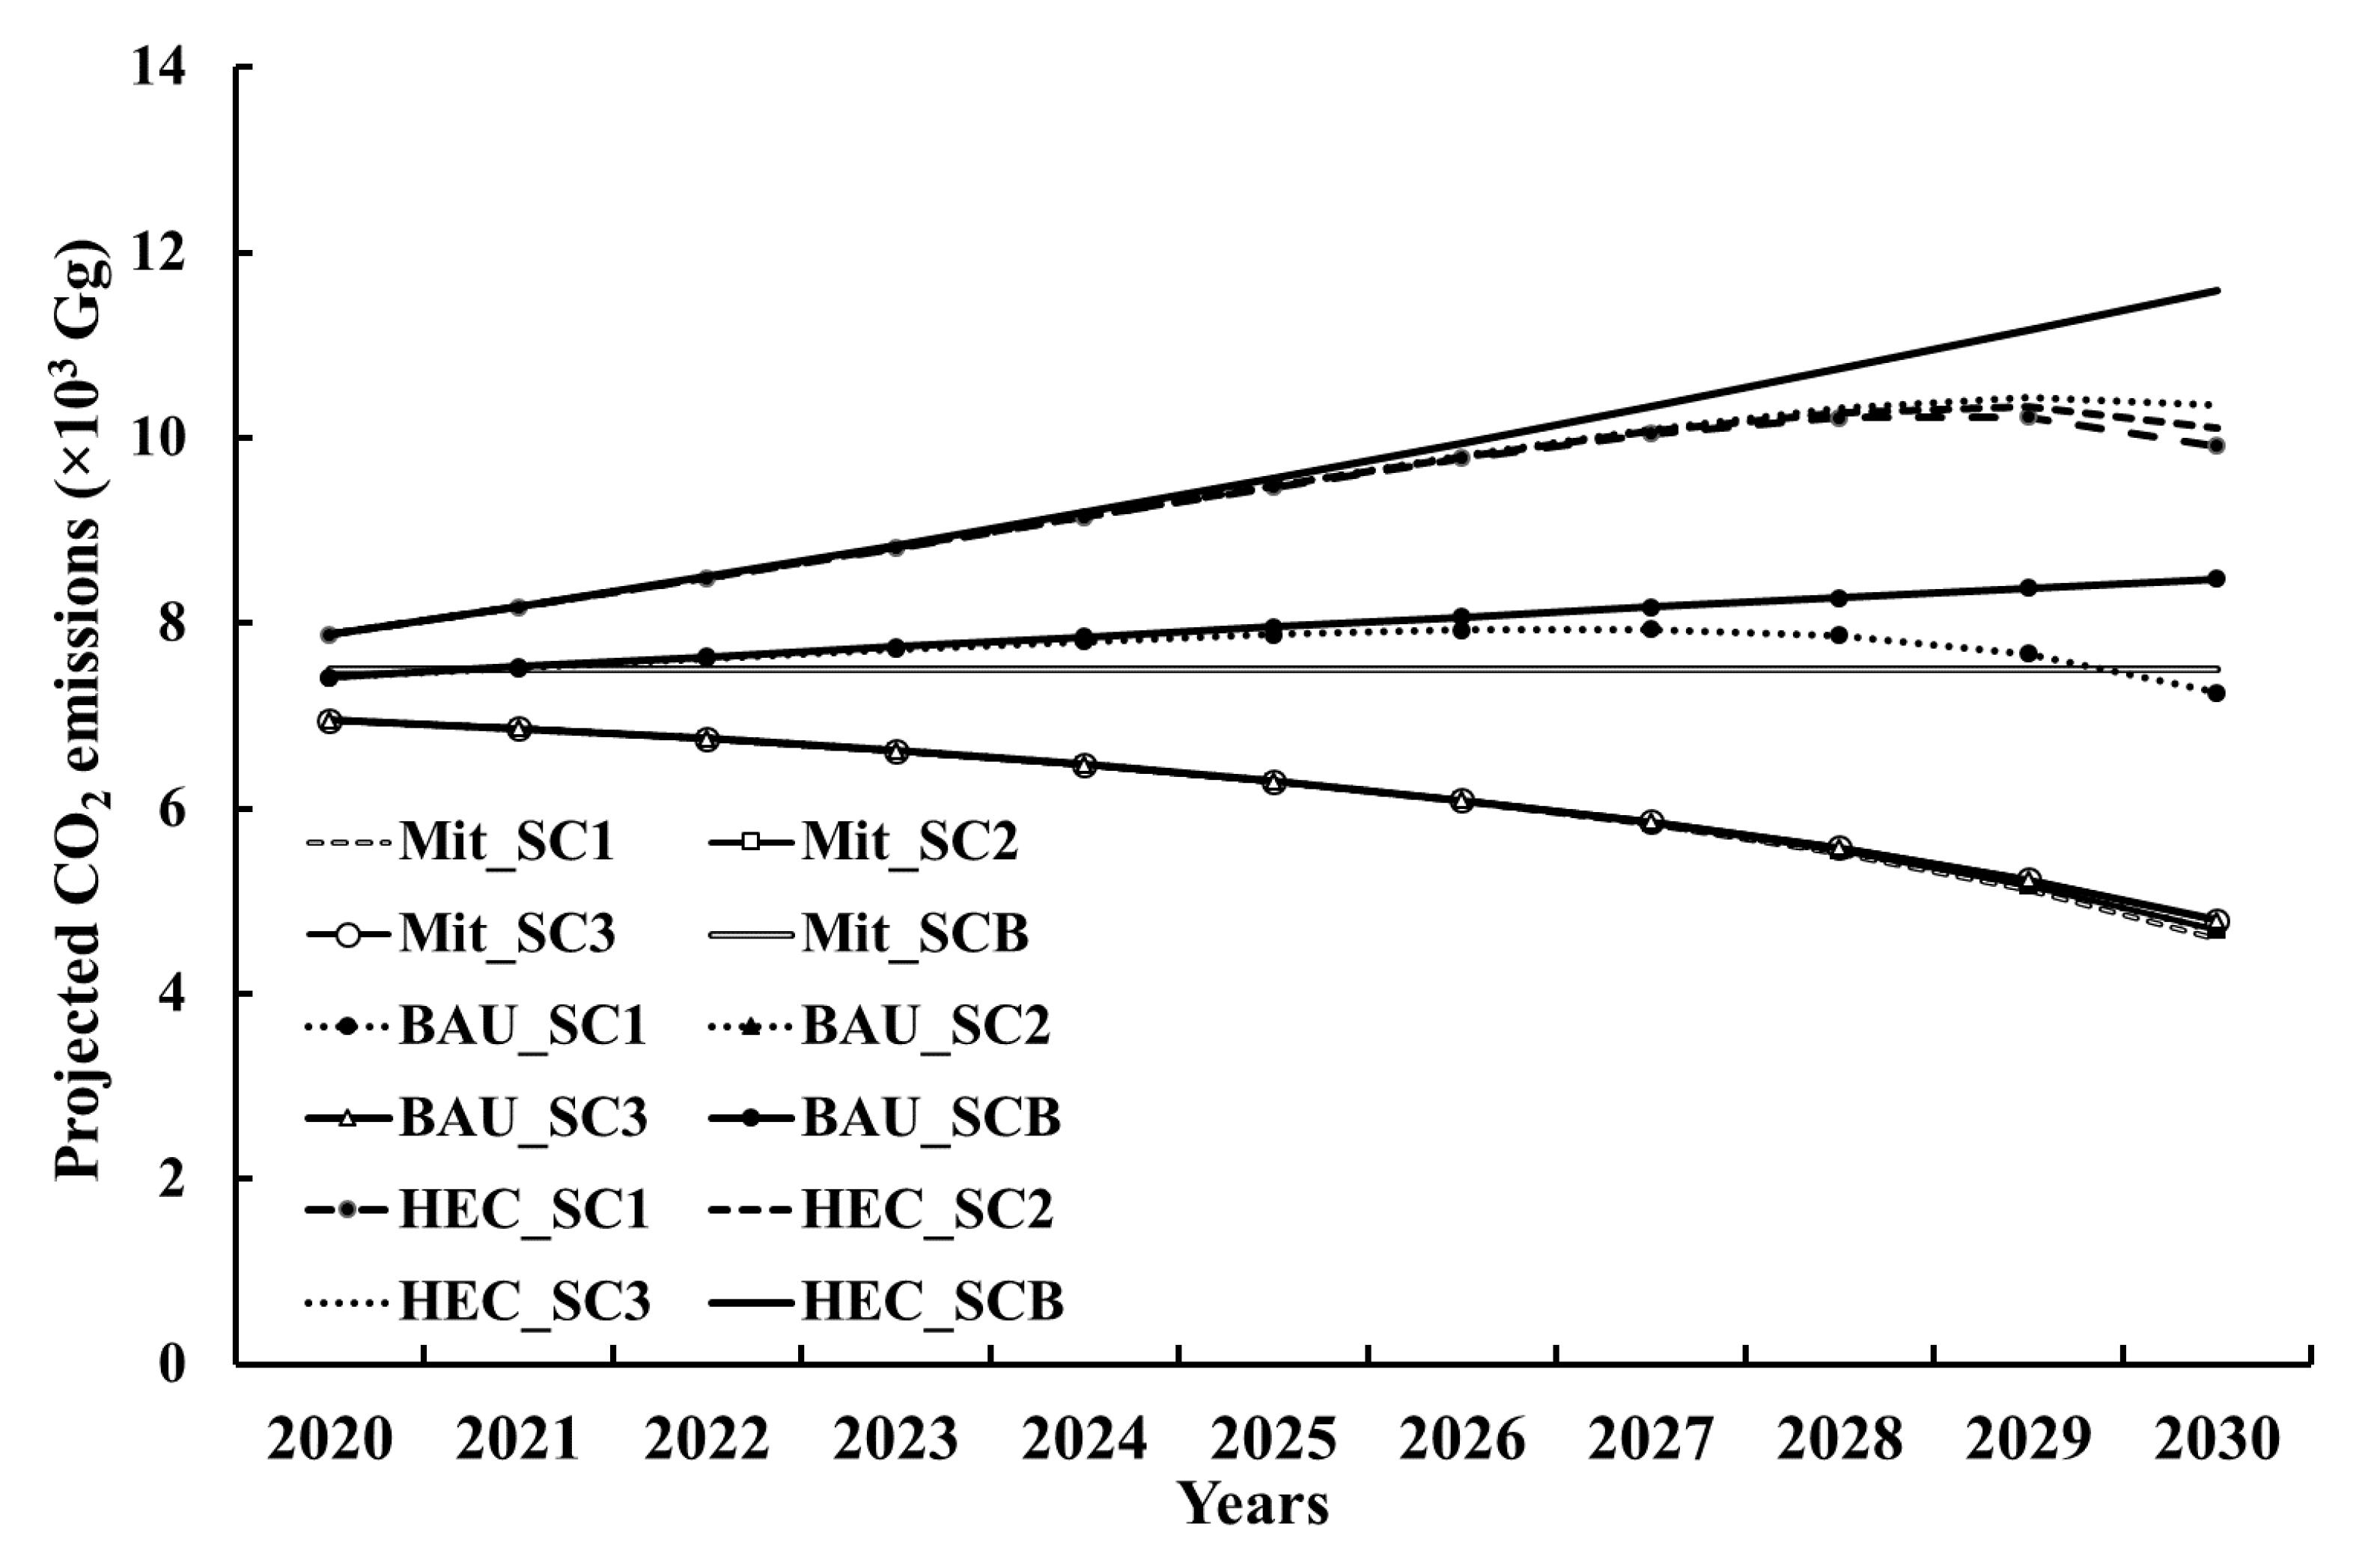
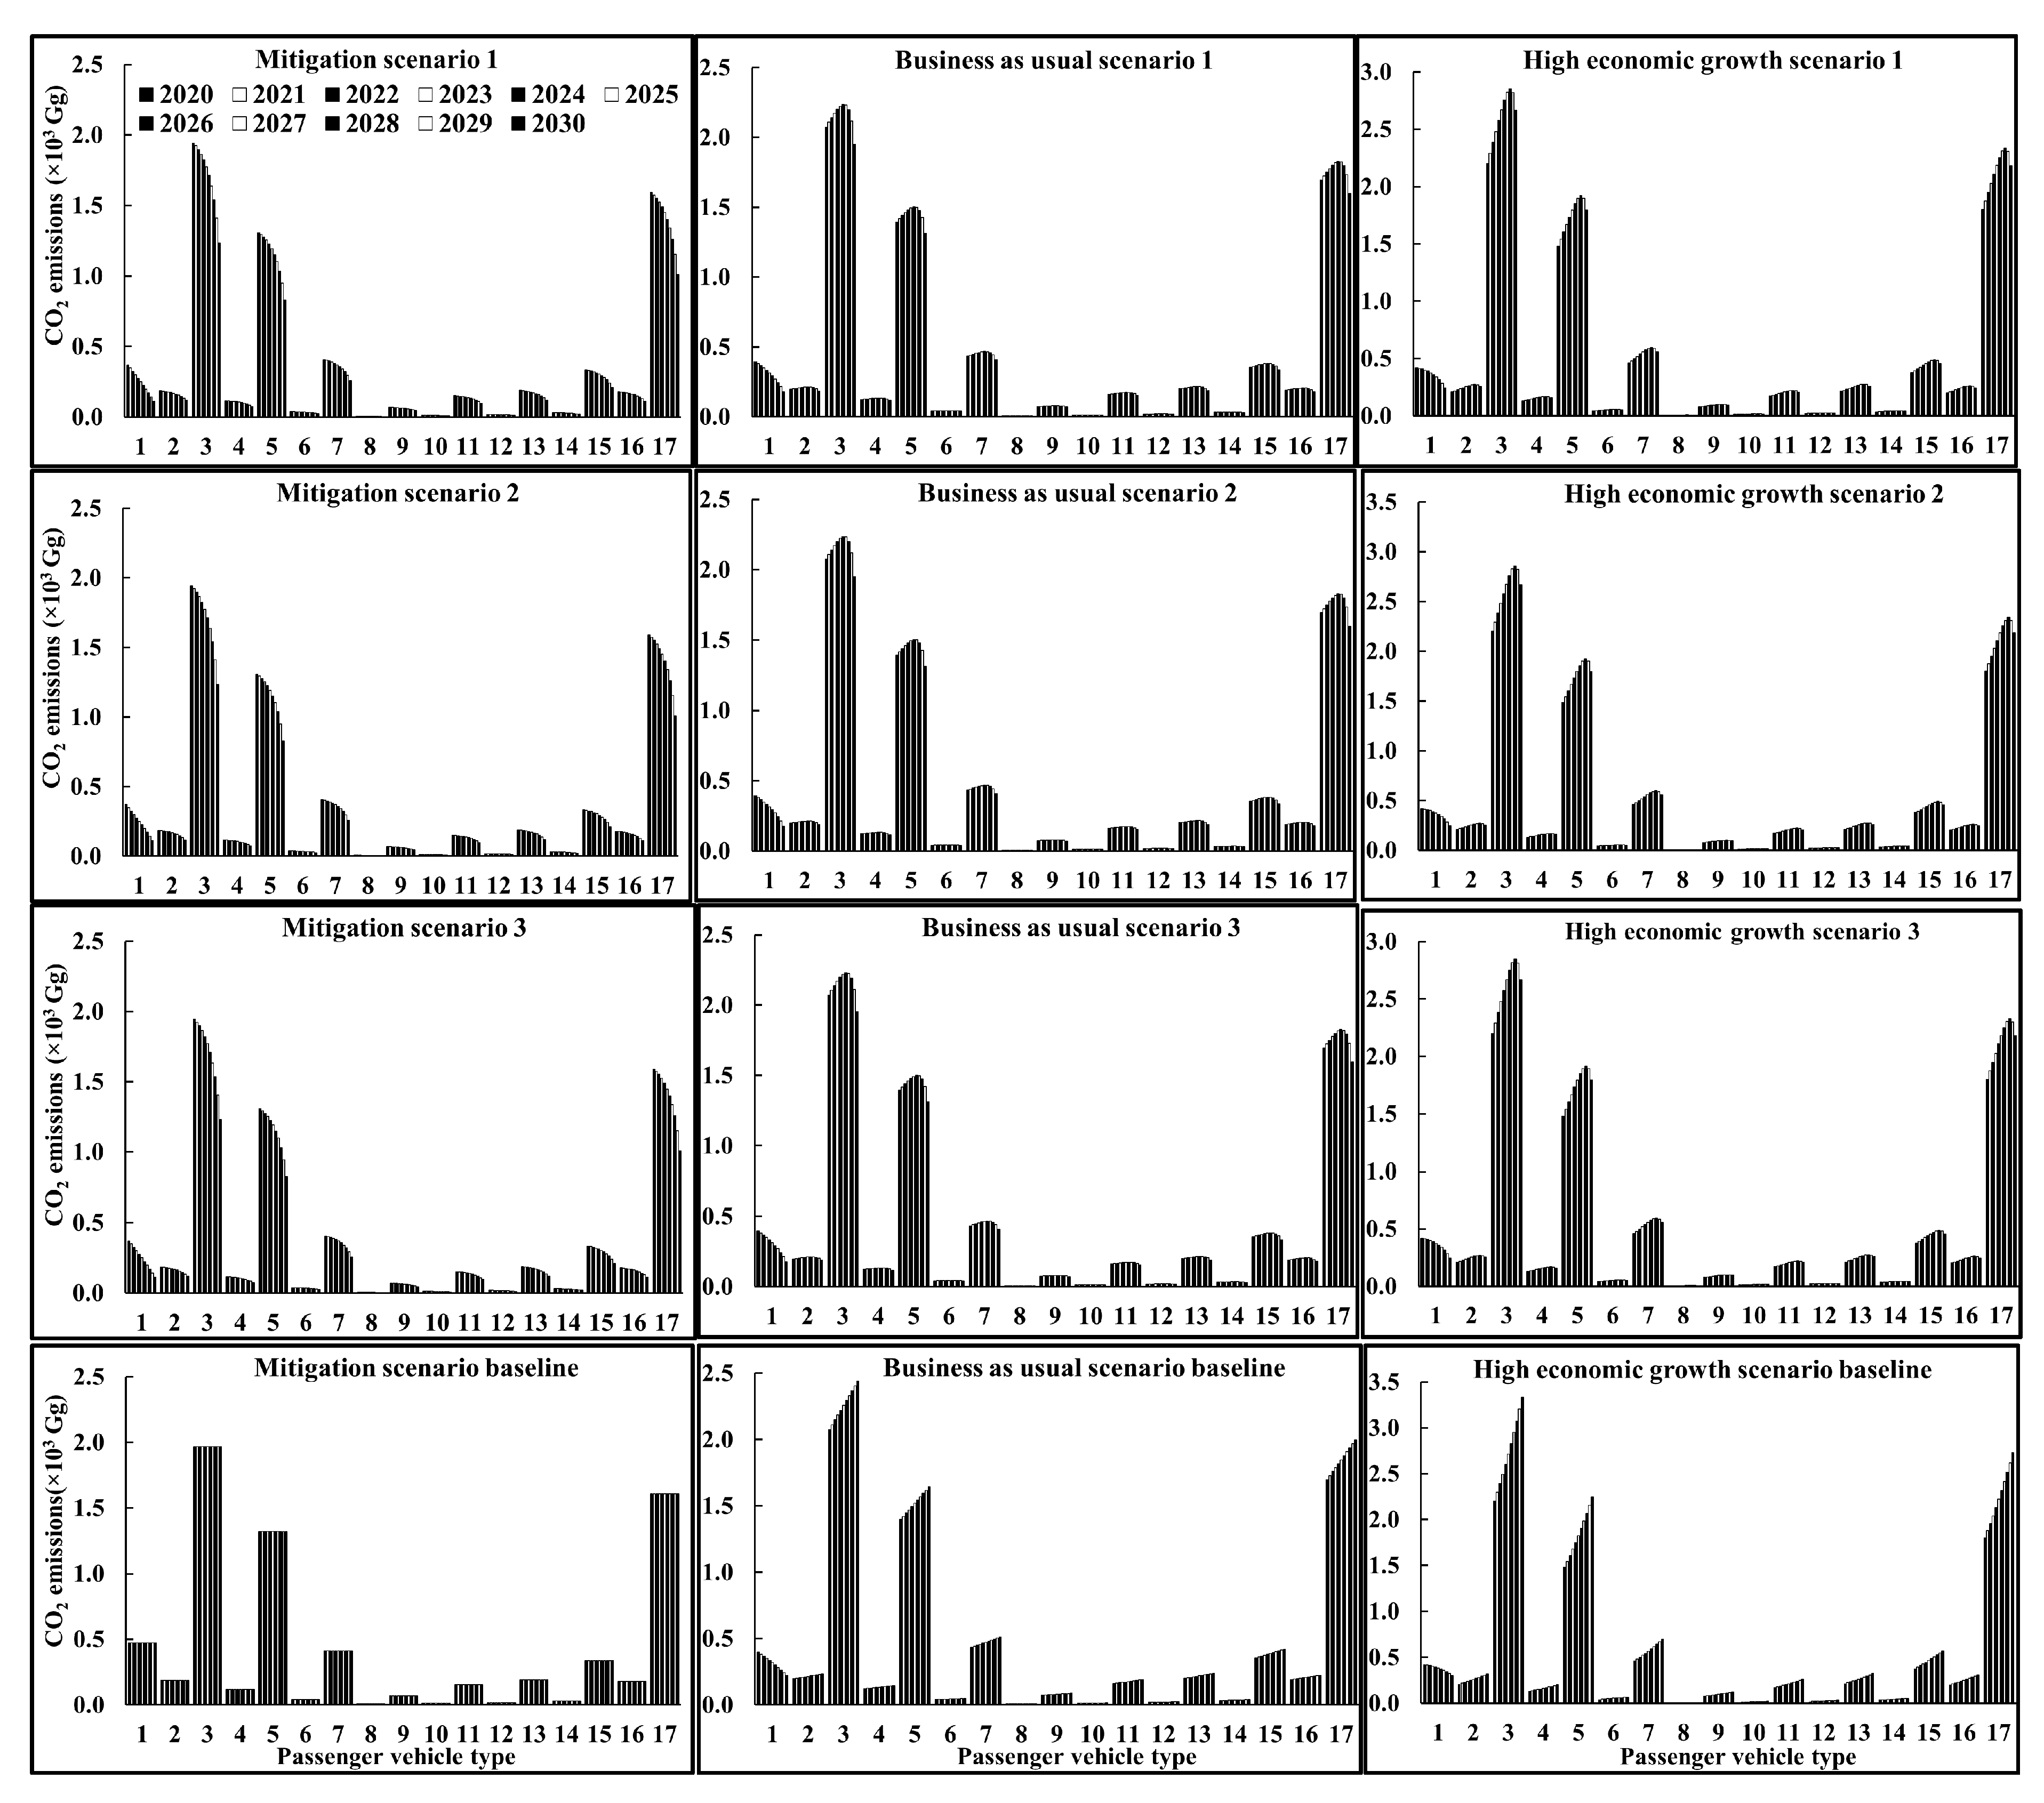
3.2. Emission Scenarios

Future scenarios of CO2 emissions from passenger vehicles in South Africa show a wide range of emissions (Figure 3). The outcomes range from a decline of emissions with time from a group of scenarios (Mit_SC1, Mit_SC2, Mit_SC3, BAU_SC2 and BAU_SC3) to HEC_SCB which is projected to yield in emissions of approximately 12,000 Gg of annual CO2 emissions. Emissions are projected to be approximately 5000 Gg by 2030 for high mitigation scenarios. All scenarios under high economic growth are projected to produce the highest emissions. Higher disposable incomes as a result of enhanced economic activities increases the purchase of vehicles and their overall mobility. The emissions are projected to reach a plateau between 2027 and 2029, after which they will decline.

3.2.1. Projected CO2 Emissions for Mitigation Case

Under this case it is clear that there is a general decrease in emissions owing to the downward movement of the number of vehicles over time (Figure 4). If the country’s policies are geared towards not promoting low-carbon technologies (Scenario B), then in 2030 there will still be a 20% reduction in emissions. This implies that there can be significant reductions in emissions if Gauteng can embark on efforts that reduce the number of vehicles on the road without necessarily having any major technological changes. This can be realized in a number of ways. For example, the government can promote the use of public transport by improving the network as well as drastically reducing the cost of travel. This will entice motorists to leave their vehicles at home and potential new motorists will have less reason to buy their own motor vehicles. The government can also provide rebates to people willing to recycle their old vehicles. However, scenario 1 yields the best mitigation with the potential reduction in emissions in 2030 of 35% followed by scenario 2 with 34% and scenario 3 with 32% as compared to 2018 CO2 estimates.

3.2.2. Projected CO2 Emissions for Business as Usual Case

The business as usual case shows an increase in CO2 emissions attributed to an increase in passenger vehicles in all the scenarios. Scenario B results in close to a 20% increase in emissions by 2030 without any mitigation measure. If the government adopts mitigation option 1, there will be 0.8% increase in emissions by 2030, while mitigation options 2 and 3 will result in 3% and 5% increases respectively. These mitigation options are in line with the South African intended mitigation contributions that were presented to the United Nations Framework Convention on Climate Change (UNFCCC) which follow the peak, plateau and decline trajectory [27]. The country chose this approach in order to respond to both development goals like the need to eradicate poverty and eliminate inequality (necessitating an increase in economic activity which is proportional to GHG emissions in the current environment and technological advances) as well as climate change issues. Scenarios 1, 2 and 3 reach peak emissions in 2028, 2027 and 2027 respectively.
In the business as usual scenario, other strategies of reducing GHG emissions employed in other countries include encouraging motorists to use their vehicles occasionally or encouraging them to embark on cycling and walking [37]. Reducing motor vehicle use in South Africa from an average exceeding 15,000 km on an annual basis to less than 10,000 km has the potential to reduce the emissions by more than a quarter. As stated in earlier discussion, policies that promote ride sharing and use of public transport can be an effective way of reducing vehicle mileage. The other co-benefits of reducing the number of vehicles on the road include reduced air pollution that has a positive impact on people’s health and reduction in motor vehicle accidents [37]. Vehicle emissions in this case can also be mitigated by reducing vehicle congestion on the roads [29]. High congestion increases vehicle fuel consumption and GHG emissions. This is the case in South Africa, especially in Gauteng Province during peak hours like 06:00 to 09:00 and 15:00 to 18:00 on major national roads (e.g., the N1 between Pretoria and Johannesburg). By solving the issue of traffic congestion, the country will benefit through reduced unproductive time spent on the road as well as reduction in tailpipe emissions leading to air pollution [38]. A comprehensive approach is needed towards solving the problem because increasing the number of lanes connecting major cities in Gauteng did not solve the issue entirely. One of the suggested ways of improving operational efficiency of urban emissions in Gauteng is the introduction of truck banning in peak hours [39]. This can have an impact on our economy but the effects of it are not well understood and if the government considers this policy its implementation has to ensure that the delivery of services is not hampered [40]. A study by Wang et al. [41] suggested that the use of congestion carbon tax can help mitigate emissions during peak hours as it reduces GHG emissions and diverts motorists to public transportation.

3.2.3. Projected CO2 Emissions for High Economic Growth Case

The high economic growth case of an accelerated increase in vehicle population shows a rise in CO2 of close to 60% when there are no mitigation options being implemented in the province (Scenario B). This exponential growth in vehicle numbers can only be realized if there is significant economic growth in South Africa. Even under the mitigation 1 option, the GHG emissions still increase by over 35% in comparison with the 2018 estimates. The other options, Scenarios 2 and 3, show relatively high increases of 38% and 41% in GHG emissions respectively. It can be argued from these results that the government should not allow this case to be realized in future regardless of the economic situation. This can be achieved by putting in place the necessary measures that can promote sharing of transport and also through improved efficiency of public transport and other means.
There could also be the introduction of a hefty carbon tax on ICE vehicles by a certain year. A carbon tax can be introduced in a number of ways: the most common is by inserting an extra fuel levy and the other is by introducing an extra charge over and above the annual vehicle licence renewal fee that is proportional to the car’s emission profile [42]. The former method is the desired approach as it will penalize motorists depending on their driving pattern, routes and timing of their trips. The use of one standard charge would present an unfair charge for those people owning vehicles, but relying heavily on public transport for their day-to-day travel.
In cases of an ever increasing rise in the number of vehicles, mitigation can be a three-pronged approach looking at vehicle energy use efficiency, distance travelled and fuel content [43]. Even though recent studies have shown that there is a drastic improvement in energy efficiency and fuel content with reduction of sulphur in most fuels, this is not having a significant reduction as vehicle distance travelled has been increasing with time. According to Lewis et al. [43] vehicle distances travelled per year have been increasing at a faster rate than the population thus nullifying the efforts made in other initiatives. All measures that can assist in reducing emissions from passenger transport while the pressure for increase in CO2 over time increases due to population growth will ensure that our society is responsible and tackles the threat posed to human existence on Earth by climate change.

4. Conclusions

Historical results obtained show that CO2 emissions from motorcars have been increasing significantly since 2000 to date with an annual rate of 4%. This rate of increase is higher than the rate that was reported by earlier studies. Petrol vehicles remain the main source of emissions in Gauteng Province. Different emission scenarios present various possibilities. The majority of scenarios show a peak in emissions and the beginning of a decline towards the end of the 2020s. Mitigation scenarios show instant reduction of motorcar emissions except for a baseline which shows constant emissions over time. Business as usual and high economic growth scenarios present continuous growth of emissions until they climax and start to decline between 2027 and 2029, except for baseline scenarios.
Production of CO2 emissions from motorcars in Gauteng will continue to increase during the current decade. The impact of electric vehicles and other broader mitigation activities may only be realized around 2030. The province needs to invest more in EV technologies and infrastructure if quicker mitigation benefits are to be realized. The marketing of EVs and provision of incentives to consumers are encouraged. Full benefits of EV technologies can be achieved if the vehicles are powered through renewable energy resources. Existing policy instruments about green transport in the country have to be implemented, particularly now that both the renewable energy and EV industries are in their infancy and there is potential to improve their alignments so that mutual benefits are achieved.

Author Contributions

Conceptualization, M.E.M.; formal analysis, M.E.M. and M.I.T. writing—original draft preparation, M.E.M. and M.I.T.; writing—review and editing, M.E.M. and M.I.T. All authors have read and agreed to the published version of the manuscript.

Funding

This research received no external funding.

Acknowledgments

Phumzile Maluleke, Teboho Masupha and Sewela Malaka are thanked for helping with data collection. The editorial inputs of Thomas Fyfield are gratefully acknowledged.

Conflicts of Interest

The authors declare no conflict of interest.

References

  1. Barker, T. Climate Change 2007: An Assessment of the Intergovernmental Panel on Climate Change. Change 2007, 446, 12–17. [Google Scholar]
  2. Hoegh-Guldberg, O.; Brown, S.; Camilloni, I.; Diedhiou, A.; Djalante, R.; Ebi, K.L.; Engelbrecht, F.; Guiot, J.; Hijioka, Y.; Mehrotra, S.; et al. Impacts of 1.5 °C Global Warming on Natural and Human Systems. In Global Warming of 1.5 °C: An IPCC Special Report on the Impacts of Global Warming of 1.5 C above Pre-industrial Levels and Related Global Greenhouse Gas Emission Pathways, in the Context of Strengthening the Global Response to the Threat of Climate Change, Sustainable Development, and Efforts to Eradicate Poverty; MassonDelmotte, V., Zhai, P., Pörtner, H.-O., Roberts, D., Skea, J., Shukla, P.R., Pirani, A., Moufouma-Okia, W., Péan, C., Pidcock, R., et al., Eds.; Intergovernmental Panel on Climate Change: Geneva, Switzerland, 2018. [Google Scholar]
  3. Contestabile, M.; Alajaji, M. Will current electric vehicle policy lead to cost-effective electrification of passenger car transport? Green Energy Technol. 2018, 110, 75–99. [Google Scholar]
  4. Sims, R.; Schaeffer, R.; Creutzig, F.; Cruz-Núñez, X.; D’Agosto, M.; Dimitriu, D.; Figueroa Meza, M.J.; Fulton, L.; Kobayashi, S.; Lah, O.; et al. Transport. In Climate Change 2014: Mitigation of Climate Change. Contribution of Working Group III to the Fifth Assessment Report of the Intergovernmental Panel on Climate Change; Edenhofer, O., Pichs-Madruga, R., Sokona, Y., Farahani, E., Kadner, S., Seyboth, K., Adler, A., Baum, I., Brunner, S., Eickemeier, P., et al., Eds.; Cambridge University Press: Cambridge, UK; New York, NY, USA, 2014. [Google Scholar]
  5. Palander, T.; Kärhä, K. Improving energy efficiency in a synchronized road-transportation system by using a TFMC (transportation fleet-management control) in Finland. Energies 2019, 12, 670. [Google Scholar] [CrossRef] [Green Version]
  6. Alton, T.; Arndt, C.; Davies, R.; Hartley, F.; Makrelov, K.; Thurlow, J.; Ubogu, D. Introducing carbon taxes in South Africa. Appl. Energy 2014, 116, 344–354. [Google Scholar] [CrossRef] [Green Version]
  7. UNFCCC Paris Agreement. United Nations Framework Convention on Climate Change; UNFCCC Paris Agreemen, Bonn, Germany. 2015. Available online: https://unfccc.int/files/essential_background/convention/application/pdf/english_paris_agreement.pdf (accessed on 14 July 2018).
  8. Ahjum, F.; Merven, B.; Stone, A.; Caetano, T. Road transport vehicles in South Africa towards 2050: Factors influencing technology choice and implications for fuel supply. J. Energy S. Afr. 2018, 29, 33–50. [Google Scholar] [CrossRef] [Green Version]
  9. Delucchi, M.A.; Yang, C.; Burke, A.F.; Ogden, J.M.; Kurani, K.; Kessler, J.; Sperling, D. An assessment of electric vehicles: Technology, infrastructure requirements, greenhouse-gas emissions, petroleum use, material use, lifetime cost, consumer acceptance and policy initiatives. Philos. Trans. R. Soc. A Math. Phys. Eng. Sci. 2014, 372, 20120325. [Google Scholar] [CrossRef] [Green Version]
  10. Department of Environmental Affairs. GHG Inventory for South Africa 2000-2010; Department of Environmental Affairs: Pretoria, South Africa, 2014. [Google Scholar]
  11. Tongwane, M.; Piketh, S.; Stevens, L.; Ramotubei, T. Greenhouse gas emissions from road transport in South Africa and Lesotho between 2000 and 2009. Transp. Res. Part D Transp. Environ. 2015, 37, 1–13. [Google Scholar] [CrossRef]
  12. Department of Transport. Green Transport Strategy 2018–2050; Department of Transport: Pretoria, South Africa, 2018. [Google Scholar]
  13. Ou, S.; Hao, X.; Lin, Z.; Wang, H.; Bouchard, J.; He, X.; Przesmitzki, S.; Wu, Z.; Zheng, J.; Lv, R.; et al. Light-duty plug-in electric vehicles in China: An overview on the market and its comparisons to the United States. Renew. Sustain. Energy Rev. 2019, 112, 747–761. [Google Scholar] [CrossRef]
  14. Liu, L.; Kong, F.; Liu, X.; Peng, Y.; Wang, Q. A review on electric vehicles interacting with renewable energy in smart grid. Renew. Sustain. Energy Rev. 2015, 51, 648–661. [Google Scholar] [CrossRef]
  15. Li, X.; Chen, P.; Wang, X. Impacts of renewables and socioeconomic factors on electric vehicle demands–Panel data studies across 14 countries. Energy Policy 2017, 109, 473–478. [Google Scholar] [CrossRef]
  16. IEA. Global EV outlook to Electric Mobility; International Energy Agency: Paris, France, 2019. [Google Scholar]
  17. Posada, F. South Africa’s New Passenger Vehicle CO2 Emission Standards: Baseline Determination and Benefits Assessment; International Council on Clean Transportation: Washington, DC, USA, 2018. [Google Scholar]
  18. Schotte, S.; Zizzamia, R.; Leibbrandt, M. A poverty dynamics approach to social stratification: The South African case. World Dev. 2018, 110, 88–103. [Google Scholar] [CrossRef]
  19. Pillay, N.S.; Brent, A.C.; Musango, J.K.; van Geems, F. Using a System Dynamics Modelling Process to Determine the Impact of eCar, eBus and eTruck Market Penetration on Carbon Emissions in South Africa. Energies 2020, 13, 575. [Google Scholar] [CrossRef] [Green Version]
  20. Statistics South Africa. Mid-Year Population Estimates 2018; Statistics South Africa: Pretoria, South Africa, 2018. [Google Scholar]
  21. Gauteng Info, “Gauteng Information,” Johannesburg, South Africa. 2018. Available online: https://www.gauteng-info.co.za/provinces/info (accessed on 23 May 2018).
  22. Goyns, P.H. Modelling Real-World Driving, Fuel Consumption and Emissions of Passenger Vehicles: A Case Study in Johannesburg. Ph.D. Thesis, University of Johannesburg, Johannesburg, South Africa, 2008; p. 223. [Google Scholar]
  23. Tongwane, M. Transport Sector Greenhouse Gas Inventory for South Africa for the base year 2009; University of Witwatersrand: Johannesburg, South Africa, 2013. [Google Scholar]
  24. IPCC. Emissions: Enery, Road Transport. Good Pract. Guid. Uncertain. Manag. Natl. Greenh. Gas Invent. 2007, 55–70. [Google Scholar]
  25. van Rensburg, J.; Krygsman, S. Running dry-assessing the fuel levy as a long-term, economically efficient road-use fund. In Proceedings of the 34th Annual Southern African Transport Conference, Pretoria, South Africa, 6–9 July 2015; pp. 25–26. [Google Scholar]
  26. XLSTAT. ARIMA. 2018. Available online: https://www.xlstat.com/en/solutions/features/arima (accessed on 17 September 2018).
  27. Government of South Africa. South Africa’s Intended Nationally Determined Contribution; Government of South Africa: Pretoria, South Africa, 2015. [Google Scholar]
  28. Smith, S. By the numbers: We take a closer look at the BMW i brand. Car Mag News 2018, 1–8. [Google Scholar]
  29. Dugmore, H. SA’s Groundbreaking Solar Charging System for Electric Vehicles. Available online: https://heatherdugmore.co.za/sas-groundbreaking-solar-charging-system-for-electric-vehicles/ (accessed on 24 April 2020).
  30. ESI-Africa SA Unveils Funding Scheme to Drive EV Charging Infrastructure. Available online: https://www.esi-africa.com/news/sa-unveils-funding-scheme-to-drive-ev-charging-infrastructure/ (accessed on 24 April 2020).
  31. eNaTIS. 30 September 2018—Live Vehicle Population as per the National Traffic Information System. 2018. Available online: http://www.enatis.com/ (accessed on 12 June 2019).
  32. eNaTIS. Live Vehicle Population as per the National Traffic Information System. 2010. Available online: http://www.enatis.com/ (accessed on 26 September 2017).
  33. eNaTIS. Live Vehicle Population as per the National Traffic Information System. 2014. Available online: http://www.enatis.com/ (accessed on 26 September 2017).
  34. eNaTIS. “31 December 2013—Live vehicle population as per the National Traffic Information System.” 2013, pp. 55–60. Available online: http://www.enatis.com/ (accessed on 26 September 2017).
  35. eNaTIS. 31 December 2011—Live vehicle population as per the National Traffic Information System. 2011. Available online: http://www.enatis.com/ (accessed on 26 September 2017).
  36. RTMC. Vehicle Population. 2010. Available online: http://www.rtmc.co.za/RTMC/TReports.jsp (accessed on 25 March 2011).
  37. Woodcock, J.; Edwards, P.; Tonne, C.; Armstrong, B.G.; Ashiru, O.; Banister, D.; Beevers, S.; Chalabi, Z.; Chowdhury, Z.; Cohen, A.; et al. Public health benefits of strategies to reduce greenhouse-gas emissions: Urban land transport. Lancet 2009, 374, 1930–1943. [Google Scholar] [CrossRef]
  38. Bharadwaj, S.; Ballare, S.; Rohit, C.M.; Chandel, M.K. Impact of congestion on greenhouse gas emissions for road transport in Mumbai metropolitan region. Transp. Res. Procedia 2017, 25, 3542–3555. [Google Scholar] [CrossRef]
  39. Rush-hour truck ban: SA economy at risk ? Wheels24 News 2015, 1–6.
  40. Castro, J.T.; Kuse, Y.; Hyodo, T. A Study on the Impact and Effectiveness of the Truck Ban Scheme in Metro Manila. J. East. Asia Soc. Transp. Stud. 2003, 5, 2177–2192. [Google Scholar]
  41. Wang, J.; Chi, L.; Hu, X.; Zhou, H. Urban traffic congestion pricing model with the consideration of carbon emissions cost. Sustainability 2014, 6, 676–691. [Google Scholar] [CrossRef] [Green Version]
  42. Bureau, B. Distributional effects of a carbon tax on car fuels in France. Energy Econ. 2011, 33, 121–130. [Google Scholar] [CrossRef] [Green Version]
  43. Lewis, R.; Zako, R.; Biddle, A.; Isbell, R. Reducing Greenhouse Gas Emissions from Transportation and Land Use: Lessons from West Coast States. J. Transp. Land Use 2018, 11, 343–366. [Google Scholar] [CrossRef]
Figure 1. Map of Gauteng showing the five districts.
Atmosphere 11 00591 g001
Figure 2. Gauteng passenger vehicle annual population estimates from 2018 to 2030.
Atmosphere 11 00591 g002
Figure 3. Comparison of different CO2 emission scenarios for passenger vehicles in Gauteng between 2020 and 2030 (where Mit_SC1 = Mitigation scenario 1; Mit_SC2 = Mitigation scenario 1; Mit_SC3 = Mitigation scenario 3; BAU_SC1 = Business as usual scenario 1; BAU_SC2 = Business as usual scenario 1; BAU_SC3 = Business as usual scenario 3; HEC_SC1 = High economic growth scenario 1; HEC_SC2 = High economic growth scenario 1; HEC_SC3 = High economic growth scenario 3).
Atmosphere 11 00591 g003
Figure 4. Annual CO2 emissions per vehicle class from year 2000 to 2017 for all the scenarios and different vehicle types (where 1 = mini car (petrol); 2 = small vehicle (diesel); 3 = small vehicle (petrol); 4 = lower medium vehicle (diesel); 5 = lower medium vehicle (petrol); 6 = medium vehicle (diesel); 7 = medium vehicle (petrol); 8 = upper medium vehicle (diesel); 9 = upper medium vehicle (petrol); 10 = sport vehicle (diesel); 11 = sport vehicle (petrol); 12 = offroad vehicle (diesel); 13 = offroad vehicle (petrol); 14 = MPV (diesel); 15 = MPV (petrol); 16 = SUV (diesel); 17 = SUV (petrol)).
Atmosphere 11 00591 g004
Table 1. Disaggregated profiles of motorcars in Gauteng and national average CO2 emission factors [11,16,22].
Vehicle ClassNumber of VehiclesNumber Using Fuel Type (%)Emission Factor (g CO2/km)
DieselPetrolDieselPetrolDieselPetrol
Hybrid (HEV)-----110
Plug-in Hybrid (PHEV)-----50
Mini0238,38108-125
Small167,165816,1575.6127.39120140
Lower medium106,378519,3733.5717.43118148
Medium35,459173,1241.195.81118138
Upper medium506624,7320.170.83135165
Sport10,13149,4640.341.66130180
Off-road15,19774,1960.512.49128149
Multi-purpose vehicle (MPV)20,26298,9280.683.32165198
Sport utility vehicle (SUV)106,378519,3733.5717.43182180
Total466,0362,513,72815.6484.36--
Table 2. Coefficients used in determining different scenarios (y(x)) of projected market penetration of electric vehicles in Gauteng from 2018 to 2030.
CoefficientsScenario 1Scenario 2Scenario 3Scenario B
HEVPHEVBEVHEVPHEVBEVHEVPHEVBEVHEVPHEVBEV
y(1)0.0370.0080.0120.0370.0080.0120.0370.0080.0120.0370.0080.012
y(12)551051051055000
a0.02460.00470.00670.02460.00440.00730.02320.00470.00730.02320.00470.0073
b1.5051.7101.7511.5051.8121.6531.5951.7101.6531.5951.7101.653
y(x) = abx; where y is the market penetration and x in the year increment with 2018 as the base (e.g., if estimating for 2025, x = 2025–2018). (hybrid electric vehicle = HEV; Plug-in hybrid electric vehicle = PHEV; battery electric vehicle = BEV).
Table 3. Number of registered motorcars and annual distance travelled in Gauteng Province.
YearNumber of MotorcarsAnnual Distance Travelled (km)
20001,619,32115,065
20011,656,85114,866
20021,683,59914,668
20031,733,47414,752
20041,793,56014,967
20051,907,65614,452
20062,042,81113,546
20072,155,74812,982
20082,201,39711,994
20092,256,78011,878
20102,361,78211,878 a
20112,454,89411,878 a
20122,562,59411,878 a
20132,676,08011,878 a
20142,773,84711,878 a
20152,859,62311,878 a
20162,931,29911,878 a
20172,979,764-
a Values assumed constant from 2009.
Table 4. Annual CO2 emissions per motor vehicle class from year 2000 to 2018.
YearEmissions by Motor Vehicle Class (Gg CO2/year)
1234567891011121314151617Total
2000256.9101.71068.363.7718.721.2223.43.538.26.783.29.9103.417.0183.198.2874.13871.2
2001262.9104.11093.165.1735.421.7228.63.539.06.885.210.1105.817.3187.4100.5894.43960.9
2002267.1105.81110.866.2747.222.1232.23.639.76.986.610.3107.517.6190.4102.1908.84024.9
2003275.1108.91143.768.2769.422.7239.13.740.87.289.110.6110.718.2196.1105.1935.74144.1
2004284.6112.71183.370.5796.023.5247.43.842.37.492.210.9114.518.8202.9108.8968.24287.7
2005302.7119.91258.675.0846.725.0263.24.144.97.998.111.6121.820.0215.8115.71029.74560.5
2006324.1128.41347.780.3906.726.8281.84.448.18.4105.012.4130.421.4231.0123.91102.74883.6
2007342.1135.51422.384.8956.828.3297.44.650.88.9110.813.1137.622.6243.8130.71163.75153.6
2008349.3138.31452.486.6977.028.9303.74.751.99.1113.213.4140.523.1249.0133.51188.35262.7
2009358.1141.81488.988.71001.629.6311.34.853.29.3116.013.7144.123.6255.2136.91218.25395.1
2010374.7148.41558.292.91048.231.0325.85.155.69.7121.414.4150.824.7267.1143.21274.95646.2
2011389.5154.31619.696.51089.632.2338.65.357.810.1126.215.0156.725.7277.6148.91325.15868.8
2012406.6161.01690.7100.81137.433.6353.55.560.410.6131.715.6163.626.8289.8155.41383.36126.2
2013424.6168.11765.5105.21187.735.1369.25.763.111.0137.616.3170.828.0302.7162.31444.56397.5
2014440.1174.31830.0109.11231.136.4382.65.965.411.4142.616.9177.129.0313.7168.21497.36631.3
2015453.7179.71886.6112.41269.237.5394.56.167.411.8147.017.4182.529.9323.4173.41543.66836.3
2016465.1184.21933.9115.31301.038.4404.46.369.112.1150.717.9187.130.7331.5177.81582.37007.7
2017472.8187.21965.9117.21322.539.1411.16.470.212.3153.218.2190.231.2337.0180.71608.57123.5
2018481.6190.72002.5119.31347.139.8418.76.571.512.5156.018.5193.731.8343.3184.11638.47256.1
1 = mini car (petrol); 2 = small vehicle (diesel); 3 = small vehicle (petrol); 4 = lower medium vehicle (diesel); 5 = lower medium vehicle (petrol); 6 = medium vehicle (diesel); 7 = medium vehicle (petrol); 8 = upper medium vehicle (diesel); 9 = upper medium vehicle (petrol); 10 = sport vehicle (diesel); 11 = sport vehicle (petrol); 12 = offroad vehicle (diesel); 13 = offroad vehicle (petrol); 14 = MPV vehicle (diesel); 15 = MPV vehicle (petrol); 16 = SUV vehicle (diesel); 17 = SUV vehicle (petrol).
Table 5. Mann–Kendall trend test/two-tailed test (total emissions).
Kendall’s tau1
S153.000
Var(S)697.000
p-value (Two-tailed)<0.0001
alpha0.05

