Article

Irrigation Groundwater Quality Characteristics: A Case Study of Cyprus

by
Georgios Nikolaou
1,*,
Damianos Neocleous
2,
Christos Christophi
3,
Theodosia Heracleous
3 and
Marinos Markou
2
1
Rural Development and Environment, Department of Agriculture, Ministry of Agriculture, 1412 Nicosia, Cyprus
2
Rural Development and Environment, Agricultural Research Institute, Ministry of Agriculture, 1516 Nicosia, Cyprus
3
Rural Development and Environment, Cyprus Geological Survey, Ministry of Agriculture, 2064 Nicosia, Cyprus
*
Author to whom correspondence should be addressed.
Atmosphere 2020, 11(3), 302; https://doi.org/10.3390/atmos11030302
Submission received: 24 February 2020 / Revised: 13 March 2020 / Accepted: 18 March 2020 / Published: 20 March 2020
(This article belongs to the Special Issue Adaptation of Cyprus Agriculture to Climate Change)

Abstract

:
This study was conducted in order to investigate possible quality changes in Cyprus’ groundwater resources over a 10-year period of pumping and to check the suitability of primary irrigation water. Water samples (n = 890) from private wells in agricultural areas were analyzed from 2009 to 2018 to determine various physicochemical properties. The sodium adsorption ratio (SAR) and residual sodium carbonate (RSC) were also calculated to evaluate potential soil degradation issues. Sodium, chloride and sulphate were found to be the predominant ions in groundwater. Quality evaluation showed possible restrictions in groundwater use for irrigation in relation to its salt content and the toxicity of specific ions having adverse effects on sensitive and several moderately sensitive crops. In particular, an increasing trend was observed in pumped groundwater for boron ion concentrations. Nevertheless, all samples evaluated were suitable for irrigation in terms of soil sodicitation and soil infiltration rate. This study indicates that in order to maintain long-term agricultural sustainability it is imperative to develop strategic plants to mitigate the adverse effects of water-pumped quality deterioration on soils and crops. Precision agriculture techniques may be adapted for better water and nutrient input/output management, thus protecting groundwater from salinization in agricultural areas. These results, among others, may be a useful tool to enhance the ability of Cyprus’s agricultural water sector to adapt to observed and anticipated climate impacts.

1. Introduction

Scarcity of water resources has always been a concern in arid and semi-arid regions, and threatens the sustainability of agricultural crops [1]. In particular, the southern and eastern Mediterranean rim are considered among the most water-scarce regions globally, and face significant temperature increases and declines in precipitation rates [2,3,4]. In those areas, agriculture is highly dependent on water availability, which often comes from overexploited aquifers [5,6]. The overexploitation of groundwater resources has resulted in the lowering of the water levels, groundwater quality deterioration and/or seawater intrusion [7,8,9]. About 10 million hectares worldwide are abandoned every year due to soil salinization, and it is estimated that by 2050 more than 50% of arable land will potentially have serious soil quality issues [10,11,12]. In the Mediterranean region, irrigated agriculture constitutes the main water-consumption sector associated with land degradation, with soil salinization being a widespread problem [4,13]. In fact, groundwater quality has been shown to affect crop yield and water productivity, and therefore is of great environmental and economical concern. Water containing high concentrations of soluble salts can be absorbed and accumulated through leaves and different plant organs, causing specific ion toxicities [14]. For example, water and nutrient balance is negatively affected by root-zone salinity, resulting in water stress symptoms and nutrient deficiencies (e.g., tomato blossom-end rot). Nevertheless, supplying nutrients along with irrigation water, which is of a common agricultural practice (i.e., ferti-irrigation) should also take into consideration regional differences in water quality characteristics [7,15,16]. Indeed, high concentrations of soluble salts and nutrients in groundwater should be considered for optimizing fertigation management, with a special emphasis on nitrate pollution in vulnerable zones (NVZs), and on cultivation of high-value sensitive crops Similarly, high pH values may reduce micronutrient availability (e.g., iron, zinc, manganese) to crops [17]. Furthermore, precipitation or slime growth within an irrigation system is enhanced in calcium-, bicarbonate- and sulphate-rich irrigation waters, thus increasing the possibility of emitter/trickle clogging [18]. On the contrary, water salinity offers possibilities of controlling produce quality, yield and resistance of crops to diseases [19]. For example, irrigation with seawater mixed with rainwater improves the fruit quality of grapevines and increases soil pH in acidic vineyard soils [20]. Similarly, irrigation with diluted seawater has been found to increase the nutritional value of various vegetables such as cherry tomatoes [21,22].
A salinity-tolerance classification schema for agricultural crops and an anticipated percentage-yield decrease per unit of salinity increase (above a threshold value) were proposed by Mass and Hoffman [23]. Actually, the salinity problem occurs when the concentration of salts in the soil solution exceeds the crops’ minimum salt tolerance level, which varies by crop type [24]. For example, no yield decline is expected for salt tolerant crops like barley (Hordeum vulgare) and cotton (Gossypium hirsutum) when the irrigation water salinity increases up to 5 dS m−1. However, a 50% reduction in production is expected for both crops when water salinity rises up to 12 dS m−1. Similarly, Ranatunga et al. [25] suggested that water salinity levels up to 11 dS m−1 could be applied to salt-tolerant crop; however, a higher percentage of good quality water is needed for periodically leaching salts below the root zone in order to maintain crop productivity. On the contrary, strawberry (Fragaria sp.) is considered a very sensitive crop and the recommended irrigation water salinity for maximum production is set below 0.7 dS m−1. To cope with water scarcity and salinity problems, many irrigation districts have to make use of several conventional and non-conventional water sources (e.g., desalinated, wastewater, brackish), adding a higher level of water complexity management [26].
Cyprus faces the most severe water scarcity problem in Europe, and is exploiting groundwater beyond what has been set as the ecological limit [27,28]. It is evident that Cyprus is expected to experience the most adverse climate change effects of any Eastern Mediterranean country, including temperature increases and changes in precipitation [3]. Irrigated agriculture is particularly vulnerable to climate conditions due to its dependence on adequate quantities of good-quality water during a significant portion of a year. However, groundwater resources in Cyprus, which in many cases are the preliminary source of irrigation water, are overexploited by about 40% of sustainable extraction [29]. Under these conditions, groundwater quality deterioration may limit its suitability for specific crop cultivations and could affect the physical properties of soil (e.g., soil degradation). To date, there has been no satisfactory scientific evidence to support that the quality of groundwater is changing in relation to its total salinity levels, specific ion toxicity, other specific water indices) (e.g., Sodium Adsorption Ratio, SAR; Residual Sodium Carbonate, RSC) and other problems (e.g., nitrogen concentrations) in relation to potential soil degradation issues and possible adverse effects on crops; however, Eleftheriou et al. [28] evaluated 1200 groundwater samples in Cyprus and detected high boron values (i.e., 9 to 12 ppm) that were geogenic, rather than resulting from wastewater applications or seawater intrusion. According to Georgiou et al. [30], the increasing trend of boron, which has been observed in groundwater concentrations in the country’s capital over the past three decades, is the result of over pumping; therefore, it was suggested that if water is intended to be used for the irrigation of sensitive trees (e.g., fruit trees), it should be appropriately treated.
In view of the above, the aim of this study is to investigate possible quality deterioration issues surrounding pumped groundwater used for irrigation purposes in a semi-arid zone over a 10-year period of pumping. A second objective is to evaluate the suitability of groundwater relative to its salt content, specific ion toxicity and hazard to crops, in order to avoid exacerbating water and food shortages.

2. Materials and Methods
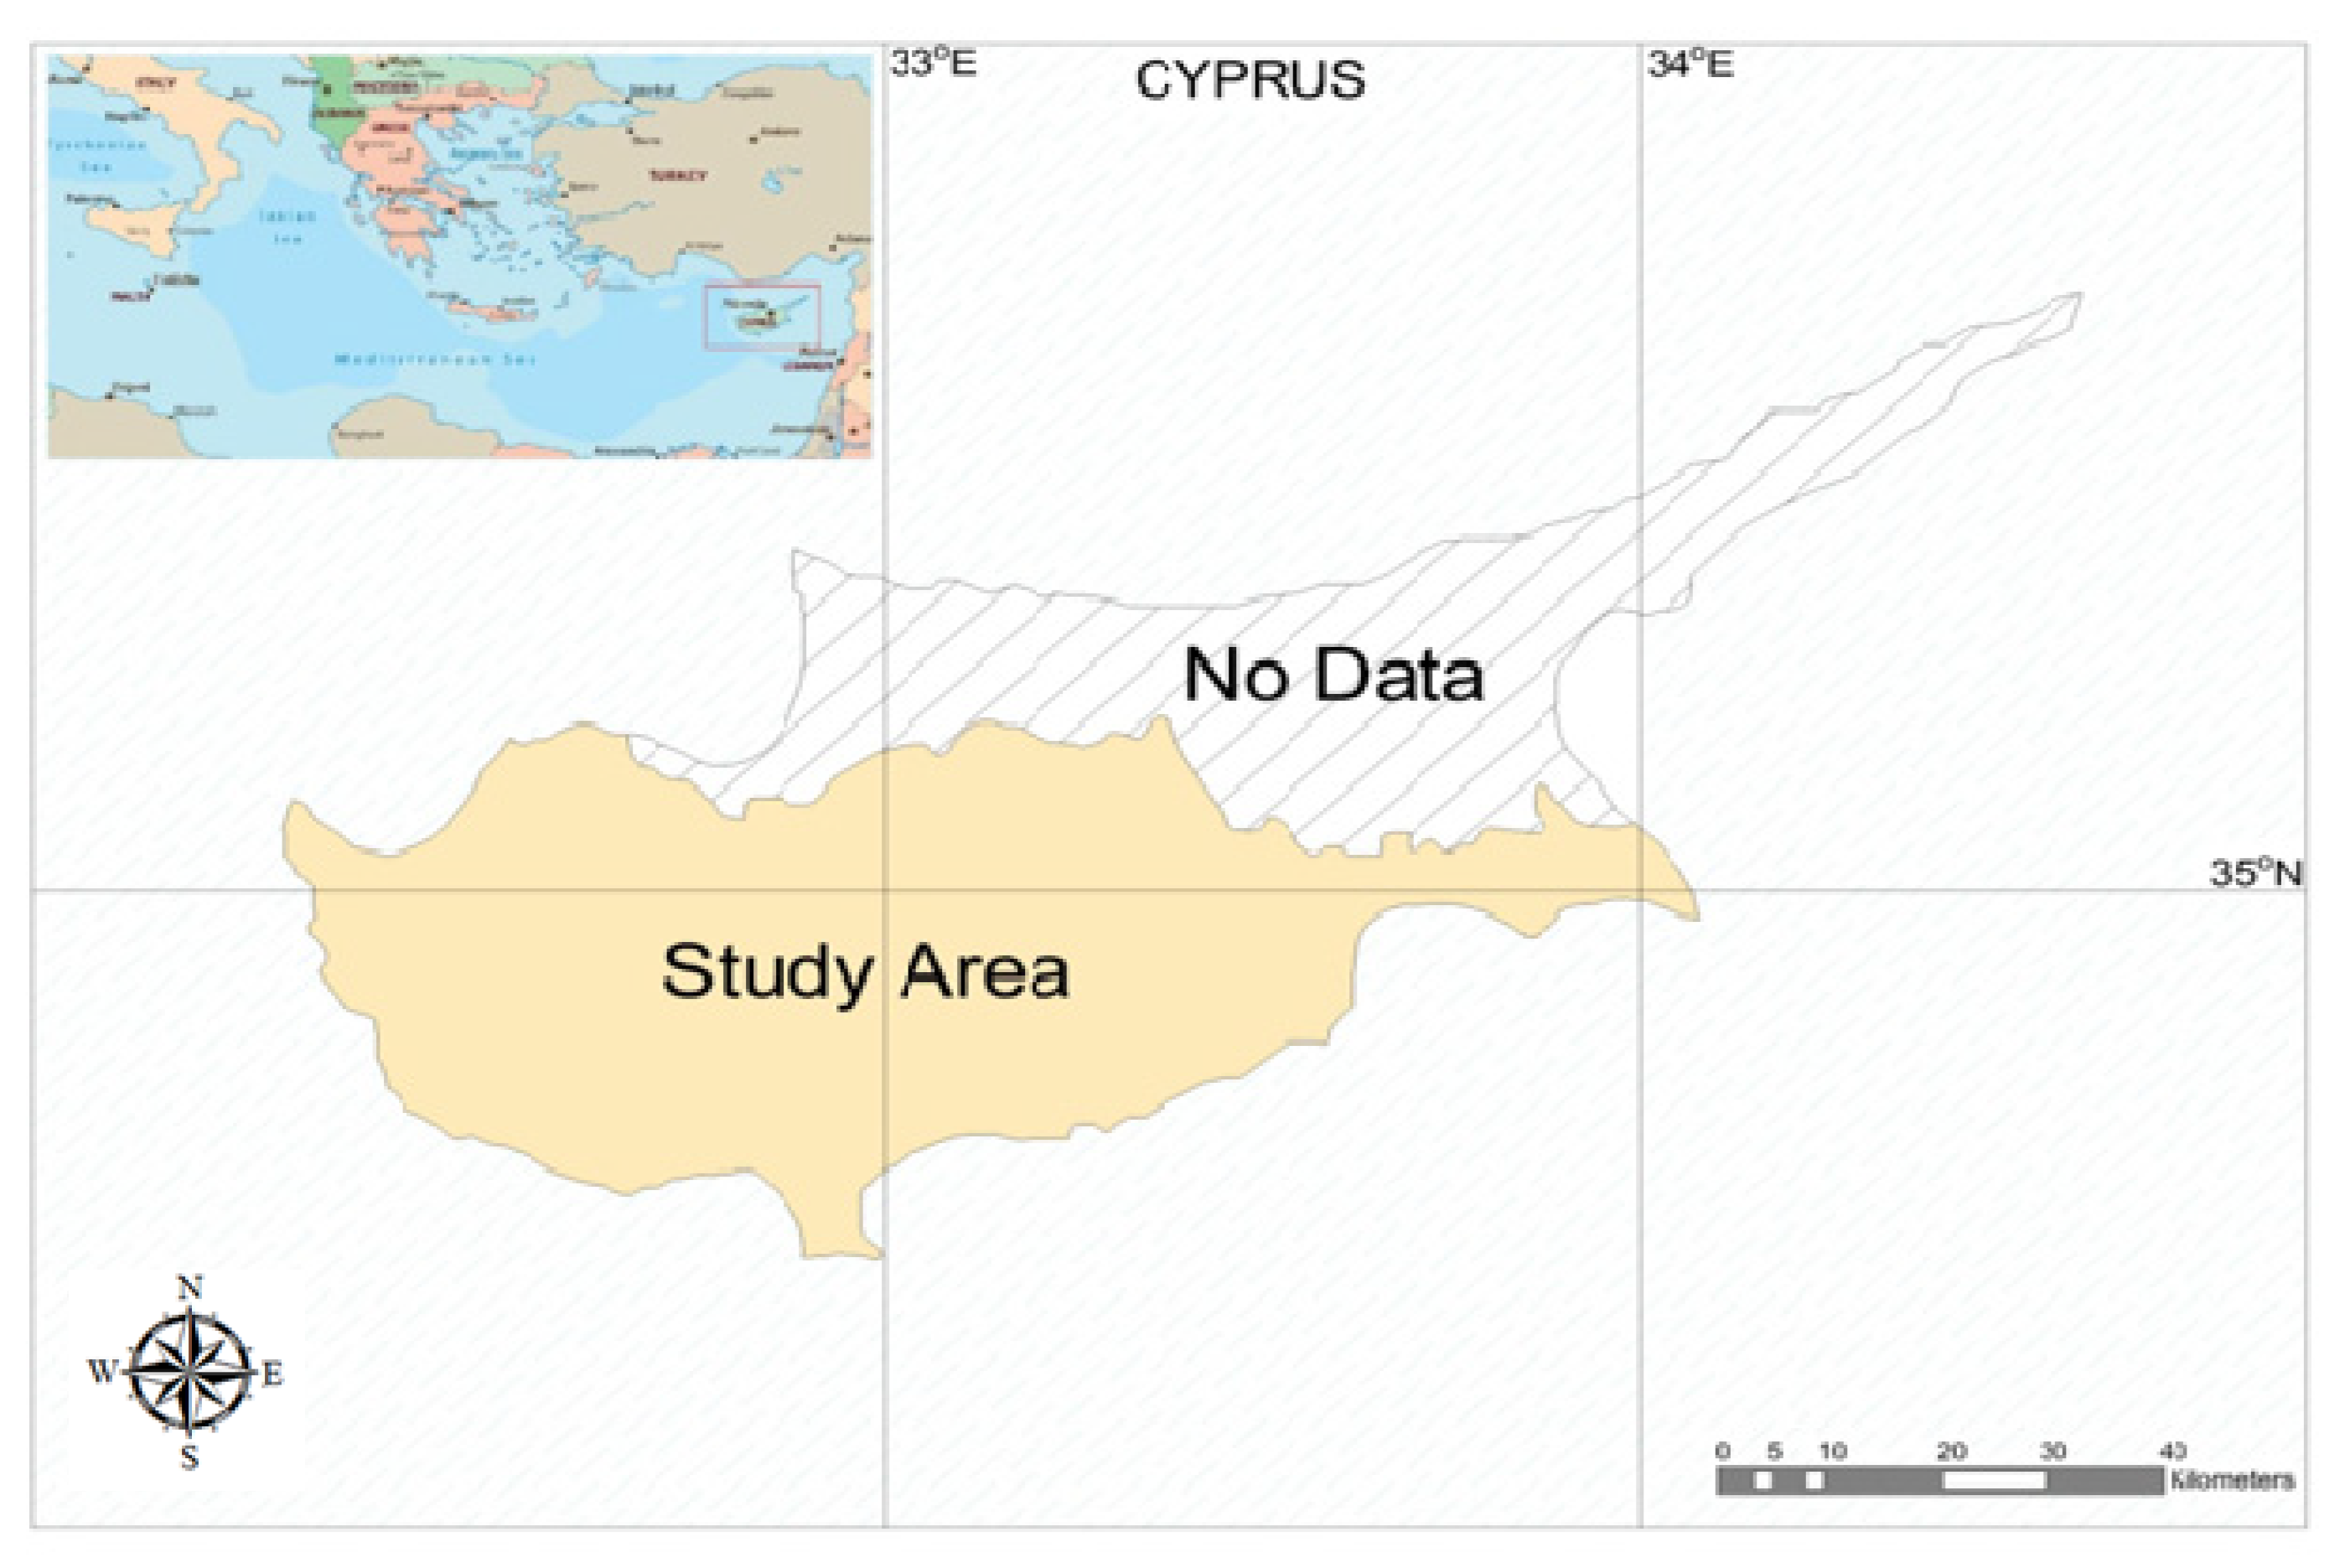
2.1. Study Area

Cyprus is located in the Northeastern end of the Mediterranean basin (Figure 1). It is the third largest island in the Mediterranean Sea, with an average area of 9251 Km−2. The average annual precipitation is 476 mm (no perennial flow) and evapotranspiration varies between 1243 and 1722 mm, depending on the elevation, with 75% of evapotranspiration occurring from May to October [31]. The annual irrigation needs of the region have been estimated at 150 million m3, a third of which is satisfied through governmental water works (surface dams and irrigation water networks) while the rest is from private-owned water wells [32]. Cyprus has a total of 61 aquifers, with 44 of them over-pumped [29]. It is estimated that there are more than 5000 wells in the region. Long-term pumping (147 million m3 y−1) for irrigation and domestic water use has resulted in a continuous reduction of underground water reserves and qualitative degradation and salination from seawater intrusion [32]. Cyprus has defined one River Basin District (since 2006, under the implementation of the Water Framework Directive (WFD)—Directive 2000/60/EC) in the study area.
A compact group of mountains called the Troodos Mountains are the predominant, NW–SE topographic feature in the central part of the island. They are a part of an ancient oceanic crust that was created 91.6 (+/−1.4) million years ago during the Cretaceous. Their uplifting during the Plio-Pleistocene, caused substantial fracturing of the ophiolite, thus increasing secondary porosity and facilitating groundwater percolation and recharge of the Troodos fractured aquifer. Surrounding Troodos are the circum Troodos sediments, which consist mainly of semi-permeable chalks, marls and limestones of the Lefkara Formation (Maastrichtian to Lower Miocene) and Pakhna Formation (Middle to Upper Miocene). These sediments, along with the highly permeable sandstones, sands, silts, clays and gravels of the Pliocene to Quaternary deposits, host the most important sedimentary aquifers of the island [33].
The utilized agricultural area consists of 116,000 ha, while the irrigated land is about 35,000 ha. Modern, high water-application efficiency irrigation systems (e.g., mini sprinklers, drippers, low capacity sprinklers) have been used for the last 40 years to an estimated proportion of 95% of the total irrigated land and are ideally suited for combined irrigation and fertigation (ferti-irrigation) [34]. The major irrigated crops are citrus (2800 ha), fruit crops (e.g., apples, apricots, bananas; 3100 ha) and vegetables (e.g., potatoes, water melon, eggplants, strawberries; 6400 ha). Olive trees, grapes and forage crops are also cultivated and partly irrigated. Cotton was one of the oldest cultivated crops until the 1950s, with a total cultivated area of 1400 ha, but this was gradually abandoned due to a reduced availability of spring water for irrigation [35]. Similarly, tobacco was cultivated in a total area of 2400 ha until the late 1960s. However, adverse climatic conditions and lack of adequate soil moisture causing failures during transplanting led to an abandonment of crops [36]. Locally, irrigation requirements are calculated based on a Class A evaporation-pan methodology adopted from Cyprus Agricultural Research Institute [37] following Allen et al. [38]. For example, the mean yearly evapotranspiration rate (i.e., crop water requirements) for high water-demanding crops such as bananas is estimated at 1255 mm, for citrus it is 846 mm and for olive trees (which is considered a low water-demanding crop) it is 430 mm. The irrigation period usually starts in April or May and ends in October.

2.2. Groundwater Sampling and Analysis

A total of 890 groundwater samples were randomly collected from private wells operated in agricultural irrigated land in the study area from 2009 to 2018. Each sample was collected in a 1-L polyethylene bottle after at least 20 min of pumping. Samples were kept cool and transferred immediately to a laboratory to be analyzed. Physiochemical parameters such pH and electrical conductivity (EC) were measured using a multimeter in the lab. Water cations and anions were determined according to the common laboratory methods of titrimetry, flamephotometry and ultraviolet-visible spectrophotometry [39].

2.3. Groundwater Quality Evaluation Indices

Guidelines for evaluating water quality were based on water-quality-related problems in irrigated agriculture according to Food and Agricultural Organization-FAO [40] and, in particular: salinity, water infiltration rate, specific ion toxicity (sodium, chloride and boron) and miscellaneous effects (nitrates, bicarbonates, pH). The quality of pumped groundwater used for irrigation was evaluated relative to its salt content expressed in units of electrical conductivity and hazard to crops (Table 1). The guidelines of assessing permissible levels of electrical conductivity (EC; water salinity) and specific water ion toxicity threshold values for several agricultural crops [23,40,41] are presented (Table 2, Table 3 and Table 4). Selected crops were classified based on irrigation water relative salinity value without reduction in yield, and the percentage of yield reduction per unit increase in salinity (Table 2). Maximum permissible concentrations of chlorides in irrigation water of some crops are presented in Table 3. Accordingly, the relative boron tolerance of selected crops is tabulated in Table 4.
Potential soil sodicity risk and pore clogging estimates were based on calculation of the Sodium Adsorption Ratio (SAR) and the Residual Sodium Carbonate (RSC), using the results of ions’ chemical analyses according to Equations (1) and (2) [44,45,46]. A value of the suitability of irrigation water based on those indices is given in Table 5.
S A R = Na + Ca 2 + + Mg 2 + 2
R S C = [ ( H C O 3 + C O 3 ) ( C a 2 + + M g 2 + ) ]
where SAR is the sodium absorption ratio, Na+ is sodium concentration, Ca2+ is calcium concentration, Mg2+ is magnesium concentration, RSC is residual sodium carbonate; HCO3 is bicarbonate concentration, CO3 is carbonate concentration and all concentrations are in meg l−1. The effects of EC and SAR on the soil infiltration rate were evaluated as originally proposed by Richards [45] (Figure 2).

2.4. Statistical Analysis

Data were analyzed and comparisons of means were tested using ANOVA via a Statistical Package for the Social Sciences (IBM Corp. Released 2011. IBM SPSS Statistics for Windows, Version 20.0. IBM Corp, Armonk, NY, USA).

3. Results

Mean annual values of the groundwater salinity, alkalinity and sodicity indices for a period of 10 years from 2009 to 2018 are presented in Table 6 and plotted in Figure 3. Electrical conductivity (EC) averaged 2.53 dS m−1 with a minimum of 0.3 dS m−1 and a maximum of 27.6 dS m−1. During 2009, 35% of samples analyzed were above the average EC value. Five years later, the percentage increased to 40%, and by the year 2018 it was 46% (data not shown). Chloride and sulphate were found to be the most predominant anions, with mean values of 438.83 mg L−1 and 395.86 mg L−1, respectively. Sodium was the predominant cation with an average value of 338.73 mg L−1, with the macronutrients calcium, magnesium and nitrogen being of importance. The concentrations of ions contributing to water salinity were found in the decreasing order of Na+, Ca2+, Mg2+ and K+ for cations, and Cl, SO42, HCO3, NO3 and CO3 for anions. Groundwater nitrate-nitrogen, boron and pH showed significant variations (p < 0.05) among years. However, an increasing trend was only detected for boron concentrations (Figure 3). Yearly mean boron concentrations ranged from 0.83 to 1.29 mg L−1, with an overall mean for the 10 years’ period of about 1.00 mg L−1. During the final year of the studying period (i.e., 2018), 34% of samples were above the mean estimated value of boron (data not shown). The mean value of 43.3 mg L−1 determined for nitrates was below the maximum permissible nitrate levels of 50 mg L−1 according to the EU directives related to quality of water (Figure 3). The pH value of groundwater samples indicated their alkaline nature with a mean estimated value of 7.59. Variations in nutrient concentrations during the measurement period were observed for potassium, calcium and magnesium, even though values in 2018 seem to be slightly increased from 2009 concentrations (Figure 3). The mean estimated values were 13.37 mg L−1 for potassium, 123.50 mg L−1 for calcium and 66.20 mg L−1 for magnesium. Similar yearly concentration variations within the measurement period were also identified for chloride and sulphate ions, as well as for nitrates and carbonates (Figure 3 and Table 6). It should be pointed out that seasonality or monthly differences in ion concentrations were not statistically significant, except for bicarbonate concentrations.
A linear regression analysis was developed with electrical conductivity as a dependent variable and specific water ions as predictors. The correlation coefficient of determination (R2) for a number of observations (n = 890) was relatively high and accounted for chloride 0.89, sodium 0.83, sulphate 0.67 and potassium 0.57 (Figure 4).
Mean values of the Sodium Absorption Ratio (SAR) and Residual Sodium Carbonate (RSC) indicate that all the samples tested were suitable for irrigation (Table 6). Negative value numbers of RSC resulted from relatively high concentrations of calcium and magnesium ions as opposed to bicarbonates. The influence of water salinity and the SAR did not pose a problem to the soil infiltration rate (Figure 2).

4. Discussion

Based on the proposed guidelines for assessing permissible levels of salinity, it is clear from the results that there was a moderate degree of restricting groundwater for irrigation due to its expected adverse effects on many crops, thus requiring careful management practices (Table 2). Salinity (in waters or soils) reduces water availability to the crops, and thus yield is affected. Taking into consideration the mean measured electrical conductivity value at present (averaging 2.53 dS m−1), restrictions of maximum growth and production are expected for all sensitive and several moderately sensitive crops (Table 2). It is worth nothing that irrigation water concentrates approximately three times as it becomes soil water. Thus, the salinity of the soil saturation extract is 1.5× higher than that of irrigation water salinity. In such irrigated soils, the concentration of soluble salts increases the soil solution’s osmotic pressure, leading to the condition of physiological drought in a crop [42]. According to the literature [41]. In addition to irrigation groundwater quality, another important issue that should be taken into consideration is the economic productivity of water, measuring of the economic value generated by a unit of water consumption. For example, citrus is one of the major irrigated crops classified as a “salt-sensitive” crop, and high concentrations of salts seriously affect its productivity. Taking into account the expected yield reduction for each unit of electrical conductivity that increases beyond the threshold value, it is estimated that citrus’ economic water productivity is expected to decline 25% [43], resulting in export revenue losses. Indeed, a decline in orange yield was observed during the study period based on relevant data from FAO Statistical Databases, FAOSTAT [49], although a combination of problems may affect crop production more severely in some cases than just water quality problems. The concentration of salts in soil increases with higher water application rates directly related to crop evapotranspiration. It is to be expected that as irrigation water is increasingly removed by crop transpiration and soil evaporation, more salts are left behind [38]. Taking into account the mean measured electrical conductivity values of water, we can conclude that for a high water demanding crop like alfalfa (1200 mm), almost 20 metric tons of salts are added to 1 ha of soil during the irrigation period, with chloride, sodium and sulphate being the predominant ions. For this reason, evaluation of the problem and its solution must be implemented in most cases according to specific local conditions (e.g., irrigation timing, leaching etc.).
The results presented in this study imply that over a 10-year period of pumping, significant quality changes regarding boron ion concentrations were detected in pumped groundwater. The average value for boron within the 10-year study period increased to 1 mg L−1, which is considered to be the maximum permissible threshold value for all crops categorized as “sensitive” such as citrus fruits, deciduous trees, strawberries and sweet potatoes. Of these crops, trees are the more sensitive, and damage often occurs at low ion concentrations because of the higher amount of water uptake. Like salinity, high quantities of boron adversely affect sensitive crops in many arid and semiarid regions [50]. Usually, small concentrations of boron are necessary for optimal plant growth; however, slightly elevated values negatively affect crop growth, and beyond this range boron becomes toxic [51]. Interestingly, boron tends to accumulate in soils to a greater extent than do other soluble salts, and thus irrigation water can produce toxic effects even at low concentrations if accumulation of boron occurs. On the other hand, higher levels of boron may be tolerated by plants grown in soils that are high in lime (as opposed to those grown in non-calcareous soils) [50], and negative impacts on crops may be ameliorated in the presence of chlorides and sulphate salts in some cases [52]. Furthermore, it should be ruled out that interactions between salinity and boron toxicity adversely affect sensitive crops in many arid and semiarid climates [50].
In addition to boron, sodium and chloride in groundwater should also be taken into consideration, as high concentrations can cause restrictions on optimal growth and production, especially for sensitive crops such as citrus. In addition, high sodium water content weakens soil structure, affecting the porosity of soil. In this study, chlorides in groundwater averaged 450 mg L−1, a concentration that is above the maximum permissible level recommended without yield loss for several crops like beans, carrots and onions (Table 3). Similarly, the effect of high sulphate concentrations in water has frequently been associated with negative impacts of increased potassium and sodium absorption due to the tendency of high sulphate concentrations to limit the uptake of calcium by plants [45]. However, Metochis [53] evaluated the effects of applying high-sulphate water to grapefruit trees during a six-year period under local conditions, which supported a claim that this is not actually a serious problem. Beside the fact that trees have a tendency to be smaller, the yield per tree was similar to those irrigated with lower salinity water in the absence of sulphate, although this was not the case when greenhouse tomato crops were irrigated with sulphate water [54]. The constant non-leachable salinity created was rather low, as the accumulation of calcium and sulphate above gypsum solubility products was prevented via precipitation.
Another factor to be taken into account is the nitrates’ appearance in the groundwater. Indeed, the main source of nitrates in groundwater is chemical fertilizers and treated wastewater in irrigated agricultural areas [55]. Analyses have also demonstrated that nitrates in aquifers are a worldwide environmental problem contributing to water scarcity [56] and that, in particular, the risk of nitrates leaching into deep unsaturated zones increases with extensive fertilizer applications to vegetables with shallow root developments, even though nitro-pollution is more likely to occur under traditional surface irrigation method systems as opposed to new improved irrigation systems [57]. There is also a controversy in the literature that the extended use of highly efficiency irrigation systems could potentially lead to an increase in total irrigated areas and enhance extraction of groundwater resources [58]. In any case, real-time in situ nitrate measurements with optical sensors can re-adjust fertilizer-application regimes and have been shown to minimize the potential of groundwater contamination [56]. In this study, the dominant nutrients in tested samples were calcium (Ca2+) and magnesium (Mg2+), while potassium (K+) was very low. However, extreme ratios of Na+/Ca2+ in the root environment may adversely affect crops in a manner that would not occur otherwise under normal saline conditions.
In order to maintain optimum crop productivity levels and avoid soil salinization, there is a need for regular soil electrical conductivity measurements and frequent salt-leaching programs based on irrigation water salinity and crop specific salt tolerance. In any case, the drainage fraction of leaching should be maintained to the absolute necessary amount for minimizing water waste and fertilizer, nitrate and phosphate washout to the environment [59]. Nevertheless, salt leaching is not always a case with respect to boron, which may accumulate undissolved in soil rather than remaining in a solution to drain [45]. Indeed, boron is considered one of the micronutrients that causes a serious problem in soil management [51]. Secondary soil salinization due to the upward movement of poor quality groundwater did not seem to represent a problem in our study, but is expected to occur when a groundwater “critical depth” table is shallower than 1.5 m [60].
Besides leaching, several other management options are available for controlling excess salinity and the toxicity of specific ions. Indeed, the appropriate selection of an irrigation method, the timing of irrigation and crop rotation seem to enhance the use of saline water substantially [40]. Drip irrigation combined with higher irrigation frequency improves water efficiency and potential crop benefits under saline conditions. In-line mixing of different proportions and water qualities (i.e., a saline and a non-saline water; blended water) is of a common agricultural practice [61,62]. Beyond that, a water of good quality can be used only under specific circumstances at critical crop stages during a cultivating season. In the case of high concentrations of boron, excess nitrogen is used to stimulate new growth in citrus trees, as boron has a tendency to accumulate in older leaves. In any case, under low-evapotranspiration demands (e.g., mulching, screen-houses) crops have indicated higher tolerance to soil salinity [62].
Groundwater salinization due to irrigated agriculture could be an issue in the future, especially in intensive agricultural areas. In fact, there is a direct link between increasing nitrate and sulphate concentrations in groundwater and excessive fertilizer use [48]. Even if groundwater is of a higher salinity than the recharging water, long-term adverse effects may still occur; however, the observable effects may be delayed for quite a few years due to the long travel times of salt in groundwater through unsaturated zones [8]. In any case, the application of subsurface and surface drainage networks safeguard soil and groundwater aquifers from salinization [63]. Overall, the adaptation of smart farming techniques (i.e., precision agriculture) such as Internet of Things (IoT) applications will reduce production costs and improve yields through the efficient use of resources such as water and fertilizers [64,65].
Finally yet importantly, the sources and mechanisms behind such increases in salinity or salinity–boron interactions were not investigated further. It is acknowledged that groundwater salinization may be the result of seawater intrusion into coastal aquifers, of increased contributions of connate water in over-pumped aquifers, or simply the effect of returning irrigation. Furthermore, the ion trends that were identified were not based on continuous groundwater monitoring from a dedicated monitoring network, but rather on sampled private boreholes in cultivated areas, as pointed out elsewhere. Nonetheless, the extent and sources of potential groundwater deterioration is beyond the scope of this paper; rather, the suitability of the de facto irrigation water was the main focus.

5. Conclusions

In the present study, we evaluated the suitability of groundwater used for irrigation and investigated possible quality deterioration issues over a 10-year period of pumping. Groundwater quality evaluation showed that potential risks/hazards can be expected for many sensitive and moderately sensitive irrigated crops. For this reason, careful management practices selecting suitable alternatives to cope with water-related problems are required at the farm level to maintain acceptable crop yields. A tendency of increasing groundwater boron concentrations emphasizes the long-term potential problems for optimum production of the majority of the crops. The information presented herein highlights the importance of agricultural production restructuring (i.e., limitations in choice of crop to maintain full production capability) based on water availability and quality. Precision agriculture and multi-criteria decision support systems for optimizing water productivity and minimizing outflow should be adapted at the farm level. The findings of the study could contribute to targeted measures under the Cyprus National Adaptation Action Plan, where water management plays a central and crucial role.

Author Contributions

Conceptualization, G.N. and D.N.; Formal analysis, G.N.; Investigation, G.N.; Methodology, G.N. and D.N.; Supervision, Μ.Μ.; Writing—review & editing, G.N., D.N., M.M., C.C. and T.H. All authors have read and agreed to the published version of the manuscript.

Funding

Adaptation to Climate change Impacts on the Mediterranean islands’ Agriculture—ADAPT2CLIMA”. LIFE Project Number: LIFE14 CCA/GR/000928.

Conflicts of Interest

The authors declare no conflict of interest.

References

  1. Sánchez-Molina, J.A.; Rodríguez, F.; Guzmán, J.L.; Ramírez-Arias, J.A. Water Content Virtual Sensor for Tomatoes in Coconut Coir Substrate for Irrigation Control Design. Agric. Water Manag. 2015, 151, 114–125. [Google Scholar] [CrossRef]
  2. Diffenbaugh, N.S.; Pal, J.S.; Giorgi, F.; Gao, X. Heat Stress Intensification in the Mediterranean Climate Change Hotspot. Geophys. Res. Lett. 2007, 34, 1–6. [Google Scholar] [CrossRef] [Green Version]
  3. Zachariadis, T. Climate Change in Cyprus; Review of the Impacts and Outline of an Adaptation Strategy, Springer Briefs in Environmental Science; Springer International Publishing: Cham, Switzerland, 2016. [Google Scholar] [CrossRef]
  4. Daccache, A.; Ciurana, J.S.; Rodriguez Diaz, J.A.; Knox, J.W. Water and Energy Footprint of Irrigated Agriculture in the Mediterranean Region. Environ. Res. Lett. 2014, 9, 1–12. [Google Scholar] [CrossRef]
  5. Thompson, R.B.; Gallardo, M.; Valdez, L.C.; Fernandez, M.D. Using Plant Water Status to Define Threshold Values for Irrigation Management of Vegetable Crops Using Soil Moisture Sensors. Agric. Water Manag. 2007, 88, 147–158. [Google Scholar] [CrossRef]
  6. Michael, G.; Antonelli, M.; Greco, F. Opportunity Costs of Virtual Water: A Justification for Green-Water Based Agricultural Capacity Growth for Economic, Social and Environmental Sustainability. In: Water Footprint Applications for Water Resource Management in Agriculture. Guest Editors, Marta, A.D., Nejedlik, R., Altobelli, F. Ital. J. Agrometeorol. 2015, 3, 49–58. [Google Scholar]
  7. Garcia-Caparros, P.; Contreras, J.; Baeza, R.; Segura, M.; Lao, M. Integral Management of Irrigation Water in Intensive Horticultural Systems of Almería. Sustainability 2017, 9, 2271. [Google Scholar] [CrossRef] [Green Version]
  8. Suarez, D.L. Impact of Agricultural Practices on Groundwater Salinity. Agric. Ecosyst. Environ. 1989, 26, 215–227. [Google Scholar] [CrossRef]
  9. Levidow, L.; Zaccaria, D.; Maia, R.; Vivas, E.; Todorovic, M.; Scardigno, A. Improving Water-Efficient Irrigation: Prospects and Difficulties of Innovative Practices. Agric. Water Manag. 2014, 146, 84–94. [Google Scholar] [CrossRef] [Green Version]
  10. Barik, R.; Pattanayak, S.K. Assessment of Groundwater Quality for Irrigation of Green Spaces in the Rourkela City of Odisha, India. Groundw. Sustain. Dev. 2019, 8, 428–438. [Google Scholar] [CrossRef]
  11. Yumurtaci, A. Utilization of Wild Relatives of Wheat, Barley, Maize and Oat in Developing Abiotic and Biotic Stress Tolerant New Varieties. Emir. J. Food Agric. 2015, 27, 1–14. [Google Scholar] [CrossRef]
  12. Savvas, D.; Ntatsi, G.; Barouchas, P.E. Soil Conservation, Soil Fertility and Plant Nutrition Management. In Good Agricultural Practices for Greenhouse Vegetable Production in the South East European Countries—Principles for Sustainable Intensification of Smallholder Farms; Plant Production and Protection Paper 230; FAO: Rome, Italy, 2017; pp. 53–79. [Google Scholar]
  13. Eitzinger, J.; Alexandrou, V.; Utset, A.; Saylan, L. Factors Determining Crop Water Productivity in Agricultural Crop Production—A Review. In: Water Footprint Applications for Water Resource Management in Agricultural; Guest Editors, Marta, A.D., Nejedlik, R., Altobelli, F. Ital. J. Agrometereol. 2015, 15–29. [Google Scholar]
  14. McFarland, M.L.; Provin, T.L.; Redmon, L.A.; Boellstorff, D.A.; McDonald, A.K.; Stein, L.A.; Wherley, B.G. An Index of Salinity and Boron Tolerance of Common Native and Introduced Plant Species in Texas. Soil and Water Salinity and Boron Thresholds for Selected Trees, Shrubs, Turfgrasses, Ornamental Ground Covers, Fruits and Nut Crops, Vegetables, Flowers, Herbaceous Crops, Field Grasses, Forages, and Field Crops; Texas A&M Agrilife Extension: College Station, TX, USA, 2014; pp. 3–45. [Google Scholar]
  15. Breś, W.; Kleiber, T.; Trelka, T. Quality of Water Used for Drip Irrigation and Fertigation of Horticultural Plants. Folia Hortic. 2010, 22, 67–74. [Google Scholar] [CrossRef] [Green Version]
  16. Ben-Gal, A.; Ityel, E.; Dudley, L.; Cohen, S.; Yermiyahu, U.; Presnov, E.; Zigmond, L.; Shani, U. Effect of Irrigation Water Salinity on Transpiration and on Leaching Requirements: A Case Study for Bell Peppers. Agric. Water Manag. 2008, 95, 587–597. [Google Scholar] [CrossRef]
  17. Papadopoulos, I. Efficient Fertilizer Use in Pressurized Irrigation Systems. In Agricultural Research Institute, Ministry of Agriculture, Natural Resources and the Environment; Miscellaneous Reports 93; Press and Information Office: Nicosia, Cyprus, 2006; pp. 1–10. [Google Scholar]
  18. Gilbert, G.; Ford, H.W. Operational Principles, Emitter Clogging. In Trickle Irrigation for Crop Production. Design, Operation and Management; Nakayama, F.S., Bucks, D.A., Eds.; Developments in Agricultural Design; Elsevier Science Publishers B.V.: Amsterdam, The Netherlands, 1986. [Google Scholar]
  19. Shannon, M.C.; Grieve, C.M. Tolerance of Vegetable Crops to Salinity. Sci. Hortic. 1998, 78, 5–38. [Google Scholar] [CrossRef]
  20. Liu, C.; Huang, L.P.; Liu, M.L.; Hao, S.Q.; Zhai, H.; Shao, X.J.; Du, Y.P. Effects of Seawater Irrigation on Fruit Quality of Grapevine, Soil Properties and Microbial Diversity. Sci. Hortic. 2019, 253, 80–86. [Google Scholar] [CrossRef]
  21. Sgherri, C.; Kadlecová, Z.; Pardossi, A.; Navari-Izzo, F.; Izzo, R. Irrigation with Diluted Seawater Improves the Nutritional Value of Cherry Tomatoes. J. Agric. Food Chem. 2008, 56, 3391–3397. [Google Scholar] [CrossRef]
  22. Magán, J.J.; Moreno, N.; Meca, D.; Cánovas, F. Response to Salinity of a Tomato Crop in Mediterranean Climate Conditions. Acta Hortic. 2004, 644, 479–484. [Google Scholar] [CrossRef]
  23. Maas, E.V.; Hoffman, G.J. Crop Salt Tolerance—Current Assessment. J. Irrig. Drain. Div. 1977, 103, 115–134. [Google Scholar]
  24. Bouaroudj, S.; Menad, A.; Bounamous, A.; Ali-Khodja, H.; Weigel, D.A.; Chenchouni, H. Assessment of Water Quality at the Largest Dam in Algeria (Beni Haroun Dam) and Effects of Irrigation on Soil Characteristics of Agricultural Lands. Chemosphere 2019, 219, 76–88. [Google Scholar] [CrossRef]
  25. Ranatunga, K.; Nation, E.R.; Barodien, G. Potential Use of Saline Groundwater for Irrigation in the Murray Hydrogeological Basin of Australia. Environ. Modell. Softw. 2010, 25, 1188–1196. [Google Scholar] [CrossRef]
  26. Reca, J.; Trillo, C.; Sánchez, J.A.; Martínez, J.; Valera, D. Optimization Model for On-Farm Irrigation Management of Mediterranean Greenhouse Crops Using Desalinated and Saline Water from Different Sources. Agric. Syst. 2018, 166, 173–183. [Google Scholar] [CrossRef]
  27. Eurostat. Online Information on the Water Exploitation Index. 2015. Available online: http://Ec.Europa.Eu/Eurostat/En/Web/Products-Datasets/-/TSDNR310 (accessed on 7 October 2018).
  28. Eleftheriou, P. Boron in Groundwater of the Island of Cyprus. J. Environ. Hydrol. 2001, 9, 1–5. [Google Scholar]
  29. Demetriou, C.; Georgiou, A. Management of Groundwater Resources in Cyprus—Harmonisation with the EU Water Framework Directive. In Proceedings of the BALWOIS 2004, Ohrid, Republic of Macedonia, 25–29 May 2004; Volume 1. [Google Scholar]
  30. Georghiou, G.; Pashalidis, I. Boron in Groundwaters of Nicosia (Cyprus) and Its Treatment by Reverse Osmosis. Desalination 2007, 215, 104–110. [Google Scholar] [CrossRef]
  31. Tsiourtis, N.X.; Photiou, C.; Hajispyrou, E.; Pashardes, P.; Rostandi, N. Application of the Drought Management Guidelines in Cyprus. In Drought Management Guidelines Technical Annex; Iglesias, A., Moneo, M., Lopez-Francos, A., Eds.; CIHEAM: Zaragoza, Spain, 2007; pp. 215–245. [Google Scholar]
  32. DK Consultants Engineers, & Planners S.A.; ECOS Consulting S.A. River Basin Management Plan of Cyprus for the Implementation of the Directive 2000/60/ΕC (Period 2016-2021), Consulting Services for the Elaboration of the 2nd River Management Plan of Cyprus, for the Implementation of Directive 200/60/EC, and for the Elaboration of the Flood Risk Management Plan for the Implementation of the Directive 2007/60/EC; ECOS Consulting S.A.: Athina, Greece, 2014; Volume 2016, pp. 1–442. [Google Scholar]
  33. Christofi, C.; Bruggeman, A.; Kuells, C.; Constantinou, C. Hydrochemical Evolution of Groundwater in Gabbro of the Troodos Fractured Aquifer. A Comprehensive Approach. Appl. Geochem. 2020, 114, 104524. [Google Scholar] [CrossRef]
  34. Chimonidou, D.; Metochis, C.; Papadopoulos, I. Irrigation Systems Performance: Case Study of Cyprus. In Irrigation Systems Performance; Lamaddalena, N., Lebdi, F., Todorovic, M., Bogliotti, C., Eds.; Options Méditerranéennes: Série, B. Etudes et Recherches, n. 52; CIHEAM: Bari, Italy, 2005; pp. 79–84. [Google Scholar]
  35. Josephides, C.M. Performance of Selected Cotton Varieties under Cyprus Conditions; Technical Bulletin; Agricultural Research Institute, Ministry of Agriculture and Natural Resources. Issued by the Press and Information Office: Nicosia, Cyprus, 1989; Volume 3, pp. 1–9.
  36. Papasolomontos, A. Annual Report of the Department of Agriculture for the Year; Department of Agriculture, Ministry of Agriculture and Natural Resources: Strovolos, Cyprus, 1968; pp. 3–107.
  37. Christou, A.; Dalias, P.; Neocleous, D. Spatial and Temporal Variations in Evapotranspiration and Net Water Requirements of Typical Mediterranean Crops on the Island of Cyprus. J. Agric. Nat. Resour. 2017, 155, 1311–1323. [Google Scholar] [CrossRef]
  38. Allen, R.; Pereira, L.; Raes, D.; Smith, M. Crop Evapotranspiration Guidelines for Computing Crop Water Requirements; FAO Irrigation and Drainage Paper, 56; FAO: Rome, Italy, 1998; pp. 1–289. [Google Scholar]
  39. Estefan, G.; Sommer, R.; Ryan, J. Methods of Soil, Plant and Water Analysis: A Manual for the West Asia and North Africa Region, 3rd ed.; International Center for Agricultural Research in the Dry Areas: Beirut, Lebanon, 2013. [Google Scholar]
  40. Ayers, R.S.; Westcot, D.W. Water Quality for Agriculture; FAO Irrigation and Drainage Paper; FAO: Rome, Italy, 1989; Volume 29, ISBN 92-5-102263-1. [Google Scholar]
  41. Maas, E.V. Crop Salt Tolerance. In Agricultural Salinity Assessment and Management, ASCE Manual Reports on Engineering Practices; Tanji, K.K., Ed.; ASCE: New York, NY, USA, 1990; Volume 71, pp. 262–304. [Google Scholar]
  42. Zaman, M.; Shahid, S.A.; Heng, L. Irrigation Water Quality. In Guideline for Salinity Assessment, Mitigation and Adaptation Using Nuclear and Related Technique; Springer: Cham, Switzerland, 2018; pp. 113–131. [Google Scholar]
  43. Markou, M.; Papadavid, G. Norm Input -Output Data for the Main Crop and Livestock Enterprises of Cyprus. Agric. Econ. 2007, 46, 0379–0827. [Google Scholar]
  44. Smith, C.J.; Oster, J.D.; Sposito, G. Potassium and Magnesium in Irrigation Water Quality Assessment. Agric. Water Manag. 2015, 157, 59–64. [Google Scholar] [CrossRef]
  45. Richards, L.A. Diagnosis and Improvement of Saline Alkali Soils, Agriculture, Handbook 60; US Department of Agriculture: Washington, DC, USA, 1954; pp. 1–160.
  46. Eaton, F.M. Significance of Carbonate in Irrigation Water. Soil Sci. 1950, 69, 123–133. [Google Scholar] [CrossRef]
  47. Olubanjo, O.O.; Alade, E. Evaluation of Irrigation Water Quality from Major Water Sources in Ondo and Osun States, Nigeria. J. Exp. Agric. Int. 2018, 24, 1–12. [Google Scholar] [CrossRef]
  48. Iqbal, J.; Nazzal, Y.; Howari, F.; Xavier, C.; Yousef, A. Hydrochemical Processes Determining the Groundwater Quality for Irrigation Use in an Arid Environment: The Case of Liwa Aquifer, Abu Dhabi, United Arab Emirates. Groundw. Sustain. Dev. 2018, 7, 212–219. [Google Scholar] [CrossRef]
  49. Food and Agricultural Organization (FAO). 2020. Available online: http://www.Fao.Org/Faostat/En/#home (accessed on 8 March 2020).
  50. Lauchi, A.; Grattan, A.S.R. Plant growth and development under salinity stress. In Advances in Molecular Breeding towards Drought and Salt Tolerance Crops; Jenks, M.A., Hassegawa, P.M., Jain, S.M., Eds.; Springer: Berlin/Heidelberg, Germany, 2007; pp. 1–32. [Google Scholar]
  51. Kebede, F.; Hollington, P. Boron Status in the Irrigated Fields of Semi Arid North Ethiopia. Researcher 2010, 2, 28–37. [Google Scholar]
  52. Smith, T.E.; Grattan, S.R.; Grieve, C.M.; Poss, J.A.; Suarez, D.L. Salinity’s Influence on Boron Toxicity in Broccoli: II. Impacts on Boron Uptake, Uptake Mechanisms and Tissue Ion Relations. Agric. Water Manag. 2010, 97, 783–791. [Google Scholar] [CrossRef]
  53. Metochis, C. Water Requirement, Yield and Fruit Quality of Grapefruit Irrigated with High-Sulphate Water. J. Hortic. Sci. 1989, 64, 733–737. [Google Scholar] [CrossRef]
  54. Papadopoulos, I. Effect of Sulphate Waters on Soil Salinity, Tomatoes. Plant Soil 1984, 81, 353–361. [Google Scholar] [CrossRef]
  55. Nejatijahromia, Z.; Nassery, H.R.; Hosono, T.; Nakhaei, M.; Alijani, F.; Okumura, A. Groundwater Nitrate Contamination in an Area Using Urban Wastewaters for Agricultural Irrigation under Arid Climate Condition, Southeast of Tehran, Iran. Agric. Water Manag. 2019, 221, 397–414. [Google Scholar] [CrossRef]
  56. Yeshno, E.; Arnon, S.; Dahan, O. Real-Time Monitoring of Nitrate in Soils as a Key for Optimization of Agricultural Productivity and Prevention of Groundwater Pollution. Hydrol. Earth Syst. Sci. 2019, 23, 3997–4010. [Google Scholar] [CrossRef] [Green Version]
  57. Juntakut, P.; Snow, D.D.; Haacker, E.M.K.; Ray, C. The Long Term Effect of Agricultural, Vadose Zone and Climatic Factors on Nitrate Contamination in Nebraska’s Groundwater System. J. Contam. Hydrol. 2019, 220, 33–48. [Google Scholar] [CrossRef]
  58. Grafton, R.Q.; Williams, J.; Perry, C.J.; Molle, F.; Ringler, C.; Steduto, P.; Udall, B.; Wheeler, S.A.; Wang, Y.; Garrick, D.; et al. The Paradox of Irrigation Efficiency. Higher Efficiency Rarely Reduces Water Consumption. Science 2018, 361, 748–750. [Google Scholar] [CrossRef] [Green Version]
  59. Savvas, D.; Akoumianakis, K.; Karapanos, I.; Kontopoulou, C.K.; Ntatsi, G.; Liontakis, A.; Akoumianakis, A. Recharging Greek Youth to Revitalize the Agriculture and Food Sector of the Greek Economy; Final Report Sectoral study 5 Vegetables: Open-Field and Greenhouse Production; Agricultural University of Athens: Athens, Greece, 2015; pp. 1–214. [Google Scholar]
  60. Luo, J.M.; Yang, F.; Wang, Y.J.; Ya, Y.J.; Deng, W.; Zhang, X.P.; Liu, Z. Mechanism of Soil Sodification at the Local Scale in Songnen Plain, Northeast China, as Affected by Shallow Groundwater Table. Arid Land Res. Manag. 2011, 25, 234–256. [Google Scholar] [CrossRef]
  61. Flowers, T.J.; Ragab, R.; Malash, N.; Gawad, G.A.; Cuartero, J.; Arslan, A. Sustainable Strategies for Irrigation in Salt Prone Mediterranean: SALTMED. Agric. Water Manag. 2005, 78, 3–14. [Google Scholar] [CrossRef]
  62. Minhas, P.S.; Ramos, T.B.; Ben-Gal, A.; Pereira, L.S. Coping with Salinity in Irrigated Agriculture: Crop Evapotranspiration and Water Management Issues. Agric. Water Manag. 2020, 227, 105832. [Google Scholar] [CrossRef]
  63. Elaty, I.; Sallam, G.A.H.; Straface, S.; Scozzari, A. Effects of Climate Change on the Design of Subsurface Drainage Systems in Coastal Aquifers in Arid/Semi-Arid Regions: Case Study of the Nile Delta. Sci. Total Environ. 2019, 672, 283–295. [Google Scholar] [CrossRef] [PubMed]
  64. Harun, A.N.; Mohamed, N.; Ahmad, R.; Rahim, A.R.A.; Ani, N.N. Improved Internet of Things (IoT) Monitoring System for Growth Optimization of Brassica Chinensis. Comput. Electron. Agric. 2019, 164, 104836. [Google Scholar] [CrossRef]
  65. Nikolaou, G.; Neocleous, D.; Katsoulas, N.; Kittas, C. Irrigation of Greenhouse Crops. Horticulturae 2019, 5, 1–20. [Google Scholar] [CrossRef] [Green Version]
Figure 1. Study area.
Atmosphere 11 00302 g001
Figure 2. Reduction in soil infiltration rate as affected by the Sodium Absorption Ratio and salinity of irrigation water.
Atmosphere 11 00302 g002
Figure 3. Changes in the mean concentration values are shown for chloride and sulphate (A) and for potassium, magnesium and sulphate ions (B). In the lower side, ion concentrations in water are plotted for boron (C) and nitrate (D). The continuous black lines represent regression lines, with a positive slope for boron and a negative slope for nitrate. The red dashed line represents the upper threshold limit of boron concentrations for all sensitive and most moderately sensitive crops. The red dashed line for nitrate represent the maximum established limits for nitrate according to the European Union directives related to good groundwater status.
Atmosphere 11 00302 g003
Figure 4. Linear regression modeling and coefficients (R2) between different ions (Chloride, Cl, (A); Sodium, Na+, (B); Sulphate, SO42−, (C); Potassium, K+, (D)) and water electrical conductivity (EC).
Atmosphere 11 00302 g004
Table 1. Guidelines of irrigation water use relative to salt content and hazard to crops cited by Zaman et al. [42].
Degree of Restriction on UseElectrical Conductivity
(dS m−1)
Salinity Hazard to Crops
None0.75No negative effects will usually be noticed
Some0.75–1.50Sensitive crops may experience detrimental effects
Moderate1.50–3.00Adverse effects on many crops, thus requiring careful management practices
Severe3.00–7.00For salt tolerance crops with specific management practices on permeable soils
Table 2. Crop salt tolerance and yield potential as affected by irrigation water salinity (dS m−1), adapted from [23]. Crop evapotranspiration (Etc; mm) and water economical productivity (WEP; € m−3) of the main cultivated crops in Cyprus [43].
CropSalinity at Initial Yield Decline% Yield Decreased Per Unit Increase in Salinity Beyond Threshold100% Yield ReductionSalt Tolerance RatingETcWEP
Almond1.5194.5S3542.39
Apricot1.6243.8S6826.98
Orange1.8165.4S8461.57
Bean greenhouse1.0194.2S45232.38
Carrot1.0145.4S4244.78
Strawberry greenhouse1.0332.7S58617.06
Strawberry open field1.0332.7S58610.27
Alfalfa27.310MS12760.56
Corn1.71210MS554na
Cowpea1.3147.8MS4491.61
Cucumber greenhouse2.5136.8MS58530.52
Cucumber open field2.5136.8MS4764.70
Cabbage1.89.78.1MS537na
Spinach2.07.610MS3717.56
Tomato greenhouse2.59.98.4MS74321.03
Sweet potato1.5117.1MSnana
Brocolli2.89.29.1MTnana
Soybean5.0206.7MT4491.61
Date palm4.33.621Tnana
Cotton7.75.218Tnana
Crop salinity tolerance rating: S, Sensitive crop; MS, Moderately Sensitive; MT, Moderately Tolerant; T, Tolerant; na; not available.
Table 3. Maximum permissible concentrations of chlorides in irrigation water without yield losses (mg L−1). Data adapted from [41].
CropCl−1 (mg L−1)CropCl−1 (mg L−1)
Bean350Spinach700
Carrot350Alfalfa700
Strawberry350Tomato875
Onion350Cucumber875
Potato525Brocolli875
Corn525Squash, Scallop1050
Cabbage525Sudan grass1050
Celery525Squash, Zucchini 1575
Pepper525Cowpea1750
Table 4. Boron tolerance of selected crops (mg L−1). Data adapted from [44].
VSSMSMTTVT
<0.50.5–0.750.75–11.0–22–44–66–15
LemonAvocadoGarlicCucumberLettuceTomatoCotton
BlackberryGrapefruitStrawberryRadishCabbageAlfalfaAsparagus
OrangeSweet potatoPotatoOatsSugar beet
ApricotPeanutCarrotMuskmelon
Peach PepperTobacco
Cherry Maize
Plum Celery
Onion
Crop boron-tolerance rating: VS, Very Sensitive; S, Sensitive crop; MS, Moderately Sensitive; MT, Moderately Tolerant; T, Tolerance; VT, Very Tolerant.
Table 5. Water quality suitability based on Sodium Adsorption Ratio (SAR) and Residual Sodium Carbonate (RSC) indices. Data adapted from [47,48].
SAR (meg L−1)RSC (meg L−1)Water Quality
<10 Excellent
10–18<1.25Good
18–261.25–2.5Doubtful
>26>2.5Unsuitable
Table 6. Average annual and 10-year values (± standard error) of groundwater salinity, alkalinity and sodicity indices.
SalinityAlkalinitySodicity
YearnECNa+CO3HCO3pHSARRSC
2009692.42 (0.24)353.86 (45.29)1.51 (0.55)293.29 (22.96)7.54 (0.05)8.60 (1.02)0.15 (0.59)
20101202.38 (0.17)318.19 (32.06)2.10 (0.58)314.86 (13.41)7.45 (0.07)8.09 (0.72)−0.22 (0.51)
2011972.41 (0.17)321.01 (32.79)5.11 (1.50)327.15 (22.47)7.76 (0.10)7.86 (0.84)0.10 (0.57)
20121112.49 (0.16)312.48 (27.02)2.21 (0.51)341.50 (12.37)7.65 (0.04)7.13 (0.66)−0.36 (0.49)
2013852.75 (0.27)380.14 (48.19)3.59 (0.81)368.39 (23.08)7.74 (0.06)8.52 (0.90)0.59 (0.66)
2014872.45 (0.18)300.48 (27.12)4.63 (1.59)330.97 (15.98)7.63 (0.05)7.086 (0.65)−0.90 (0.66)
2015972.26 (0.14)295.00 (26.32)3.53 (0.79)335.99 (15.14)7.47 (0.08)7.75 (0.79)0.01 (0.53)
2016932.60 (0.33)355.44 (66.00)4.18 (0.88)318.52 (15.43)7.64 (0.04)7.42 (0.98)−1.67 (1.00)
2017632.72 (0.34)424.86 (76.77) 3.97 (1.56)324.21 (21.87)7.59 (0.12)10.25 (1.48)0.55 (0.61)
2018683.14 (0.41)384.66 (68.30) 3.54 (1.04)320.47 (19.89)7.37 (0.07)7.48 (0.72)−1.92 (0.90)
2.53 (0.07)338.73 (13.97) 3.40 (0.32)328.31 (5.67)7.59 (0.02)7.93 (0.27)−0.36 (0.21)
Water electrical conductivity, EC (dS m−1); Sodium, Na+ (mg L−1); Carbonates, CO3 (mg L−1); Bicarbonates HCO3 (mg L−1); Hydrogen exponent (pH; scale ranges from 0 to 14); Sodium Absorption Ratio, SAR (dimless); Residual Sodium Carbonate, RSC (meg L−1).

