Review

An Overview of the Integrated Meteorological Observations in Complex Terrain Region at Dali National Climate Observatory, China

1
Dali National Climate Observatory, Dali 671003, China
2
Dali Mountain Meteorological Field Experiment Base, China Meteorological Administration, Dali 671003, China
3
State Key Laboratory Severe Weather, Chinese Academy of Meteorological Sciences, China Meteorological Administration, Beijing 100081, China
*
Author to whom correspondence should be addressed.
Atmosphere 2020, 11(3), 279; https://doi.org/10.3390/atmos11030279
Submission received: 14 February 2020 / Revised: 8 March 2020 / Accepted: 9 March 2020 / Published: 12 March 2020
(This article belongs to the Special Issue Climatological and Hydrological Processes in Mountain Regions)

Abstract

:
Systematically observing components of the climate system as well as their processes and interactions are crucial to understand the weather, climate, climate change, etc. In order to launch long-term, continuous, stereoscopic, and integrated meteorological observations for key regions of the climate system in southwestern China where it is sensitive to interactions among multiple layers and exchanges of mass and energy, the Dali National Climate Observatory (DNCO) was established in May 2006. To date, the DNCO has gradually performed an integrated meteorological observation network in a complex terrain region over the southeastern Tibetan Plateau including the conventional observations of weather and climate, and the special observations of radiation, lightning, soil moisture, wind profile, water vapor, water quality, water level, water temperature profile, turbulent fluxes of momentum, sensible heat, latent heat, carbon dioxide, and methane, etc. Furthermore, the DNCO mainly focuses on the field observation experiments and scientific research activities for mountain meteorology. This paper presents an overview of the DNCO including its location, climatology, scientific objectives, research tasks, and existing observation projects. The progresses in observation and associated research including data quality controls and assessments, recent observation results, and regional numerical model tests are summarized. Future works are also discussed.

1. Introduction

The climate system consists of five major components: the atmosphere, the hydrosphere, the cryosphere, the land surface, and the biosphere [1]. Systematically observing each component of the climate system, along with their processes and interactions, are the basis of a better understanding of the weather, climate, climate change, etc. [2]. In order to improve the understanding of the climate system and enhance climate services, the Global Climate Observing System (GCOS) was established in 1992 [3]. A global land surface climate fiducial reference measurements network was proposed to enhance the value of the existing observation network in 2018 [4]. Moreover, many countries worldwide have set up climate observatories to monitor the physical, chemical, biological, and hydrological parameters of the climate system and investigate other scientific topics. For instance, the Blue Hill Meteorological Observatory, located at the 194 m peak of Great Blue Hill in Milton, Massachusetts, USA, was built in 1884/85 for the continuous measurement of weather and climate as well as extensive atmospheric science education and outreach activities [5,6]. The Meteorological Observatory Lindenberg, located about 50 km southeast of the outskirts of Berlin, Germany, was established in 1905 for the field measurements of the vertical structure of the atmosphere and research activities [7,8,9,10]. The Sphinx Observatory, located above the Jungfraujoch in Switzerland at 3571 m, was constructed in 1936/1937 [11]. The Nepal Climate Observatory–Pyramid, located at 5079 m above sea level in the eastern Nepal Himalaya, was installed in March 2006 for the observations of trace gases, aerosols, and meteorological parameters [12,13]. The China Meteorological Administration (CMA) selected five national climate observatories: Dali in Yunnan, Zhangye in Gansu, Xilinhot in Neimenggu, Shouxian in Anhui, and Dianbai in Guangzhou, which featured “good climate representativeness, complete historical observation data, and mature basic conditions of observation stations” to conduct pilots during 2006 to 2007. In January 2019, the CMA launched 24 national climate observatories to carry out long-term, continuous, stereoscopic and integrated observations for the climate system. These 24 observatories cover typical underlying surfaces such as mountain, grassland, forest, farmland, wetland, desert, marine, lake, urban, etc., and represent the weather and climate characteristics of 16 key zones of the climate system in China where there are sensitive to interactions among multiple layers and exchanges of mass and energy. These observatories are helpful for improving the comprehensive observing capabilities of the climate system and providing data support for dealing with climate change, utilizing climate resources, and serving ecological civilization construction and social development.
Mountains account for a quarter of the Earth’s land surface [14]. They are usually characterized by large spatial variations in orography (e.g., height, length, width, slope, and orientation) and surface cover (e.g., vegetation) [15], and penetrate deeply into the atmosphere [16]. The mountainous regions give rise to various airflow phenomena such as thermally driven airflows (e.g., up- and down-slope winds, along-valley winds, cross-valley winds, mountain-plain winds, cold air pools, lake-land breezes, sea-land breezes, and glacier winds) [17,18] as well as dynamically driven airflows (e.g., mountain waves, wakes, rotors, gap winds, barrier jets, and downslope windstorms) [16,19]. The mountainous regions also alter the distribution of precipitation, and modify the patterns of turbulence, clouds, storms, fronts, and climate [16,20]. In order to capture these terrain-induced effects as well as distinctive weather and climate features, high-resolution, high-quality, and comprehensive observations in mountains are required. Moreover, fine-scale and high-density observations are essential for improving and evaluating high resolution simulations in both space and time. Nevertheless, reliable and long-term meteorological observations over complex terrain regions are limited and are lacking because of the instrumental issues, extreme environmental conditions (e.g., severe weather), the complexity of the topographic effects, and a limited representative range of a mountain station [20,21,22]. In the recent few decades, many complex-terrain field campaigns and scientific experiments were conducted over typical mountainous regions such as the First, Second, and Third Tibetan Plateau Atmospheric Scientific Experiment (TIPEX-I, II, III) [23,24,25,26], the Alpine Experiment (ALPEX) [27], the Pyrenees Experiment (PYREX) [28], the Mesoscale Alpine Project (MAP) [29], the Terrain-Induced Rotor Experiment (T-REX) [30], the Mountain Terrain Atmospheric Modeling and Observations Program (MATERHORN) [31], the Olympic Mountains Experiment (OLYMPEX) [32], the i-Box project (i-Box) [33], the Cerdanya-2017 field experiment [34], amongst others. Additionally, several mountain meteorological networks for continuous long-term observation have been in operation [21,33,35]. These observations and investigations are very beneficial for understanding the weather and climate system as well as developing a numerical weather prediction model over heterogeneous terrain.
The Dali National Climate Observatory (DNCO) was established in May 2006, which is located in the southeast extension of the Tibetan Plateau (TP), the western Yunnan Province, and watershed of Jinsha River, Yuan River, and Lancang River in China (100°10′ E, 25°42′ N, 1977.7 m above sea level; Figure 1). Generally, water vapor coming from the Bay of Bengal reaches the southeastern TP, then turns to the middle and lower area of the Yangtze River, before finally reaching Japan. The DNCO and the surrounding area are situated in the water vapor transport path of southwest China. This area is influenced by both South Asian and East Asian monsoons [36]. Furthermore, this area is not only sensitive to atmospheric adiabatic heating over the TP, but is also a difficult area to numerically model and satellite remote sensing. Apart from these, the local topographic situation around the DNCO is highly complex. The east side of the DNCO is Erhai Lake, which has an area of 252 km2 under the water level of 1966 m, with a maximum and average depth of 21.3 and 10.8 m, respectively, as well as a length of 42 km in south–north direction and a width varying from 4 to 9 km in an east–west direction. The west side of the DNCO is the Diancangshan Mountains, which approximately covers an area of 520 km2 with a length of 48.5 km and a width ranging from 13 to 20.5 km from south to north, and has a total of 19 peaks and 18 streams with the highest peak named Malong Peak, at 4122 m above sea level. The orientations of these mountains and lake are from the north–northwest to south–southeast stretch. Their maximum altitude difference is more than 2 km. This area serves as a typical representative of the small- and medium-scale terrain and is an ideal natural laboratory for the study of mountain weather and climate. Consequently, we launched integrated meteorological observations and carried out research activity in this region.
This paper provides an overview of the DNCO. In Section 2, we describe the observation network layout including its local climatology, the scientific objectives and research tasks, and existing observation projects. Quality controls and assessments of observation data, and observation results as well as the progress of the application research are summarized in Section 3 and Section 4, respectively. In the final section (Section 5), we give some conclusions and discuss future works.

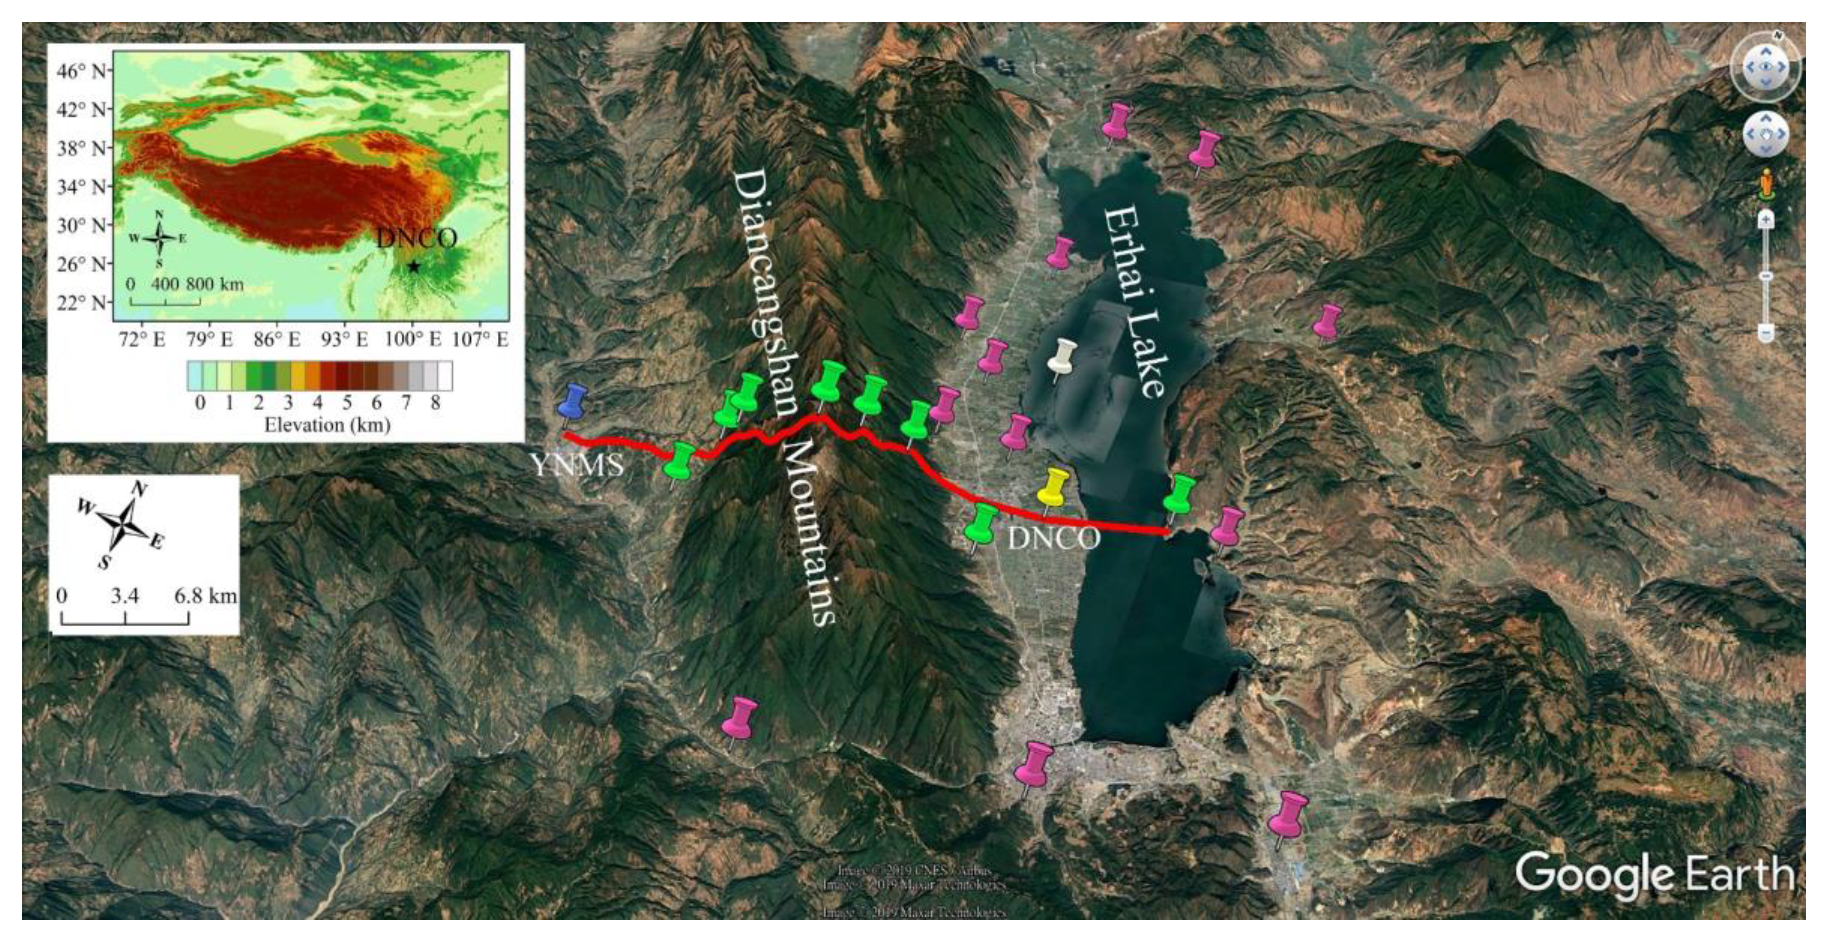
2. Observation Network Layout

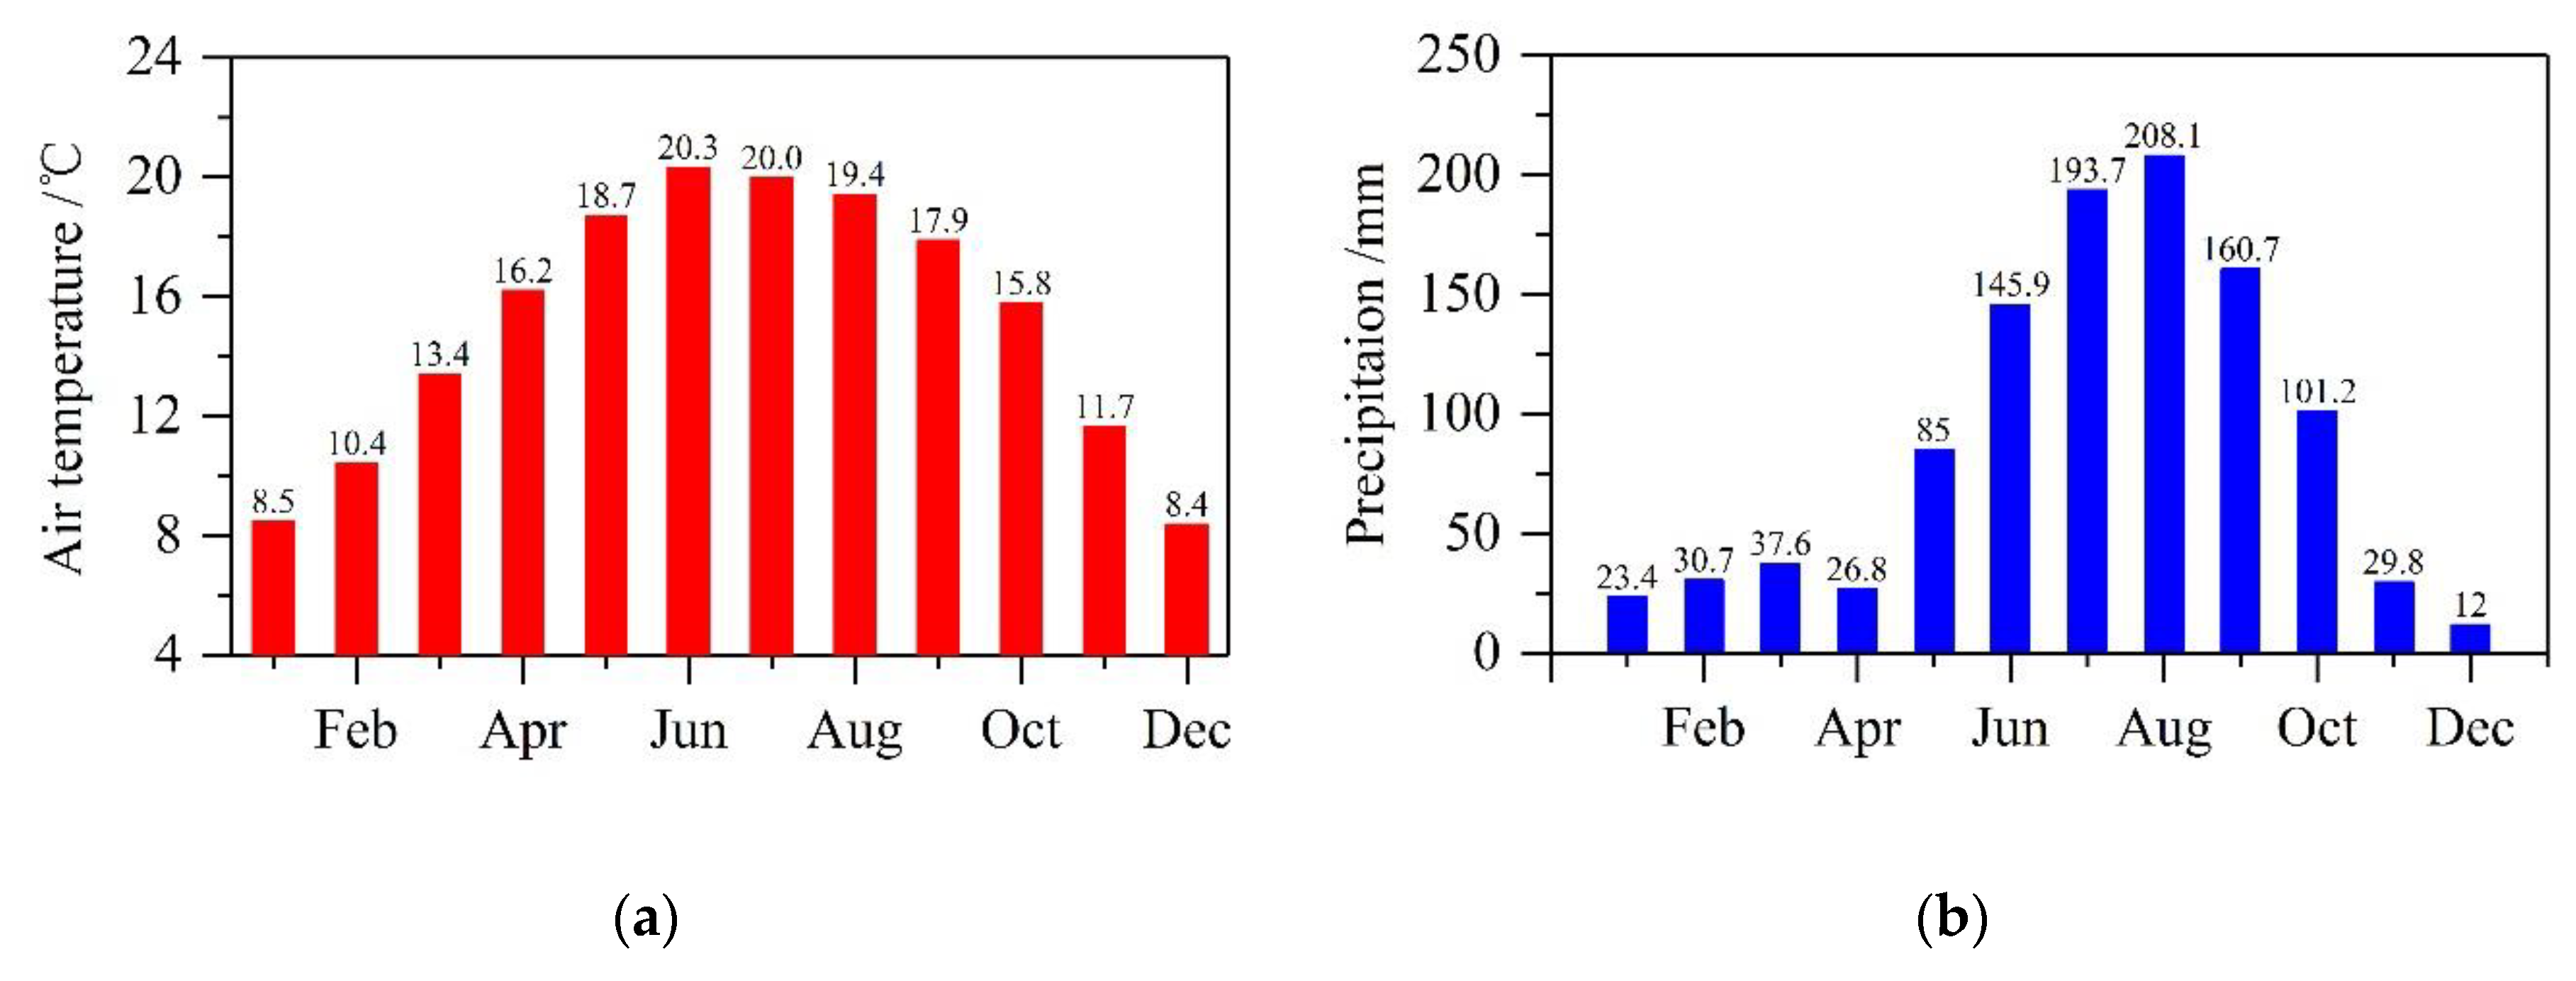
2.1. Local Climatology

The climate at the DNCO and its surrounding area is very warm. The temperature difference between four seasons has little variation. The four seasons are not clear, and each season seems like spring. The annual mean air temperature is 15.1 °C (Figure 2a). June is the hottest month in the year, with a mean maximum of 20.3 °C. An extreme high temperature of 34.0 °C occurred on 14 June 1951. December is the coldest month of the year, with the lowest mean temperature of 8.4 °C. An extreme low temperature of −4.3 °C appeared on 17 December 2013. The monsoon climate is prominent, with a dry season and a wet season, that is, a dry winter and a rainy summer. The mean annual precipitation is 1054.9 mm with 85% of precipitation falling in the wet season (Figure 2b). Annual average days of heavy rain and torrential rain were 12.2 and 2.3 days, respectively. The maximum daily rainfall of 136.8 mm occurred on 13 August 1959. Annual mean relative humidity is 68% and the lowest relative humidity is 6%. The wind energy resources are abundant. Strong wind is usually experienced through the winter and spring, and the annual mean wind speed is 2.5 m s−1. Winds from east–southeast prevail during the daytime while winds from the west–northwest prevail at night. Annual mean days of strong wind are 58.7 days. The maximum wind speed was up to 40.8 m s−1, which occurred on 21 March 2005. The climate type is complex and diverse, and the stereoscopic climate is obvious. Various meteorological disasters are distributed widely and occur frequently (e.g., drought, flood, low temperature chilling, frost, snow disaster, hail, strong wind and thunderstorm).

2.2. Scientific Objectives and Research Tasks

2.2.1. High-Resolution Observations and Fine-Scale Investigations of Meteorological Variables in Complex Terrain Region

According to the topography and geomorphology, and focused on the key scientific questions for the influence of mountains on the atmosphere, the DNCO aims to construct a high-resolution observation system that includes mountain meteorological observations and vertical profile observations for ground-based remote sensing to carry out high spatiotemporal resolution atmospheric monitoring in complex terrain regions to investigate the fine-scale characteristics of wind field, precipitation, air temperature, and other meteorological elements in mountainous environments to investigate the atmospheric vertical structures and local circulation characteristics in steep terrain, and the impact of complex terrain on the local atmospheric structure, atmospheric circulation, thermal, and dynamic actions of weather systems as well as climate, climate change, and climatic variability, and to reveal the weather and climate changes and their formation mechanism over complex topography.

2.2.2. Land–Atmosphere Interaction Observations and Investigations over the Southeastern Tibetan Plateau

According to the geographical location, and focused on the core scientific problems in the sensitive area of atmospheric heat source of the TP, the DNCO aims to construct an observation network for turbulent flux measurements in the near-surface over the different underlying surfaces to measure the exchange fluxes of energy and matter (e.g., H2O, CO2, and CH4) between the atmosphere and ground to investigate the turbulent transport and energy exchange characterizations over the non-uniform underlying surface, reveal the land–atmosphere interaction processes over the southeast extension of the TP and their effects on the weather and climate in the surrounding area of the TP, quantitatively determine the key parameters of the land–atmosphere exchange processes, and improve the parameterization of the atmospheric boundary layer and physical processes in the regional numerical model.

2.2.3. Water Vapor Observations and Investigations of the Major Water Vapor Path in the Southwest China

According to the location of the low latitude plateau, and focused on the core scientific questions in the key region of the monsoon water vapor transport in southwest China, the DNCO aims to construct a ground-based Global Position System (GPS) network for monitoring water vapor, to carry out the intensified upper-air observation experiments, to investigate the variations of atmospheric water vapor in the major water vapor path of southwest China, and to reveal the impact of water vapor changes and water cycle on the regional and downstream weather and climate.

2.2.4. Regional Eco-Meteorology Measurements and Services

According to the terrestrial ecosystems, and focused on the need of meteorological services for ecological civilization construction, the DNCO plans to construct an integrated observation system including the lake-water, farmland, forest, and mountain ecosystem measurements in accordance with the concept of “mountains-rivers-forests-fields-lakes-grasslands are a community of life”, to carry out satellite remote sensing for monitoring the surface vegetation changes, fire disasters, and water quality variations, particularly for the development of blue-green algae bloom, to investigate the influence of meteorological conditions on the water quality factors of Erhai Lake, to establish the technology that is suitable for plateau lakes in ecological environmental monitoring, and to provide technical support and demonstration for the ecological civilization construction.

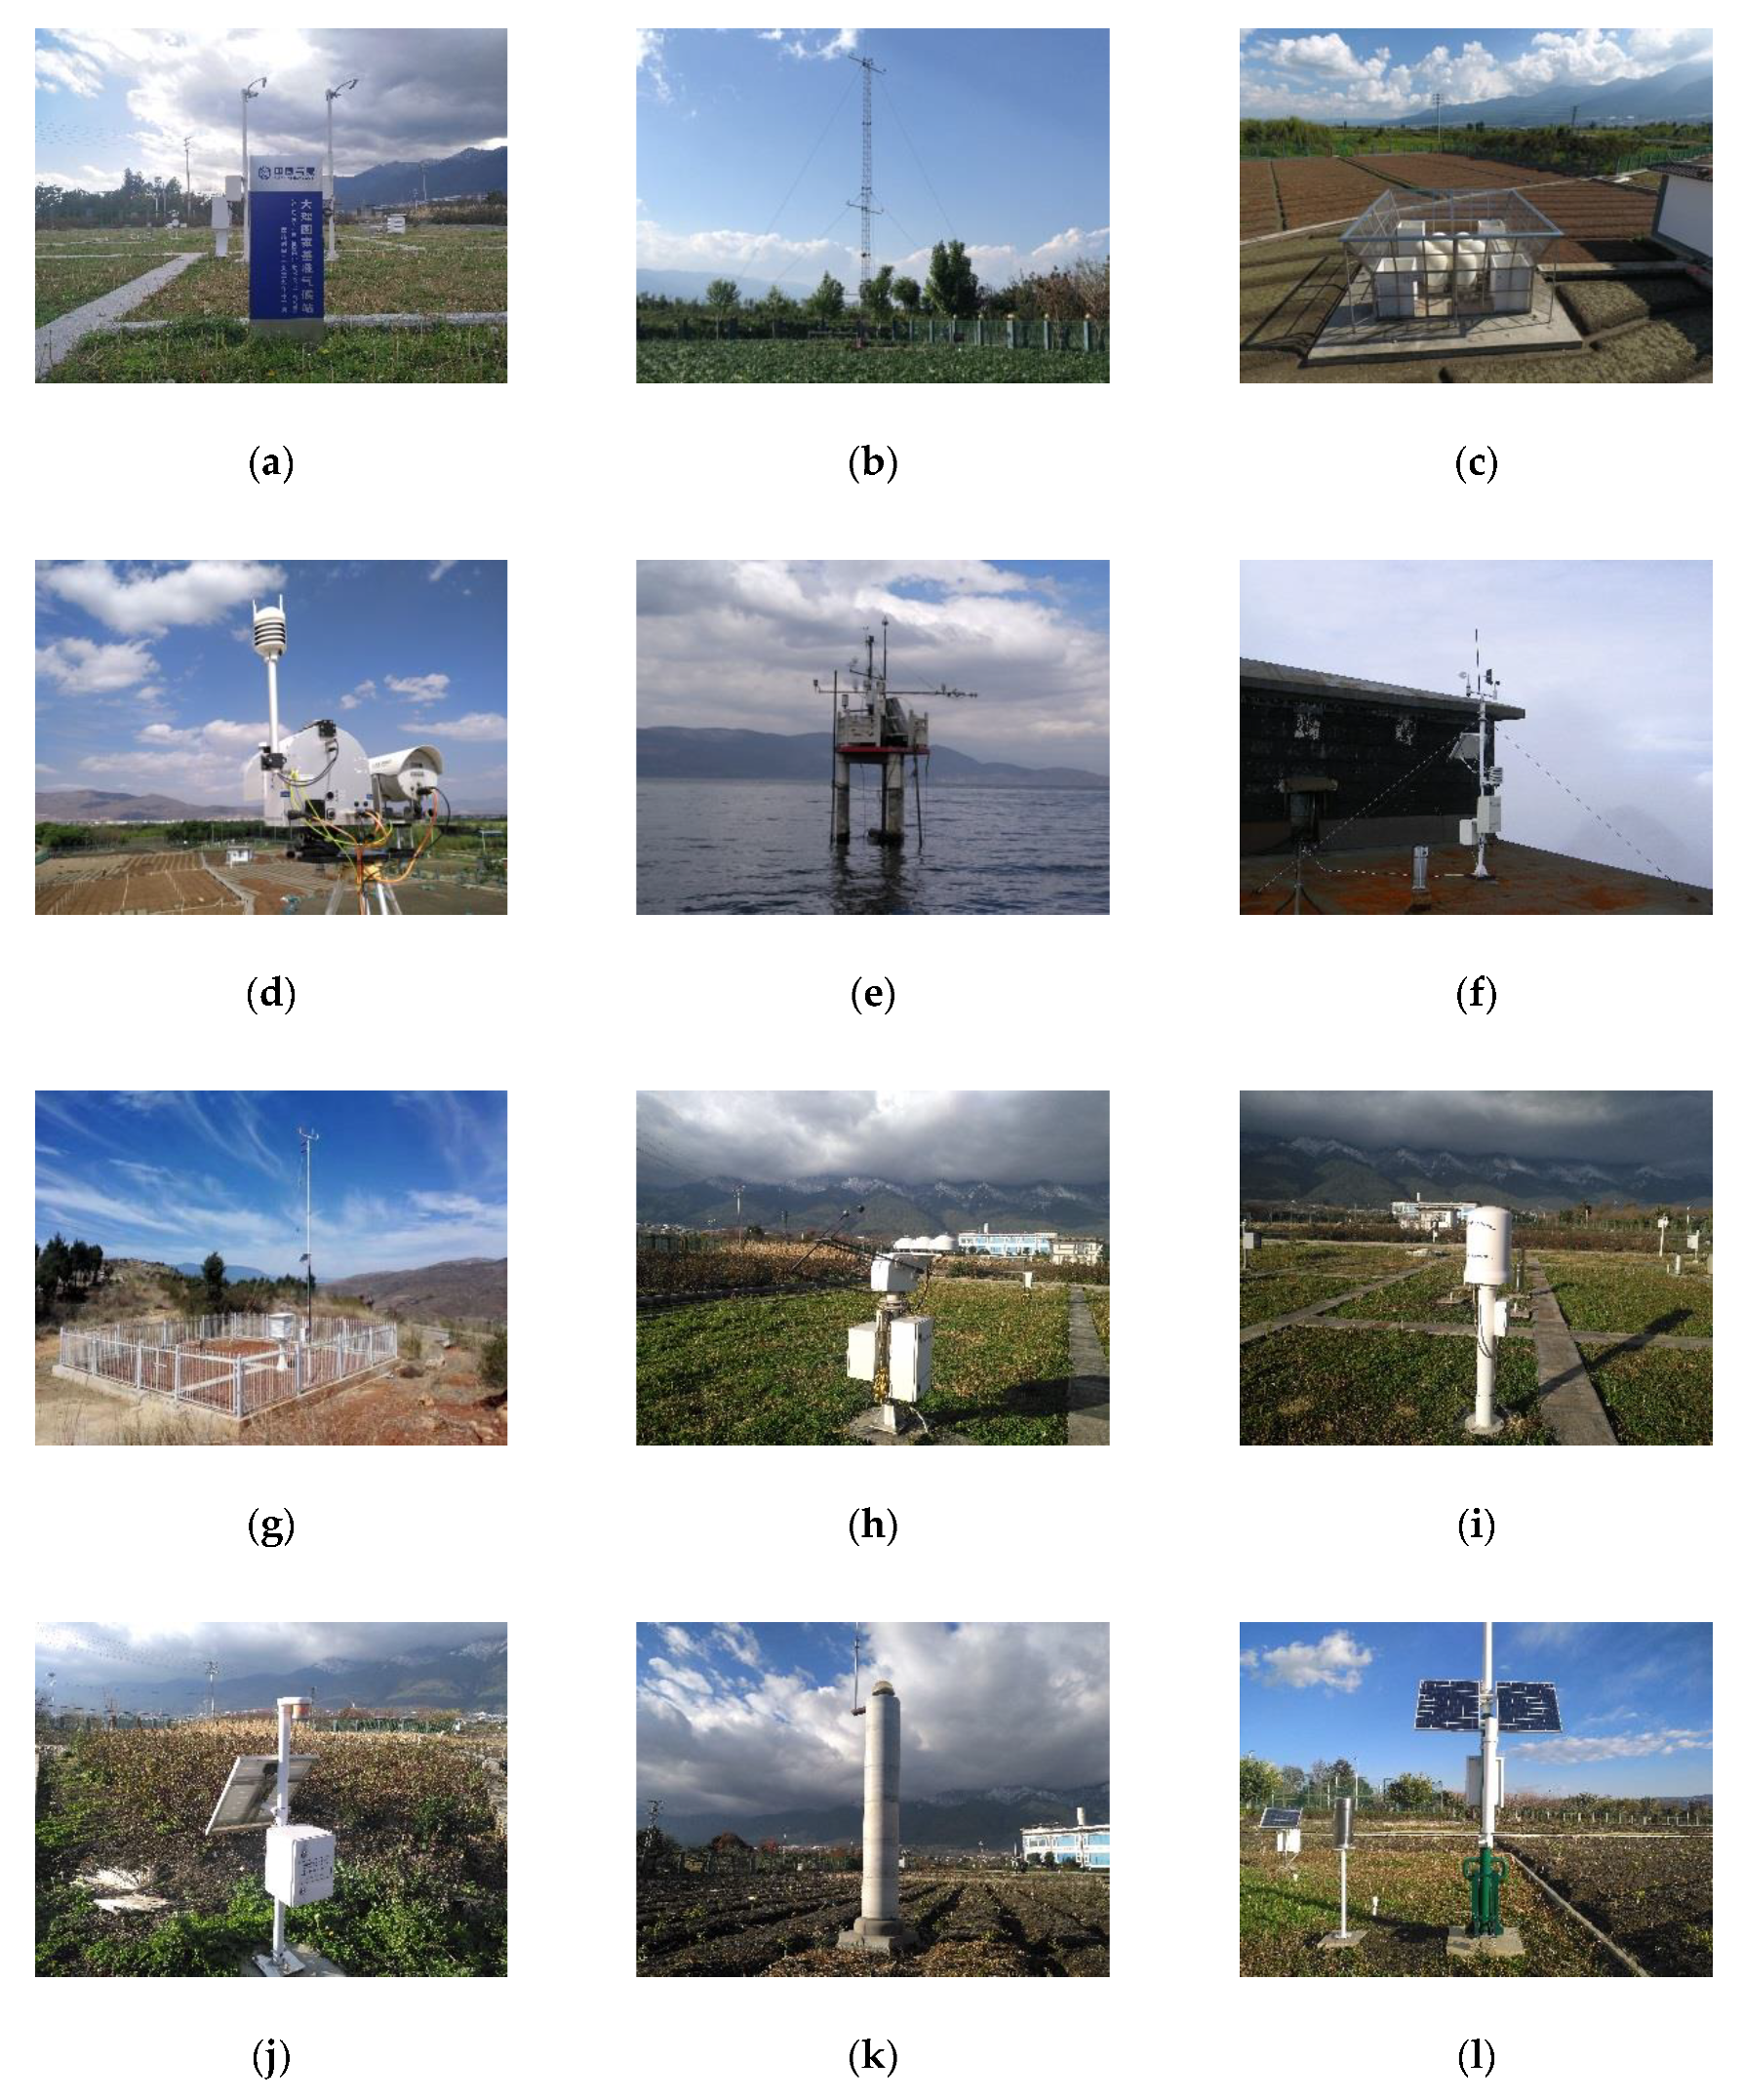
2.3. Existing Observation Projects

Under the support of the Japan International Cooperation Agency Project [37,38] as well as the CMA, Chinese Academy of Meteorological Sciences, Yunnan Provincial Meteorological Bureau, Yunnan Institute of Meteorological Sciences, Dali Prefecture Meteorological Bureau, and Institute of Atmospheric Physic, Chinese Academy of Sciences, the DNCO has gradually performed an integrated meteorological network in a complex terrain region. Figure 1 shows the layout of the meteorological network at the DNCO. The observing projects of the network include the reference climatological observations; comprehensive observations for the atmospheric boundary layer; comprehensive observations of meteorology, hydrology, and water quality in Erhai Lake; typical mountain meteorological observations; baseline surface radiation observations; and other parameter observations such as the lightning, soil moisture, perceptible water vapor, etc. The details about the instruments and the measurement variables are as follows.

2.3.1. Reference Climatological Observations

Dali Station is one of the national reference climatological stations in China (Figure 3a). This station has a long history of surface meteorological observations. Simple observations have been carried out from 1932 to 1950, complete meteorological records have been made since 1951, and a total of 80-year climatological data have been accumulated thus far. Currently, the wind speed and direction at a height of 10 m are measured with a wind sensor (ZQZ-TF, Jiangsu Radio Scientific Institute Co., Wuxi, China). Air temperature and relative humidity at a height of 1.5 m were measured with a temperature probe (WUSH-TW, Jiangsu Radio Scientific Institute Co., Wuxi, China) and a humidity probe (DHC2, Jiangsu Radio Scientific Institute Co., Wuxi, China). A photoelectric digital sunshine recorder (DFC2, China Huayun Meteorological Technology Group Co., Beiing, China) and a dark-tube sunshine recorder (FJ-2, Shanghai Meteorological Instrument Factory Co., Shanghai, China) were used to automatically and manually measure sunshine duration. A barometer (DYC1, Jiangsu Radio Scientific Institute Co., Wuxi, China) was used to measure barometric pressure. A tipping-bucket rainfall sensor (SL3-1, Shanghai Meteorological Instrument Factory Co., Shanghai, China) was used to measure precipitation. The 10 temperature probes (ZQZ-TW, Jiangsu Radio Scientific Institute Co., Wuxi, China) were used to measure the grass and ground surface temperature as well as soil temperature at depths of 0.05, 0.1, 0.15, 0.2, 0.4, 0.8, 1.6, and 3.2 m. A forward scatter sensor (DNQ1, Jiangsu Radio Scientific Institute Co., Wuxi, China) was used to measure the atmospheric visibility. A present weather sensor (DSG1, Jiangsu Radio Scientific Institute Co., Wuxi, China) was used to measure the precipitation type. An ultrasonic evaporation sensor (WUSH-TV2, Jiangsu Radio Scientific Institute Co., Wuxi, China) was used to measure the amount of evaporation. All observation data were gathered by a data logger (ZQZ-BH, Jiangsu Radio Scientific Institute Co., Wuxi, China).

2.3.2. Comprehensive Observations for the Atmospheric Boundary Layer

For the atmospheric boundary layer measurements, three sets of the observing systems were established including a 20-m planetary boundary layer (PBL) tower (Figure 3b), wind profiler radar (WPR; Figure 3c) as well as an optical and microwave scintillometer (OMS; Figure 3d). The PBL tower mainly measures water vapor, energy, and CO2 exchange on the surface. Sensors recording air temperature and relative humidity (HMP45C, Vaisala, Helsinki, Finland) as well as wind speed and direction (034B, Met One Instruments Inc., Grants Pass, OH, USA) were mounted at heights of 2, 4, 10, and 20 m on the tower. The turbulent fluxes of momentum, sensible heat, latent heat, and CO2 were directly determined by an eddy covariance (EC) system containing a three-dimensional sonic anemometer (CSAT3, Campbell Scientific Inc., Logan, UT, USA) and an open-path CO2/H2O gas analyzer (LI-7500, LI-COR Inc., Lincoln, NE, USA). The distance between the two sensor heads is 18 cm. Both instruments were mounted at a height of 5 m on the tower. Net radiation flux (CNR1, Kipp & Zonen, Delft, The Netherlands) is measured at 1.5 m above the surface. Soil temperature and soil water content at depths of 4, 10, 20, 60, and 100 cm were measured with temperature probes (Model 107, Campbell Scientific Inc., Logan, UT, USA) and water content reflectometers (CS616, Campbell Scientific Inc., Logan, UT, USA), respectively. Soil surface temperature was measured by an infrared radiometer (IRR-P, Apogee Instruments Inc., Logan, UT, USA). Soil heat fluxes at depths of 4, 10, and 20 cm were measured by soil heat flux plates (HFP01, Hukseflux Thermal Sensors, Delft, The Netherlands). Rainfall was measured by a rain gauge (RG13H, Vaisala, Helsinki, Finland). Barometric pressure was measured by a digital barometer (PTB220, Vaisala, Helsinki, Finland). Two sets of data loggers (CR3000, Campbell Scientific Inc., Logan, UT, USA) were applied to record the 10-Hz eddy covariance signals and 10-min average meteorological data, with a 1 GB and a 64 MB CF card, respectively.
The WPR with radio acoustic sounding system (WPR LQ-7, Sumitomo electric industries Ltd., Osaka, Japan) mainly measures the vertical profile of horizontal velocities, vertical velocity, and temperature in the atmospheric boundary layer. The operation frequency is 1.29 GHz. The minimum and maximum measurable heights are 100 m and 8000 m, respectively. The height resolution is 100 m. Observation data include 1-min raw data of Doppler spectrum and 10-min average data of wind velocity and temperature.
The OMS consists of a large aperture scintillometer (LAS MkII, Kipp & Zonen, Delft, The Netherlands) and a microwave scintillometer (RPG-MWSC-160, Radiometer Physics GmbH, Meckenheim, Germany). The OMS was set up over the farmland underlying surface of the Erhai Lakeside region with a path length of 1852 m and an effective height of 24.6 m. This system directly measures the path-averaged structure parameters of the temperature and humidity. Combined with the meteorological observations of air temperature, relative humidity, wind speed and direction, air pressure, and rain flag (WT530, Vaisala, Helsinki, Finland), this system can derive large-scale sensible heat and latent heat fluxes. Compared to traditional point measurements, the OMS measurements at spatial scales were similar with the grid box size of numerical models and the pixel size of the satellite images.

2.3.3. Comprehensive Observations of Meteorology, Hydrology, and Water Quality at Erhai Lake

An observation platform (100°09′ E, 25°46′ N, 1979.206 m above sea level; Figure 3e) was established close to west bank of Erhai Lake, with a distance of about 70 m. A weather transmitter (WXT510, Vaisala, Helsinki, Finland), mounted at a height of 1.5 m above this platform, was used to measure air temperature, relative humidity, wind speed and direction, barometric pressure, and rain flag. The precipitation was measured by a rain gauge (TE525MM, Campbell Scientific Inc., Logan, UT, USA). The net radiation flux was measured by a net radiometer (CNR1, Kipp & Zonen, Delft, The Netherlands). The photosynthetically active radiation was measured by a quantum sensor (LI-190SB, LI-COR Inc., Lincoln, NE, USA). The EC flux measurement system was mounted at a height of 2.5 m above this platform. The horizontal velocities, vertical velocity, and sonic temperature were measured with a three-dimensional sonic anemometer (CSAT3, Campbell Scientific Inc., Logan, UT, USA). Sonic temperature, computed from the speed of sound, was different from the air temperature using the contacted measurements due to the presence of water vapor [39]. The H2O and CO2 densities were measured with an open-path CO2/H2O gas analyzer (LI-7500, LI-COR Inc., Lincoln, NE, USA). The CH4 density was measured with an open-path CH4 gas analyzer (LI-7700, LI-COR Inc., Lincoln, NE, USA). The turbulent data sampling frequency was 10 Hz. A buoy that can float up and down with the water level was mounted below this platform. A temperature string (CS225, Campbell Scientific Inc., Logan, UT, USA), tied to the top buoy, was used to record the water temperature at the surface and depths of 0.15, 0.3, 0.45, 0.6, 1, 2, and 4 m. A set of the multi-parameter water quality sensors (Hydrolab MS5, OTT HydroMet, Kempten, Germany), tied to the buoy at a depth of 1 m, was used to measure temperature, conductivity, pH, dissolved oxygen, salinity, and blue-green algae. A submersible pressure transducer (CS451, Campbell Scientific Inc., Logan, UT, USA) was used to measure the temperature and water level.

2.3.4. Typical Mountain Meteorological Observations

In the longitudinal direction, eight sets of multi-factor automatic weather stations (Table 1; Figure 3f) are installed on the windward slope, top, and lee slope of the Diancangshan Mountains along a line of the 25°40′ N. In the latitudinal direction, 12 sets of six-factor (air temperature, relative humidity, wind speed, wind direction, air pressure and precipitation) automatic weather stations (Figure 3g) are installed around Erhai Lake. The instruments of the above stations were made by Jiangsu Radio Scientific Institute Co., China. Together with the Yangbi National Meteorological Station and comprehensive observation system at the DNCO and in Erhai Lake, a mountain meteorological observation system has been formed over the mountainous area.

2.3.5. Baseline Surface Radiation Observations

Variables for the baseline surface radiation measurements (Figure 3h) include the global irradiance, shortwave upward irradiance and diffuse sky irradiance (CMP11, Kipp & Zonen, Delft, The Netherlands), direct solar irradiance (CHP1, Kipp & Zonen, Delft, The Netherlands), longwave downward and upward irradiance (IR02, Hukseflux Thermal Sensors, Delft, The Netherlands), photosynthetically active radiation (LI-190SB, LI-COR Inc., Lincoln, NE, USA), and ultraviolet irradiance (UV-S-AB-T, Kipp & Zonen, Delft, The Netherlands). The automatic sun tracker (FS-ST22, Jiangsu Radio Scientific Institute Co., Wuxi, China) was installed for direct solar radiation and diffuse radiation measurement. The sunshine duration is derived by the direct solar irradiance that exceeds the value of 120 W m−2. A data logger (WUSH-BFS, Jiangsu Radio Scientific Institute Co., Wuxi, China) with a 2 GB CF card was used to record the radiation data at 1-min and 1-h intervals.

2.3.6. Other Parameters Observations

A three-dimensional lightning location detector (ADTD-2C, Beijing JOZZON space technology development Co., Beijing, China; Figure 3i) was used to monitor the type, position, time, and intensity of lightning in real time. An atmospheric electric field mill (DNDY-2, Institute of Electrical Engineering, Chinese Academy of Sciences, Beijing, China; Figure 3j) was used to monitor the change in the local electric fields. The atmospheric precipitable water vapor was measured with a global position system (NetRs, Trimble Inc., Sunnyvale, CA, USA; Figure 3k) monitoring network including eight stations: Dali, Lincang, Lijiang, Mengla, Deqing, Kunming, Tengchong, and Mengzi in Yunnan Province. Additionally, the soil moisture measurements contained the point-scale and area-scale observation techniques. An automatic observation system (DZN3, China Huayun Group, China) was used to measure the soil volume water content, weight water content, effective water storage, and relative humidity at depths of 0.1, 0.2, 0.3, 0.4, 0.5, 0.6, 0.8, and 1.0 m below the ground. A cosmic-ray soil moisture observing system (ZY1700, Hennan Zhongyuan Photoelectric Measurement and Control Technology Co., Zhengzhou, China; Figure 3l) was used to observe the soil moisture at a horizontal scale of 700 m and depths of 70 cm.

3. Progress in Observation Research

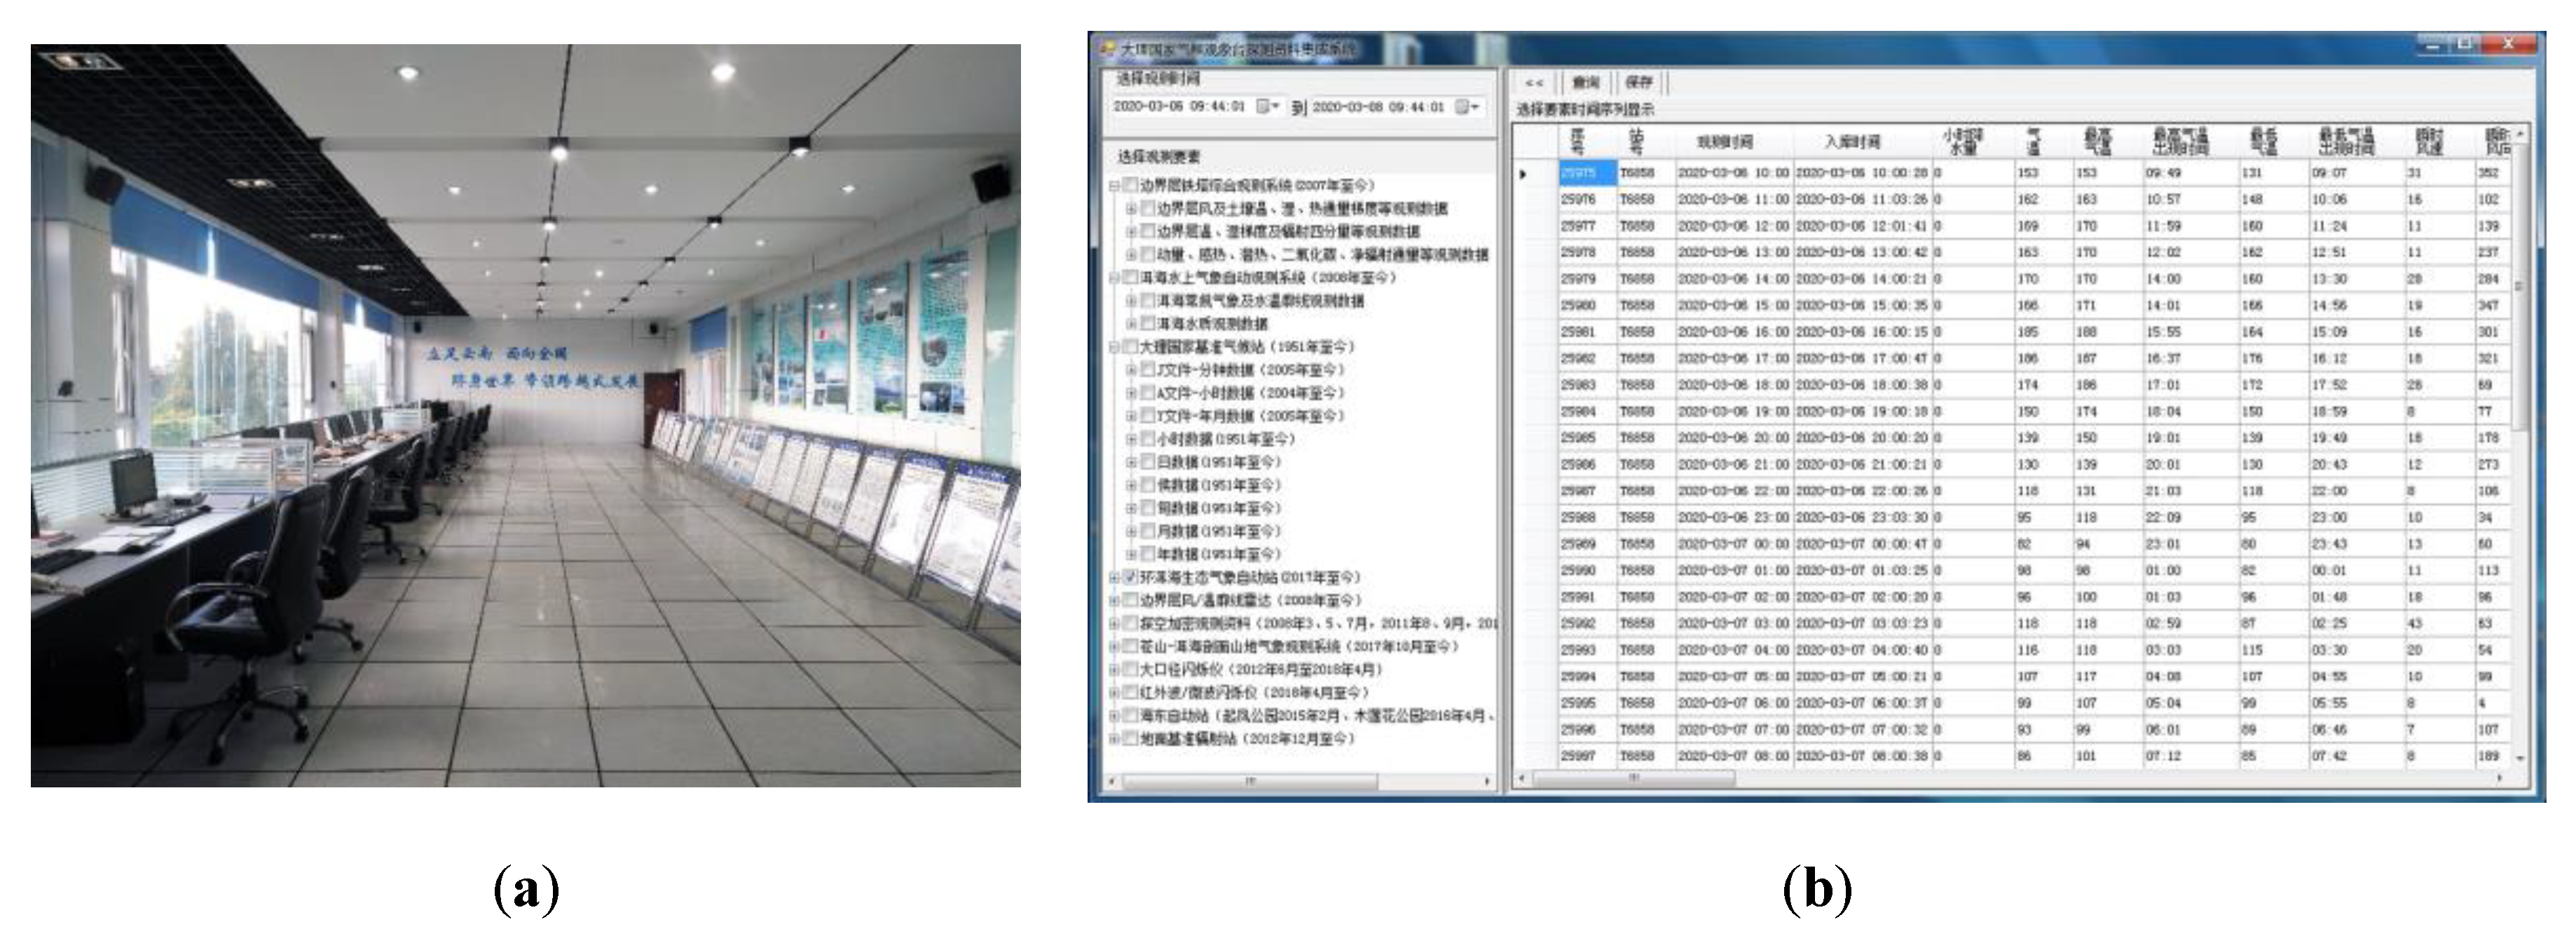
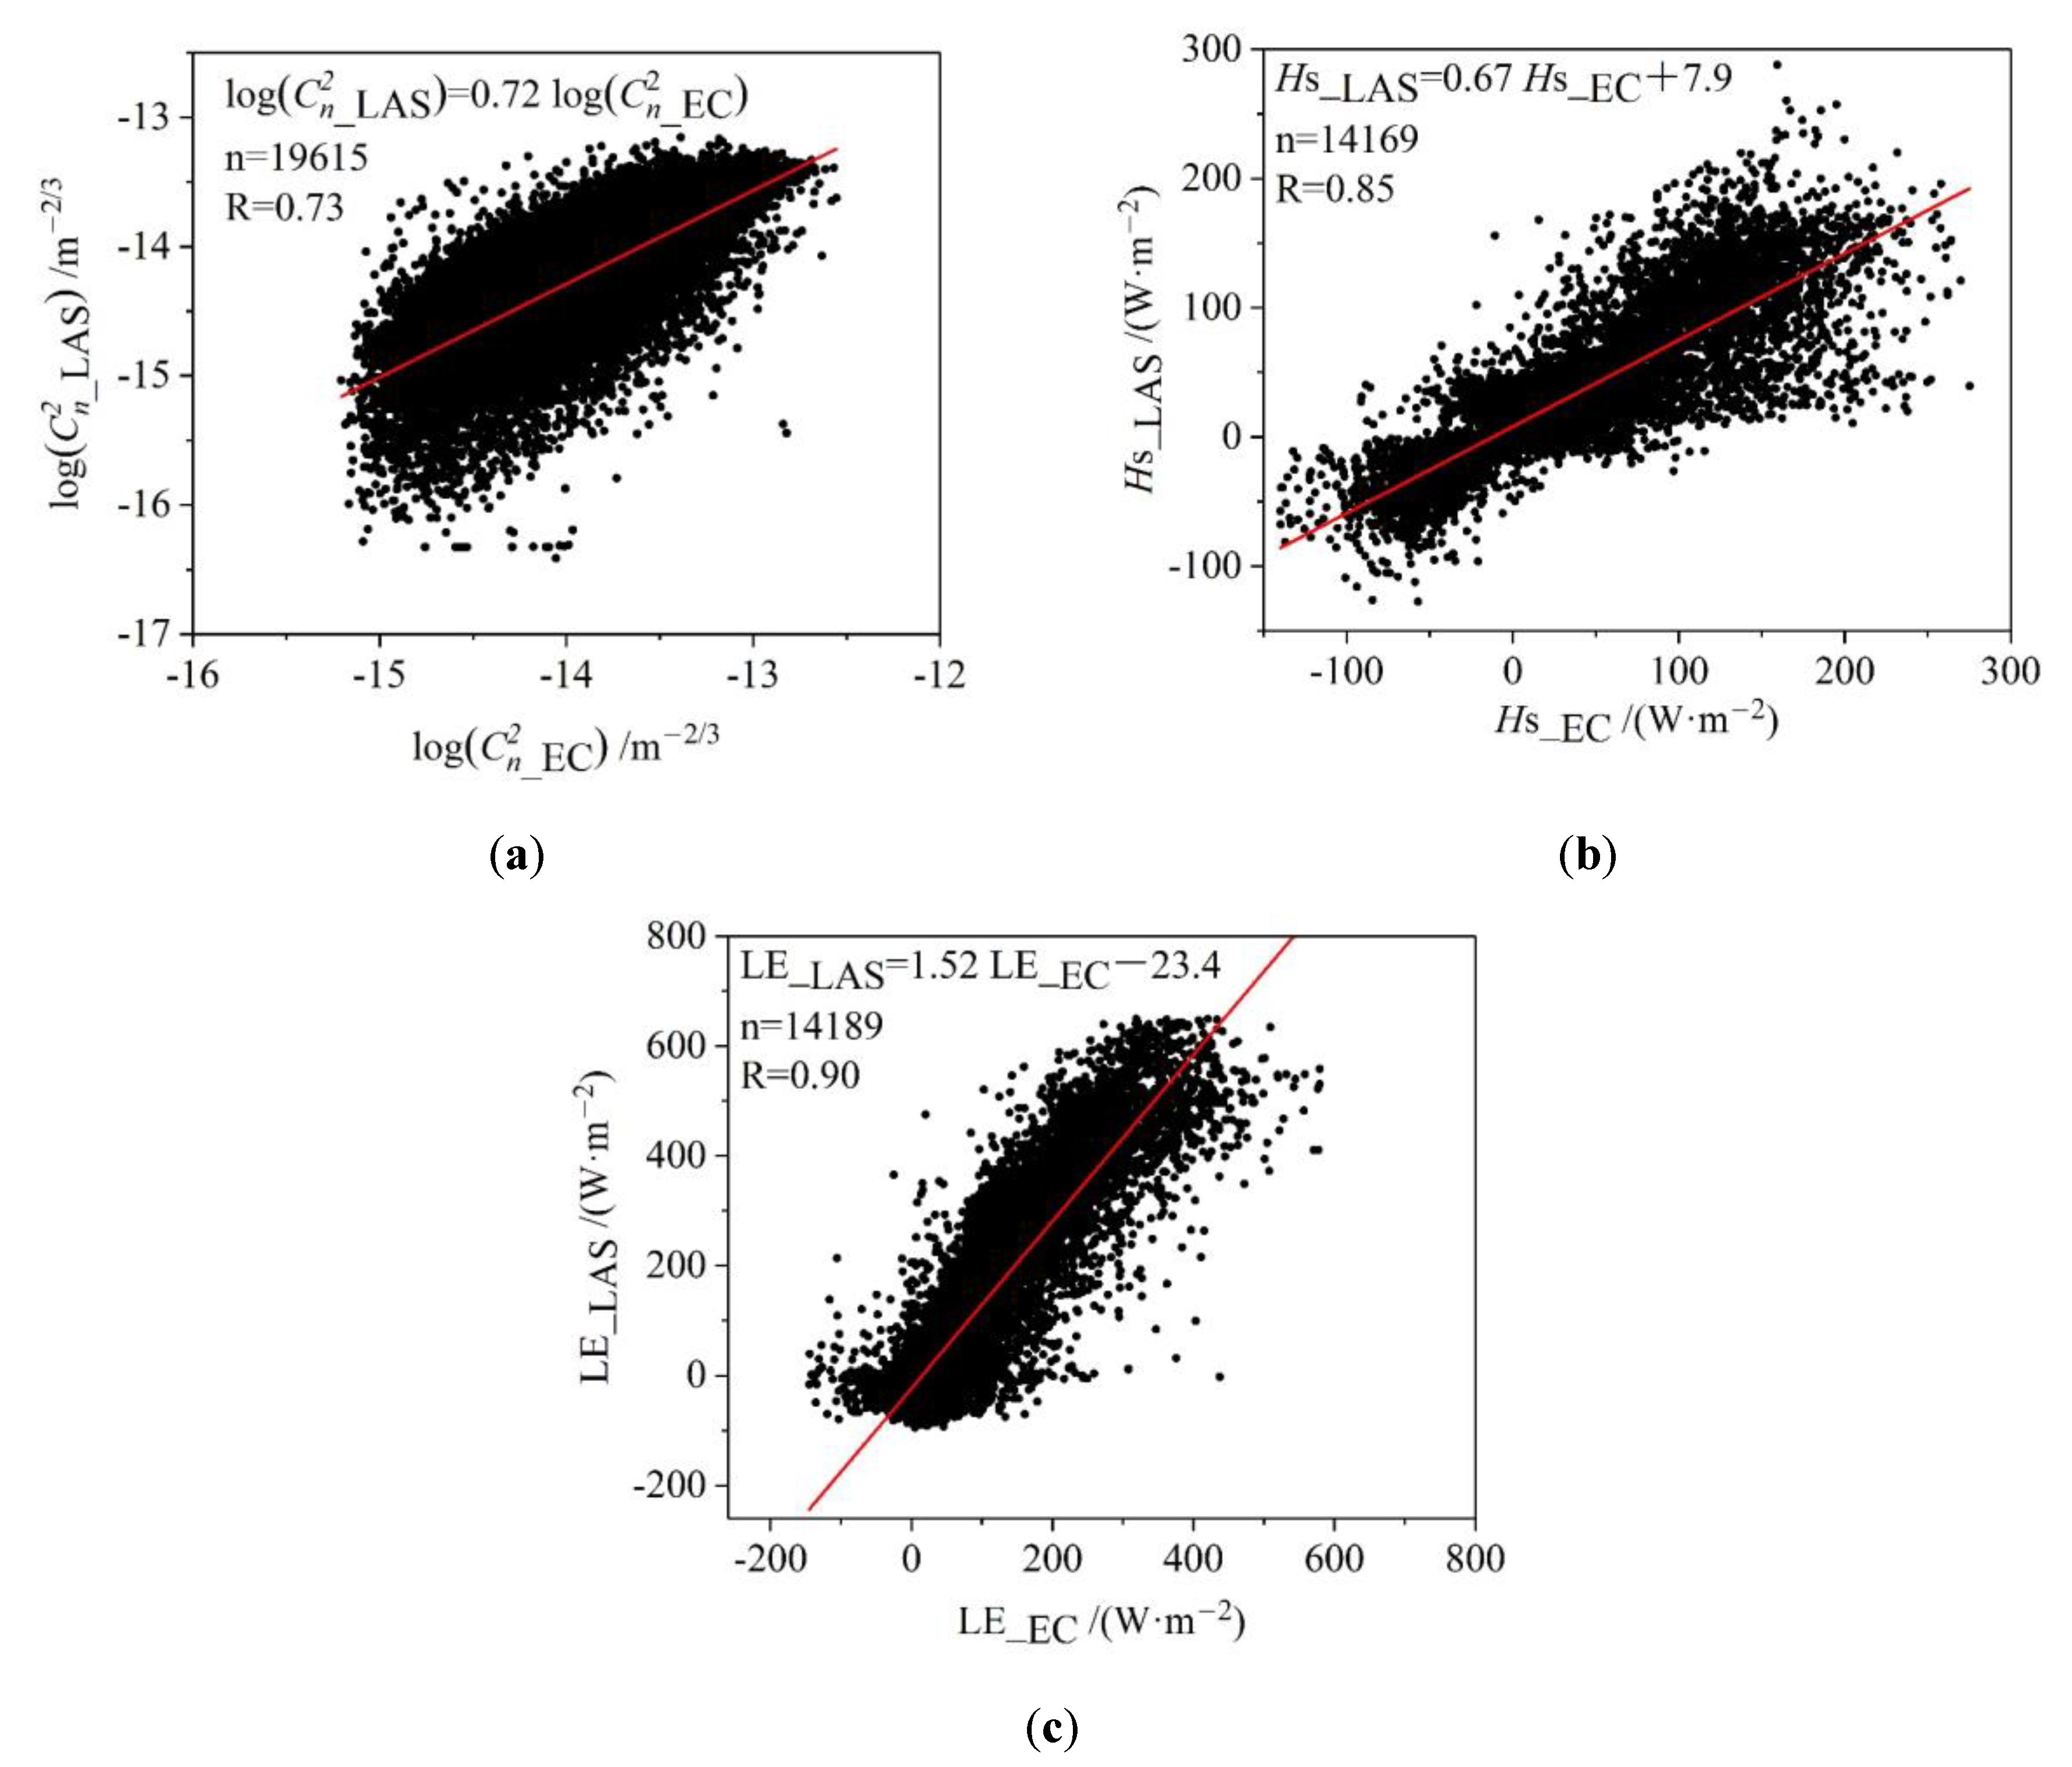
3.1. Data Quality, Controls, and Assessments

3.1.1. Data Quality

All of the observation data were collected on an operational platform of the DNCO (Figure 4a). In order to ensure data quality, each observing system was collected and monitored by a computer, which was maintained by one or two engineers who checked the observation data and judged the operation of the instruments at least once a day. When the equipment failed, they deal with the situation in time and make a detailed record. Meanwhile, a database system (Figure 4b) was developed in accordance with the data conditions. This system functions as the real-time data storage, display, and download. Additionally, the instruments were calibrated according to the observation operation standards of the CMA. Among these instruments, the CO2/H2O gas analyzer was calibrated once for two years.

3.1.2. Quality Controls and Assessments

Quality controls and assessments of observation data are the basis of high quality data analysis and application. The DNCO has actively carried out the work of quality controls and assessments in accordance with the characteristics of the observing system, daily maintenance experience and fault record, etc.
For the WPR data, Dong et al. [40] quantitatively evaluated WPR detection capability and compared it with the radiosonde data. It was found that the WPR data acquisition rate in the atmospheric boundary layer was more than 80%. The consistency of wind speed and direction was better, while it was poor for the temperature. This indicates that the wind data of the WPR are credible.
For the radiation data, Xu et al. [41] proposed that some measurement errors and various degrees of missing data occurred in long-term and continuous operation of the radiometer due to zero drift of the sensor, operation-related problems, virtual connection between the data logger and lightning protection board, and so forth. Measurement errors caused by zero drift of the short-wave radiation sensor were not negligible and must be corrected when the data is applied. The available rates of the downward and upward short-wave radiation data were 99.0% and 99.9, respectively, after zero drift revision. The reliabilities of downward and upward long-wave radiation data were relatively lower, with the available rates of 70.7% and 73.5%, respectively.
For the ground-based GPS water vapor data, Sun et al. [42] compared the accuracy of atmospheric water vapor values derived from the ground-based GPS stations and radiosonde data. It was found that their changing trends were basically the same with a mean-root-square error less than 2 mm, and revealed that the retrieved water vapor generated by the ground-based GPS calculation scheme in the local model can be used in research. Ren et al. [43] proposed that the precipitation estimated by the GPS observation and NCEP/NCAR, NCEP/DOE, and JRA-25 reanalysis data can present similar trends where the precipitation increased from the south side to the north side in eastern Yunnan, but the values of the precipitation estimated by three reanalysis data were less than that by GPS observation in every month.
For the EC data, Xu et al. [44] processed the original turbulent data using EdiRe software (version 1.5.0.32, University of Edinburg) and quantitatively assessed the influence on calculating fluxes at each processing step. It was found that the best averaging period to calculate the turbulent fluxes was about 30 min. The rotation for tilt correction [45] and the Webb–Pearman–Leuning (WPL) correction [46] had a great influence on the momentum and CO2 fluxes. The overall quality of EC flux data was good, and the percentages of high quality data for the momentum, sensible heat, latent heat, and CO2 fluxes were 59.4%, 64.2%, 63.8%, and 63.2%, respectively. That is, about 60% of the flux data can be used for basic research.
For the large-scale LAS data, Xu et al. [47,48] compared the structure parameter of the refractive index of air (Cn2) as well as sensible heat (Hs) and latent heat (LE) fluxes measured with the local-scale EC system. It was found that there was a high correlation between Cn2, Hs, and LE values measured by the EC at a height of 5 m and the LAS at a height of 10 m with the correlation coefficients of 0.73, 0.85, and 0.90, respectively (Figure 5). The values of Cn2 measured by two kinds of instruments were consistent in the diurnal variation, while they were significantly different in the order of magnitude. This difference was mainly affected by the different heights of measurement. The diurnal and seasonal changes of Hs and LE measured by two kinds of instruments were similar. The difference of these flux values were related to the measurement periods, and demonstrated clear diurnal and seasonal variation. Hence, the data measured with the LAS and EC can be applied jointly.

3.2. Observation Results

3.2.1. Spatial Representativeness of Weather Stations

The representativeness of weather stations over southwestern China is a long-standing problem due to the influences of complex topography and local distributions of stations [49]. Based on the annual temperature and precipitation data from 32 weather stations in Yunnan Province, the specific regions and scopes that can be represented by each station observation data were analyzed. Li and Li [49] pointed out that the representative area of the precipitation at the DNCO was mainly concentrated on a north–south narrow strip and covered an area of about 5000 km2 due to the influences of the surrounding north–south-oriented ridges.

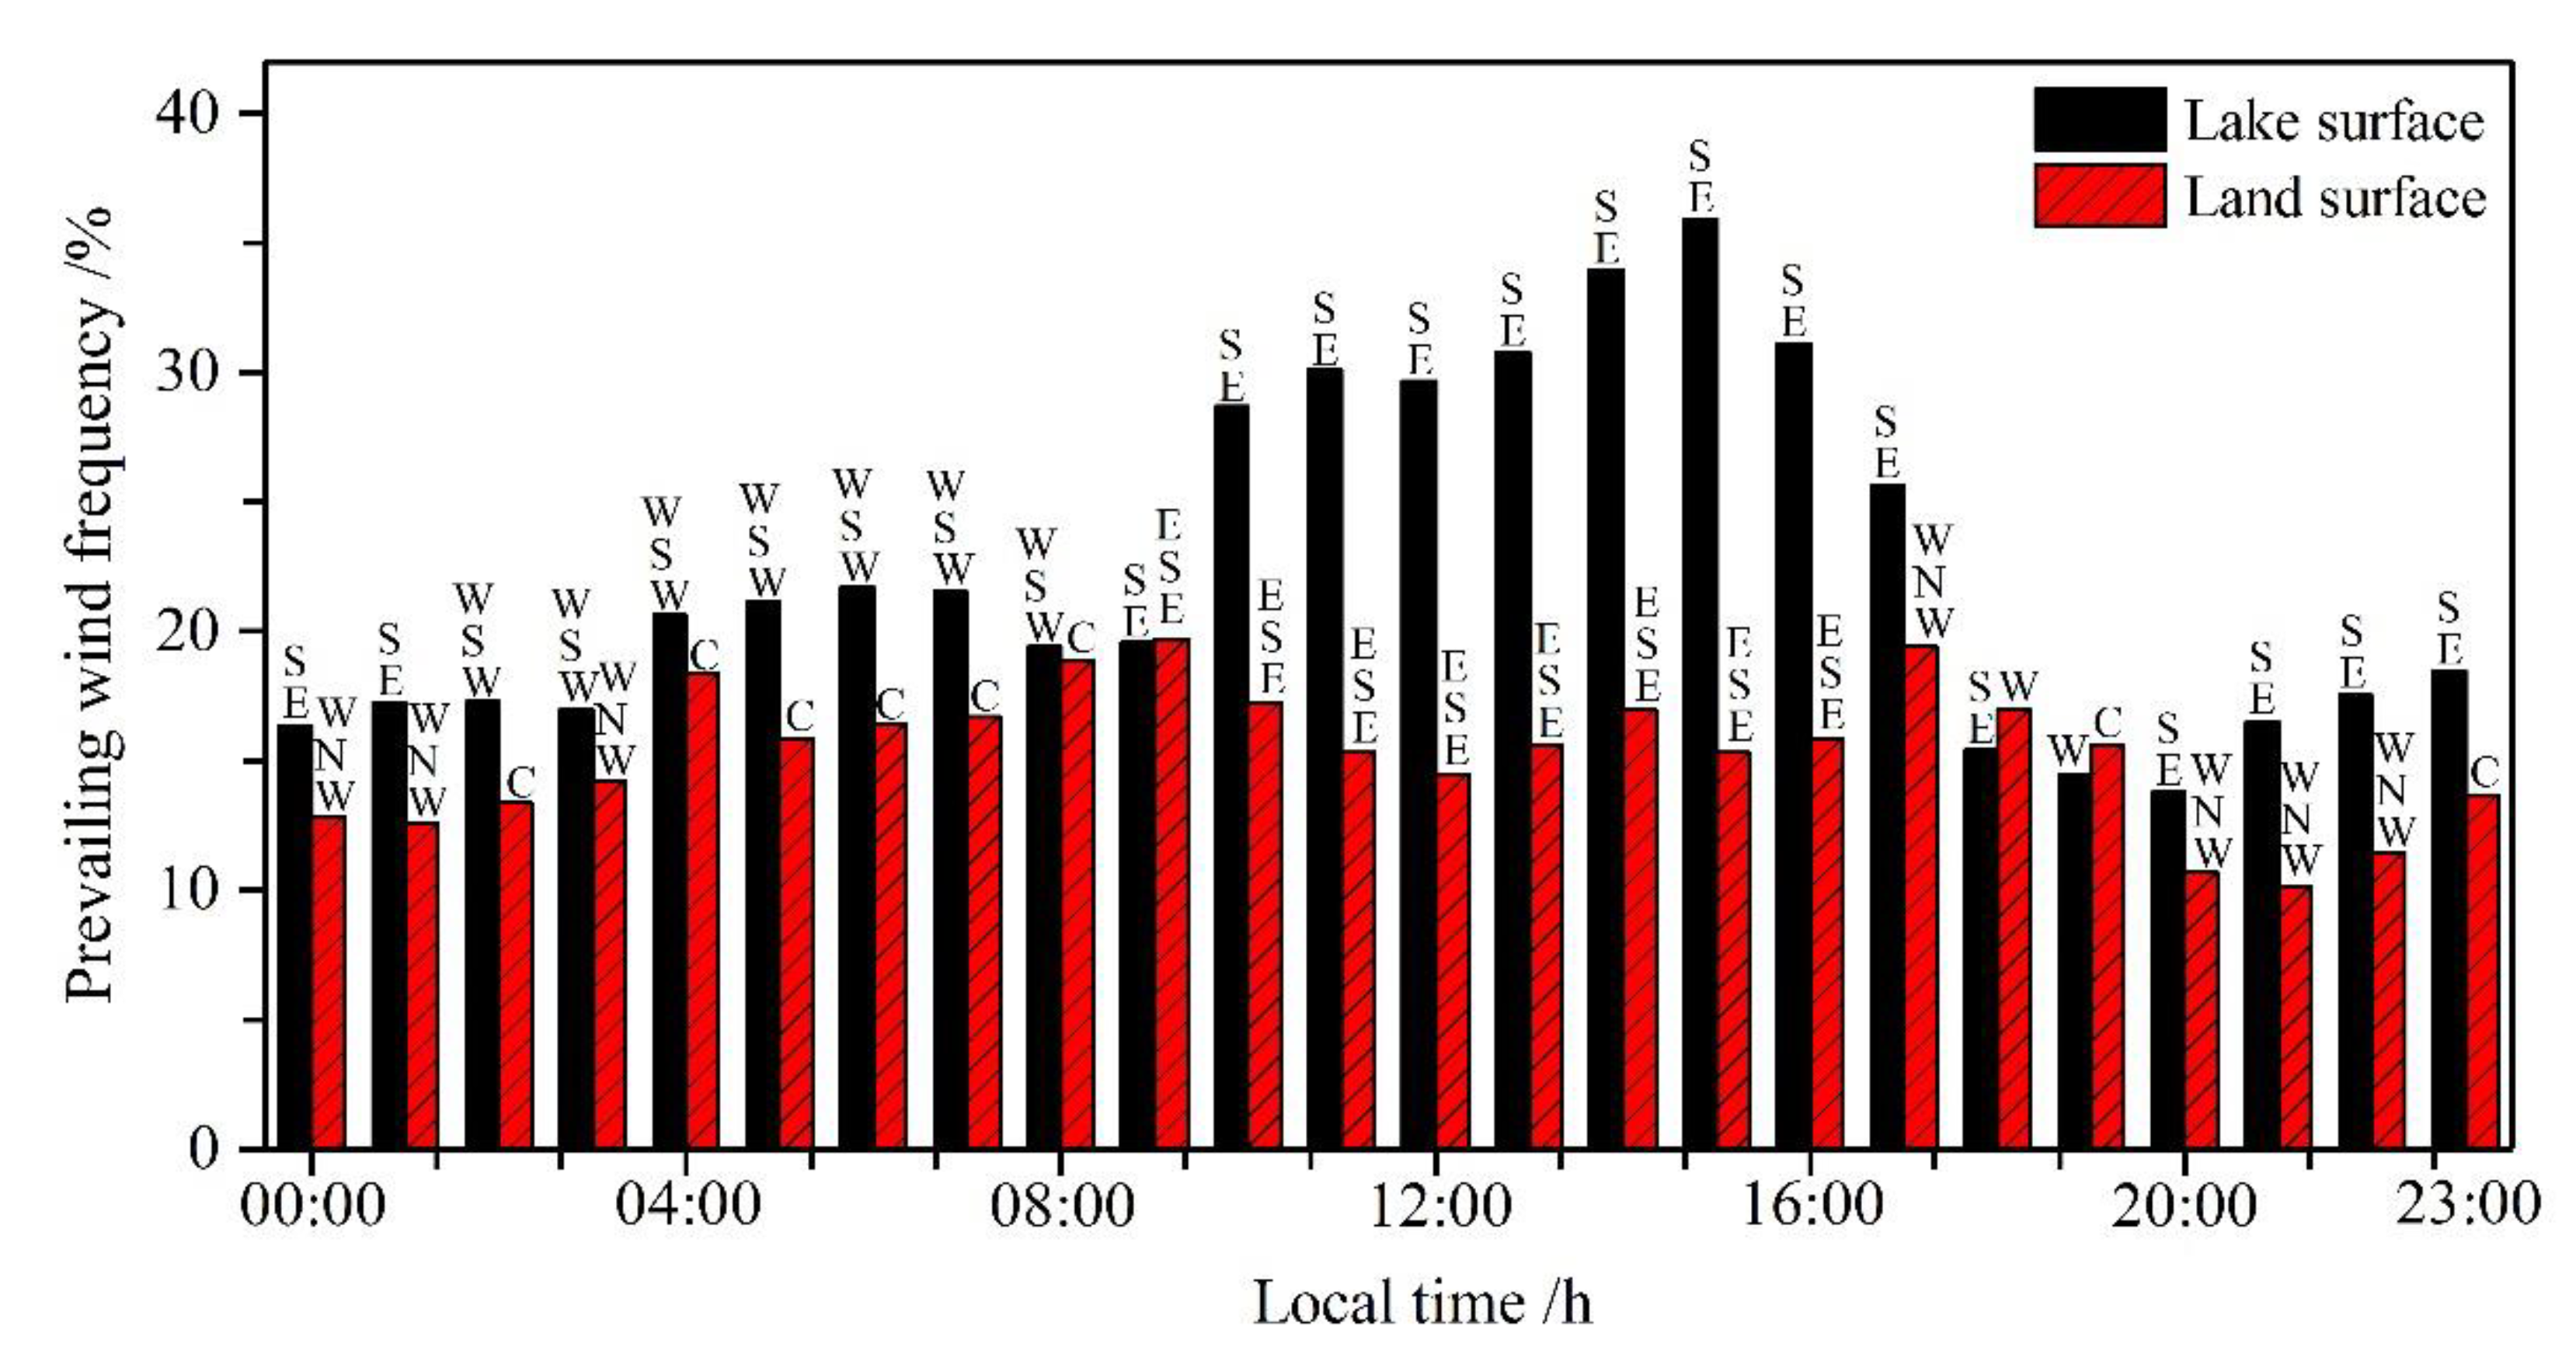
3.2.2. Local Circulation Characteristics

Lake-land breeze is a kind of local circulation caused by complex topography and an uneven heating of underlying surface as well as temperature difference between the lake and land surface, which mostly occurs under weak synoptic systems. The formation mechanism of mountain-valley breeze is similar to that of the lake-land breeze. A local circulation caused by the coupling effects of lake-land breeze, mountain-valley breeze, and gorge wind occurs in the atmospheric boundary layer over the Diancangshan Mountains and Erhai Lake area, which is affected by the narrow and high mountains, lake-land distribution, and other factors. Around this local circulation, Yang et al. [50] found that the prevailing winds were the east and southeast winds during the daytime while the west and southwest winds at night over the land surface. Xu at al. [51] found that the prevailing winds were southeast during the daytime as well as southeast and west southwest at night over the lake surface. The shift time of prevailing winds exhibits a good correspondence with the times of sunrise and sunset (Figure 6), in other words, the transition of prevailing winds occurs in the morning and evening. Dong et al. [52] found that the height of this circulation was about 600 m. On the whole, this local circulation was very strong under fair weather conditions. The diurnal cycle of the wind direction is obvious. Airflow blows from the lake to the land surface during the daytime, conversely, from the land to the lake surface at night.

3.2.3. Atmospheric Vertical Structure Characteristics

Radiosonde data with high vertical resolutions ranging from several meters to tens of meters and WPR data with high temporal resolutions ranging from several minutes to tens of minutes can well show the vertical state and fine structure of the atmosphere. Based on the air sounding data during pre-onset, onset, and maintenance of monsoon in 2008, Xu et al. [53] found that the heights of the convective boundary layer varied from 190 m to 2500 m with an average value of 1061 m, while the heights of the stable boundary layer varied from 60 to 1760 m with an average value of 467 m. Xu et al. [54] and Wang et al. [55] pointed out that the heights of the convective boundary layer at noon over the southeastern edge of the TP reached up to 1500 m and 2000 m. Xu et al. [56] found that the heights of tropopause varied from 12.8 km to 16.4 km with an average value of 14.8 km. Average temperature declining rate of the troposphere was 6.4 °C km−1. The water vapor existed mainly below a 6.6 km height before the monsoon onset, while it was below a 8.3 km height after the monsoon burst. The west wind predominated from the troposphere to the low stratosphere before the monsoon onset. During the onset period of monsoon, the wind speed decreased and the west wind in low stratosphere turned to east wind from troposphere to low stratosphere. During the powerful and prosperous period of monsoon, the wind speed increased and the wind was the east wind from the higher level of the troposphere to low stratosphere. In addition, based on the WPR data, Dong et al. [52] found that the wind force scale was 2-level and prevailing winds were east winds below the height of 400 m. The zonal wind below the height of 600 m appeared as a diurnal cycle of the east and west wind. The diurnal variations of wind speed at different heights were different. That is, the diurnal variations of wind speed showed one peak below 20 m and two peaks between 100 m and 1500 m, and were not evident above 2000 m.

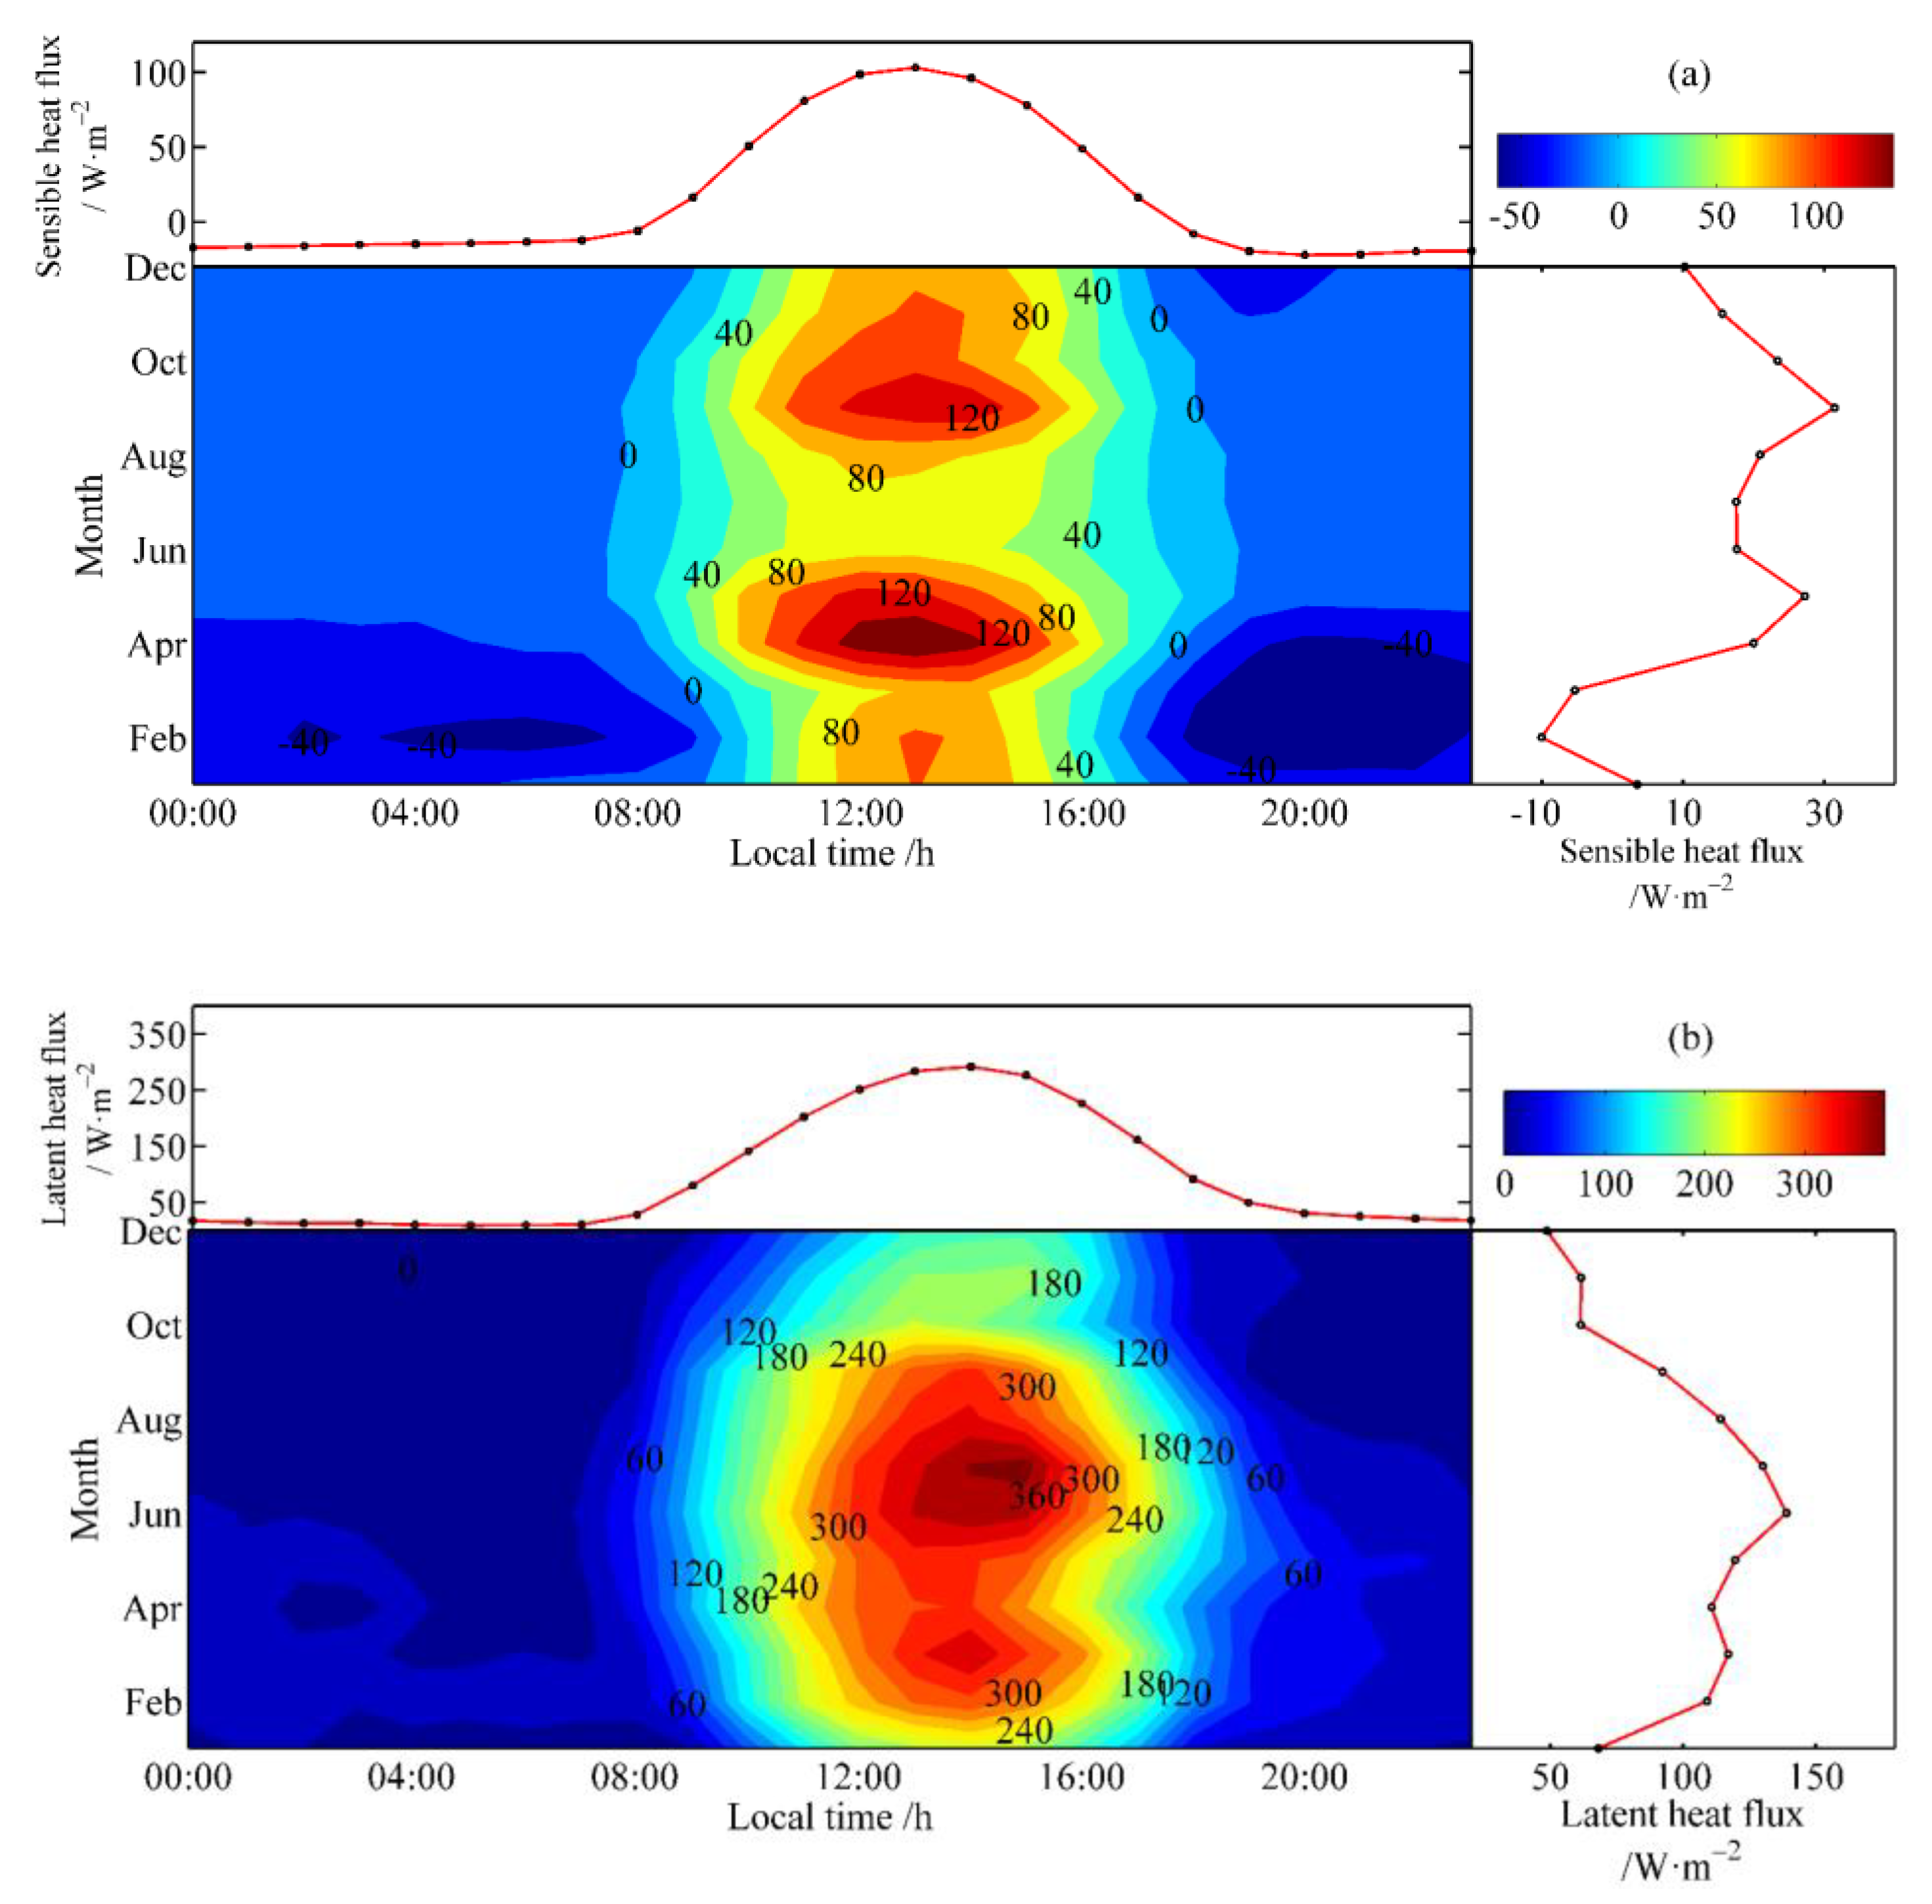
3.2.4. Energy, Water Vapor, and CO2 Exchange Characteristics

Land surface processes govern energy, water vapor, momentum, and CO2 exchange between the land and the atmosphere, which have great impacts on atmospheric boundary layer processes as well as regional climate [57]. Based on the PBL tower measurement data, Yang et al. [58] found that the turbulent intensity in the dry period was much higher than that in the wet period. Xu et al. [59] found that Hs and LE had a similar daily variation across the whole year, and their amplitude changed from season to season. The diurnal and monthly LE varied from –1.0 to 387.6 W m−2 and from 48.5 to 139.0 W m−2 with an annual average value of 97.6 W m−2, while the diurnal and monthly Hs varied from –61.9 to 158.6 W m−2 and from –10.0 to 31.4 W m−2 with an annual average value of 14.3 W m−2 (Figure 7). The value of LE was obviously larger than that of Hs, which indicates that LE plays a dominate role in the heat transfer between land and the atmosphere. Xu et al. [60] found that the Dali observation area is a carbon sink and the magnitude of the net uptake decreased significantly from approximately 739  g C m−2 a−1 during 2007–2013 to 218  g C m−2 a−1 during 2014–2018. Based on the EC measurement data above Erhai Lake, Feng et al. [61] found that this lake acted as a heat sink from March through June and quickly released heat into the atmosphere from September through to December. The average energy balance closure was about 80% in 2012. Liu et al. [62] and Du et al. [36] found that the diurnal Hs and LE over this lake ranged from –31 to 21 W m−2 and from 31 to 171 W m−2, respectively. The annual total evaporation varied from 1120.8 to 1228.5 mm a−1. This lake acts as a net CO2 source with an annual CO2 budget ranging from 117.5 to 161.7 g C m−2 a−1. Du et al. [63] found that the temperature difference between the water surface and air temperature was the main driver for Hs and the wind speed had a weak effect on Hs, but a strong effect on the LE and CO2 fluxes.

3.2.5. Typical Weather Events Characteristics

In the case of torrential rain weather, Dong et al. [64,65,66] found that WPR data can directly show the vertical structure of the wind field with time, and can also show the times of the beginning and end of precipitation as well as the intensity of precipitation. The fluctuations of the three-dimensional wind were gradually large, and wind shears appeared in the vertical direction before the precipitation. The power spectra density appeared as double peaks, and the detection heights gradually increased during the precipitation. Chen et al. [67] found that the intensity of severe convective rainfall was positively associated with the maximum detection height and its increased range. The mesoscale low-level jets appeared 3 to 4 h ahead of the occurrence of strong rainfall. In the case of gales, Yang et al. [68] found that the downward transfer of sensible and latent heat provided thermal conditions that produced and maintained the gale. When the Hs and LE are out of phase to each other, it also can be an indicator to the gale. In the case of frost event, Xu et al. [69] found that the meteorological elements showed significant changes due to the near surface affected by cold air and clear sky radiation before the frost.

4. Progress in Application Research

4.1. Observation Dataset Support for Numerical Simulations under Complex Terrain Conditions

Based on the Weather Research and Forecasting (WRF) model and combined with the existing observation data, several simulation tests were conducted to better understand the exchange processes between land and atmosphere, and the terrain-induced airflow phenomena as well as to improve the simulation capability of numerical weather forecast over the small- and medium-scale terrain area. Yang and Fu [70] simulated a precipitation event that occurred in the western Yunnan region using the WRF model and Gridpoint Statistical Interpolation assimilation system. It was found that the precipitation belt location could be predicted by both the control model and assimilation model, although the intensity predicted by the control model was a little larger. Xu et al. [71] simulated the planetary boundary layer and local circulation characteristics over Erhai Lake with the lake-atmosphere coupled model WRF v3.7.1. It was found that the local circulation was fully developed under the weak synoptic system and the atmospheric boundary layer height ran up to 2300 m during the pre-monsoon period. During the monsoon period, the temperature difference between the land and lake became smaller, resulting in weaker local circulations. Xue et al. [72] investigated a gale event that occurred on the lee side of a long narrow mountain and the associated mountain flows by using a realistic-case large-eddy simulation (LES) with a high horizontal resolution as fine as 111 m. It was found that the LES could replicate features similar to the wind fields observed during the gale period. The early morning wind structure over the mountain revealed that weak inflows were blocked, reversed, and divided in the upstream area and that some weak lee waves, rotors, and two clear lee vortices were evident downstream. As the upstream wind accelerated and the boundary layer developed during the daytime, the lee waves became amplified with severe downslope wind and rotors.

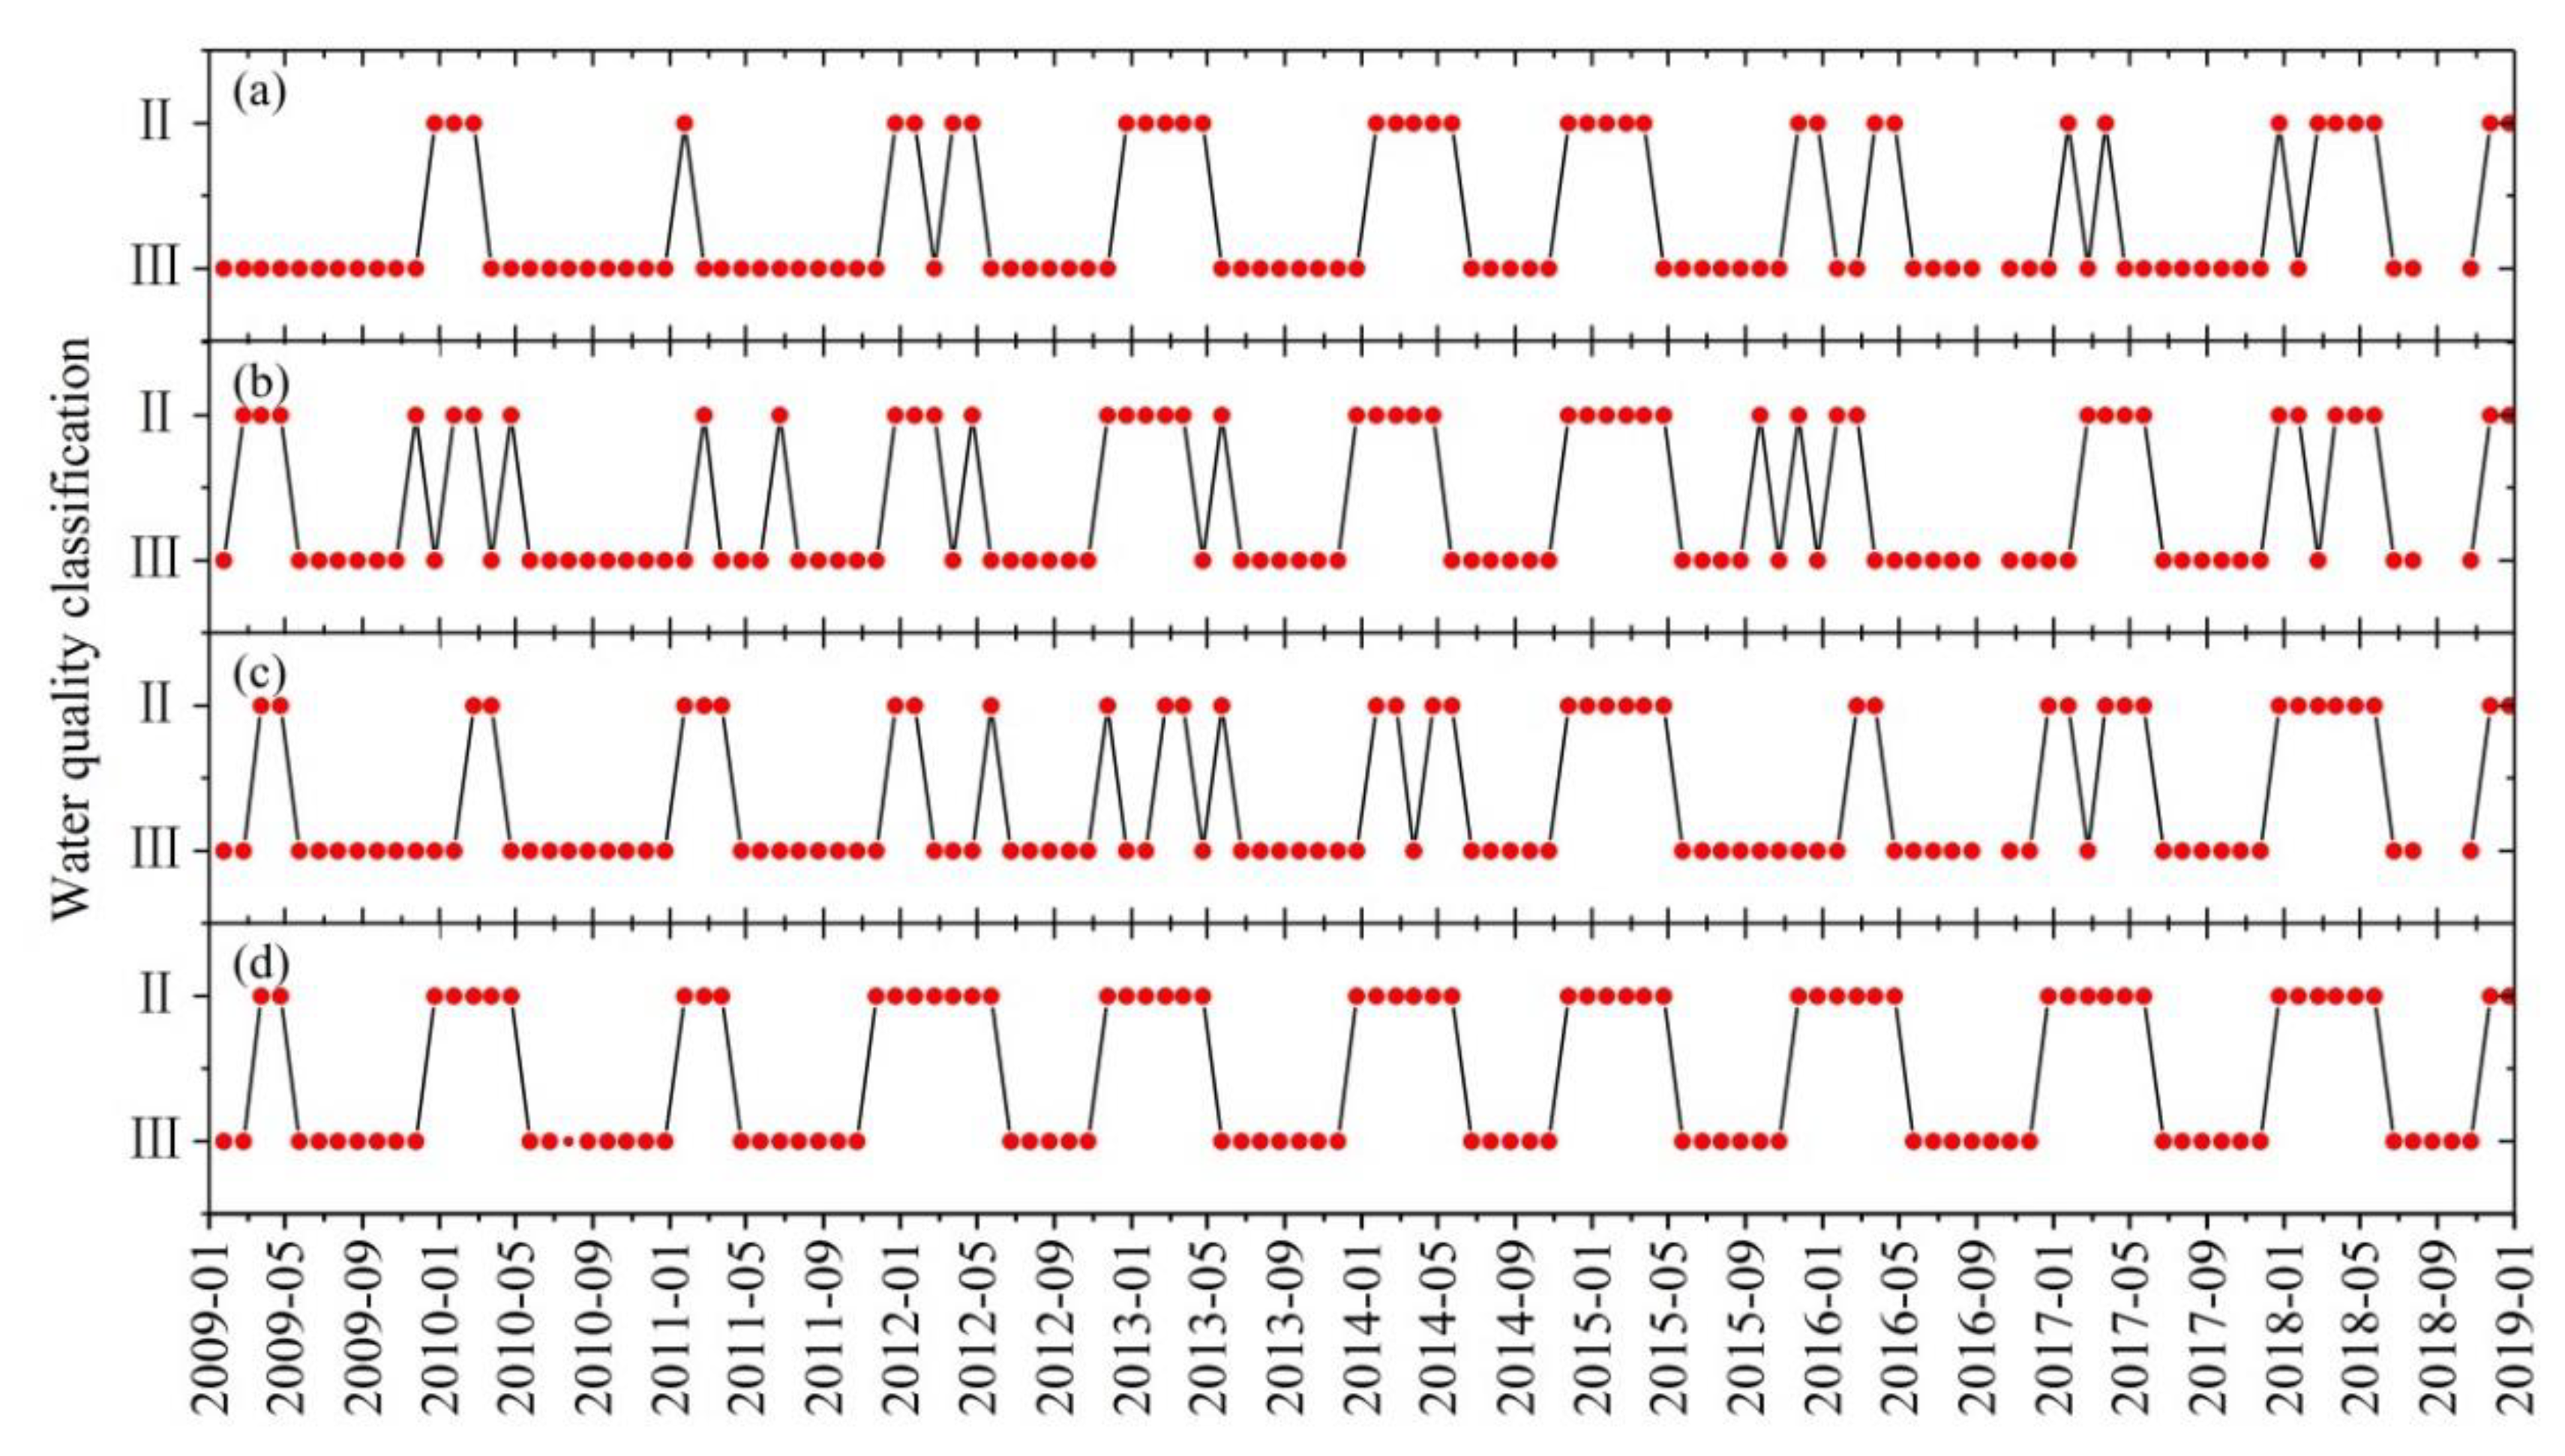
4.2. Influence of Meteorological Conditions on Water Quality Factors of Erhai Lake

Based on the atmospheric observational data at the DNCO and water quality data of Erhai Lake, the water quality variation and influence of meteorological conditions on the water quality factors were analyzed. It is found that the water quality of Erhai Lake fluctuates between class II and class III, and is characterized by a clear season change, with class II in the dry season and class III in the wet season (Figure 8). Water temperature, transparency, dissolved oxygen, dissolved oxygen saturation rate, permanganate index, total phosphorus, total nitrogen, ammonia nitrogen, chlorophyll A, and algae number are obviously affected by climatic conditions. Among them, the correlations of water temperature and air temperature, soil temperature, and long-wave radiation were the highest positive with a correlation coefficient up to 0.97, and the correlations of the other water quality factors and boundary layer wind speed, near-surface turbulent flux, precipitable water vapor, surface radiation, and conventional meteorological elements were high with the maximum correlation coefficient between 0.5 and 0.8. The chemical oxygen demand and five-day biochemical oxygen demand have a weak relationship with meteorological elements.

5. Conclusions and Future Works

Since May 2006, the DNCO has conducted field observations and scientific research activities in accordance with four objectives: the weather and climate changes and their formation mechanism over the mountainous area, the land–atmosphere interactions over the southeast extension of the TP, and the water vapor changes in the major water vapor path of southwest China as well as regional eco-meteorology and environmental protection. Meanwhile, the DNCO has implemented an integrated meteorological network for the atmospheric boundary layer, typical profile of mountain meteorology, reference radiation and climatology, meteorology, and hydrology of Erhai Lake, and other parameters such as lightning, soil moisture, and water vapor over a typical small- and medium-scale terrain area. Based on the observation data of this network, some significant progresses in the application research have been achieved. However, observations for the atmospheric profiles of wind, temperature, humidity, pressure, aerosol, and etc. are very much lacking in this network, and existing observation projects have mainly been installed in the lee region of the mountain. This limits the understanding of the three-dimensional structure of the atmosphere over mountainous areas. On the other hand, the conventional observation instruments were installed on the mountain top station. In winter, wind speed and direction as well as precipitation data were missing because the mechanical anemometer and tipping-bucket precipitation gauge were frozen. It has been suggested that ultrasonic sensors and weighing precipitation gauge can be used to measure wind speed and direction, and precipitation under high mountain environments, respectively. To fill these gaps, the DNCO plans to construct a higher resolution observation system and an information platform for the mountain meteorology. First, focused on the atmospheric thermal and dynamic effects on the terrain, two sets of cloud radar, two sets of microwave radiometer, and a set of wind profile radar are planned to be added. Second, focused on the difference characteristics of land–atmosphere interaction over different underlying surfaces, three sets of PBL tower flux observation systems and a set of double-wave scintillometers are planned for addition. Third, around the key problems of eco-meteorological monitoring and environmental protection, two sets of the comprehensive observation system in northern and southern Erhai Lake are being planned. Finally, existing observation instruments to obtain high-quality data are planned for update. In this way, the DNCO can achieve comprehensive observations for mountain meteorology over the upstream region, blocking region, mountain region, Lee region, and downstream region.

Author Contributions

Writing—original draft preparation, A.X., and J.L.; Writing—review and editing, A.X.; Funding acquisition, J.L. All authors have read and agreed to the published version of the manuscript.

Funding

This research was funded by the National Natural Science Foundation of China (91637210, 41875123, and 91737306), and Jiangsu Collaborative Innovation Center for Climate Change.

Acknowledgments

We would like to thank the relevant leaders and experts in the China Meteorological Administration, Chinese Academy of Meteorological Sciences, Yunnan Provincial Meteorological Bureau, Yunnan Institute of Meteorological Sciences, Dali Prefecture Meteorological Bureau, and Institute of Atmospheric Physic, Chinese Academy of Sciences for their support of the construction of the Dali National Climate Observatory and providing measurement instruments.

Conflicts of Interest

The authors declare no conflict of interest.

References

  1. IPCC. Climate Change 2007: The Physical Science Basis. Contribution of Working Group I to the Fourth Assessment Report of the Intergovernmental Panel on Climate Change; Colomon, S., Qin, D.H., Manning, M., Marquis, M., Averyt, K., Tignor, M., Miller, H.L., Chen, Z.L., Eds.; Cambridge University Press: Cambridge, UK; New York, NY, USA, 2007; pp. 5–6. [Google Scholar]
  2. Zhang, R.H.; Xu, X.D. Chinese Climate Observing System; China Meteorological Press: Beijing, China, 2008; pp. 1–29. [Google Scholar]
  3. Houghton, J.; Townshend, J.; Dawson, K.; Mason, P.; Zillman, J.; Simmons, A. The GCOS at 20 years: The origin, achievement and future development of the Global Climate Observing System. Weather 2012, 67, 227–235. [Google Scholar] [CrossRef]
  4. Thorne, P.W.; Diamond, H.J.; Goodison, B.; Harrigan, S.; Hausfather, Z.; Ingleby, N.B.; Jones, P.D.; Lawrimore, J.H.; Lister, D.H.; Merlone, A.; et al. Towards a global land surface climate fiducial reference measurements network. Int. J. Climatol. 2018, 38, 2760–2774. [Google Scholar] [CrossRef]
  5. Conover, J.H. Blue Hill Meteorological Observatory: The First 100 Years, 1885–1985; American Meteorological Society: Boston, MA, USA, 1990; pp. 1–514. [Google Scholar]
  6. Magee, N.B.; Melaas, E.; Finocchio, P.M.; Jardel, M.; Noonan, A.; Iacono, M.J. Blue Hill Observatory Sunshine: Assessment of climate signals in the longest continuous meteorological record in North America. Bull. Am. Meteorol. Soc. 2014, 95, 1741–1751. [Google Scholar] [CrossRef]
  7. Neisser, J.; Adam, W.; Beyrich, F.; Leiterer, U.; Steinhagen, H. Atmospheric boundary layer monitoring at the Meteorological Observatory Lindenberg as a part of the “Lindenberg Column”: Facilities and selected results. Meteorol. Z. 2002, 11, 241–253. [Google Scholar] [CrossRef]
  8. Adam, W.; Dier, H.; Leiterer, U. 100 years aerology in Lindenberg and first long-time observations in the free atmosphere. Meteorol. Z. 2005, 14, 597–607. [Google Scholar] [CrossRef]
  9. Berger, F.H.; Hantel, M. Meteorological Observatory Lindenberg 1905–2005. Meteorol. Z. 2005, 14, 596. [Google Scholar] [CrossRef]
  10. Michael, W.; Klaus, G. Long-term observations of aerosol optical depths at the Meteorological Observatory Lindenberg. Meteorol. Z. 2005, 14, 651–662. [Google Scholar]
  11. Overton, A.K. Jungfraujoch high altitude research station. Weather 2008, 63, 76–79. [Google Scholar] [CrossRef]
  12. Bonasoni, P.; Laj, P.; Angelini, F.; Arduini, J.; Bonafetè, F.; Calzolari, F.; Cristofanelli, P.; Decesari, S.; Facchin, M.C.; Fuzzi, S.; et al. The ABC-Pyramid atmospheric research observatory in Himalaya for aerosol, ozone and halocarbon measurements. Sci. Total Environ. 2008, 391, 252–261. [Google Scholar] [CrossRef] [PubMed]
  13. Bonasoni, P.; Laj, P.; Marinoni, A.; Sprenger, M.; Angelini, F.; Arduini, J.; Bonafè, U.; Calzolari, F.; Colombo, T.; Decesari, S.; et al. Atmospheric brown clouds in the Himalayas: First two years of continuous observations at the Nepal Climate Observatory—Pyramid (5079 m). Atmos. Chem. Phys. 2010, 10, 7515–7531. [Google Scholar] [CrossRef] [Green Version]
  14. Meybeck, M.; Green, P.; Vörösmarty, C. A new typology for mountains and other relief classes: An application to global continental water resources and population distribution. Mt. Res. Dev. 2001, 21, 34–45. [Google Scholar] [CrossRef] [Green Version]
  15. Lehner, M.; Whiteman, C.D.; Hoch, S.W.; Jensen, D.; Pardyjak, E.R.; Leo, L.S.; Sabation, S.D.; Fernando, H.J.S. A case study of the nocturnal boundary layer evolution on a slope at the foot of a desert mountain. J. Appl. Meteorol. Climatol. 2015, 54, 732–751. [Google Scholar] [CrossRef]
  16. Smith, R.B. 100 years of progress on mountain meteorology research. Meteorol. Monogr. 2018, 59, 20.1–20.73. [Google Scholar] [CrossRef]
  17. Whiteman, C.D. Mountain Meteorology: Fundamentals and Applications; Oxford University Press: New York, NY, USA, 2000; pp. 171–202. [Google Scholar]
  18. Barry, R.G. Mountain Weather and Climate, 3rd ed.; Cambridge University Press: Boulder, CO, USA, 2008; pp. 186–250. [Google Scholar]
  19. Jackson, P.L.; Mayr, G.; Vosper, S. Dynamically-driven winds. In Mountain Weather Research and Forecasting: Recent Progress and Current Challenges; Chow, F.K., De Weaker, S.F.J., Snyder, B.J., Eds.; Springer: New York, NY, USA, 2013; pp. 121–218. [Google Scholar]
  20. Gultepe, I. Mountain Weather: Observation and Modeling. Adv. Geophys. 2015, 56, 229–312. [Google Scholar]
  21. Durán, L.; Rodríguez-Muñoz, I.; Sánchez, E. The Peñalara Mountain meteorological network (1999–2014): Description, preliminary results and lessons learned. Atmosphere 2017, 8, 203. [Google Scholar] [CrossRef] [Green Version]
  22. Emeis, S.; Kalthoff, N.; Adler, B.; Pardyjak, E.; Paci, A.; Junkermann, W. High-resolution observations of transport and exchange processes in mountainous terrain. Atmosphere 2018, 9, 457. [Google Scholar] [CrossRef] [Green Version]
  23. Tao, S.Y.; Luo, S.W.; Zhang, H.C. The Qinghai-Xizang Plateau Meteorological Experiment (QXPMEX) May-August 1979. In Proceedings of the International Symposium on the Qinghai-Xizang Plateau and Mountain Meteorology; Xu, Y.G., Ed.; Science Press: Beijing, China; American Meteorological Society: Boston, MA, USA, 1986; pp. 3–13. [Google Scholar]
  24. Zhou, M.Y.; Xu, X.D.; Bian, L.G.; Chen, J.Y.; Liu, H.Z.; Zhang, H.S.; Li, S.M.; Zhao, Y.J. Observational Analysis and Dynamic Study of Atmospheric Boundary Layer on Tibetan Plateau: Tibetan Plateau Experiment of Atmospheric Sciences, (TIPEX) 1998; China Meteorological Press: Beijing, China, 2000. [Google Scholar]
  25. Zhao, P.; Xu, X.D.; Chen, F.; Guo, X.L.; Zheng, X.D.; Liu, L.P.; Hong, Y.; Li, Y.Q.; La, Z.; Peng, H.; et al. The third atmospheric scientific experiment for understanding the earth-atmosphere coupled system over the Tibetan Plateau and its effects. Bull. Am. Meteorol. Soc. 2018, 99, 757–776. [Google Scholar] [CrossRef]
  26. Zhao, P.; Li, Y.Q.; Guo, X.L.; Xu, X.D.; Liu, Y.M.; Tang, S.H.; Xiao, W.M.; Shi, C.X.; Ma, Y.M.; Yu, X.; et al. The Tibetan Plateau surface-atmosphere coupling system and its weather and climate effects: The Third Tibetan Plateau Atmospheric Science Experiment. J. Meteor. Res. 2019, 33, 375–399. [Google Scholar] [CrossRef]
  27. Kuettner, J.P.; O’Neill, T.H. ALPEX: The GARP mountain subprogram. Bull. Am. Meteorol. Soc. 1981, 62, 793–805. [Google Scholar] [CrossRef] [Green Version]
  28. Bougeault, P.; Benech, B.; Bessemoulin, P.; Carissimo, B.; Clar, A.J.; Pelon, J.; Petitdidier, M.; Richard, E. PYREX: A summary of findings. Bull. Am. Meteorol. Soc. 1997, 78, 637–650. [Google Scholar] [CrossRef] [Green Version]
  29. Bougeault, P.; Binder, P.; Buzzi, A.; Dirks, R.; Houze, R.; Kuettner, J.; Smith, R.B.; Steinacker, R.; VoIkert, H. The MAP special observing period. Bull. Am. Meteorol. Soc. 2001, 82, 433–462. [Google Scholar] [CrossRef] [Green Version]
  30. Grubišić, V.; Doyle, J.D.; Kuettner, J.; Mobbs, S.; Smith, R.B.; Whiteman, C.D.; Dirks, R.; Czyzyk, S.; Cohn, S.A.; Vosper, S.; et al. The terrain-induced rotor experiment: A field campaign overview including observational highlights. Bull. Am. Meteorol. Soc. 2008, 89, 1513–1533. [Google Scholar] [CrossRef]
  31. Fernando, H.J.; Pardyjak, E.R.; Di Sabatino, S.; Chow, F.K.; De Wekker, S.F.; Hoch, S.W.; Hacker, J.; Pace, J.C.; Pratt, T.; Pu, Z.; et al. The MATERHORN: Unraveling the intricacies of mountain weather. Bull. Am. Meteorol. Soc. 2015, 96, 1945–1967. [Google Scholar] [CrossRef]
  32. Houze, R.A.; McMurdie, L.A.; Petersen, W.A.; Schwaller, M.R.; Baccus, W.; Lundquist, J.D.; Mass, C.F.; Nijssen, B.; Rutledge, S.A.; Hudak, D.R.; et al. The Olympic Mountains Experiment (OLYMPEX). Bull. Am. Meteorol. Soc. 2017, 98, 2167–2188. [Google Scholar] [CrossRef]
  33. Rotach, M.W.; Stiperski, I.; Fuhrer, O.; Goger, B.; Gohm, A.; Obleitner, F.; Rau, G.; Sfyri, E.; Vergeiner, J. Investigating exchange processes over complex topography: The Innsbruck box (i-Box). Bull. Am. Meteorol. Soc. 2017, 98, 787–805. [Google Scholar] [CrossRef]
  34. Udina, M.; Bech, J.; Gonzalez, S.; Soler, M.R.; Paci, A.; Miró, J.R.; Trapero, L.; Donier, J.M.; Douffet, T.; Codina, B.; et al. Multi-sensor observations of an elevated rotor during a mountain wave event in the Eastern Pyrenees. Atmos. Res. 2020, 234, 104698. [Google Scholar] [CrossRef]
  35. Butler, B.W.; Wagenbrenner, N.S.; Forthofer, J.M.; Lamb, B.K.; Shannon, K.S.; Finn, D.; Eckman, R.M.; Clawson, K.; Bradshaw, L.; Sopko, P.; et al. High-resolution observations of the near-surface wind field over an isolated mountain and in a steep river canyon. Atmos. Chem. Phys. 2015, 15, 3785–3801. [Google Scholar] [CrossRef] [Green Version]
  36. Du, Q.; Liu, H.Z.; Liu, Y.; Wang, L.; Xu, L.J.; Sun, J.H.; Xu, A.L. Factors controlling evaporation and the CO2 flux over an open water lake in southwest of China on multiple temporal scales. Int. J. Climatol. 2018, 38, 1–17. [Google Scholar] [CrossRef]
  37. Xu, X.D.; Zhang, R.H.; Koike, T.; Lu, C.G.; Shi, X.H.; Zhang, S.J.; Bian, L.G.; Cheng, X.H.; Li, P.Y.; Ding, G.A. A new integrated observational system over the Tibetan Plateau. Bull. Am. Meteorol. Soc. 2008, 89, 1492–1496. [Google Scholar]
  38. Zhang, R.H.; Koike, T.; Xu, X.D.; Ma, Y.M.; Yang, K. A China-Japan cooperative JICA atmospheric observing network over the Tibetan Plateau (JICA/Tibet Project): An overviews. J. Meteorol. Soc. Jpn. 2012, 90, 1–16. [Google Scholar] [CrossRef] [Green Version]
  39. Burba, G. Eddy Covariance Method for Scientific, Industrial, Agricultural, and Regulatory Applications; LI-COR Biosciences: Lincoln, NE, USA, 2013; pp. 200–201. [Google Scholar]
  40. Dong, B.J.; Zhang, Y.; Xu, A.L. Assessment of wind profiler radar data in plateau area. Meteorol. Sci. Technol. 2009, 37, 580–583. [Google Scholar]
  41. Xu, A.L.; Li, J.; Liu, H.Z.; Sun, J.H. Quality control of surface radiation data measured in Dali National Climate Observatory. Plateau Meteorol. 2013, 32, 1432–1441. [Google Scholar]
  42. Sun, J.H.; Wu, P.; Liu, J.Y. Calculation scheme and accuracy test of ground-based GPS atmospheric water vapour in Yunnan. J. Nanjing Univ. Inf. Sci. Technol. Nat. Sci. Ed. 2013, 5, 106–112. [Google Scholar]
  43. Ren, J.Z.; Sun, J.H.; Li, J.; Xu, K. Comparison of precipitation in Yunnan from GPS observation data and three reanalysis data. Plateau Meteorol. 2014, 33, 1480–1489. [Google Scholar]
  44. Xu, A.L.; Sun, J.H.; Li, J.; Feng, J.W.; Dong, B.J.; Liu, J.S. A study on the data processing and quality assessment of the eddy-covariance system at Dali National Climate Observatory. J. Yunnan Univ. 2014, 36, 224–232. [Google Scholar]
  45. Wilczak, J.M.; Oncley, S.P.; Stage, A. Sonic anemometer tilt correction algorithms. Bound.-Layer Meteorol. 2001, 99, 127–150. [Google Scholar] [CrossRef]
  46. Webb, E.K.; Pearman, G.I.; Leuning, R. Correction of the flux measurements for density effects due to heat and water vapour transfer. Q. J. R. Meteorol. Soc. 1980, 106, 85–100. [Google Scholar] [CrossRef]
  47. Xu, A.L.; Peng, H.; Dong, B.J. Comparison of large aperture scintillometer and eddy-covariance system measurements with structure parameter of refractive index of air. Plateau Meteorol. 2015, 34, 935–941. [Google Scholar]
  48. Xu, A.L.; Li, J.; Peng, H.; Sun, J.H. Comparison of sensible and latent heat fluxes over farmland underlying surface of Erhai Lakeside region measured from large aperture scintillometer and eddy-covariance system. Plateau Meteorol. 2017, 36, 98–106. [Google Scholar]
  49. Li, N.N.; Li, J. Preliminary analysis of representativeness of precipitation observation over Southwest China. Plateau Meteorol. 2017, 36, 119–128. [Google Scholar]
  50. Yang, Z.; Liu, J.S.; Sun, J.H. Lake-land breeze and turbulence characteristics in the surface layer of valley and basin in Dali, Yunnan province. J. Meteorol. Environ. 2008, 24, 32–37. [Google Scholar]
  51. Xu, A.L.; Zhao, X.H.; Fu, Z.J.; Liu, J.S.; Sun, J.H. Comparison of meteorological elements over water and land surface in the Erhai Lake basin. Trans. Atmos. Sci. 2011, 34, 225–231. [Google Scholar]
  52. Dong, B.J.; Li, J.; Sun, J.H.; Xu, A.L.; Su, J.L. Vertical structure and variation characteristics of wind field in low-level atmosphere in the southeastern margin of Qinghai-Xizang Plateau. Plateau Meteorol. 2016, 35, 597–607. [Google Scholar]
  53. Xu, A.L.; Dong, B.J.; Liu, J.S.; Sun, J.H.; Zhu, Y.W. Structure and characteristic of the atmospheric boundary layer in Erhai Lakeside region of Dali. Plateau Meteorol. 2010, 29, 637–644. [Google Scholar]
  54. Xu, X.D.; Wang, Y.J.; Zhao, T.L.; Yao, W.Q. Relationship between turbulent energy in the near surface layer and atmospheric boundary layer thermodynamic structure over the southeastern side of Tibetan Plateau. Meteorol. Mon. 2014, 40, 1165–1173. [Google Scholar]
  55. Wang, Y.J.; Xu, X.D.; Zhao, T.L.; Sun, J.H.; Yao, W.Q.; Zhou, M.Y. Structures of convection and turbulent kinetic energy in boundary layer over the southeastern edge of the Tibetan Plateau. Sci. Chin. Earth Sci. 2015, 58, 1198–1209. [Google Scholar] [CrossRef]
  56. Xu, A.L.; Zhong, A.H.; Sun, J.H.; Yang, G.R. Vertical structure characteristic from troposphere to low stratosphere in Dali region over the southeastern margin of Qinghai-Xizang Plateau. Plateau Meteorol. 2016, 35, 77–85. [Google Scholar]
  57. Liu, S.H.; Liu, H.P.; Hu, Y.; Zhang, C.Y.; Liang, F.M.; Wang, J.H. Numerical simulations of land surface physical processes and land-atmosphere interactions over oasis-desert/Gobi region. Sci. Chin. Ser. D Earth Sci. 2007, 50, 290–295. [Google Scholar] [CrossRef]
  58. Yang, Z.; Liu, J.S.; Zhu, Y.W.; Dong, B.J. Comparative analyses of turbulent characteristics in near-surface layer in dry/wet periods at Dali. Meteorol. Sci. Technol. 2009, 37, 429–433. [Google Scholar]
  59. Xu, A.L.; Li, J.; Sun, J.H.; Liu, J.S.; Zhao, X.H. Analyses on micrometeorology characteristic and energy exchange in surface layer in Dali region of the southeastern margin of Tibetan Plateau. Plateau Meteorol. 2013, 32, 9–22. [Google Scholar]
  60. Xu, A.L.; Li, J. Long-term energy and CO2 flux observations over an agricultural field in southeastern Tibetan Plateau. Atmos. Chem. Phys. Discuss. 2020. in review. [Google Scholar]
  61. Feng, J.W.; Liu, H.Z.; Sun, J.H.; Wang, L. The surface energy budget and interannual variation of the annual total evaporation over a highland lake in Southwest China. Theor. Appl. Climatol. 2016, 126, 303–312. [Google Scholar] [CrossRef]
  62. Liu, H.Z.; Feng, J.W.; Sun, J.H.; Wang, L.; Xu, A.L. Eddy covariance measurements of water vapour and CO2 fluxes above the Erhai Lake. Sci. Chin. Earth Sci. 2015, 58, 317–328. [Google Scholar] [CrossRef]
  63. Du, Q.; Liu, H.Z.; Xu, L.J.; Liu, Y.; Wang, L. The monsoon effect on energy and carbon exchange processes over a highland lake in the southwest of China. Atmos. Chem. Phys. 2018, 18, 15087–15104. [Google Scholar] [CrossRef] [Green Version]
  64. Dong, B.J.; Liu, J.S.; Gao, Y.Z. Case study of heavy rainfall based on wind profiler radar products. Meteorol. Sci. Technol. 2009, 37, 411–414. [Google Scholar]
  65. Dong, B.J.; Fu, Z.J.; Li, M.; Yang, Y.J. Feature analysis of a rain storm with wind profile radar data. Meteorol. Sci. Technol. 2012, 40, 74–78. [Google Scholar]
  66. Dong, B.J.; Gao, Y.Z.; Zhang, L.F. Application of new-type observational data to analysis of a rainstorm weather event in northwestern Yunnan plateau. Meteorol. Sci. Technol. 2014, 42, 1077–1082. [Google Scholar]
  67. Chen, H.Y.; Gao, Y.Z.; Yin, L.Y.; Zhong, A.H.; Dong, B.J. Characteristics of extremes in WPR data during severe convective rainfall. Meteorol. Sci. Technol. 2016, 44, 87–94. [Google Scholar]
  68. Yang, C.; Fu, Z.J.; Zhao, X.H. Diagnostic analysis of winter gale complex terrain in the southeast of Qinghai-Xizang Plateau. Plateau Meteorol. 2014, 33, 346–354. [Google Scholar]
  69. Xu, A.L.; Yang, Y.J.; Sun, J.H.; Liu, J.S.; Li, W.H. Case study of PBL characteristics before and after late frost in Dali. Meteorol. Sci. Technol. 2011, 39, 513–519. [Google Scholar]
  70. Yang, C.; Fu, Z.J. Applicability of the WRF model in complex topographic conditions: A case study on precipitation simulation in the western Yunnan region. Adv. Meteorol. Sci. Technol. 2019, 9, 23–29. [Google Scholar]
  71. Xu, L.J.; Liu, H.Z.; Du, Q.; Wang, L.; Liu, Y.; Sun, J.H. Differences of atmospheric boundary layer characteristics between pre-monsoon and monsoon period over the Erhai Lake. Theor. Appl. Climatol. 2019, 135, 305–321. [Google Scholar] [CrossRef]
  72. Xue, H.L.; Li, J.; Qian, T.T.; Gu, H.P. A 100-m-scale modeling study of a gale event on the lee side of a long narrow mountain. J. Appl. Meteorol. Climatol. 2020, 59, 23–45. [Google Scholar] [CrossRef]
Figure 1. Location of the Dali National Climate Observatory (DNCO) and its topographic situation as well as the network layout for the integrated meteorological observations over a typical terrain region. Yellow marker: the DNCO; blue marker: the Yangbi National Meteorological Station (YNMS); white marker: observation platform over Erhai Lake; green markers: typical profile observation stations of mountain meteorology; pink markers: six-factor automatic weather stations around Erhai Lake. The map was from the Google Earth.
Atmosphere 11 00279 g001
Figure 2. Monthly average air temperature (a) and precipitation (b) at the DNCO.
Atmosphere 11 00279 g002
Figure 3. Instruments of the integrated meteorological observations at the DNCO. (a) Dali National Reference Climatological Station; (b) 20-m planetary boundary layer tower; (c) wind profiler radar; (d) optical and microwave scintillometer; (e) observation platform over Erhai Lake; (f) typical profile observation of mountain meteorology (e.g., Dianshizhuanbotai site); (g) automatic weather stations around Erhai Lake (e.g., Wase site); (h) baseline surface radiation observation; (i) lightning location detector; (j) atmospheric electric field mill; (k) ground-based Global Position System (GPS) water vapor system; (l) cosmic-ray soil moisture observing system.
Atmosphere 11 00279 g003
Figure 4. Operational platform (a) and database system (b) of the DNCO.
Atmosphere 11 00279 g004
Figure 5. Scatter plot of the structure parameter of the refractive index of air (Cn2) (a) as well as sensible heat (Hs) (b) and latent heat (LE) (c) fluxes and measured with LAS and EC (adapted from [47,48]).
Atmosphere 11 00279 g005
Figure 6. Diurnal variations in prevailing wind frequency over the lake surface and land surface in the Erhai Lake basin (adapted from [51]).
Atmosphere 11 00279 g006
Figure 7. Annual mean diurnal variation (top), month-hour cross-sections (bottom) and monthly variation (right) of sensible heat flux (a), latent heat flux (b) in Dali from 2008 to 2009 (adapted from [59]).
Atmosphere 11 00279 g007
Figure 8. Monthly variation of water quality classification at the northern (a), central (b), southern (c) and whole of (d) Erhai Lake.
Atmosphere 11 00279 g008
Table 1. Basic characteristics of the sites for typical profile observations of mountain meteorology, where measured variables including wind speed (WS), wind direction (WD), relative humidity (RH), air temperature (Ta), air pressure (Pa), soil temperature (Ts) at depths of 0, 10, 15, and 20 cm, soil moisture profile (Ms) at depths of 5, 10, and 20 cm, and precipitation (PPT), but variables of each site are different.
Station NameLocationVariablesObserving Time
DianshizhuanbotaiPeak of mountains100°05′32″ E, 25°40′13″ N, 4092 mWS, WD, RH, Ta, Pa, PPTSince December 2010
ShansitingEast slope of mountains100°06′14″ E, 25°41′05″ N, 3520 mWS, WD, RH, Ta, Pa, Ts, Ms, PPTSince April 2011
Baiquesi100°07′08″ E, 25°04′59″ N, 2660 mWS, WD, RH, Ta, Pa, Ts, Ms, PPTSince January 2011
Yanghe100°09′36″ E, 25°40′12″ N, 2130 mWS, WD, RH, Ta, Pa, Ts, PPTSince December 2010
DaduiziWest slope of mountains100°02′47″ E, 25°40′53″ N, 2980 mTa, PPTFrom May 2011 to November 2013
Qiutian100°02′12″ E, 25°40′57″ N, 2545 mTa, PPTFrom May 2011 to April 2014
Shangyuan100°01′16″ E, 25°39′39″ N, 1920 mTa, PPTFrom May 2011 to November 2013
TianjinggeEast shore of Erhai Lake100°14′12″ E, 25°42′50″ N, 2080 mWS, WD, RH, Ta, Pa, Ts, PPTSince December 2010

