Article

Evaluation of the Soil, Vegetation, and Snow (SVS) Land Surface Model for the Simulation of Surface Energy Fluxes and Soil Moisture under Snow-Free Conditions

1
Department of Civil and Water Engineering, Université Laval, Québec, QC G1V 0A6, Canada
2
CentrEau-Water research center, Université Laval, Québec, QC G1V 0A6, Canada
3
Environment and Climate Change Canada, Environmental Numerical Prediction Research, Dorval, QC H9P1J3, Canada
*
Author to whom correspondence should be addressed.
Atmosphere 2020, 11(3), 278; https://doi.org/10.3390/atmos11030278
Submission received: 8 February 2020 / Revised: 7 March 2020 / Accepted: 9 March 2020 / Published: 12 March 2020
(This article belongs to the Section Biosphere/Hydrosphere/Land–Atmosphere Interactions)

Abstract

:
The recently developed Soil, Vegetation, and Snow (SVS) land surface model is being progressively implemented at Environment and Climate Change Canada (ECCC) for operational numerical weather and hydrological predictions. The objective of this study is to evaluate the ability of SVS, in offline point-scale mode and under snow-free conditions, to simulate the surface heat fluxes and soil moisture when compared to flux tower observations and simulations from the Canadian Land Surface Scheme (CLASS), used here as a benchmark model. To do this, we performed point-scale simulations of between 4 and 12 years of data records at six selected sites of the FLUXNET network under arid, Mediterranean and tropical climates. At all sites, SVS shows realistic simulations of latent heat flux, sensible heat flux and net radiation. Soil heat flux is reasonably well simulated for the arid sites and one Mediterranean site and poorly simulated for the tropical sites. On the other hand, surface soil moisture was reasonably well simulated at the arid and Mediterranean sites and poorly simulated at the tropical sites. SVS performance was comparable to CLASS not only for energy fluxes and soil moisture, but also for more specific processes such as evapotranspiration and water balance.

1. Introduction

Land surface models (LSMs) simulate energy and water exchanges between the different components of a land system. LSMs are typically integrated into numerical weather prediction and climate projection schemes in order to provide the required surface boundary conditions [1,2]. They are also a component of land–surface data assimilation systems [3,4,5], as well as hydrological prediction systems [6].
LSMs for use in weather and climate modeling have been the subject of intense development over the last three decades [7,8]. They consolidate knowledge acquired from micrometeorology, soil sciences, as well as field and laboratory research in plant physiology. The complexity inherent to these models makes them remarkable in their capacity to capture energy and moisture exchanges within the soil, vegetation and snow components, as well as hydrological processes at the catchment scale [2]. Substantial progress associated with LSM development has also resulted from model inter-comparison studies [9,10,11] that highlighted the interest in running LSMs decoupled from their host atmospheric model, since offline simulations allow computationally inexpensive research and model improvement [12,13]. A good example is the Canadian Land Surface Scheme (CLASS) [14,15] that has been successfully assessed (e.g., [16,17,18,19]) and widely applied over the North American boreal zone (e.g., [20,21,22,23,24,25]) and other environments (e.g., [26,27,28,29,30]), and more recently in a hydrological context (e.g., [31,32,33]).
According to Pitman [7], the two key equations representing the land surface processes are the energy and water balances. The first one, applied to a surface, is defined as follows:
R n = H + L E + G ,
where R n is net radiation; H and L E are the sensible and latent heat fluxes, respectively; and G is the soil heat flux. The water balance (under snow-free conditions) is defined as:
P = E T + R s u r f + R b a s e + Δ S ,
where P is precipitation, E T is evapotranspiration, R s u r f is the overland flow (possibly including subsurface lateral flow), R b a s e is the drainage (vertical flow from the bottom of the soil column) and Δ S is the variation in the water stored in the surface scheme (i.e., in the vegetation canopy, snowpack or soil column). Note that E T is linked to the surface energy balance by the latent heat flux term, L E = λ E T , where λ is the latent heat of vaporization. LSM assessment is typically done in the context of the evaluation of all terms of Equation (1). [9,34,35,36] and/or Equation (2) [37,38,39].
Environment and Climate Change Canada (ECCC) currently uses a modified version of the Interaction between Soil, Biosphere and Atmosphere (ISBA) LSM to produce operational weather forecasts [40,41,42]. ISBA provides surface fluxes of momentum, water and energy to the Global Environmental Multiscale (GEM) atmospheric model. To address particular limitations with their operational version of ISBA [40,41], ECCC developed the Soil, Vegetation and Snow (SVS) LSM. As documented by Alavi et al. [43] and Husain et al. [44], SVS introduces the following improvements compared to ISBA: a new tiling approach, an improved parameterization of the vegetation thermal coefficient, the inclusion (as an option) of photosynthesis processes, a new formulation of land surface albedo and emissivity, a root density function that depends on the vegetation type, an update of the snow melt process and multilayer vertical water transport in the soil.
In a weather prediction context, SVS improved ISBA offline simulations of soil moisture and brightness temperature during the warm season over the North American domain [43,44]. In a hydrologic context, SVS has been shown to produce satisfactory runoff simulations within the large and partly ungauged Lake Ontario basin [6], and in hindcasts of the June 2013 flood in Alberta (Canada) [45]. More recently, Maheu et al. [46] evaluated the point scale soil water transport component of SVS by using precipitation and latent heat fluxes as input data. The model component performed well when simulating soil moisture in Mediterranean and temperate climates of the United States. While previous studies have evaluated the general performance of SVS and contrasted it to ISBA, no detailed evaluation of SVS outside of the North American domain has been performed to date. Moreover, none of the studies focused on evaluating the ability of SVS to simulate surface energy fluxes. Thus, there is a clear need for additional evaluations of SVS focusing on the model’s potential to simulate vertical exchanges of heat and water for various climates and biome types. More particularly, we are interested in the evaluation of soil and vegetation components, but not the snow component, which deserves particular attention and would be the subject of another study.
The objective of this study was thus to evaluate the ability of SVS to simulate surface energy fluxes and soil moisture in snow-free conditions for various climate and biome types. SVS was assessed in its offline point-scale configuration by comparing its outputs to energy fluxes and near-surface measurements. It was also compared to simulations from the widely implemented CLASS model, which was used as a benchmark model.

2. Methodology

2.1. Study Sites

FLUXNET is a network of micrometeorological measurements. It includes more than 800 active and historic flux measurement sites spread across most of the world’s climatic regions and representative biomes [47]. Six FLUXNET sites were selected from a total of 212 sites in the FLUXNET2015 dataset updated in November 2016. The sites were filtered progressively using the following four criteria: (1) yearlong snow-free conditions (50 sites); (2) data availability of surface energy fluxes and volumetric soil moisture content measurements over multiple years (12 sites); (3) contrasting climate types; and (4) biomes (6 sites, Figure 1). Table 1 summarizes the main characteristics of the study sites, which were grouped, according to the Köppen–Geiger climate classification, as arid, Mediterranean and tropical climates. On the other hand, biome type was grouped according to the International Geosphere-Biosphere Programme (IGPB) as evergreen needleleaf forest (ENF), grassland (GRA), woody savanna (WSA), closed shrubland (CSH) and evergreen broadleaf forest (EBF).
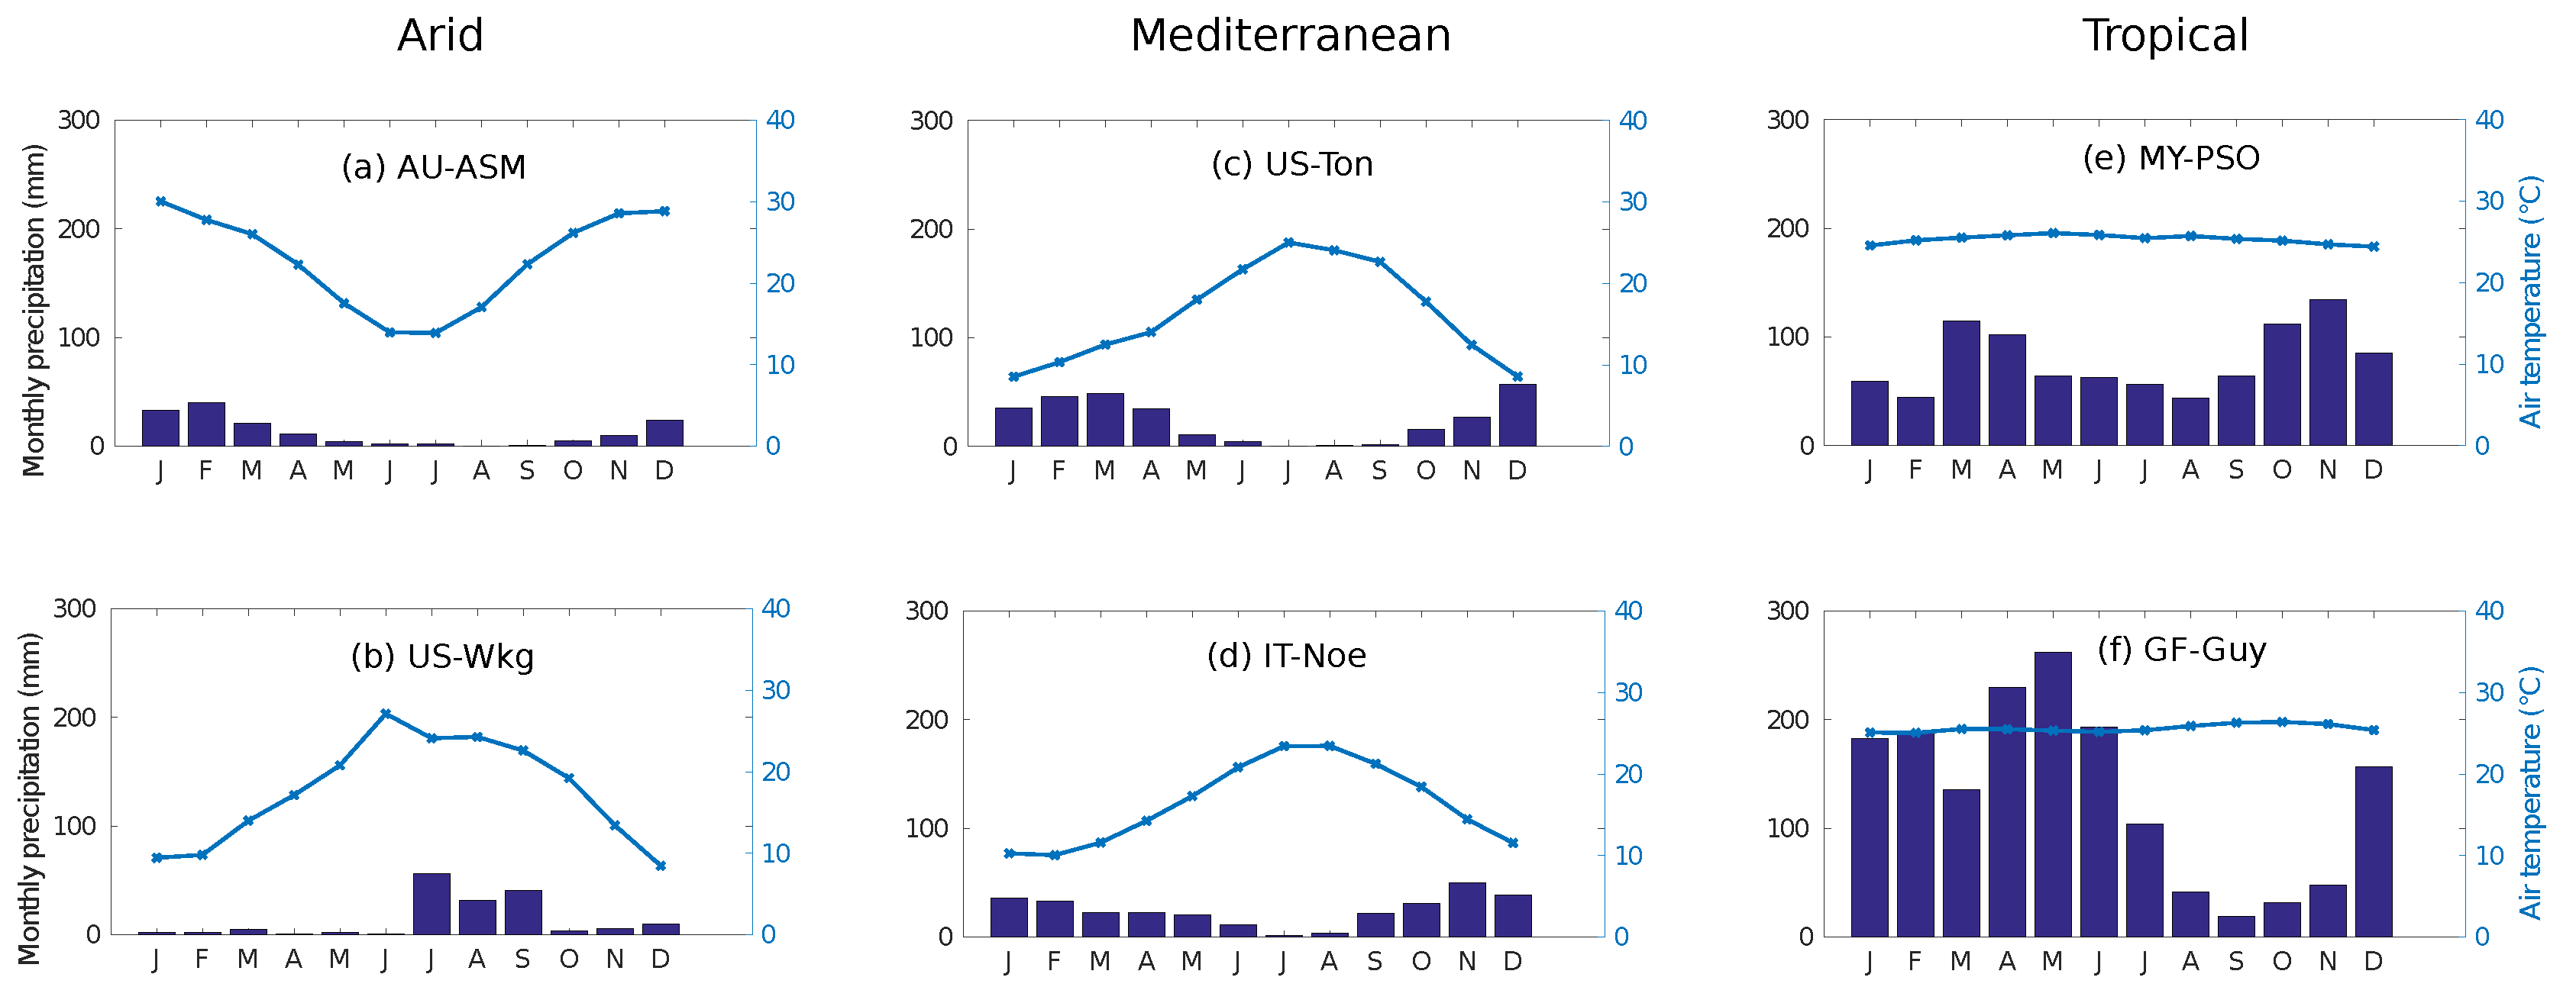
The sites show mean annual precipitation, ranging from 306 mm at the arid AU-ASM site to 3041 mm at the tropical GF-Guy site (Table 1). The mean annual air temperatures range from 15.6 to 25.7 C (Table 1) The AU-ASM site is covered with a mulga savanna woodland at the southern end of the North Australian tropical transect [48]. At this site, 70% of its annual precipitation occurs during the summer months (December–February) and 85% falls throughout the monsoon season (November–April). The mean monthly temperature can range from 13 C in June and July to 33 C in January (Figure 2a). The other arid site, US-Wkg, exhibits a drastic seasonality in precipitation patterns (Figure 2b), with 70% of the annual precipitation taking place during the summer months from July to September because of the annual cycle of the North American monsoon [49]. The land is covered mainly by a diverse mosaic of native grassland species replaced progressively by Lehman lovegrass starting in 2006 [50]. The US-Ton Mediterranean site has a mean annual precipitation of 559 mm, with 80% of it concentrated from November to April and with dry and warm conditions during the summer months from July to September (Figure 2c). Land cover is classified as an oak savanna woodland (dormant in winter and active in spring and summer) interspersed with grassland and forbs (mainly active during the rainy winter periods) [51]. The other Mediterranean site is in Italy, IT-Noe, and displays a similar behavior compared to the US-Ton site in terms of annual temperatures. Precipitation mainly occurs during Spring and high water deficit is observed from May through September. Intense storms provide significant runoff and low water storage during fall [52]. The main species of vegetation are juniper and lentisk with variable-sized patches of bare ground [52]. The MY-PSO tropical site has a mean annual precipitation of 1804 mm, which is less than other regions of Peninsular Malaysia [53]. Rainfall peaks in March and April and from October to December (Figure 2e). Monthly air temperature does not show seasonality and remains uniform around 27 C (Figure 2e). The area is covered by a mixed dipterocard forest with a continuous canopy height of around 35 m and some emergent trees surpassing 45 m [54]. The other tropical site, GF-Guy, presents intense precipitation during December–February and April–July due to the north–south movement of the Inter-Tropical Convergence Zone [55]. This site is located in a tropical wet forest with a mean tree height of 35 m and emerging trees exceeding 40 m [55].

2.2. Data

Micrometeorological forcing and validation data were both retrieved from FLUXNET2015 dataset (www.fluxnet.fluxdata.org) at 30-min time steps. The forcing data consisted of seven atmospheric variables needed to pilot both SVS and CLASS: air temperature ( C), precipitation (kg m - 2 s - 1 ), downward shortwave radiation (W m - 2 ), downward longwave radiation (W m - 2 ), wind speed (m s - 1 ), surface pressure (Pa) and specific humidity (kg kg - 1 ). Specific humidity was estimated as a function of relative humidity and air temperature following Gill [56]. FLUXNET2015 data are gap-filled with a combination of autocorrelation gap-filling techniques [57] and downscaled ERA-interim data [58].
The surface energy fluxes to be evaluated are the latent heat flux ( L E ), sensible heat flux (H), net radiation ( R n ), and soil heat flux (G). They were gap-filled using autocorrelation filling techniques [57]. The turbulent fluxes ( L E and H) were measured using the eddy-covariance technique [59]. They were also adjusted in the FLUXNET2015 dataset by an energy balance closure correcting factor ( ( R n - G )/( H + L E ) ). The factor avoid changes in the heat storage in the ecosystem. It was calculated at 30-min time intervals and applied only when energy closure fell outside 1.5 times the interquartile interval and when all the terms were available. Following similar studies by Blyth et al. [12] and Alves et al. [30], a daily energy balance closure filter was applied in order to guarantee a proper observed surface energy balance closure. The daily filter consisted of discarding days for which the error in energy balance closure exceeded 10%. The percentage of the data accepted is the following: AU-ASM (43.2%), US-Wkg (17.3%), US-Ton (11.2%), IT-Noe (29.4%), MY-PSO (91.6%), and GF-Guy was not filtered because observations of G were not available.
Observed volumetric soil water content corresponds to the topsoil layer, typically between 5 and 10 cm. It was also gap-filled using autocorrelation filling techniques [57]. Soil moisture observations were derived from electrical property of the soil. More exactly, theta ML2-X probes (Delta-T Devices) were deployed at US-Ton [60], Stevens Water Hydra Probe sensors at US-Wkg [61]; reflectometry probes at AU-ASM (CS605 and TDR100 Campbell Scientific [62]), at IT-Noe (CS616-L Campbell Scientific [52]), at MY-PSO (CS615 and CS616, Campbell Scientific [54]), and at GF-Guy (TRIME FM3; Imko, Ettlingen [55]).

2.3. Land Surface Models

2.3.1. SVS

SVS is a land surface model recently developed at ECCC [43,44]. In SVS, each grid cell may be divided into the following four tiling components: (1) bare ground; (2) vegetation (low and high); (3) snow over bare ground and low vegetation; and (4) snow under high vegetation. In the absence of snow, only Components (1) and (2) are taken into account. The model considers a single-layer approach for the vegetation canopy, a one-layer snowpack and a user-defined number of soil layers, with user-defined depth (by default set to seven layers) to compute soil moisture. The force-restore method is used to solve the energy budgets of each surface tile. Schematic diagrams of the hydrological regime and the tiling implementation in SVS soil part can be found in the works of Alavi et al. [43] and Husain et al. [44].
The energy budgets for the different tiles are obtained using the frce-restore approach. In the presence of different vegetation types, in a single grid cell, a single energy budget is calculated using mean vegetation parameters (such as albedo and emissivity) based on a weighted mean of the parameters of each individual type of vegetation present in the grid cell, and their respective fractional coverage. The net radiation for each type of vegetation is estimated taking into account total incoming solar and infrared radiation, as well as vegetation albedo and emissivity. The sensible and latent heat fluxes over vegetation are modeled using the bulk aerodynamic approach [43]. The soil heat flux was computed as the residual of the net radiation and the sensible and latent heat fluxes.
As described by Husain et al. [44], SVS distinguishes among 21 types of vegetation. In each grid cell, a varying combination of these vegetation types can be present. Vegetation parameters, such as leaf area index, roughness length, heat capacity of vegetation, albedo, stomatal resistance and root depth, are assigned separately for each vegetation-type and are specified using look-up tables. The canopy interception capacity is computed as a function of the leaf area index. If the canopy surface is covered with a film of intercepted rainfall (or if the vapor flux is toward the canopy), evaporation (condensation) takes place following the bulk aerodynamic approach. If the canopy is dry, the transpiration from leaves is computed by introducing the stomatal resistance to the evaporation. To compute the stomatal resistance, SVS has the option to use either a Jarvis-type approach [44] or a photosynthesis module that follows a biochemical approach [63,64,65]. In this study, the photosynthesis module was used.
The evolution of volumetric soil moisture in different soil layers is calculated using the diffusion equation. Liquid water flow is calculated using the Darcian equation for one-dimensional fluid flow along with the hydraulic conductivity and soil water suction following Clapp and Hornberger [66]. The saturated volumetric water content, wilting point volumetric water content and volumetric water content at field capacity are calculated based on the percentage of sand and clay contents in the soil according to Boone et al. [67] and Soulis et al. [68]. The saturated hydraulic conductivity and saturated soil water potential are calculated from the percentage of sand [69]. The lateral flow in the downhill direction is estimated through a parameterization of Richard’s equation, which estimates lateral flow rate at the seepage face of a hillslope. Lateral flow only occurs when soil water content exceeds water content at field capacity for a sloping element [68]. The water balance for the entire soil column is evaluated as a residual of precipitation, evaporation, water uptake by roots, runoff, lateral flow, baseflow and change in the soil water liquid content.

2.3.2. CLASS

CLASS was initially conceived in response to the perceived need for more soil thermal and moisture layers and for a separate treatment of vegetation canopy within the Canadian Global Circulation Model [14,15]. It has been under continuous development, as evidenced by Wu et al. [70], von Salzen et al. [71], Bartlett et al. [21], and Verseghy [72]. Each grid cell in CLASS may be divided into subareas of: (1) bare soil; (2) vegetation over the soil; (3) vegetation over snow; and (4) snow over soil. The vegetation canopy is treated as a single layer, same for the snowpack. The soil column has the flexibility to handle any number of soil layers to whatever depth the user specifies. The energy fluxes are computed based on the heat conservation equation described by Verseghy et al. [15]. The prognostic evolution of soil water content and the vertical water flow are given by the one-dimensional Darcy and Richards equations, respectively (see Verseghy [14] for a more detailed description.)

2.3.3. Differences between SVS and CLASS

As shown in Table 2, SVS and CLASS rely on similar parameterizations to represent several physical processes. However, there are two distinctive differences. One is associated with stomatal resistance, where the photosynthesis module is used in SVS, while an empirical parameterization is used in CLASS. Note that, although not in the version used in this study, CLASS can be coupled to a similar photosynthesis module [73] and can also have access to a climate vegetation model [71]. The other difference resides in the method used for computing the surface (skin) temperature and the mean temperature of the vegetation and soil components. A one-layer force-restore method is employed in SVS, while CLASS uses a multi-layer heat diffusion equation. Note that a multi-layer Richard’s equation framework for soil moisture is used in SVS and CLASS. The force-restore approach is still used in SVS for its computational efficiency and parsimony (less state variable) in the context of operational forecasting.

2.4. Experimental Setup

In this study, experiments were performed at point-scale and in offline mode with the MESH modeling platform (Modélisation Environnementale communautaire—Surface Hydrology), which is ECCC’s community environmental modeling system [31]. MESH allows different LSMs and hydrologic routing models to coexist within the same modeling framework. Although the final goal of MESH is to forecast water discharge at the watershed scale, it is also possible to utilize the stand-alone offline versions of SVS and CLASS, which are the two current LSMs integrated into MESH. A technical description of MESH can be found in Pietroniro et al. [31] and at www.wiki.usask.ca/display/MESH. MESH including the SVS and CLASS codes is available at www.wiki.usask.ca/display/MESH/Interim+releases.
Three time steps were specified in the models: (1) the input time step was set as 30-min for each model; (2) the model time step was defined as 5-min for SVS and 30-min for CLASS (a test carried out with CLASS for a time step of 5-min revealed almost the same results as those obtained at 30-min); and (3) the output time step was fixed as 30-min for both models.
The soil was divided into seven layers with depths from the top to the bottom equal to 10, 35, 85, 160, 235, 310 and 410 cm. Soil texture was assumed constant in the vertical direction since information at multiple depths was not available in the literature (Table 3).
The soil texture parameters used at each site (Table 3) are provided to both models, except for the organic matter (orgm), which is used only by CLASS.
Vegetation associated parameters are defined in the look-up tables of each model. As shown in Table 3, both models account for the same vegetation type. For simplicity shown treating lateral water fluxes, the grid was considered perfectly flat at all sites.
Both models were set up with the same initial soil moisture and temperature conditions. Soil temperature for each layer was initialized with the yearly mean temperature. Soil moisture for each layer was initialized at 50% of saturation. To account for an equilibrium in the prognostic variables at each site (spin up), the first year of meteorological input was replicated ten times.

2.5. Modeling Performance

The performance of SVS and CLASS simulations was evaluated using the following metrics: root mean square error (RMSE), which measures the spread of the residuals between simulation and observation; percent bias (Pbias), which quantifies the average tendency of the simulated value to be larger or smaller than its observation counterpart; the Pearson correlation coefficient, R, which measures the degree of correlation between simulation and observation; and the Nash–Sutcliffe efficiency (NSE) for which the optimal value is 1 and a value inferior to 0 indicates that the average of the observation offers a better predictor than the model.

3. Result and Discussion

3.1. Energy Fluxes

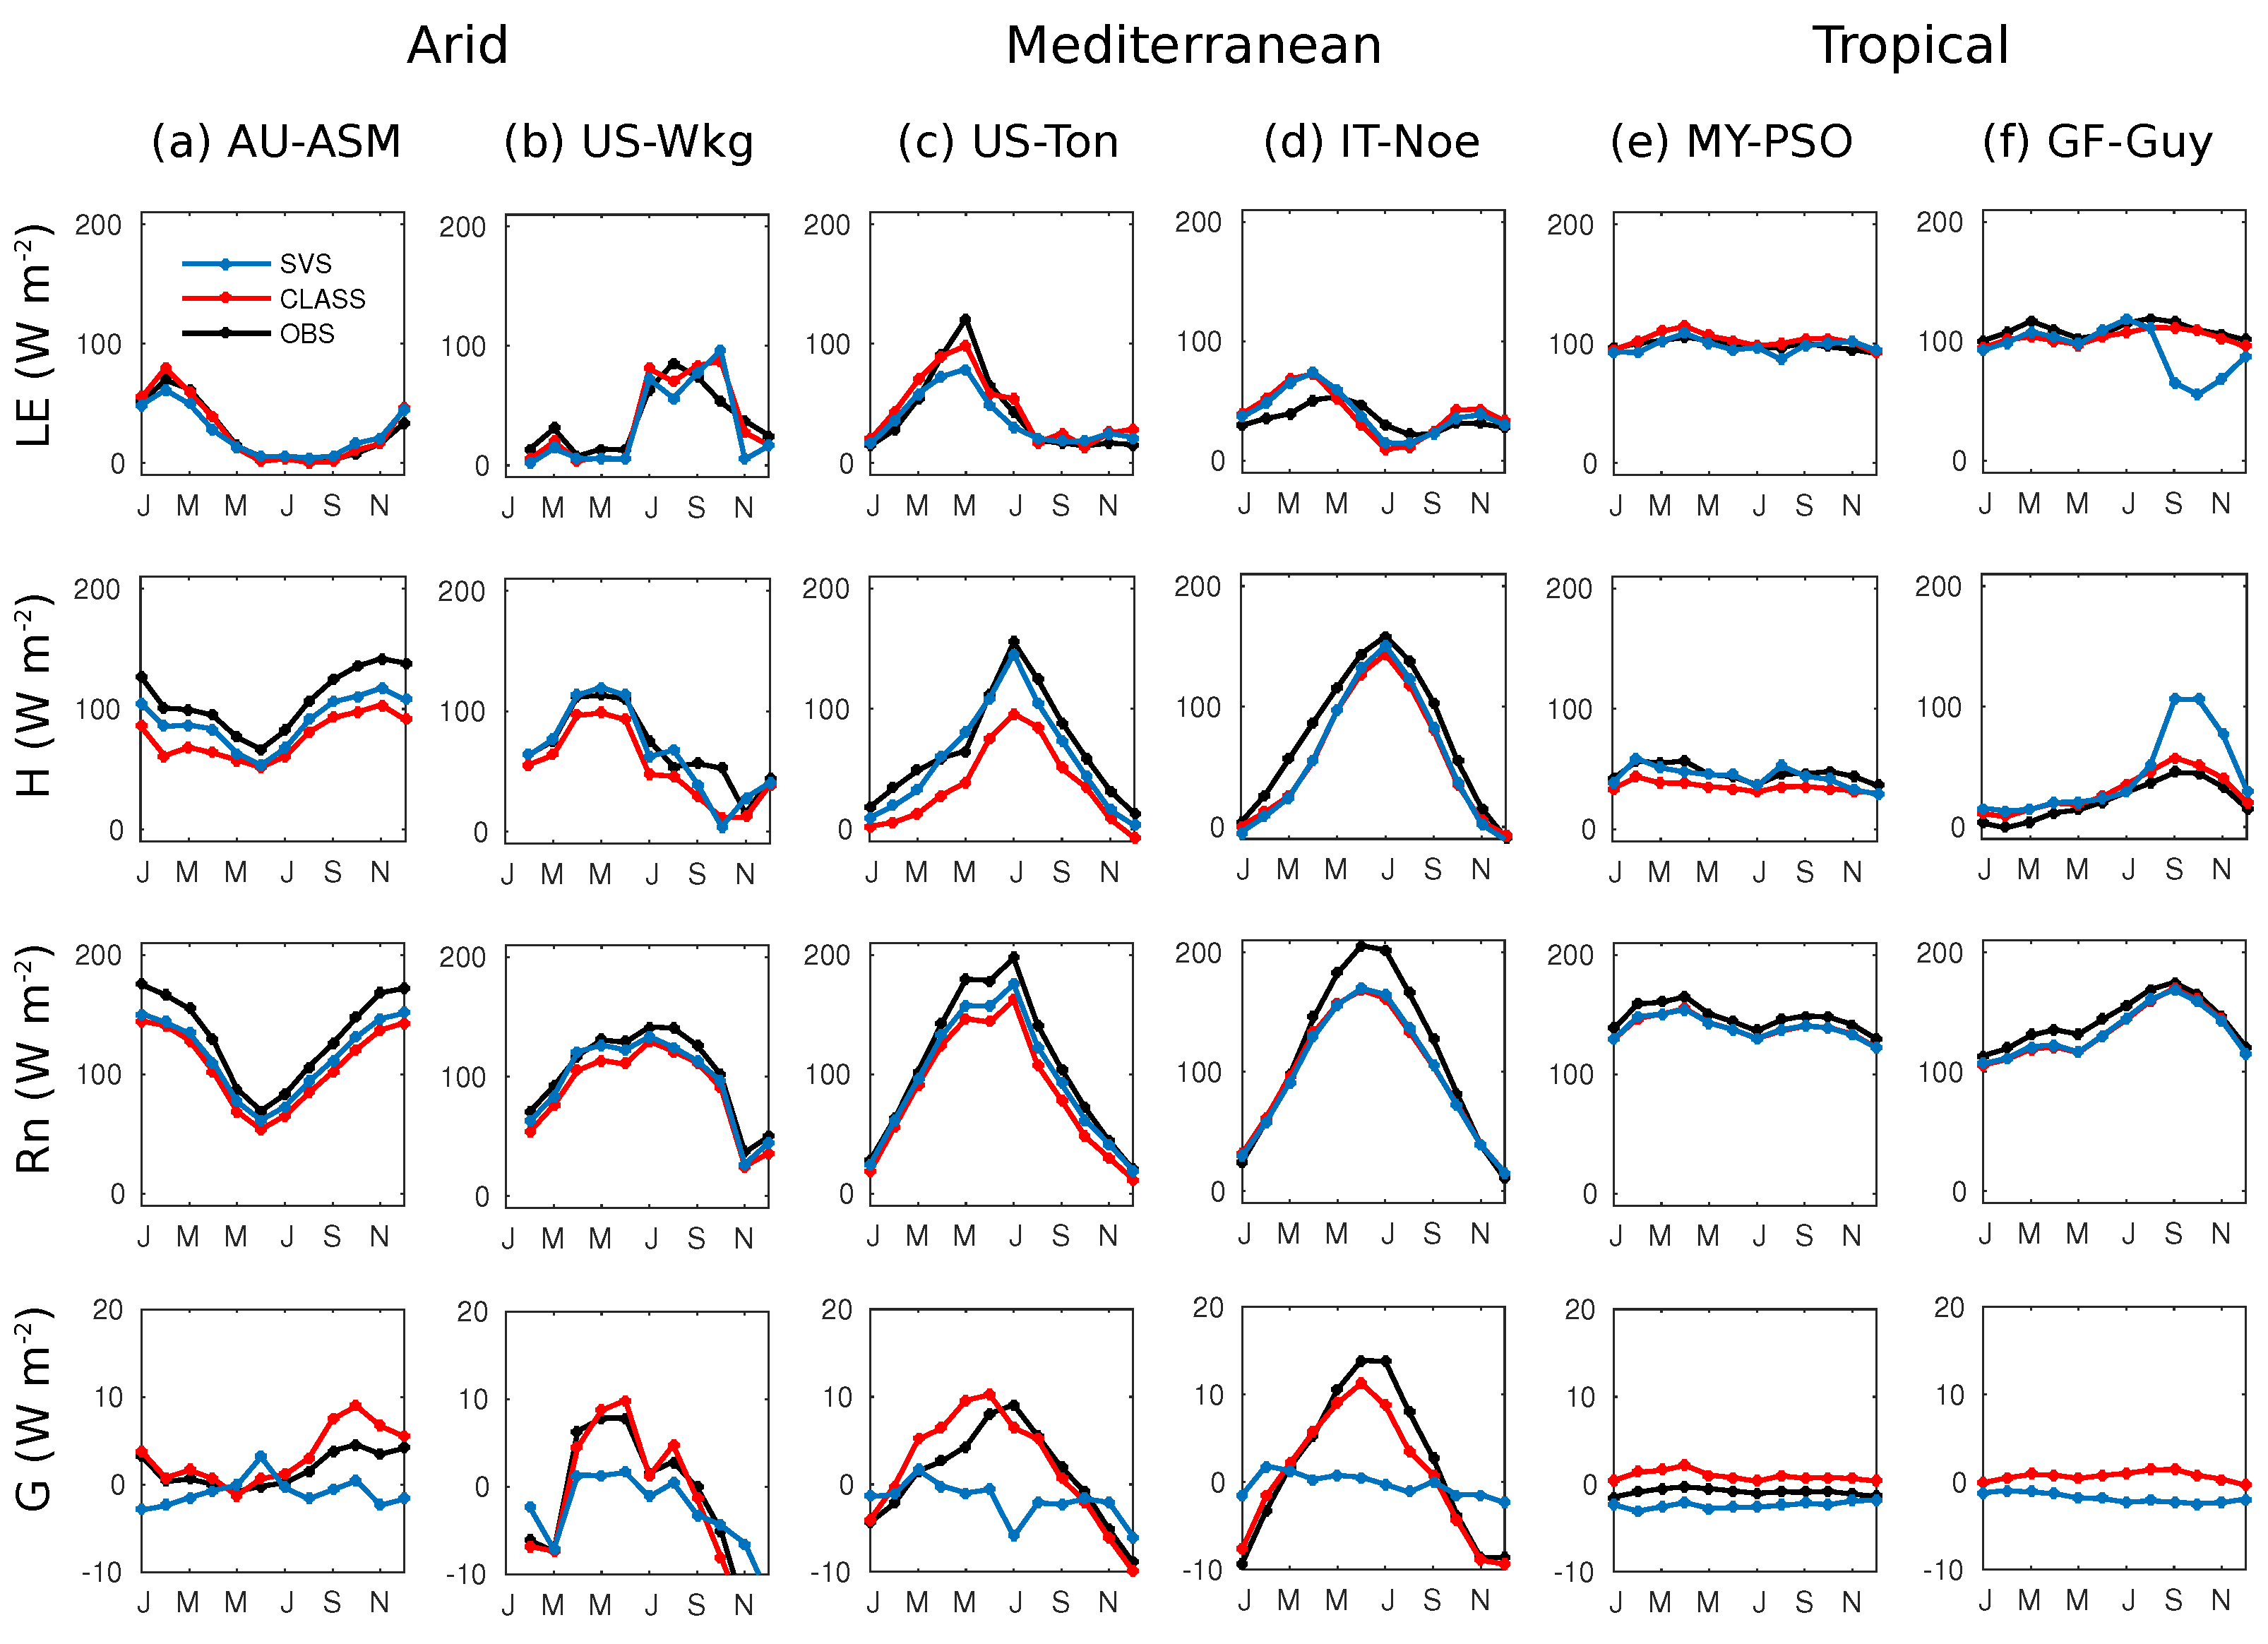
For a precise evaluation of energy fluxes, the mean annual cycles of latent heat flux ( L E ), sensible heat flux (H), net radiation ( R n ) and soil heat flux (G) are plotted in Figure 3. The metrics of the same fluxes were computed at a 30-min sampling interval and are summarized in Table 4.

3.1.1. Arid Sites

The observed annual cycle of L E displays a maximum peak in February during the rainy season at the AU-ASM site (Figure 3a). The L E annual cycle observations are well represented by the SVS simulations, resulting in a good 30-min correlation (R = 0.77, Table 4) and a small overestimation (Pbias = 3.7%, Table 4). H observations peak during the summer months of November–January. Although the mean annual cycle of H is well represented by SVS, it is underestimated by 20 W m - 2 on average during the months of October–December. This could be explained by the energy partition at the surface and more precisely by the underestimation of the net radiation (21 W m - 2 during the same months) as explained in Section 3.3. L E and H simulations of SVS are similar to that of CLASS, as reflected by the scores in Table 4. R n is the most dominant term of the annual cycle as well as the best-simulated one in both models (NSE = 0.97, Table 4). However, the bias of R n is large even if correlation is high. Although incident short and longwave radiations are given, the positive bias suggest that some parameters related to the albedo is unsuitable, as discussed in Section 3.3. In addition, its underestimation during October–December implies that less energy is available for the partition into turbulent fluxes, particularly into H. G is the least dominant flux of the annual cycle, with monthly mean observed value equal to 2.2 W m - 2 (Figure 3a). Despite the good correlation of G (R = 0.82 by SVS and R = 0.92 by CLASS, Table 4), SVS shows a large underestimation (Pbias = −157.6%, Table 4) while CLASS shows a large overestimation (Pbias = 76.9%, Table 4). Note that, for the particular case of G, Pbias may lead to large values as a result of the small absolute values of the observations. The conflicting results for G in SVS are associated to: (1) The way G is computed. As the residual of the other energy fluxes, G does not capture properly the seasonality of the observations in the same way than CLASS where G is estimated as a function of soil temperatures. (2) The conceptual fact that the simulations are not really being compared to the point measurement at a flux plate (see Section 3.3 for more details). We obtained similar results for the US-Wkg arid site, which is partially covered by long grass. No valid data are available in January at this site due to the energy closure imposed on the selection criteria.

3.1.2. Mediterranean Sites

Observed L E at US-Ton shows a seasonality with a maximum of 130 W m - 2 in May (Figure 3c). The annual cycle of L E is well represented by SVS. SVS produces a value of 70 W m - 2 in May and tends to underestimate observations during the growing season (April–June). On the other hand, CLASS tends to better represent the maximum in May (100 W m - 2 ). A reasonable explanation of the poor performance of SVS on May is given by closer inspection of the components of LE, where SVS plant transpiration tends to be lower that CLASS (Figure 4c). H observations show a strong seasonality with a maximum peak of 160 W m - 2 in July. SVS simulates this maximum as 155 W m - 2 . SVS (R = 0.88, Pbias = −25.6%) simulates H better than CLASS (R = 0.87, Pbias = −56.5%, Table 4) at this site. R n is the best simulated term by SVS (Pbias = -8.8%, NSE = 0.98, Table 4), even better than by CLASS (Pbias = −20.8%, NSE = 0.97). G, with a mean observed value equal to −1.34 W m - 2 , is poorly simulated by SVS (Pbias = 30.7%, NSE = −7.01) and CLASS (Pbias = −55.0%, NSE = −10.97). The performance of SVS and CLASS is similar at the IT-Noe and the US-Ton site for all energy fluxes.

3.1.3. Tropical Sites

MY-PSO shows a tendency towards uniform L E and H observations throughout the year (see Figure 3e). The behavior of L E (Pbias = −0.8%, R = 0.94, Table 4) and H (Pbias = −6.7%, R = 0.89, Table 4) is well captured by SVS. R n is equally well simulated, contrary to G (mean observed value equal to −0.87 W m - 2 ), which is largely underestimated (Pbias = 174.2%) and poorly correlated (R = 0.55). SVS simulates all energy fluxes in a similar fashion to CLASS at this site, except for H, which tends to be lower in CLASS (Pbias = −24.2%) than in SVS (Pbias = −6.7%). The L E and H fluxes are accurately simulated by SVS at the GF-Guy site during the wet season (December–August), but are underestimated by SVS during the dry season (September–November), where L E cannot be sustained (Figure 3f). A close examination on the components of L E during the same months (Figure 4e) reveals lower values of SVS canopy evaporation and plant transpiration than CLASS.

3.2. Partitioning of Evapotranspiration

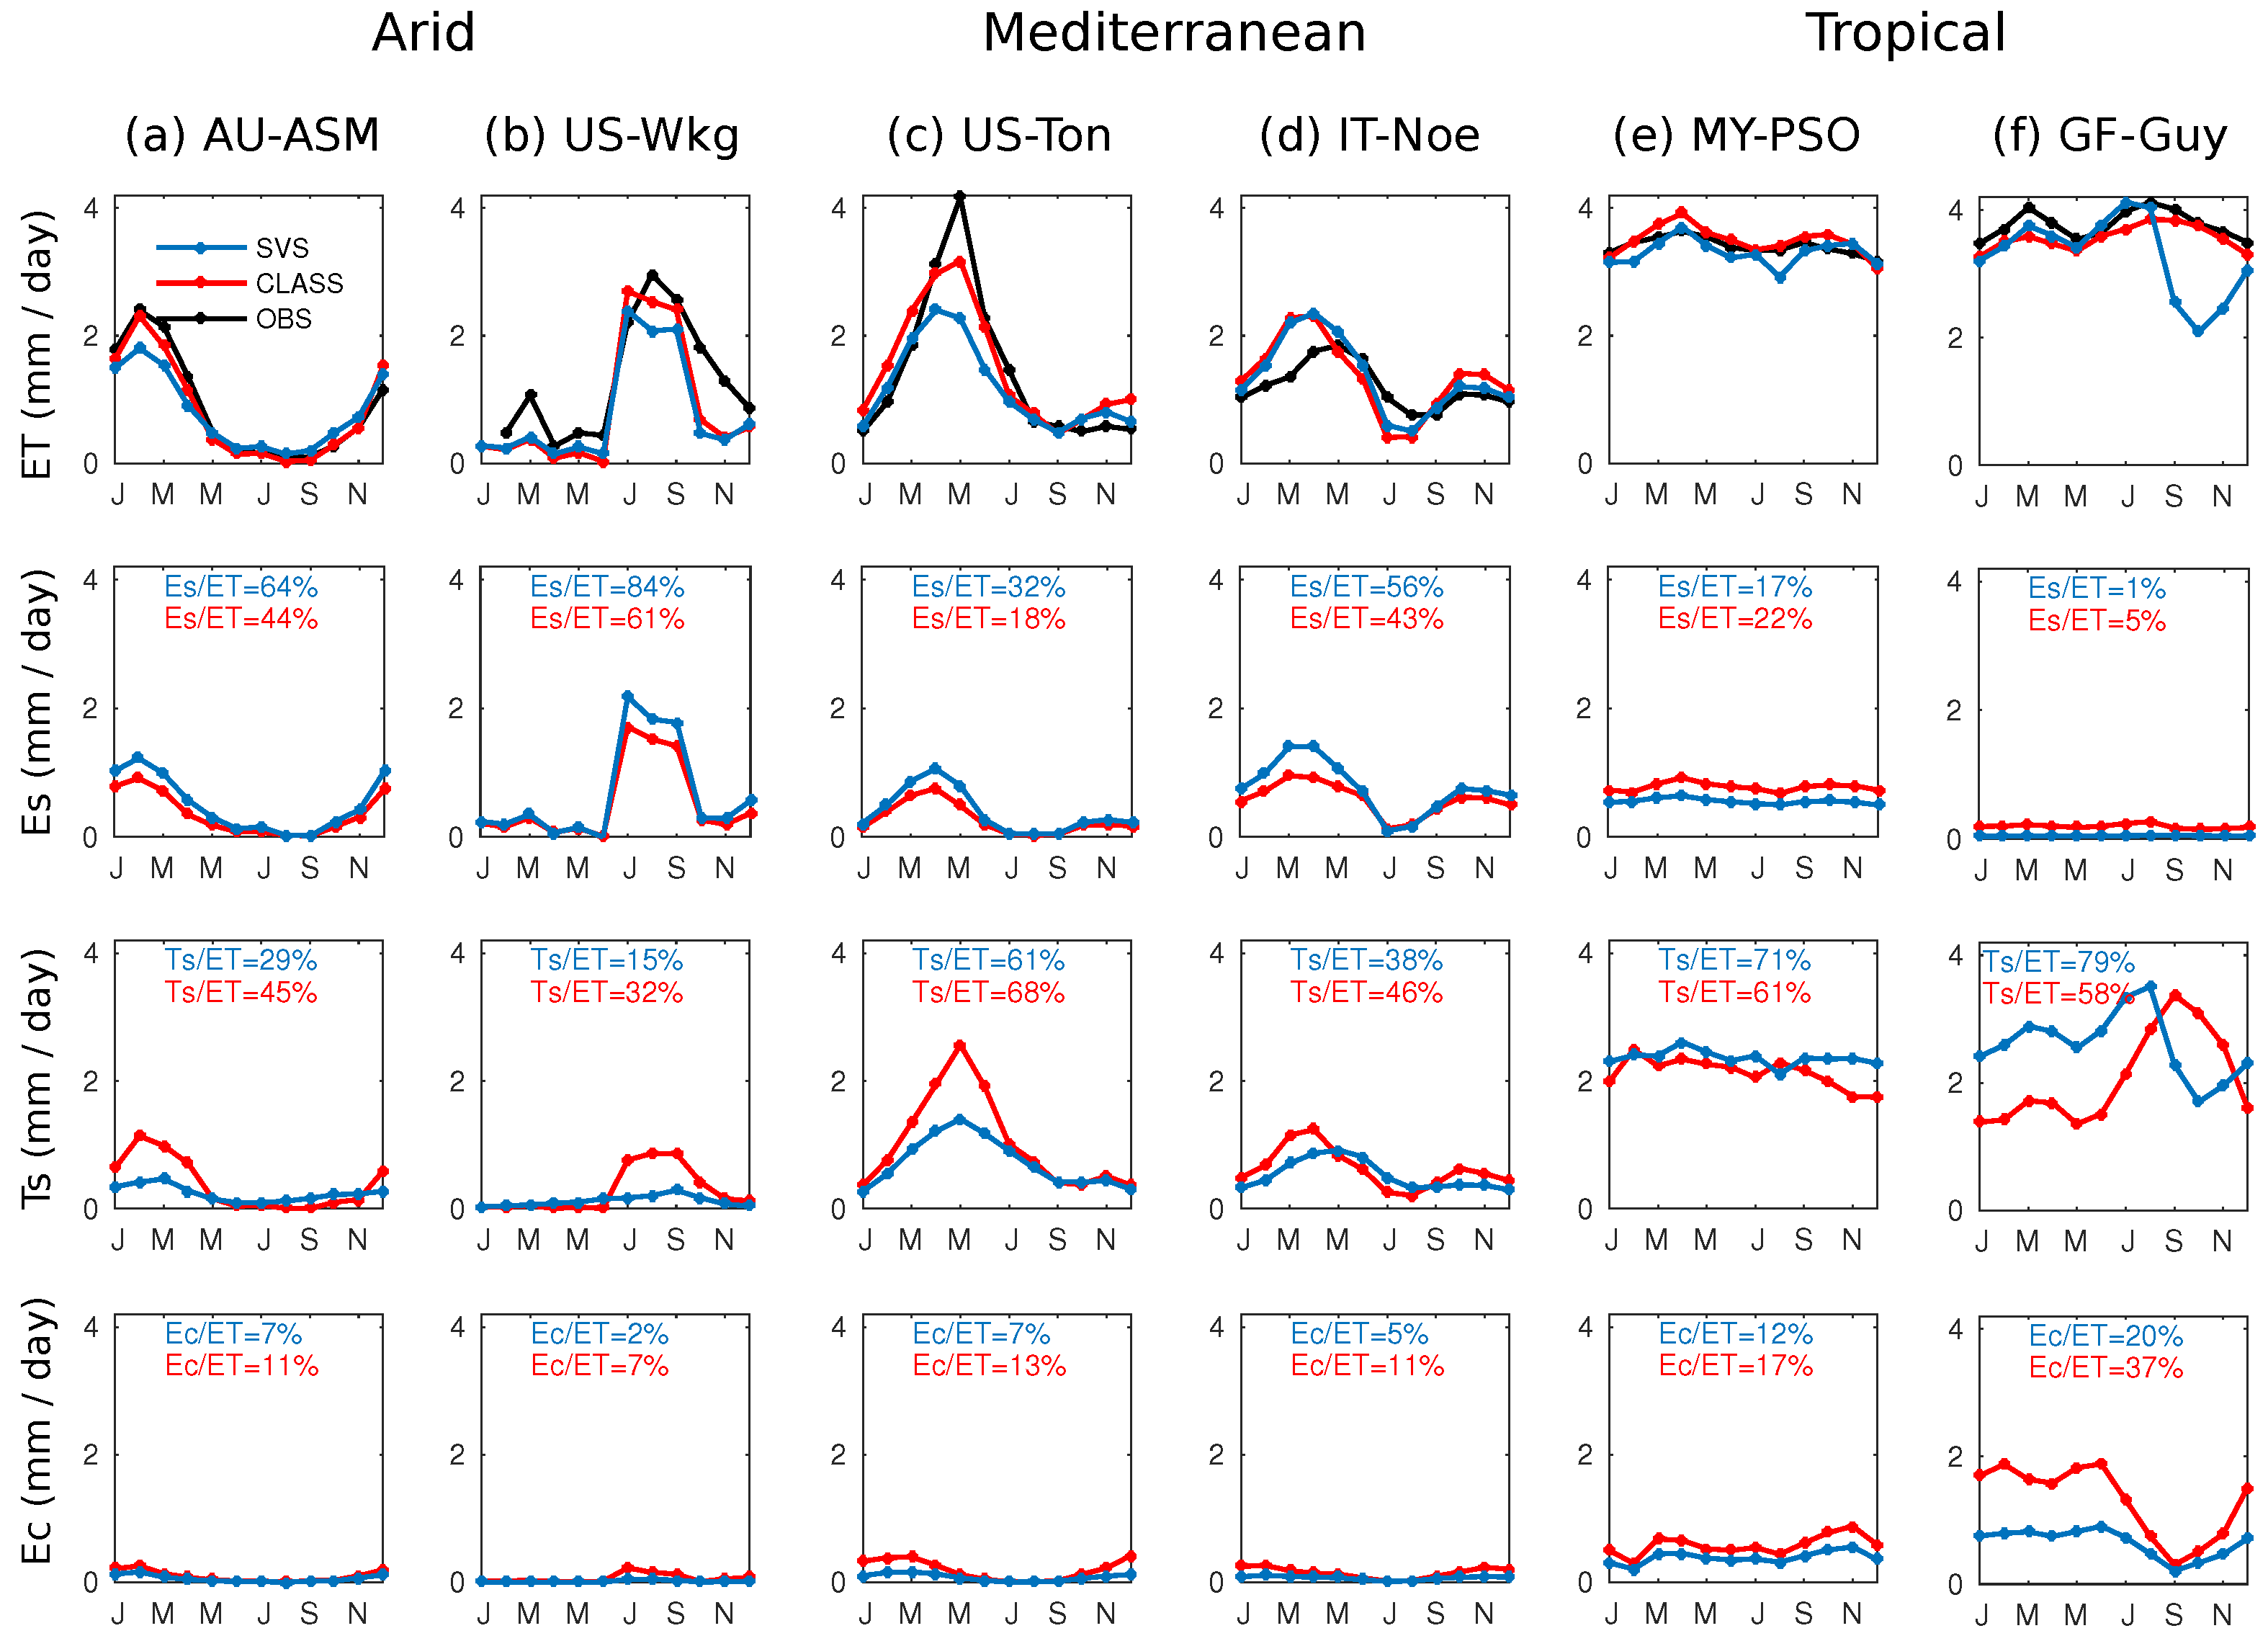
Figure 4 shows the partitioning of evapotranspiration ( E T ) into three different components: soil evaporation ( E s ), transpiration ( T s ), and wet canopy evaporation ( E c ). Despite the absence of observations for E T , E s and T s , the simulations allow us to describe the variability of each of the component. Note that Figure 4a–f illustrates mean values and not accumulated ones, as is typical of these kind of variables (remember that E T was derived from L E , which was filtered according to the energy closure criteria described in Section 2.2).
According to SVS simulations for the AU-ASM arid site, E s is the main E T component ( E s / E T = 63%). A similar result was found for the other arid site, US-Wkg, where E s / E T = 84% (Figure 4b). T s is the main E T component at the US-Ton Mediterranean site ( T s / E T = 63%). The large model differences of maximum E T during the months of April–June are associated with differences in T s at this site (Figure 4c). The tropical sites illustrate the relevant role of canopy interception and plant transpiration. For example, T s / E T = 72% at the MY-PSO site, which consists of 70% evergreen forest (Figure 4e). Similarly T s / E T = 79%, at the GF-Guy tropical site (Figure 4e). The underestimation of E T by SVS during the months of September–November (Figure 4f) is clearly associated with the underestimation of T s , which is probably due to the overestimation of stomatal resistance.
T s / E T values from the literature can be used to benchmark model results. SVS simulations during the growing season (June–October) at the site US-Wkg lead to a value of 84%, which is above values observed by Moran et al. [50]: values of 45% in 2002 and 75% in 2007. On the other hand, CLASS had a closer estimate of 61% during the same period. A compilation of 81 studies presented by Schlesinger and Jasechko [84] partitioned annual E T into T s at the ecosystem scale in Mediterranean (47 ± 10%) and tropical ecosystems (70 ± 14%), which are in line with SVS and CLASS simulations at the Mediterranean (respectively, 50% and 57% on average) and tropical (respectively, 76% and 60% on average) sites.

3.3. Sources of Uncertainties Associated with Energy Fluxes

SVS surface energy flux simulations show a tendency to underestimate R n at all sites. More precisely, the average underestimation in terms of the Pbias score is of the order of 10.4% at the arid sites (AU-ASM, US-Wkg), 11.9% at the Mediterranean sites (US-TON, IT-Noe) and 5.9% at the tropical sites (MY-PSO, GF-Guy). Alves et al. [30] showed the same scale of underestimations in R n when they contrasted CLASS simulations with five FLUXNET sites representing semi-arid, temperate, and tropical climate types. The main reason is the underestimation of net shortwave radiation for which the percent bias score is on the same order as R n : 10.3% at arid sites, 13.3% at Mediterranean sites and 3.5% at tropical sites. Furthermore, albedo simulated values in SVS (and also CLASS) tend to be overestimated at all the studied sites. Indeed, daily simulated albedo, averaged between 10:00 and 14:00, for SVS(CLASS) showed poor performances: RMSE = 0.07, Pbias = 60.28, r = 0.24 (RMSE = 0.07, Pbias = 48.23, r = 0.16). Part of the bias may be related to instrumentation uncertainty in the FLUXNET database. Wilson et al. [85] showed that R n observations in FLUXNET are typically characterized by systematic instrument errors of up to 15%.
For turbulent fluxes, H at arid (AU-ASM, US-Wkg) and Mediterranean sites (US-Ton, IT-Noe) is better simulated by SVS (NSE = 0.80 on average) than L E (NSE = 0.39 on average), while the opposite is true at the tropical sites (MY-PSO, GF-Guy) where L E (NSE = 0.81 on average) is better simulated than (NSE = 0.50 on average). The fact that L E is less performing than H at arid and Mediterranean sites is because of the presence of larger variability in biophysical characteristics, where significant climate seasonality exists. A closer look at the evapotranspiration components (Figure 4) reveals that transpiration is the most likely process to be biased (here it is essential to mention the benchmarking role of the CLASS model). Another factor influencing the simulation of turbulent fluxes may be the nocturnal observations. At nearly all FLUXNET sites, it is assumed that the advection of scalars can be neglected [86]. However, non-zero values of mean vertical velocity and vertical advection are possible and can be induced by horizontal heterogeneity or mesoscale and synoptic scale forcings [87,88].
G simulated by SVS is biased for all sites without exception; one reason may be the method associated with the estimation of soil temperature. As reported by Verseghy [14], the force-restore method causes the surface temperature to respond to diurnal forcing rather slowly, leading to a damping of G (and of turbulent fluxes). Additional studies concerning the implementation of force-restore method into LSMs showed accurate estimates of shallow (upper) soil layers (e.g., [40,89,90,91,92]), but limitations on deep soil temperature, and under snow cover and frozen soils [93,94]. Furthermore, soil heat flux measurements using plates, which is typical in FLUXNET, can be inaccurate because the thermal conductivity of the heat flux plate and the surrounding soil may be unequal [95]. Heat flux plates typically have a conductivity similar to that of soil, but thermal properties vary temporally because of changes in soil water content and temperature [96]. Soil heat flux plates can also alter the environment they are measuring, notably by limiting water movement in soils [97].

3.4. Water Balance

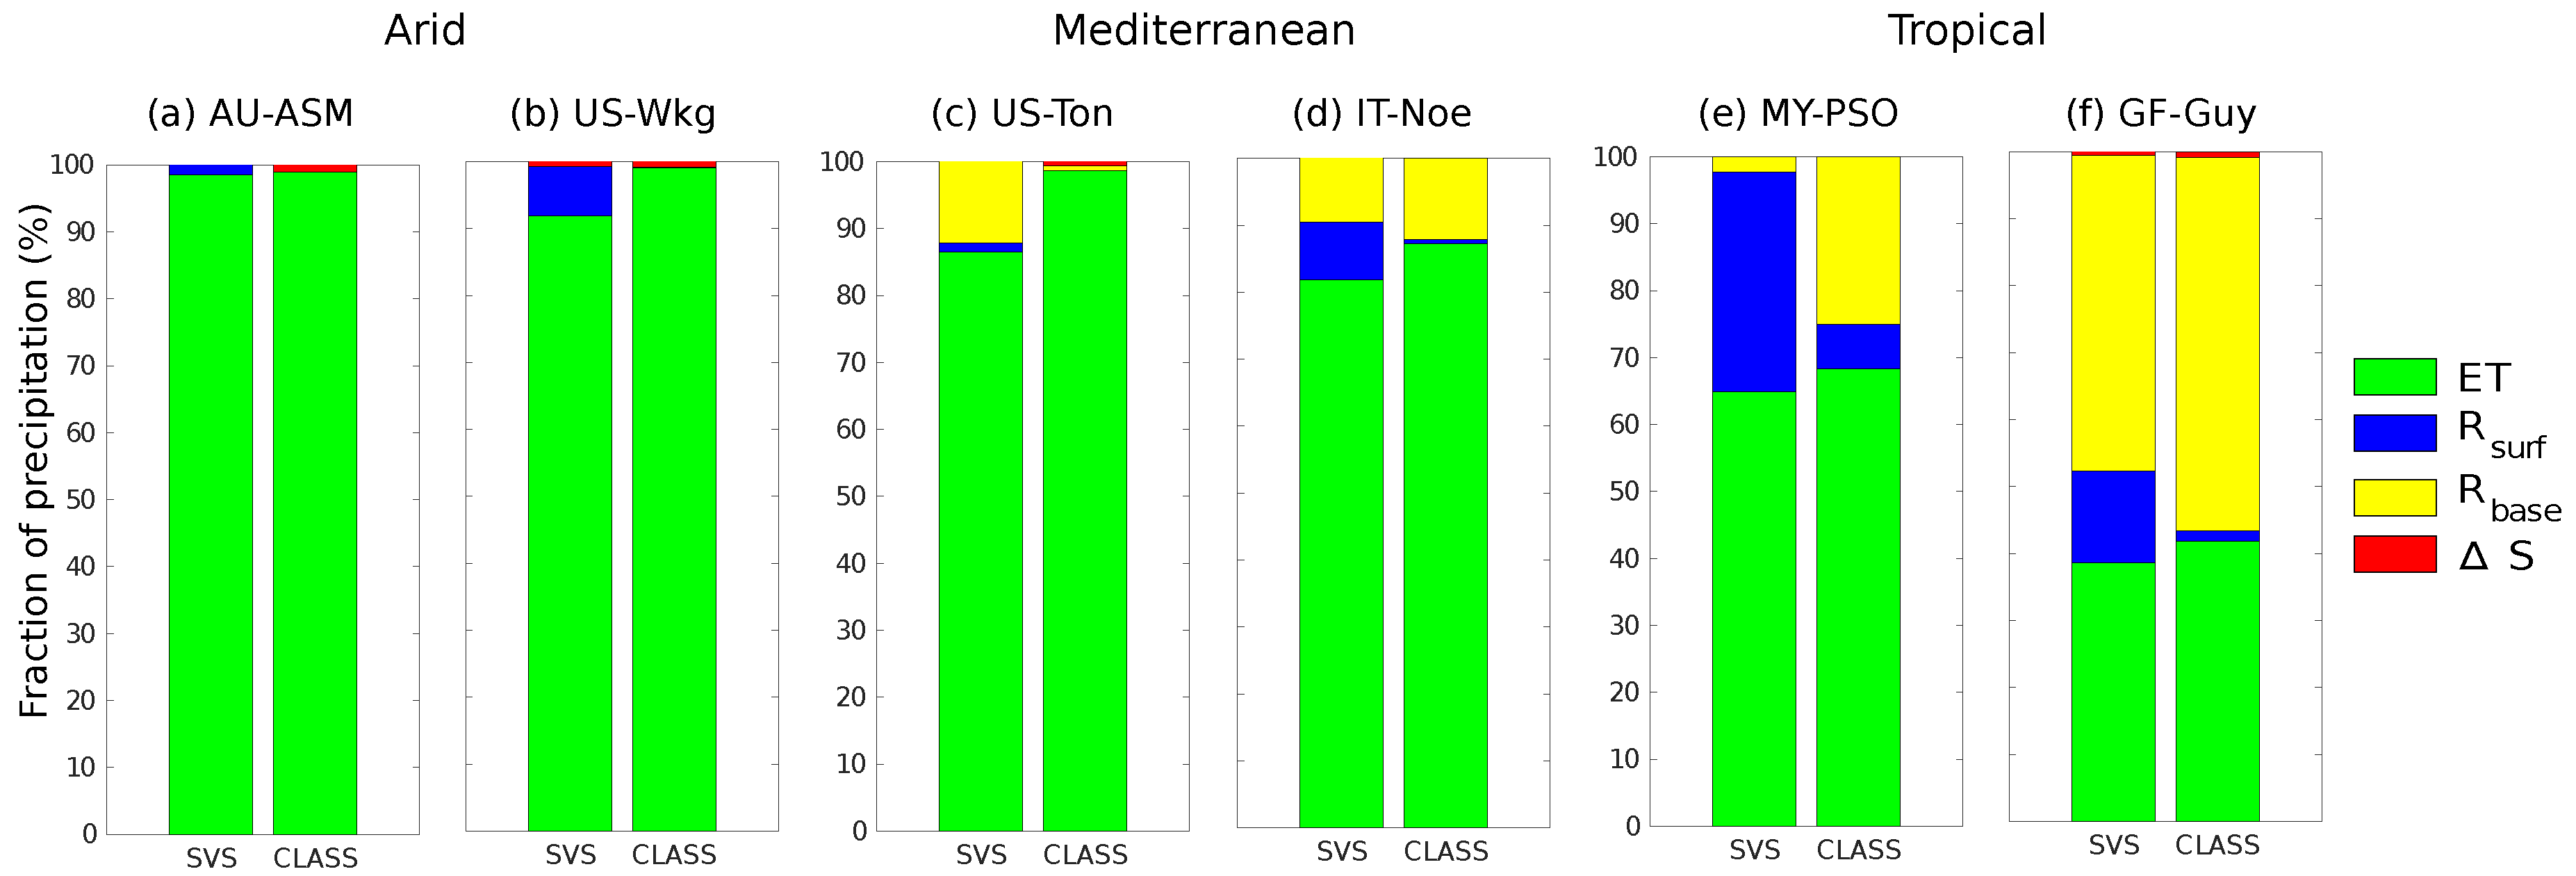
Figure 5 reveals the contribution of the different water balance terms from Equation (2) for the various studied climate conditions when precipitation is considered to be 100%. According to the SVS simulations, E T dominates with 93%, 84% and 53% in arid, Mediterranean and tropical sites, respectively (Figure 5a–f). The remaining contribution is split mainly between overland ( R s u r f ) and base ( R b a s e ) flows. Although CLASS simulates E T similarly to SVS, differences between the distribution of R s u r f and R b a s e are observed. For example, at the MY-PSO tropical site, E T is around 65% of precipitation in both models. However, R s u r f is 35% in SVS, but only 8% in CLASS (Figure 5e). Such a difference between models could lead to a substantial difference in terms of hydrological responses if R s u r f and R b a s e are not aggregated together in the routing model. This is the case in GEM-Hydro, where R b a s e is first provided to an intermediate reservoir in the routing scheme Watroute (aiming to represent the aquifer), before reaching the channel [6].
CLASS guarantees water balance closure for each of its four subareas up to the accuracy limit of 0.1 kg m - 2 [98], as this is a requirement of long-term simulations of climate models [72]. SVS closes the water balance with a small positive bias (values in parenthesis) at all sites: AU-ASM (0.2%), US-Wkg (0.2%), US-Ton (0.6%), It-Noe (0.1%), MY-PSO(0.05%) and GF-Guy(0.04%).

3.5. Soil Moisture

Scores obtained from the evaluation of the soil water content simulations are summarized in Table 5. They were computed by comparing 30-min point-scale measurements of the shallowest layer (typically measured at a 5- or 10-cm depth) to modeled values corresponding to the topsoil layer (0–10 cm). For deeper layers (10–410 cm), only SVS and CLASS simulations are available and are presented in Figure 6, Figure 7 and Figure 8.

3.5.1. Arid Sites

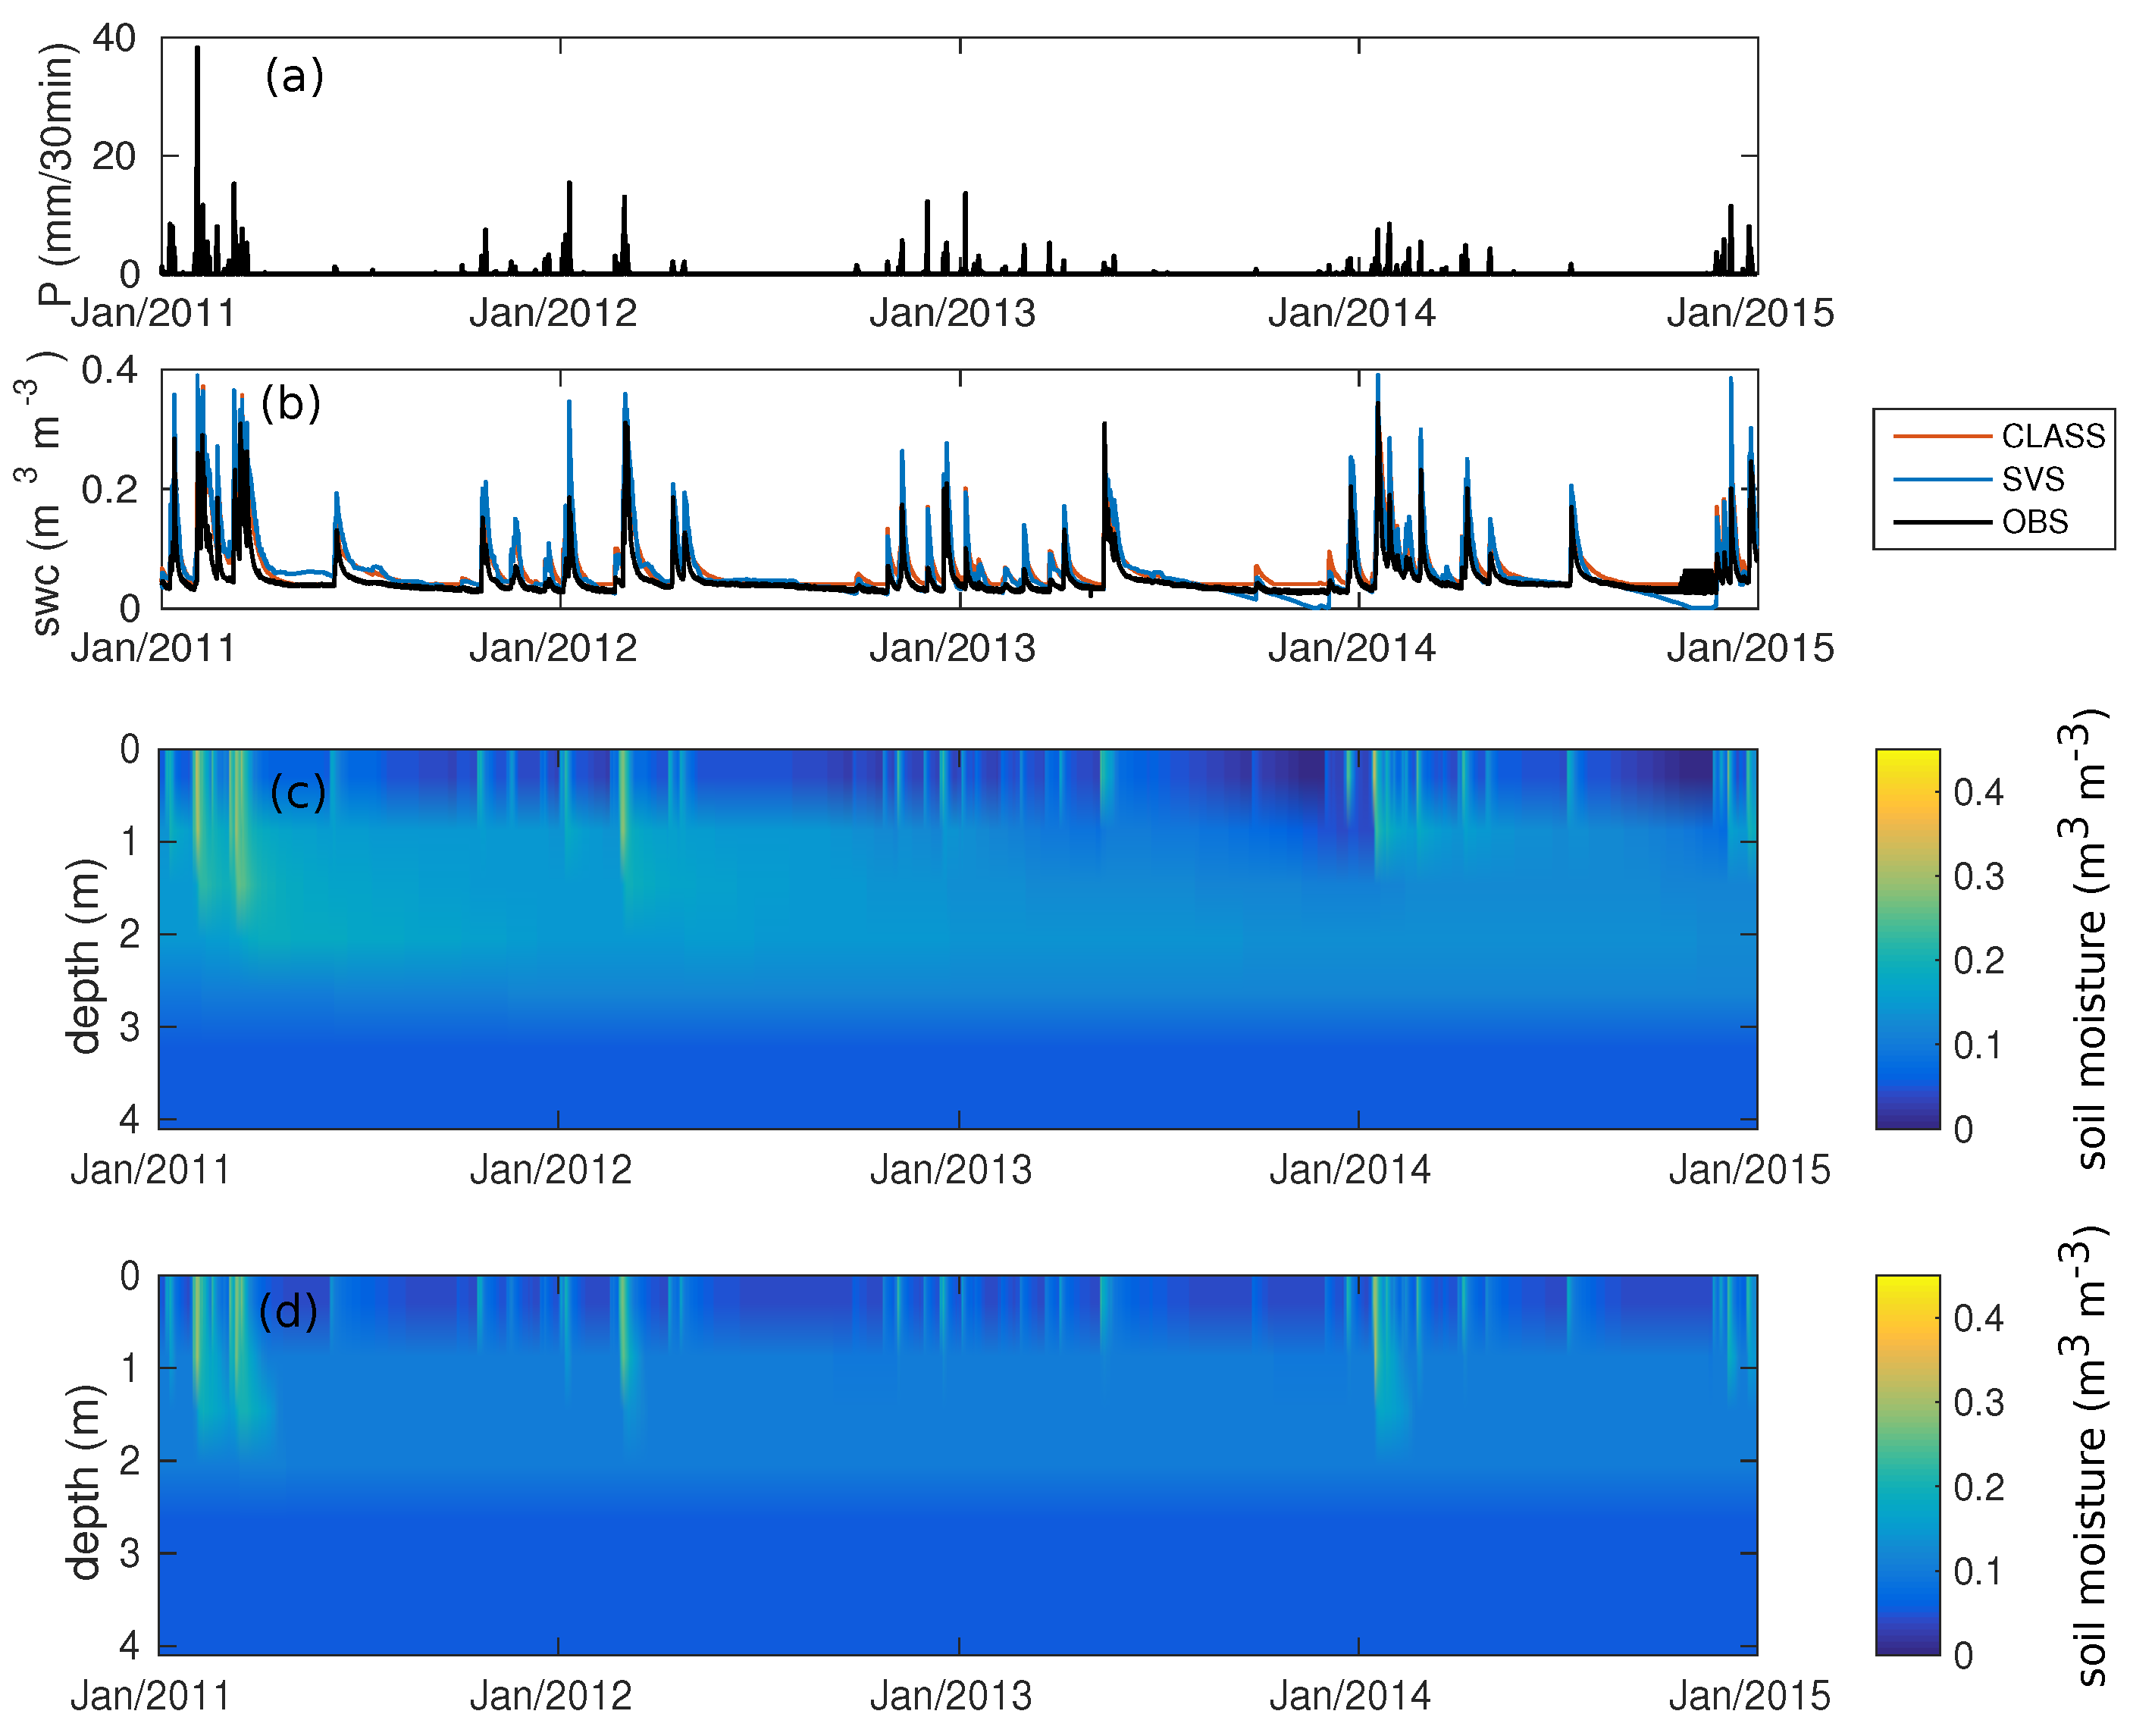
The surface layer soil moisture content is highly modulated by precipitation at all arid sites. At AU-ASM (Figure 6a), SVS surface soil moisture performance is low (NSE = −0.04, Table 5) and less than CLASS (NSE = 0.20, Table 5). During the dry periods (from May to September), SVS tends to represent the minimum observed value of 0.05 m 3 m - 3 properly. Exceptions occurred during the dry periods of 2013 and 2014 when SVS depleted soil moisture to 0.0 m 3 m - 3 while CLASS was comparable to observations (0.05 m 3 m - 3 ). As reported by Maheu et al. [46], SVS depletion during dry periods at semiarid sites is explained by the absence of the residual soil water content, which in CLASS was defined as 0.04 m 3 m - 3 [14]. During rainy events, SVS overshot the observed maximum soil water content (Pbias = 35.1%, Table 5). For deeper layers (10–420 cm), SVS is slightly wetter than CLASS. As a result, the minimum soil water content of 0 m 3 m - 3 is reached at the 3-m depth in SVS, while it occurred at the 2.4-m depth with CLASS (Figure 6c,d). As a consequence, more water is available in the soil and is transferred as overland flow, drainage, or as plant uptake through the roots. Figure 5 shows around 5% more overland flow for SVS than for CLASS at this particular site. A good representation of near-surface soil moisture by SVS and CLASS (NSE = 0.64 and 0.78, respectively, Table 5) is observed for the other arid site US-Wkg (not shown).

3.5.2. Mediterranean Sites

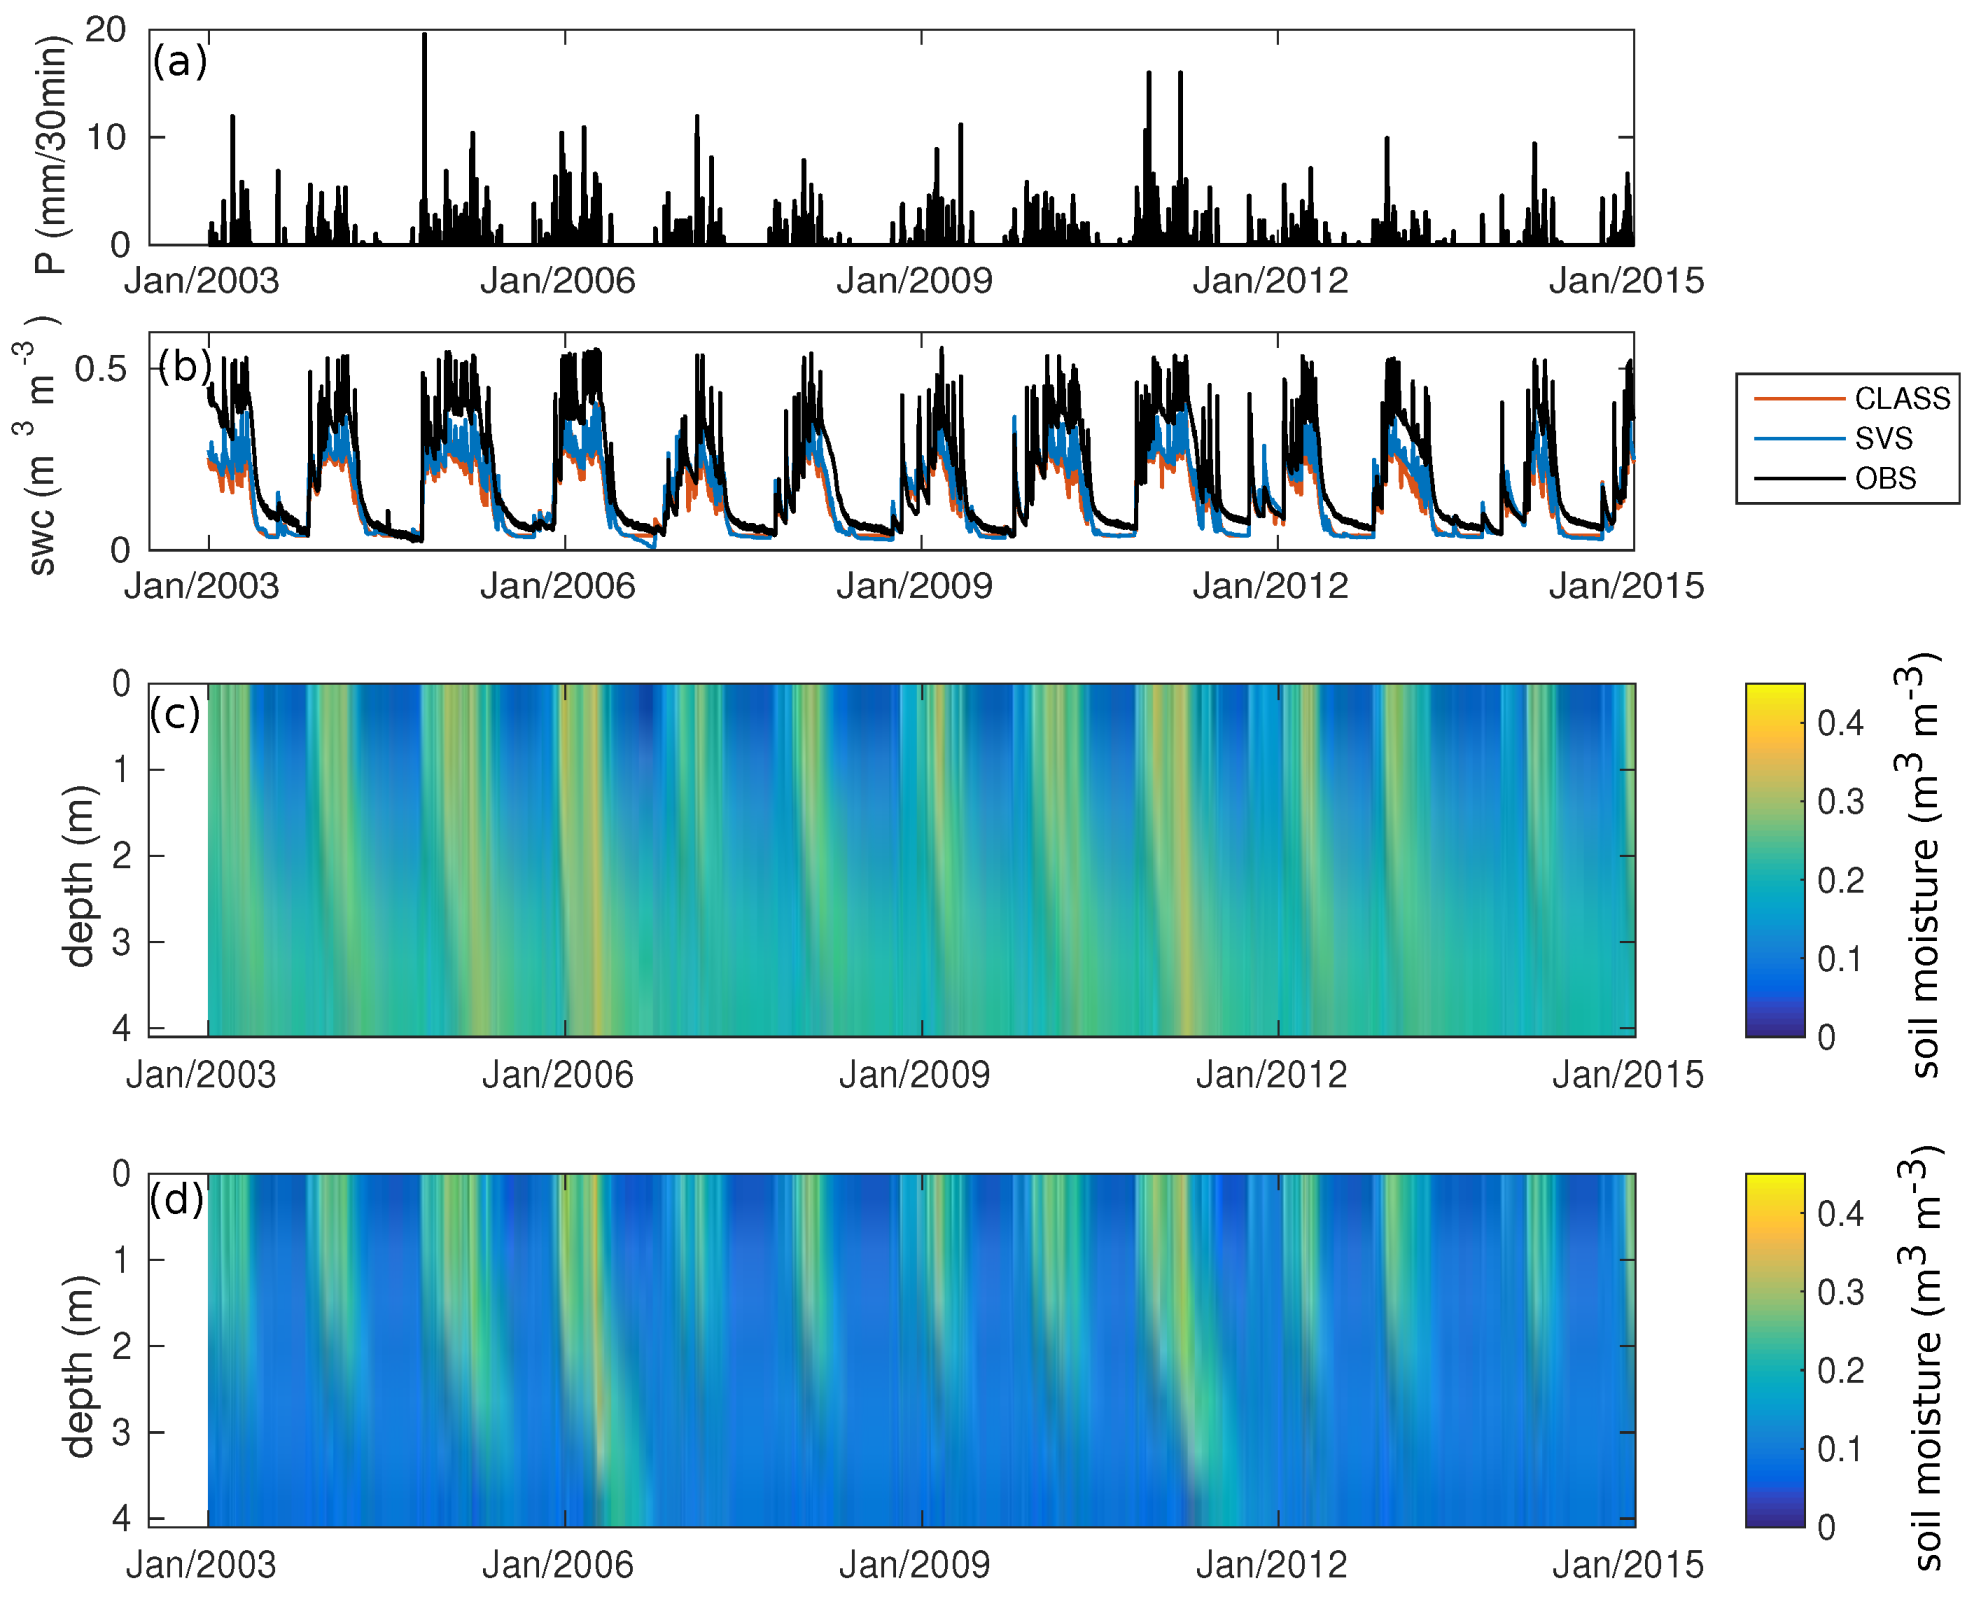
SVS performed well at the US-Ton site during the study period (NSE = 0.73, Table 5), even better than CLASS (NSE = 0.60, Table 5). During the wet season, SVS systematically underestimated surface water content, the maximum observed soil water content was 0.55 m 3 m - 3 , while the maximum simulated was 0.45 m 3 m - 3 . SVS also slightly underestimated surface soil moisture during the dry seasons. This response is reflected by a negative Pbias (=−22.9%, Table 5). Soil water content for SVS shows significant water percolation (soil moisture between 0.3–0.4 m 3 m - 3 ) during the wet season and a progressive water transfer from the surface layer during the dry season (see Figure 7c). This result is contrasted to that of CLASS, which shows slow water percolation during the wet season and drastic transitions during the dry season, resulting in generally drier conditions (Figure 7c). Considering that both models account with the same meteorological forcing and soil texture, divergences in the deep soil moisture could be explained by differences in the parameter setting as a function of the soil texture (Table 2). See also Section 3.6 for a more detailed discussion.

3.5.3. Tropical

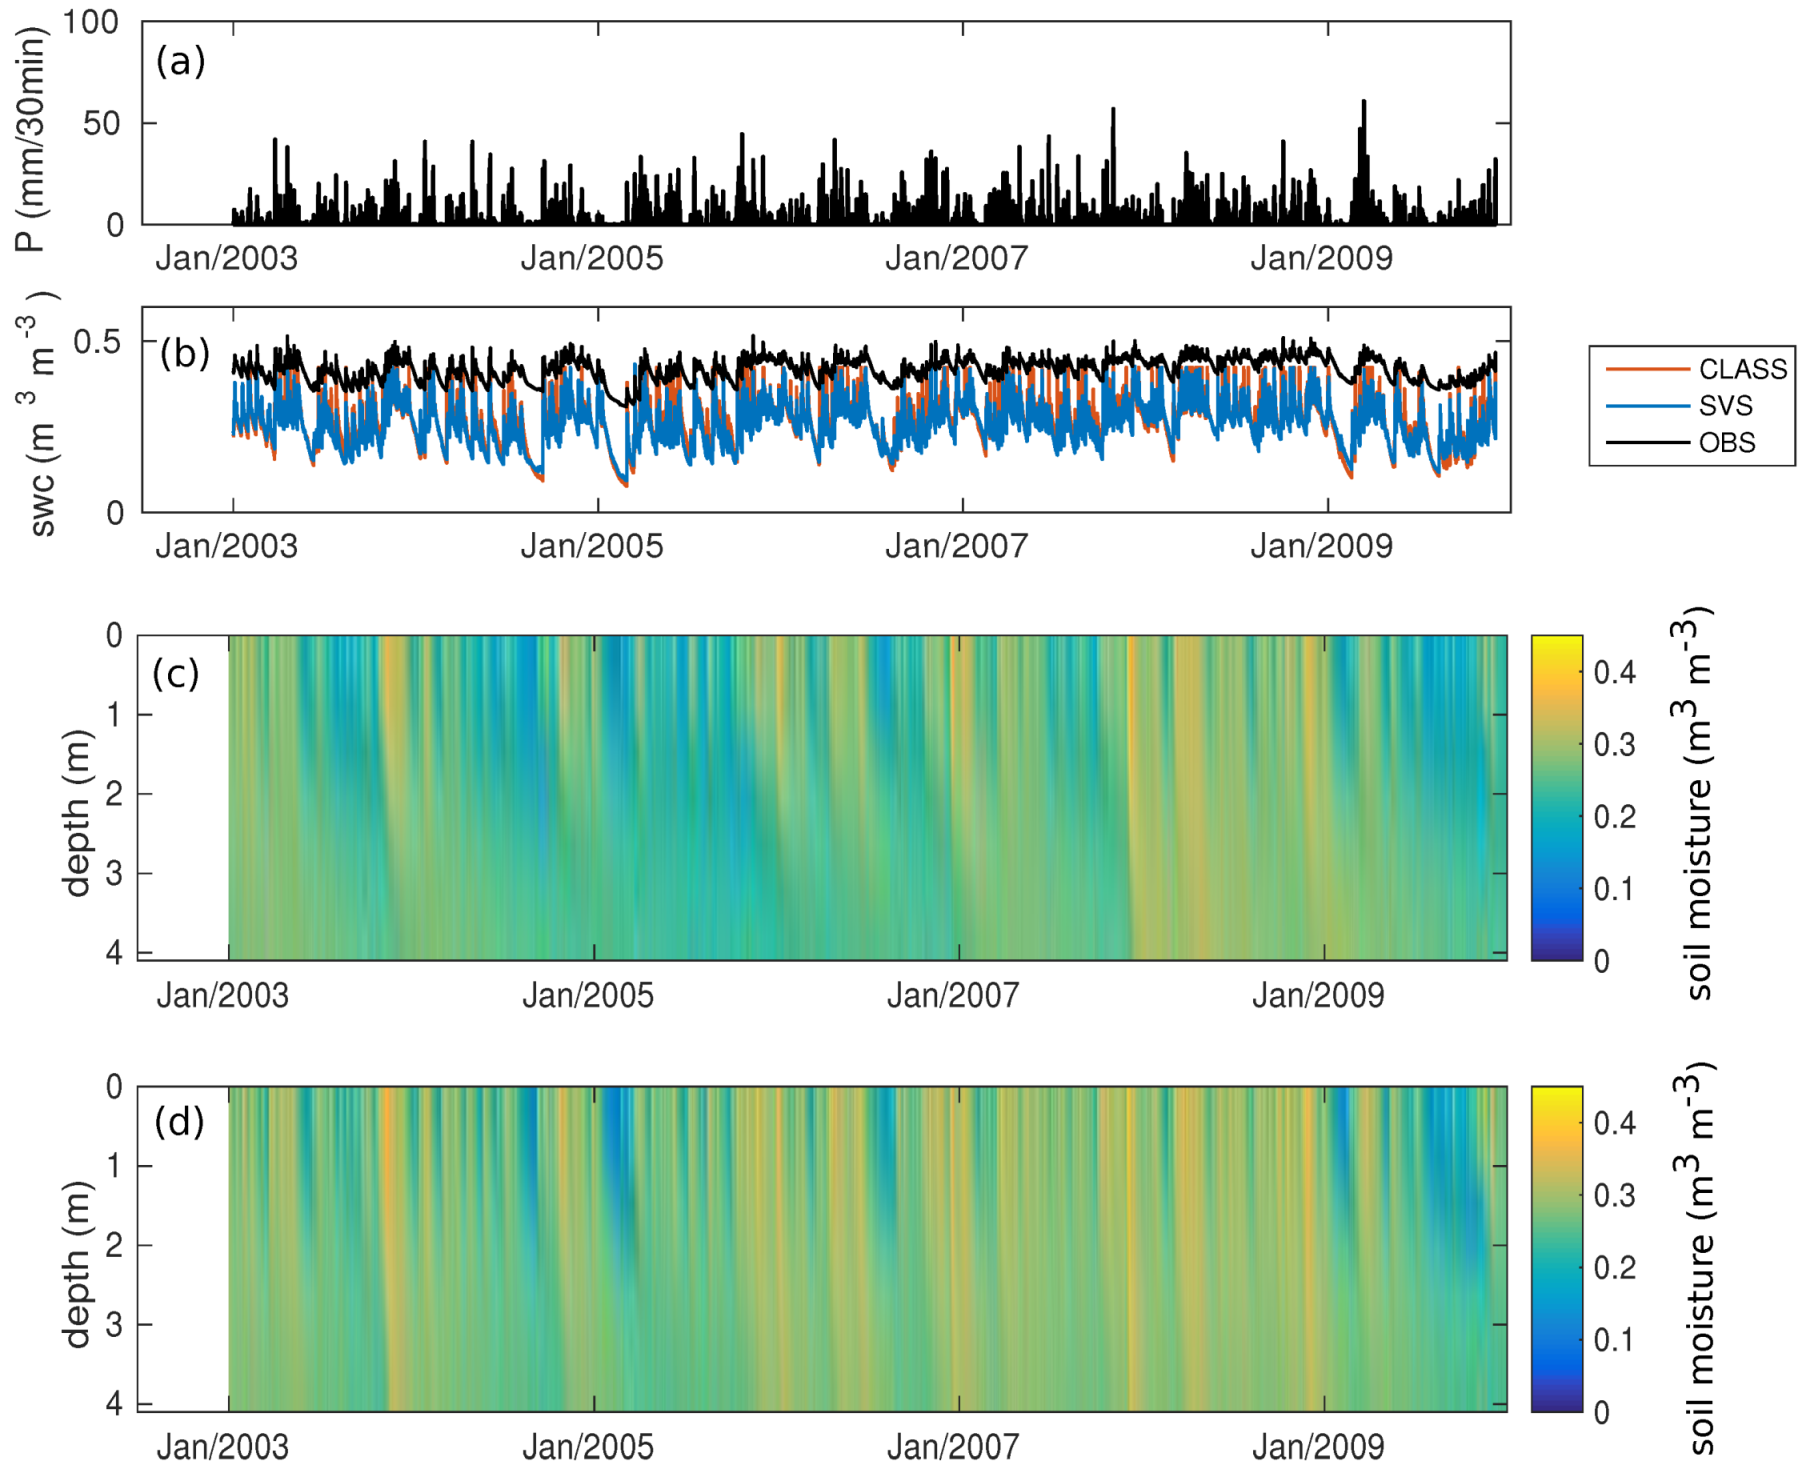
Both models showed low performance for surface water content simulations at the MY-PSO tropical site (NSE = −26.50 and −22.71 for SVS and CLASS, respectively, Table 5). SVS underestimates water content mainly during the dry period. This behavior is depicted by Pbias = −39.4%. Despite the weak performance of SVS, its similarity to CLASS and the reasonably good correlation of both models (R = 0.86 for SVS and CLASS, Table 5) suggest that there is some bias associated with the point-scale measurements that may be associated with local inaccuracies in the soil texture. In fact, the two primary studies associated with the site [54,99] represent soil moisture as the average at 0.1, 0.2 and 0.3 m with a closer variability to our simulations. Additionally, there was large variability in the datasets employed by Cosby et al. [80] when the relationships between soil texture and hydraulic parameters were developed. For deeper layers, both models tend to simulate uniform wet conditions (see Figure 8c,d), which is contrary to the arid and Mediterranean sites.

3.6. Uncertainties Associated with Soil Moisture

A mismatch can occur when we compare point-scale soil moisture observations against the averaged simulated values of the top 10 cm layer, which is somewhat close to the surface. Furthermore, the fact that the soil texture had to be defined as uniform over the entire soil column, as already mentioned, certainly has an additional influence on the representativeness of the results. On tropical sites with evergreen tropical forest, the soil surface is usually shaded and covered with organic-matter litter that is frequently wet [100]. It imposes a condition that reduces the surface runoff and increases the base flow [100], which may explain the divergences between SVS and CLASS water balances at tropical sites (Figure 5e,f). Concerning model structure, SVS and CLASS models are not directly informed on the local soil hydraulic properties, which incidentally are unknown at the selected sites. Soil hydraulic properties are instead deduced from pedotransfer functions that provide the most probable values for a given soil texture (Table 2). This procedure inevitably leads to some divergence with reality that will push the models to diverge from observations. In addition, although both models are similarly process-based as to soil description, the constant values differ in the parameterized equations. This is the case for the saturated hydraulic conductivity, which provides higher values in SVS than in CLASS, allowing a greater water content in deeper layers as well as a role in the water uptake from the soil. This effect is observed at the US-TON site (Figure 5). At the same time, model discrepancies in the description of stomatal resistance may also have a role in water uptake from the soil. A closer introspection of the model structure bias may require a sensitivity analysis of specific parameters, particularly the hydraulic conductivity and stomatal resistance.

4. Conclusions

This study used flux tower observations to assess the ability of the SVS model to simulate surface energy fluxes and surface soil moisture under snow-free conditions for various climates and biomes. In addition to observations, the CLASS model was used as a benchmark. This approach provided an integral diagnostic of SVS in terms of energy and water exchange between the land surface and the atmosphere.
SVS led to realistic simulations of latent heat fluxes (NSE = 0.58 on average), sensible heat fluxes (NSE = 0.70 on average) and net radiation (NSE = 0.97 on average) under arid (sites AU-ASM and US-Wkg), Mediterranean (sites US-Ton and IT-Noe) and tropical (sites MY-PSO and GF-Guy) climates. Soil heat fluxes were well simulated at the AU-ASM (NSE = 0.66) and US-Wkg (NSE = 0.52) arid sites, reasonably well simulated at one of the Mediterranean sites (IT-Noe, NSE = 0.39) and poorly at one of the tropical sites (MY-PSO, NSE = −62.32).
Surface soil moisture was well simulated at one arid (US-Wkg, NSE = 0.64) and one Mediterranean site (US-Ton, NSE = 0.73), poorly simulated at one arid (AU-ASM, NSE = −0.04) and one Mediterranean site (IT-Noe, NSE = 0.11) and very poorly simulated at the tropical MY-PSO (NSE = −26.50) and GF-Guy (NSE = −5.60) sites. The simulations of SVS and CLASS showed a consensus for deep soil water content at arid and tropical sites, but SVS showed significant water percolation during the wet season and slow percolation during the dry season for Mediterranean sites, while CLASS produced slow water percolation during the wet season and drastic and dry transitions during the dry season.
Evapotranspiration was the most significant term for water balance with contributions of 95%, 82% and 50% in arid, Mediterranean, and tropical sites, respectively.
As a result of this study, some deficiencies in the SVS model’s ability to simulate energy fluxes and surface soil moisture were identified and thus deserve further attention:
  • The albedo of vegetation is simply based on a weighted mean of look-up table values of fixed albedos. This scheme may lead to a negative bias of up to 12% in the net shortwave radiation and 13% in the net radiation. Albedo is specified the same way as root depth, density and LAI. These are all parameters that can be improved and will impact SVS simulations. The photosynthesis also has several look up tables for various key parameters controlling the stomatal resistance. External databases and satellite-derived approximation could help better specify some of these parameters.
  • Abrupt underestimations of L E at GF-Guy site is mainly associated with transpiration simulations. Thus, further attention should be given to this process.
  • Poorly simulated G is associated with the simple method used (residual of the other energy fluxes) and the single-layer description of the soil. To avoid these structural biases, vertical transport of heat in the soil along with multilayer-energy balance would be an asset in the soil description.
  • The better simulation of soil moisture with CLASS in arid sites suggests that certain features, such as the inclusion of residual saturation when defining water retention curves, can be advantageous. Alternatively, limits on evaporation and moisture stress parameterizations may help to prevent soil moisture to reach zero values.
  • Surface soil moisture at tropical sites should take into account organic matter.

Author Contributions

Conceptualization, G.L., F.A. and V.F.; Funding acquisition, G.L., F.A. and D.F.N.; Methodology, G.L.; Resources, F.A.; Software, M.A., É.G. and V.V.; Supervision, F.A. and V.F.; Validation, G.L.; Writing—original draft, G.L.; and Writing—review and editing, G.L., F.A., M.A., É.G., V.V., D.F.N. and V.F. All authors have read and agreed to the published version of the manuscript.

Funding

This research was funded by the Natural Sciences and Engineering Research Council of Canada (NSERC), Hydro-Québec and the Ouranos consortium on regional climatology and adaptation to climate change, as well as the scientific contribution of Environment and Climate Change Canada and the Ministère de l’Environnement et de la Lutte contre les changements climatiques through NSERC project RDC-477125-14 entitled "Modélisation hydrologique avec bilan énergétique (ÉVAP).

Acknowledgments

This work used eddy covariance data acquired and shared by the FLUXNET community, including AmeriFlux, AfriFlux, AsiaFlux, CarboAfrica, CarboEuropeIP, CarboItaly, CarboMont, ChinaFlux, Fluxnet-Canada, GreenGrass, ICOS, KoFlux, LBA, NECC, OzFlux-TERN, TCOS-Siberia and USCCC. The ERA-Interim reanalysis data are provided by ECMWF and processed by LSCE. The FLUXNET eddy covariance data processing and harmonization were carried out by the European Fluxes Database Cluster, AmeriFlux Management Project and Fluxdata project of FLUXNET, with the support of CDIAC and ICOS Ecosystem Thematic Center, and the OzFlux, ChinaFlux and AsiaFlux offices.

Conflicts of Interest

The authors declare no conflict of interest. The funders had no role in the design of the study; in the collection, analyses, or interpretation of data; in the writing of the manuscript, or in the decision to publish the results.

References

  1. Dirmeyer, P.A. Using a global soil wetness dataset to improve seasonal climate simulation. J. Clim. 2000, 13, 2900–2922. [Google Scholar] [CrossRef]
  2. Koster, R.D.; Suarez, M.J.; Ducharne, A.; Stieglitz, M.; Kumar, P. A catchment-based approach to modeling land surface processes in a general circulation model: 1. Model structure. J. Geophys. Res. Atmos. 2000, 105, 24809–24822. [Google Scholar] [CrossRef]
  3. Rodell, M.; Houser, P.R.; Jambor, U.; Gottschalck, J.; Mitchell, K.; Meng, C.J.; Arsenault, K.; Cosgrove, B.; Radakovich, J.; Bosilovich, M.; et al. The global land data assimilation system. Bull. Am. Meteorol. Soc. 2004, 85, 381–394. [Google Scholar] [CrossRef] [Green Version]
  4. Mitchell, K.E.; Lohmann, D.; Houser, P.R.; Wood, E.F.; Schaake, J.C.; Robock, A.; Cosgrove, B.A.; Sheffield, J.; Duan, Q.; Luo, L.; et al. The multi-institution North American Land Data Assimilation System (NLDAS): Utilizing multiple GCIP products and partners in a continental distributed hydrological modeling system. J. Geophys. Res. Atmos. 2004, 109. [Google Scholar] [CrossRef] [Green Version]
  5. Carrera, M.L.; Bélair, S.; Fortin, V.; Bilodeau, B.; Charpentier, D.; Doré, I. Evaluation of snowpack simulations over the Canadian Rockies with an experimental hydrometeorological modeling system. J. Hydrometeorol. 2010, 11, 1123–1140. [Google Scholar] [CrossRef]
  6. Gaborit, É.; Fortin, V.; Xu, X.; Seglenieks, F.; Tolson, B.; Fry, L.M.; Hunter, T.; Anctil, F.; Gronewold, A.D. A Hydrological Prediction System Based on the SVS Land-Surface Scheme: Efficient calibration of GEM-Hydro for streamflow simulation over the Lake Ontario basin. Hydrol. Earth Syst. Sci. 2017, 21, 4825–4839. [Google Scholar] [CrossRef] [Green Version]
  7. Pitman, A. The evolution of, and revolution in, land surface schemes designed for climate models. Int. J. Climatol. A J. R. Meteorol. Soc. 2003, 23, 479–510. [Google Scholar] [CrossRef]
  8. van den Hurk, B.; Best, M.; Dirmeyer, P.; Pitman, A.; Polcher, J.; Santanello, J. Acceleration of land surface model development over a decade of GLASS. Bull. Am. Meteorol. Soc. 2011, 92, 1593–1600. [Google Scholar] [CrossRef] [Green Version]
  9. Henderson-Sellers, A.; McGuffie, K.; Pitman, A. The project for intercomparison of land-surface parametrization schemes (PILPS): 1992 to 1995. Clim. Dyn. 1996, 12, 849–859. [Google Scholar] [CrossRef]
  10. Boone, A.; de Rosnay, P.; Balsamo, G.; Beljaars, A.; Chopin, F.; Decharme, B.; Delire, C.; Ducharne, A.; Gascoin, S.; Grippa, M.; et al. The AMMA land surface model intercomparison project (ALMIP). Bull. Am. Meteorol. Soc. 2009, 90, 1865–1880. [Google Scholar] [CrossRef]
  11. Sueyoshi, T.; Saito, K.; Miyazaki, S.; Mori, J.; Ise, T.; Arakida, H.; Suzuki, R.; Sato, A.; Iijima, Y.; Yabuki, H.; et al. The GRENE-TEA Model Intercomparison Project (GTMIP) stage 1 forcing dataset. Earth Syst. Sci. Data 2015, 8, 703–736. [Google Scholar] [CrossRef]
  12. Blyth, E.; Gash, J.; Lloyd, A.; Pryor, M.; Weedon, G.P.; Shuttleworth, J. Evaluating the JULES land surface model energy fluxes using FLUXNET data. J. Hydrometeorol. 2010, 11, 509–519. [Google Scholar] [CrossRef] [Green Version]
  13. Stöckli, R.; Vidale, P.L. Modeling diurnal to seasonal water and heat exchanges at European Fluxnet sites. Theor. Appl. Climatol. 2005, 80, 229–243. [Google Scholar] [CrossRef]
  14. Verseghy, D.L. CLASS—A Canadian land surface scheme for GCMs. I. Soil model. Int. J. Climatol. 1991, 11, 111–133. [Google Scholar] [CrossRef]
  15. Verseghy, D.L.; McFarlane, N.; Lazare, M. CLASS—A Canadian land surface scheme for GCMs, II. Vegetation model and coupled runs. Int. J. Climatol. 1993, 13, 347–370. [Google Scholar] [CrossRef]
  16. Schlosser, C.A.; Slater, A.G.; Robock, A.; Pitman, A.J.; Vinnikov, K.Y.; Henderson-Sellers, A.; Speranskaya, N.A.; Mitchell, K. Simulations of a boreal grassland hydrology at Valdai, Russia: PILPS Phase 2 (d). Mon. Weather Rev. 2000, 128, 301–321. [Google Scholar] [CrossRef]
  17. Slater, A.G.; Schlosser, C.A.; Desborough, C.E.; Pitman, A.J.; Henderson-Sellers, A.; Robock, A.; Vinnikov, K.Y.; Entin, J.; Mitchell, K.; Chen, F.; et al. The representation of snow in land surface schemes: Results from PILPS 2 (d). J. Hydrometeorol. 2001, 2, 7–25. [Google Scholar] [CrossRef] [Green Version]
  18. Bowling, L.C.; Lettenmaier, D.P.; Nijssen, B.; Graham, L.; Clark, D.B.; Maayar, M.E.; Essery, R.; Goers, S.; Gusev, Y.M.; Habets, F.; et al. Simulation of high-latitude hydrological processes in the Torne–Kalix basin: PILPS Phase 2 (e): 1: Experiment description and summary intercomparisons. Glob. Planet. Chang. 2003, 38, 1–30. [Google Scholar] [CrossRef] [Green Version]
  19. Rutter, N.; Essery, R.; Pomeroy, J.; Altimir, N.; Andreadis, K.; Baker, I.; Barr, A.; Bartlett, P.; Boone, A.; Deng, H.; et al. Evaluation of forest snow processes models (SnowMIP2). J. Geophys. Res. Atmos. 2009, 114. [Google Scholar] [CrossRef] [Green Version]
  20. Bartlett, P.A.; McCaughey, J.H.; Lafleur, P.M.; Verseghy, D.L. Performance of the Canadian land surface scheme at temperate aspen-birch and mixed forests, and a boreal young jack pine forest: Tests involving canopy conductance parametrizations. Atmos. Ocean 2000, 38, 113–140. [Google Scholar] [CrossRef] [Green Version]
  21. Bartlett, P.A.; Harry McCaughey, J.; Lafleur, P.M.; Verseghy, D.L. Modelling evapotranspiration at three boreal forest stands using the CLASS: Tests of parameterizations for canopy conductance and soil evaporation. Int. J. Climatol. A J. R. Meteorol. Soc. 2003, 23, 427–451. [Google Scholar] [CrossRef] [Green Version]
  22. Wang, S.; Grant, R.; Verseghy, D.; Black, T. Modelling plant carbon and nitrogen dynamics of a boreal aspen forest in CLASS—the Canadian Land Surface Scheme. Ecol. Model. 2001, 142, 135–154. [Google Scholar] [CrossRef]
  23. Arain, M.; Black, T.; Barr, A.; Jarvis, P.; Massheder, J.; Verseghy, D.; Nesic, Z. Effects of seasonal and interannual climate variability on net ecosystem productivity of boreal deciduous and conifer forests. Can. J. For. Res. 2002, 32, 878–891. [Google Scholar] [CrossRef]
  24. Verseghy, D.; Brown, R.; Wang, L. Evaluation of CLASS snow simulation over eastern Canada. J. Hydrometeorol. 2017, 18, 1205–1225. [Google Scholar] [CrossRef]
  25. Isabelle, P.E.; Nadeau, D.F.; Asselin, M.H.; Harvey, R.; Musselman, K.N.; Rousseau, A.N.; Anctil, F. Solar radiation transmittance of a boreal balsam fir canopy: Spatiotemporal variability and impacts on growing season hydrology. Agric. For. Meteorol. 2018, 263, 1–14. [Google Scholar] [CrossRef]
  26. Comer, N.T.; Lafleur, P.M.; Roulet, N.T.; Letts, M.G.; Skarupa, M.; Verseghy, D. A test of the Canadian Land Surface Scheme (CLASS) for a variety of wetland types. Atmos. Ocean 2000, 38, 161–179. [Google Scholar] [CrossRef]
  27. Lafleur, P.M.; Skarupa, M.R.; Verseghy, D.L. Validation of the Canadian Land Surface Scheme (CLASS) for a subarctic open woodland. Atmos. Ocean 2000, 38, 205–225. [Google Scholar] [CrossRef]
  28. Brown, R.; Bartlett, P.; MacKay, M.; Verseghy, D. Evaluation of snow cover in CLASS for SnowMIP. Atmos. Ocean 2006, 44, 223–238. [Google Scholar] [CrossRef]
  29. Wen, L.; Wu, Z.; Lu, G.; Lin, C.A.; Zhang, J.; Yang, Y. Analysis and improvement of runoff generation in the land surface scheme CLASS and comparison with field measurements from China. J. Hydrol. 2007, 345, 1–15. [Google Scholar] [CrossRef]
  30. Alves, M.; Music, B.; Nadeau, D.F.; Anctil, F. Comparing the Performance of the Maximum Entropy Production Model With a Land Surface Scheme in Simulating Surface Energy Fluxes. J. Geophys. Res. Atmos. 2019, 124, 3279–3300. [Google Scholar] [CrossRef]
  31. Pietroniro, A.; Fortin, V.; Kouwen, N.; Neal, C.; Turcotte, R.; Davison, B.; Verseghy, D.; Soulis, E.D.; Caldwell, R.; Evora, N.; et al. Development of the MESH modelling system for hydrological ensemble forecasting of the Laurentian Great Lakes at the regional scale. Hydrol. Earth Syst. Sci. 2007, 11, 1279–1294. [Google Scholar] [CrossRef] [Green Version]
  32. Haghnegahdar, A.; Tolson, B.A.; Craig, J.R.; Paya, K.T. Assessing the performance of a semi-distributed hydrological model under various watershed discretization schemes. Hydrol. Process. 2015, 29, 4018–4031. [Google Scholar] [CrossRef]
  33. Davison, B.; Fortin, V.; Pietroniro, A.; Yau, M.K.; Leconte, R. Parameter-state ensemble thinning for short-term hydrological prediction. Hydrol. Earth Syst. Sci. 2019, 23, 741–762. [Google Scholar] [CrossRef] [Green Version]
  34. Abramowitz, G.; Leuning, R.; Clark, M.; Pitman, A. Evaluating the performance of land surface models. J. Clim. 2008, 21, 5468–5481. [Google Scholar] [CrossRef]
  35. Chen, T.H.; Henderson-Sellers, A.; Milly, P.C.D.; Pitman, A.J.; Beljaars, A.C.M.; Polcher, J.; Abramopoulos, F.; Boone, A.; Chang, S.; Chen, F.; et al. Cabauw experimental results from the project for intercomparison of land-surface parameterization schemes. J. Clim. 1997, 10, 1194–1215. [Google Scholar] [CrossRef] [Green Version]
  36. Sellers, P.; Dorman, J. Testing the simple biosphere model (SiB) using point micrometeorological and biophysical data. J. Clim. Appl. Meteorol. 1987, 26, 622–651. [Google Scholar] [CrossRef] [Green Version]
  37. Wang, K.; Dickinson, R.E. A review of global terrestrial evapotranspiration: Observation, modeling, climatology, and climatic variability. Rev. Geophys. 2012, 50. [Google Scholar] [CrossRef]
  38. Lohmann, D.; Mitchell, K.E.; Houser, P.R.; Wood, E.F.; Schaake, J.C.; Robock, A.; Cosgrove, B.A.; Sheffield, J.; Duan, Q.; Luo, L.; et al. Streamflow and water balance intercomparisons of four land surface models in the North American Land Data Assimilation System project. J. Geophys. Res. Atmos. 2004, 109. [Google Scholar] [CrossRef]
  39. Lohmann, D.; Lettenmaier, D.P.; Liang, X.; Wood, E.F.; Boone, A.; Chang, S.; Chen, F.; Dai, Y.; Desborough, C.; Dickinson, R.E.; et al. The Project for Intercomparison of Land-surface Parameterization Schemes (PILPS) phase 2(c) Red–Arkansas River basin experiment: 3. Spatial and temporal analysis of water fluxes. Glob. Planet. Chang. 1998, 19, 161–179. [Google Scholar] [CrossRef]
  40. Bélair, S.; Crevier, L.P.; Mailhot, J.; Bilodeau, B.; Delage, Y. Operational implementation of the ISBA land surface scheme in the Canadian regional weather forecast model. Part I: Warm season results. J. Hydrometeorol. 2003, 4, 352–370. [Google Scholar] [CrossRef]
  41. Bélair, S.; Brown, R.; Mailhot, J.; Bilodeau, B.; Crevier, L.P. Operational implementation of the ISBA land surface scheme in the Canadian regional weather forecast model. Part II: Cold season results. J. Hydrometeorol. 2003, 4, 371–386. [Google Scholar] [CrossRef]
  42. Bélair, S.; Roch, M.; Leduc, A.M.; Vaillancourt, P.A.; Laroche, S.; Mailhot, J. Medium-range quantitative precipitation forecasts from Canada’s new 33-km deterministic global operational system. Weather Forecast. 2009, 24, 690–708. [Google Scholar] [CrossRef]
  43. Alavi, N.; Bélair, S.; Fortin, V.; Zhang, S.; Husain, S.Z.; Carrera, M.L.; Abrahamowicz, M. Warm season evaluation of soil moisture prediction in the Soil, Vegetation, and Snow (SVS) scheme. J. Hydrometeorol. 2016, 17, 2315–2332. [Google Scholar] [CrossRef]
  44. Husain, S.Z.; Alavi, N.; Bélair, S.; Carrera, M.; Zhang, S.; Fortin, V.; Abrahamowicz, M.; Gauthier, N. The multibudget Soil, Vegetation, and Snow (SVS) scheme for land surface parameterization: Offline warm season evaluation. J. Hydrometeorol. 2016, 17, 2293–2313. [Google Scholar] [CrossRef]
  45. Vionnet, V.; Fortin, V.; Gaborit, E.; Roy, G.; Abrahamowicz, M.; Gasset, N.; Pomeroy, J.W. High-resolution hydrometeorological modelling of the June 2013 flood in southern Alberta, Canada. Hydrol. Earth Syst. Sci. Discuss. 2019, 2019, 1–36. [Google Scholar] [CrossRef] [Green Version]
  46. Maheu, A.; Anctil, F.; Gaborit, É.; Fortin, V.; Nadeau, D.F.; Therrien, R. A field evaluation of soil moisture modelling with the Soil, Vegetation, and Snow (SVS) land surface model using evapotranspiration observations as forcing data. J. Hydrol. 2018, 558, 532–545. [Google Scholar] [CrossRef]
  47. Baldocchi, D.; Falge, E.; Gu, L.; Olson, R.; Hollinger, D.; Running, S.; Anthoni, P.; Bernhofer, C.; Davis, K.; Evans, R.; et al. FLUXNET: A new tool to study the temporal and spatial variability of ecosystem-scale carbon dioxide, water vapor, and energy flux densities. Bull. Am. Meteorol. Soc. 2001, 82, 2415–2434. [Google Scholar] [CrossRef]
  48. Hutley, L.B.; Beringer, J.; Isaac, P.R.; Hacker, J.M.; Cernusak, L.A. A sub-continental scale living laboratory: Spatial patterns of savanna vegetation over a rainfall gradient in northern Australia. Agric. For. Meteorol. 2011, 151, 1417–1428. [Google Scholar] [CrossRef]
  49. Adams, D.K.; Comrie, A.C. The north American monsoon. Bull. Am. Meteorol. Soc. 1997, 78, 2197–2214. [Google Scholar] [CrossRef] [Green Version]
  50. Moran, M.S.; Scott, R.L.; Hamerlynck, E.P.; Green, K.N.; Emmerich, W.E.; Collins, C.D.H. Soil evaporation response to Lehmann lovegrass (Eragrostis lehmanniana) invasion in a semiarid watershed. Agric. For. Meteorol. 2009, 149, 2133–2142. [Google Scholar] [CrossRef]
  51. Baldocchi, D.; Xu, L.; Kiang, N. How plant functional-type, weather, seasonal drought, and soil physical properties alter water and energy fluxes of an oak–grass savanna and an annual grassland. Agric. For. Meteorol. 2004, 123, 13–39. [Google Scholar] [CrossRef] [Green Version]
  52. Marras, S.; Pyles, R.D.; Sirca, C.; Snyder, R.; Duce, P.; Spano, D. Evaluation of the Advanced Canopy–Atmosphere–Soil Algorithm (ACASA) model performance over Mediterranean maquis ecosystem. Agric. For. Meteorol. 2011, 151, 730–745. [Google Scholar] [CrossRef]
  53. Noguchi, S.; Nik, A.R.; Tani, M. Rainfall characteristics of tropical rainforest at Pasoh forest reserve, Negeri Sembilan, Peninsular Malaysia. In Pasoh: Ecology of A Lowland Rain Forest in Southeast Asia; Springer: Berlin, Germany, 2003; pp. 51–58. [Google Scholar]
  54. Kosugi, Y.; Takanashi, S.; Tani, M.; Ohkubo, S.; Matsuo, N.; Itoh, M.; Noguchi, S.; Nik, A.R. Effect of inter-annual climate variability on evapotranspiration and canopy CO2 exchange of a tropical rainforest in Peninsular Malaysia. J. For. Res. 2012, 17, 227–240. [Google Scholar] [CrossRef]
  55. Bonal, D.; Bosc, A.; Ponton, S.; Goret, J.Y.; Burban, B.; Gross, P.; Bonnefond, J.M.; Elbers, J.; Longdoz, B.; Epron, D.; et al. Impact of severe dry season on net ecosystem exchange in the Neotropical rainforest of French Guiana. Glob. Chang. Biol. 2008, 14, 1917–1933. [Google Scholar] [CrossRef]
  56. Gill, A.E. Atmosphere—Ocean Dynamics; Elsevier: Amsterdam, The Netherlands, 2016; pp. 150–155. [Google Scholar]
  57. Reichstein, M.; Falge, E.; Baldocchi, D.; Papale, D.; Aubinet, M.; Berbigier, P.; Bernhofer, C.; Buchmann, N.; Gilmanov, T.; Granier, A.; et al. On the separation of net ecosystem exchange into assimilation and ecosystem respiration: Review and improved algorithm. Glob. Chang. Biol. 2005, 11, 1424–1439. [Google Scholar] [CrossRef]
  58. Vuichard, N.; Papale, D. Filling the gaps in meteorological continuous data measured at FLUXNET sites with ERA-Interim reanalysis. Earth Syst. Sci. Data 2015, 7, 157–171. [Google Scholar] [CrossRef] [Green Version]
  59. Moncrieff, J.B.; Massheder, J.; De Bruin, H.; Elbers, J.; Friborg, T.; Heusinkveld, B.; Kabat, P.; Scott, S.; Søgaard, H.; Verhoef, A. A system to measure surface fluxes of momentum, sensible heat, water vapour and carbon dioxide. J. Hydrol. 1997, 188, 589–611. [Google Scholar] [CrossRef]
  60. Miller, G.R.; Baldocchi, D.D.; Law, B.E.; Meyers, T. An analysis of soil moisture dynamics using multi-year data from a network of micrometeorological observation sites. Adv. Water Resour. 2007, 30, 1065–1081. [Google Scholar] [CrossRef] [Green Version]
  61. Keefer, T.O.; Moran, M.S.; Paige, G.B. Long-term meteorological and soil hydrology database, Walnut Gulch Experimental Watershed, Arizona, United States. Water Resour. Res. 2008, 44. [Google Scholar] [CrossRef] [Green Version]
  62. Cleverly, J.; Boulain, N.; Villalobos-Vega, R.; Grant, N.; Faux, R.; Wood, C.; Cook, P.G.; Yu, Q.; Leigh, A.; Eamus, D. Dynamics of component carbon fluxes in a semi-arid Acacia woodland, central Australia. J. Geophys. Res. Biogeosci. 2013, 118, 1168–1185. [Google Scholar] [CrossRef]
  63. Farquhar, G.D.; von Caemmerer, S.V.; Berry, J. A biochemical model of photosynthetic CO2 assimilation in leaves of C 3 species. Planta 1980, 149, 78–90. [Google Scholar] [CrossRef] [Green Version]
  64. Collatz, G.J.; Ball, J.T.; Grivet, C.; Berry, J.A. Physiological and environmental regulation of stomatal conductance, photosynthesis and transpiration: A model that includes a laminar boundary layer. Agric. For. Meteorol. 1991, 54, 107–136. [Google Scholar] [CrossRef]
  65. Collatz, G.J.; Ribas-Carbo, M.; Berry, J. Coupled photosynthesis-stomatal conductance model for leaves of C4 plants. Funct. Plant Biol. 1992, 19, 519–538. [Google Scholar] [CrossRef]
  66. Clapp, R.B.; Hornberger, G.M. Empirical equations for some soil hydraulic properties. Water Resour. Res. 1978, 14, 601–604. [Google Scholar] [CrossRef] [Green Version]
  67. Boone, A.; Calvet, J.C.; Noilhan, J. Inclusion of a third soil layer in a land surface scheme using the force–restore method. J. Appl. Meteorol. 1999, 38, 1611–1630. [Google Scholar] [CrossRef]
  68. Soulis, E.; Craig, J.; Fortin, V.; Liu, G. A simple expression for the bulk field capacity of a sloping soil horizon. Hydrol. Process. 2011, 25, 112–116. [Google Scholar] [CrossRef]
  69. Brooks, R.H.; Corey, A.T. Properties of porous media affecting fluid flow. J. Irrig. Drain. Div. 1966, 92, 61–90. [Google Scholar]
  70. Wu, Y.; Verseghy, D.L.; Melton, J.R. Integrating peatlands into the coupled Canadian Land Surface Scheme (CLASS) v3. 6 and the Canadian Terrestrial Ecosystem Model (CTEM) v2. 0. Geosci. Model Dev. 2016, 9. [Google Scholar] [CrossRef] [Green Version]
  71. Von Salzen, K.; Scinocca, J.F.; McFarlane, N.A.; Li, J.; Cole, J.N.S.; Plummer, D.; Verseghy, D.; Reader, M.C.; Ma, X.; Lazare, M.; et al. The Canadian fourth generation atmospheric global climate model (CanAM4). Part I: Representation of physical processes. Atmos. Ocean 2013, 51, 104–125. [Google Scholar] [CrossRef] [Green Version]
  72. Verseghy, D.L. The Canadian land surface scheme (CLASS): Its history and future. Atmos. Ocean 2000, 38, 1–13. [Google Scholar] [CrossRef]
  73. Melton, J.; Arora, V. Sub-grid scale representation of vegetation in global land surface schemes: Implications for estimation of the terrestrial carbon sink. Biogeosciences 2014, 11, 1021–1036. [Google Scholar] [CrossRef] [Green Version]
  74. Bhumralkar, C.M. Numerical experiments on the computation of ground surface temperature in an atmospheric general circulation model. J. Appl. Meteorol. 1975, 14, 1246–1258. [Google Scholar] [CrossRef]
  75. Blackadar, A.K. Modeling the nocturnal boundary layer. Preprints, Third Symp. on Atmospheric Turbulence, Diffusion, and Air Quality, Raleigh. Am. Meteorl. Soc. 1976, 58, 242–250. [Google Scholar]
  76. Sicart, J.E.; Essery, R.L.; Pomeroy, J.W.; Hardy, J.; Link, T.; Marks, D. A sensitivity study of daytime net radiation during snowmelt to forest canopy and atmospheric conditions. J. Hydrometeorol. 2004, 5, 774–784. [Google Scholar] [CrossRef] [Green Version]
  77. Dickinson, R.E. Modeling evapotranspiration for three-dimensional global climate models. Clim. Process. Clim. Sensit. 1984, 29, 58–72. [Google Scholar]
  78. Jarvis, P. The interpretation of the variations in leaf water potential and stomatal conductance found in canopies in the field. Philos. Trans. R. Soc. Lond. B Biol. Sci. 1976, 273, 593–610. [Google Scholar]
  79. Noilhan, J.; Planton, S. A simple parameterization of land surface processes for meteorological models. Mon. Weather Rev. 1989, 117, 536–549. [Google Scholar] [CrossRef]
  80. Cosby, B.; Hornberger, G.; Clapp, R.; Ginn, T. A statistical exploration of the relationships of soil moisture characteristics to the physical properties of soils. Water Resour. Res. 1984, 20, 682–690. [Google Scholar] [CrossRef] [Green Version]
  81. Soulis, E.; Snelgrove, K.; Kouwen, N.; Seglenieks, F.; Verseghy, D. Towards closing the vertical water balance in Canadian atmospheric models: Coupling of the land surface scheme CLASS with the distributed hydrological model WATFLOOD. Atmos. Ocean 2000, 38, 251–269. [Google Scholar] [CrossRef]
  82. Scott, R.L.; Hamerlynck, E.P.; Jenerette, G.D.; Moran, M.S.; Barron-Gafford, G.A. Carbon dioxide exchange in a semidesert grassland through drought-induced vegetation change. J. Geophys. Res. Biogeosci. 2010, 115. [Google Scholar] [CrossRef]
  83. Yamashita, T.; Kasuya, N.; Kadir, W.R.; Chik, S.W.; Seng, Q.E.; Okuda, T. Soil and Belowground Characteristics of Pasoh Forest Reserve. In Pasoh: Ecology of a Lowland Rain Forest in Southeast Asia; Springer: Tokyo, Japan, 2003; pp. 89–109. [Google Scholar]
  84. Schlesinger, W.H.; Jasechko, S. Transpiration in the global water cycle. Agric. For. Meteorol. 2014, 189, 115–117. [Google Scholar] [CrossRef]
  85. Wilson, K.; Goldstein, A.; Falge, E.; Aubinet, M.; Baldocchi, D.; Berbigier, P.; Bernhofer, C.; Ceulemans, R.; Dolman, H.; Field, C.; et al. Energy balance closure at FLUXNET sites. Agric. For. Meteorol. 2002, 113, 223–243. [Google Scholar] [CrossRef] [Green Version]
  86. Baldocchi, D.; Meyers, T.P.; Wilson, K.B. Correction of eddy-covariance measurements incorporating both advective effects and density fluxes. Bound.-Layer Meteorol. 2000, 97, 487–511. [Google Scholar]
  87. Lee, X. On micrometeorological observations of surface-air exchange over tall vegetation. Agric. For. Meteorol. 1998, 91, 39–49. [Google Scholar] [CrossRef]
  88. Sun, J.; Esbensen, S.K.; Mahrt, L. Estimation of surface heat flux. J. Atmos. Sci. 1995, 52, 3162–3171. [Google Scholar] [CrossRef] [Green Version]
  89. Manzi, A.; Planton, S. Implementation of the ISBA parametrization scheme for land surface processes in a GCM—an annual cycle experiment. J. Hydrol. 1994, 155, 353–387. [Google Scholar] [CrossRef]
  90. Bringfelt, B.; Heikinheimo, M.; Gustafsson, N.; Perov, V.; Lindroth, A. A new land-surface treatment for HIRLAM Comparisons with NOPEX measurements. Agric. For. Meteorol. 1999, 98, 239–256. [Google Scholar] [CrossRef]
  91. Douville, H.; Chauvin, F. Relevance of soil moisture for seasonal climate predictions: A preliminary study. Clim. Dyn. 2000, 16, 719–736. [Google Scholar] [CrossRef]
  92. Albertson, J.; Kiely, G. On the structure of soil moisture time series in the context of land surface models. J. Hydrol. 2001, 243, 101–119. [Google Scholar] [CrossRef]
  93. Hu, Z.; Islam, S. Prediction of ground surface temperature and soil moisture content by the force-restore method. Water Resour. Res. 1995, 31, 2531–2539. [Google Scholar] [CrossRef]
  94. Tilley, J.S.; Lynch, A.H. On the applicability of current land surface schemes for Arctic tundra: An intercomparison study. J. Geophys. Res. Atmos. 1998, 103, 29051–29063. [Google Scholar] [CrossRef]
  95. Van Loon, W.; Bastings, H.; Moors, E. Calibration of soil heat flux sensors. Agric. For. Meteorol. 1998, 92, 1–8. [Google Scholar] [CrossRef]
  96. Verhoef, A.; van den Hurk, B.J.; Jacobs, A.F.; Heusinkveld, B.G. Thermal soil properties for vineyard (EFEDA-I) and savanna (HAPEX-Sahel) sites. Agric. For. Meteorol. 1996, 78, 1–18. [Google Scholar] [CrossRef]
  97. Mayocchi, C.; Bristow, K.L. Soil surface heat flux: Some general questions and comments on measurements. Agric. For. Meteorol. 1995, 75, 43–50. [Google Scholar] [CrossRef]
  98. Verseghy, D.L. The Canadian land surface scheme: Technical documentation—version 3.6. In Climate Research Division, Science and Technology Branch; Environment Canada: Toronto, ON, USA, 2012. [Google Scholar]
  99. Kosugi, Y.; Takanashi, S.; Ohkubo, S.; Matsuo, N.; Tani, M.; Mitani, T.; Tsutsumi, D.; Nik, A.R. CO2 exchange of a tropical rainforest at Pasoh in Peninsular Malaysia. Agric. For. Meteorol. 2008, 148, 439–452. [Google Scholar] [CrossRef]
  100. Bruno, R.D.; Da Rocha, H.R.; De Freitas, H.C.; Goulden, M.L.; Miller, S.D. Soil moisture dynamics in an eastern Amazonian tropical forest. Hydrol. Process. Int. J. 2006, 20, 2477–2489. [Google Scholar] [CrossRef] [Green Version]
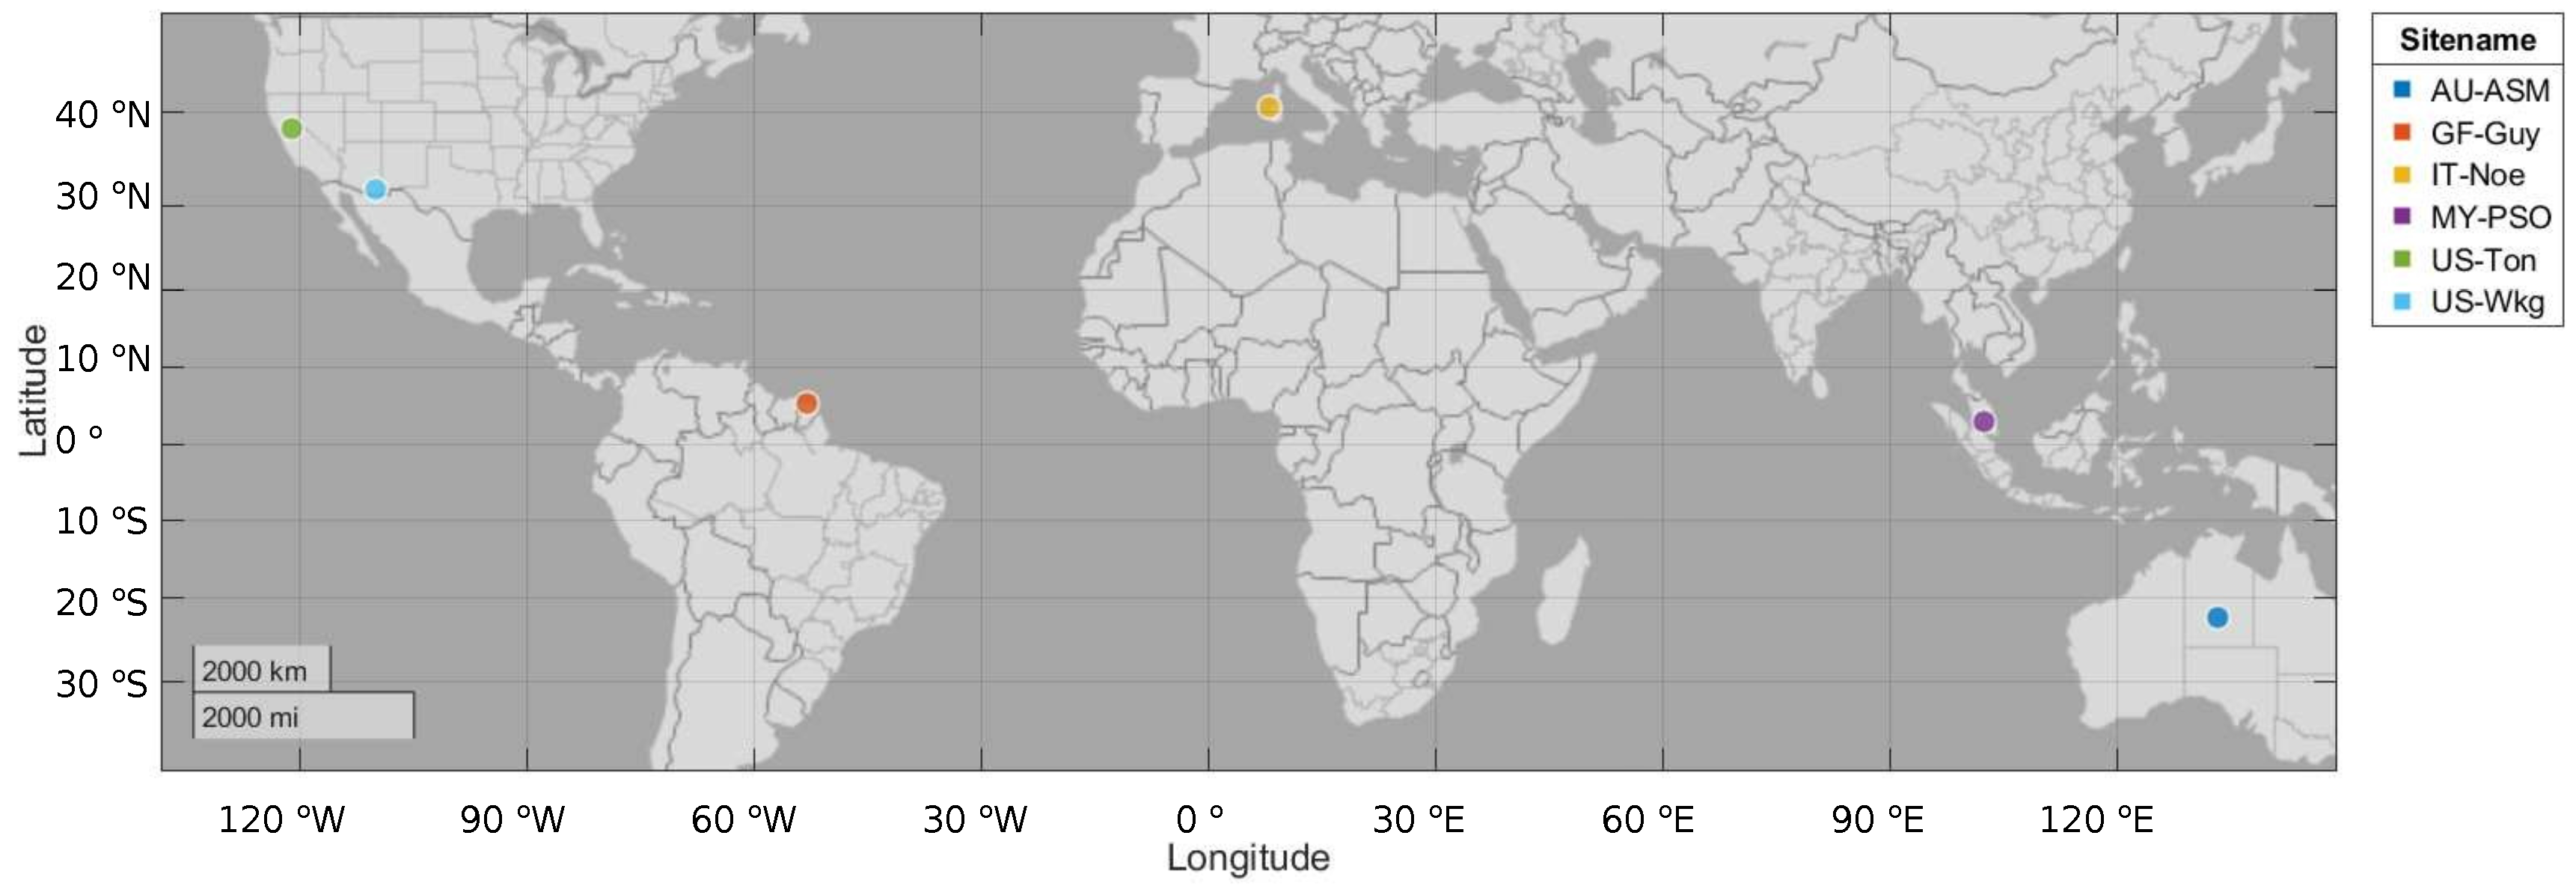
Figure 1. Location of the FLUXNET study sites: Alice Springs (AU-ASM) in Australia; Walnut Gulch Kendall Grasslands (US-Wkg) and Tonzi Ranch (US-Ton) in the United States; Arca di Noe-Le Prigionette (IT-Noe) in Italy; Pasoh Forest Reserve (MY-PSO) in Malaysia; and Guyaflux (GF-Guy) in French Guiana.
Atmosphere 11 00278 g001
Figure 2. Mean monthly air temperature and precipitation for the studied periods, sorted according to climate type. Arid sites: (a) AU-ASM and (b) US-Wkg; Mediterranean sites: (c) US-Ton and (d) IT-Noe; and tropical sites: (e) MY-PSO and (f) GF-Guy.
Atmosphere 11 00278 g002
Figure 3. Mean annual cycles of latent heat flux ( L E ), sensible heat flux (H), net radiation ( R n ) and soil heat flux (G) at arid sites ((a) AU-ASM, (b) US-Wkg), mediterranean sites ((c) US-Ton, (d) IT-Noe) and tropical sites ((e) MY-PSO, (f) GF-Guy). Black lines correspond to observations, blue and red lines correspond to SVS and CLASS simulations, respectively. Filtered 30-min data for observations and simulations were used to compute the mean annual cycles. Note that the y-axis for G differs from the rest of the graphs.
Atmosphere 11 00278 g003
Figure 4. Mean annual cycles of evapotranspiration ( E T ), soil evaporation ( E s ), transpiration ( T s ) and wet canopy evaporation ( E c ) at arid sites ((a) AU-ASM, (b) US-Wkg), mediterranean sites ((c) US-Ton, (d) IT-Noe) and tropical sites ((e) MY-PSO, (f) GF-Guy). Black lines correspond to observations, blue and red lines correspond to SVS and CLASS simulations, respectively.
Atmosphere 11 00278 g004
Figure 5. Partitioning of the precipitation into the different water balance terms, namely evapotranspiration, ET (green); overland flow, R s u r f (blue); base flow, R b a s e (yellow); and storage in the soil column, Δ S (red). The partition correspond to arid sites ((a) AU-ASM, (b) US-Wkg), mediterranean sites ((c) US-Ton, (d) IT-Noe) and tropical sites ((e) MY-PSO, (f) GF-Guy.
Atmosphere 11 00278 g005
Figure 6. Precipitation (P) and soil water content (SWC) at 30-min time steps for the AU-ASM arid site: (a) precipitation; (b) soil water content at the surface layer (0–10 cm) for observations (black lines), SVS simulations (blue line) and CLASS simulations (red line); and simulated soil water content profile for the (c) SVS and (d) CLASS models.
Atmosphere 11 00278 g006
Figure 7. Precipitation (P) and soil water content (SWC) at 30-min time steps for the US-Ton Mediterranean site: (a) precipitation; (b) soil water content at the surface layer (0–10 cm) for observations (black lines), SVS simulations (blue line) and CLASS simulations (red line); and simulated soil water content profile for (c) SVS and (d) CLASS models.
Atmosphere 11 00278 g007
Figure 8. Precipitation (P) and soil water content (SWC) at 30-min sampling intervals for the MY-PSO tropical site: (a) precipitation; (b) soil water content at the surface layer (0–10 cm) for observations (black lines), SVS simulations (blue line) and CLASS simulations (red line); and simulated soil water content profile for (c) SVS and (d) CLASS models.
Atmosphere 11 00278 g008
Table 1. Main characteristics of the study sites.
CharacteristicAU-ASMUS-WkgUS-TonIT-NoeMY-PSOGF-Guy
Latitude ( )−22.2831.7438.4340.612.975.28
Longitude ( )133.20−109.94−120.978.15102.31−52.92
Altitude (m)60615301772515048
Climate classification 1 BshBSkCsaCsaAfAf
Biome type 2 ENFGRAWSACSHEBFEBF
MAP (mm) 3 30640755958818043041
MAT ( C)20.015.615.815.925.325.7
Data period of simulation2011–20142011–20142003–20142004–20142003–20092004–2014
1 Köppen–Geiger climate classification: hot semiarid (Bsh) and cold semiarid (BSk). 2 Biome types according to IGBP land cover classification: evergreen needleleaf forest (ENF), grassland (GRA), woody savanna (WSA), closed shrubland (CSH) and evergreen broadleaf forest (EBF). 3 Mean annual precipitation (MAP) and mean annual air temperature (MAT).
Table 2. Summary of SVS and CLASS main physical processes.
ProcessSVSCLASS
soil and vegetation turbulent fluxesbulk aerodynamic approach [44]bulk aerodynamic approach [14,15]
soil heat fluxresidual of net radiation and turbulent fluxeslinear combination of soil temperatures [14]
surface (skin) and mean vegetation temperatureforce-restore method [74,75]heat diffusion equation [15]
transmissivityBeer’s law [76]Beer’s law [15]
canopy interception capacityproportional to LAI [77]proportional to LAI [15]
stomatal resistance1. empirical parameterization [44,78,79]
2. Photosynthesis module (biochemical approach) [44,63,64,65]
empirical parameterization [15]
surface (skin) and mean soil temperatureforce-restore method [74,75]heat conservation equation [14]
soil moisturemoisture conservation equation [43,44]moisture diffusion equation [14]
soil moisture flux1-D Darcy’s law [43]1-D Darcy’s law [14]
saturated hydraulic conductivity, saturated soil water suctionempirical equation based on soil texture [69]empirical equation based on soil texture [69,80]
wilting point; field capacity; saturated values of volumetric water content, hydraulic conductivity, and soil water suctionparameterization from soil texture [67,69]parameterization from soil texture [68,80]
relationship between soil water content, soil water potential, and relative permeabilityempirical equation [43,66]empirical equation [15,66]
vertical water flow1-D Richards equation [81]1-D Richards equation [14]
lateral water flow1-D Richards equation [68,81]1-D Richards equation [68,81]
Table 3. Parameters for SVS and CLASS models at each FLUXNET site used in this study.
Parameters 1 AU-ASMUS-WkgUS-TonIT-NoeMY-PSOGF-Guy
Vegetation type 2 ENFLGLGEBFLGEBSTEBFLGTEBF
Frac. coverage (% ) 3 30.045.050.040.030.075.070.015.080
Root depth (m)1.01.21.25.01.20.25.01.25.0
Roughness length (m)1.50.080.083.50.080.053.00.083.0
Measurement height (m)11.76.023.02.052.052.0
Soil texturesandy loamsandy loamsilty loamclay loamloamsandy clay
sand (%)745548303548
clay (%)152510301843
orgm (%) 4 10001010
1 References for the parameter values: AU-ASM: Cleverly et al. [62]; US-Wkg: Scott et al. [82]; US-Ton: Baldocchi et al. [51]; IT-Noe: Marras et al. [52]; MY-PSO: Kosugi et al. [54] and Yamashita et al. [83]; GF-Guy: Bonal et al. [55]. 2 Vegetation type for SVS and CLASS: ENF, evergreen needleleaf forest; LG, long-grass; EBF, evergreen broadleaf forest; EBS, evergreen broadleaf shrub; TEBF, tropical evergreen broadleaf forest. 3 Note: The remainder non-vegetative percentage corresponds to bare ground. 4 orgm, organic matter (only used in CLASS).
Table 4. Scores for the latent heat flux ( L E ), sensible heat flux (H), net radiation ( R n ) and soil heat flux (G) for a 30-min time step 1 . The bold numbers correspond to the best score between both models.
Site and VariableRMSE 1 (W m - 2 )Pbias (%)RNSE
SitefluxSVSCLASSSVSCLASSSVSCLASSSVSCLASS
AU-ASM L E 42.043.13.77.10.770.790.430.40
H62.174.217.6-29.80.950.960.890.84
R n 44.348.512.6-18.20.990.990.970.97
G38.734.9−157.676.90.820.920.660.73
US-Wkg L E 71.165.7−10.32.60.770.770.280.39
H61.552.45.3−28.50.890.910.720.79
R n 39.546.38.3−11.80.990.990.980.97
G56.738.2−204.224.00.750.890.520.78
Us-Ton L E 40.646.64.516.70.830.800.680.58
H66.379.125.6−56.50.880.870.740.63
R n 30.037.48.8−20.80.990.990.980.97
G55.668.030.755.00.650.667.01−10.97
IT-Noe L E 43.245.00.54.80.760.700.170.10
H64.874.915.4−20.00.950.950.870.83
R n 54.847.0−14.914.40.990.990.960.97
G43.342.8−100.732.40.650.820.390.41
MY-PSO L E 50.246.80.84.00.940.950.880.90
H47.958.26.7-24.20.890.890.790.69
R n 38.640.35.7-5.80.990.990.970.97
G31.466.3174.2210.30.550.3562.32-280.81
GF-Guy L E 75.472.1−12.85.60.870.880.740.77
H60.442.986.035.10.850.870.210.60
R n 31.430.96.1−6.60.990.990.980.98
GNA 2 NANANANANANANA
1 RMSE, Root Mean Square Error; Pbias, Percent bias; R, Pearson correlation coefficient; NSE, Nash–Sutcliffe efficiency. 2 NA, Not Available.
Table 5. Scores between observations and simulations (SVS and CLASS) of the surface water content for all the study sites. The scores were obtained for 30-min sampling intervals. The bold numbers correspond to the best score.
SiteRMSE 1 ( m 3 m - 3 )Pbias (%)RNSE
SiteSVSCLASSSVSCLASSSVSCLASSSVSCLASS
AU-ASM0.030.0335.140.20.920.93−0.040.20
US-Wkg0.030.02−14.28.00.870.910.640.78
US-Ton0.070.0922.9−30.40.930.920.730.60
IT-Noe0.080.1023.3−30.20.840.830.11−0.38
MY-PSO0.170.15−39.436.20.860.86−26.5022.71
GF-Guy0.140.1272.157.10.780.76−5.603.74
1 RMSE, Root Mean Square Error; Pbias, Percent bias; R, Pearson correlation coefficient; NSE, Nash–Sutcliffe efficiency.