Abstract
With the ground-level ozone pollution problem increasingly prominent in recent years in China, it is particularly important in basic researches on ozone contamination characteristics. In this study, 13 cities in Beijing-Tianjin-Hebei (BTH) area were examined to determine the characteristics of surface ozone (O3) from 2015 to 2018. Due to the photochemical oxidation of ozone precursors (such as nitrogen oxides and carbon monoxide) along with the presence of sunlight and characteristics of local emission sources, the O3 and oxidant (OX) concentrations showed obvious seasonal variation and daily variation. It implicated that the O3 concentrations reached the maximum during summer. The concentrations of O3 were higher at daytime than those measured at nighttime. The ozone weekend effect was estimated by the difference and deviation, which exhibited that the difference between weekday and weekend were related to the concentrations of ozone precursors and PM, vehicle emissions, and solar radiation. Moreover, the O3 concentrations decreased with the increase of other air pollutants by correlation analysis. The ozone pollution was easily formed at light and moderate polluted periods when compared to other air quality levels.
1. Introduction
Surface ozone (O3) is a secondary air pollutant. There were significant correlations between O3 exposure and risks of respiratory disease and cardiovascular mortality [1,2,3,4,5,6,7,8,9,10]. Many photochemical smog events were observed. Liu et al. [4] estimated that approximately 816 million people were exposed to a high daily maximum 8 h concentration (≥ 100 μg·m−3), accounting for 61% of the total in 2015. The World Health Organization (WHO) reported [11] that the attributable mortality increased by 0.3%–0.5% for each 10 μg·m−3 increasing the 8 h average ozone concentration when it was above the estimated baseline concentration (70 μg·m−3) through time series studies in “Air Quality Criteria for Particulates, Ozone, Nitrogen Dioxide and Sulfur Dioxide”.
Ozone is the primary photochemical pollutant in urban polluted air. It is subjected to solar radiation and its precursors which are nitrogen oxides (NOx), volatile organic compounds (VOCs), and carbon monoxide (CO) [12,13,14,15,16,17,18,19,20,21]. Nitrogen oxide and carbon monoxide are mainly from vehicle exhaust emissions and fossil fuel burning [22,23,24]. Concentration distributions of volatile organic compounds are associated with biomass burning, fossil fuel burning, process emission, solvent source, and traffic emission [25,26,27,28]. Wang et al. [5] found that O3 pollution was affected by the transport or its precursor concentrations, and local sources mainly contributed to the O3 pollution in BTH and Pearl River Delta (PRD). Consequently, the O3 concentrations may be related to distant sources and local emissions, such as vehicle exhaust emissions, fossil fuel burning, etc.
Due to the O3 related to public health and air quality, more and more researchers focused on ozone pollution [14,29,30,31,32,33,34,35]. The O3 concentrations have time series change characteristics. The O3 pollution has obvious seasonal variation characteristics, which mainly occur from May to September [4,14,24]. The O3 concentrations show a significant weekend effect and hourly variation [12,16,18,29,36]. The peak values of ozone concentrations were observed in mid-afternoon in central England [37]. Notario et al. [24] indicated that the O3 concentrations reached a higher maximum during summer which were 151 μg·m−3 at Aljarafe and 111 μg·m−3 at Torneo in Seville metropolitan area, and had the highest values in the afternoon hours. De Miranda [38] indicated that the ozone concentration was much higher in July (42.65 μg·m−3) and August (67.82 μg·m−3) in Brazil. By contrast, the annual mean observed O3 concentrations was 96.74 μg·m−3 in 32 provincial capital cities in China [4]. Ou et al. [39] also found that the annual average ground-level ozone concentration increased to 58 μg·m−3 in 2014 in PRD. The higher O3 concentrations on weekends were measured in the BTH metropolitan area from 2009 to 2011 [40]. Furthermore, there were many researches into the relationship of O3 and other air pollutants in recent years. Paoletti et al. [41] and Lefohn et al. [42] demonstrated the ozone levels had a positive trend with the reduction s in NOx pollution in some cities of Europe and United States, such as London, Paris, Berlin, New Mexico, California, Las Vegas, and Texas. Tiwari et al. [16] showed that the O3 concentrations fell rapidly at higher NOx concentrations in India, which was in line with Wang et al. [29] and Li et al. [43]. Previous studies reported that particulate matter had a negative correlation with O3 because aerosols can have an effect radiation through both absorption and scattering [44,45,46].
With the continuous development of industrial technologies to control atmospheric nitrogen oxides, sulfur dioxide, and particulate matter, and a series of control measures for these atmospheric pollutants adopted by the governments, the ozone pollution has gradually become prominent [10,37,41]. The Chinese government has taken measures to prevent and control nitrogen oxides, sulfur dioxide, as well as particulate matter in recent years, such as changing coal to natural gas or electricity, banning small industrial boilers and household heating coal-fired stove, promoting electric or hybrid vehicles, and controlling resuspended dust. As a result, the nitrogen oxides, sulfur dioxide, and particulate matter pollutions are effectively controlled, and have a significant decline in the concentrations of these pollutants. However, the ozone pollution is becoming more prominent [4,14]. Thus, it is important for cities to take proactive actions to improve air quality while considering ozone pollution, as ozone pollution tends to increase as other pollutants decrease.
Nowadays, although particulate matter (PM) were primary pollutants in China, photochemical pollution caused by ozone also occurred frequently. As one of national key regions, Beijing-Tianjin-Hebei (BTH) is the center for economic and political development. The haze incidents occurred frequently in the BTH area where the atmospheric pollution was serious [47,48,49,50,51]. According to the China Ministry of Environmental Protection, the O3 concentrations increased from 2015 to 2018 in general. The average daily maximum 8 h of O3 concentrations in BTH area in 2015 and 2018 were 162 and 199 μg·m−3, respectively. The growth rate reached 22.84%. Furthermore, the number of days exceeding the limit of O3 as the main pollutant increased with the vigorous control of particulate matter by the state. The proportion of O3 as the main pollutant was 17.2% in 2015 in BTH, which ranked as the second primary pollutant. In BTH and its surrounding areas, it turned into the primary pollutant with an exceeding rate of 46% in 2018, which increased by 2.67 times, and an exceeding rate of PM2.5 that decreased to 40.7%. Wang et al. [14] pointed that the O3 concentrations exceeded the ambient air quality standard by 100–200% in BTH area. Thus, BTH area was selected as the study area. In addition, it showed a decreasing trend in the number of days exceeding the standard in the whole year. However, the probability of serious and very serious air pollution events decreased, while the probability of light and moderate air pollution events increased. In 2018, the percent of excellent and good air quality level was 50.5% in BTH and its surrounding areas. Secondly, the percent of light and moderate polluted periods was 43.5%. The percent of serious and very serious polluted periods was about 6%. However, more researches were about the characteristics of pollution at heavy pollution or specific periods, few researches were about the characteristics of pollution at other air quality levels.
Therefore, the aim of this study is to analyze the temporal and spatial characteristics of O3 and the properties of O3 at different air quality levels and its corresponding influence factors, and discuss the relationship between the changes in ozone and its precursors.
2. Data and Methods
2.1. Air Quality Data
Real-time hourly ambient air quality index (AQI) and six air pollutants concentrations (PM2.5, PM10, NO2, O3, SO2, and CO) were downloaded from (http://beijingair.sinaapp.com/), which is the National Real-time Publishing Platform for Urban Air Quality of China National Environmental Monitoring Center. Thirteen cities of Beijing-Tianjin-Hebei (BTH) area were chosen as the study area (Figure 1), including Beijing (BJ), Tianjin (TJ), Shijiazhuang (SJZ), Tangshan (TS), Qinhuangdao (QHD), Handan (HD), Baoding (BD), Zhangjiakou (ZJK), Chengde (CD), Langfang (LF), Cangzhou (CZ), Hengshui (HS), and Xingtai (XT). The city-level pollution was expressed as the average pollutant concentrations in all monitoring stations of this city. For the O3 fraction, there are about 404 thousand pieces of hourly ambient AQI and pollutant concentrations data. The missing rates of data are less than 1% among 13 cities in BTH. The average missing rate is 0.41%. These data were carried out by statistical analysis to deal with abnormal values. First of all, the z-score method was used for the series of hourly raw data standardization. If the z-score data met the following three conditions, it would be removed and replaced with the time-interpolated method. The three conditions were as follows: (1) The absolute z-score value is greater than 4 (), (2) the increment between the current time and previous time is greater than 6 (), and (3) the z-score divided by its central moving average of order 3 is greater than 2 (). Further details can be seen in previous studies [12,52].
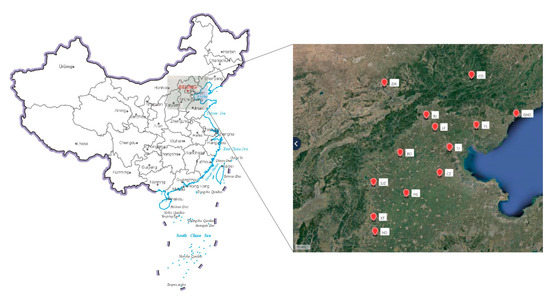
Figure 1.
Study area. The abbreviations of 13 cities in Beijing-Tianjin-Hebei on the right are as follows: Beijing (BJ), Tianjin (TJ), Shijiazhuang (SJZ), Tangshan (TS), Qinhuangdao (QHD), Handan (HD), Baoding (BD), Zhangjiakou (ZJK), Chengde (CD), Langfang (LF), Cangzhou (CZ), Hengshui (HS), and Xingtai (XT).
2.2. Definition of Statistical Index
The ozone weekend effect (OWE) were caused by changes in anthropogenic emissions. In order to describe OWE, the difference (W) and deviation (Dev) between weekend and weekday were used in this study. The weekend is Saturday and Sunday, and the weekday includes Monday, Tuesday, Wednesday, Thursday, and Friday. The deviation equations are as follows [36,40,53].
where is the O3 concentration on weekend; is the O3 concentration on weekday.
3. Results and Discussion
3.1. Ozone Characteristics
The annual concentration of O3 was 62.25 ± 50.83 μg·m−3 in BTH area from 2015–2018. Figure 2 and Figure 3 showed average annual concentrations of O3 in BTH area. It was mainly on the upward trend, especially in QHD, HD, and XT city. The concentrations had increased by over 50% from 2015 to 2018 in the three cities, while it was the smoothest (8.70%) in Beijing city. Furthermore, the O3 concentrations in ZJK and CD were much higher than other cities in BTH area. Compared with other cities in China [12], the average annual O3 concentration in BTH area was lower than Shanghai (72.1 μg·m−3) and Lasa (80.9 μg·m−3), while it was higher in Nanjing (60.2 μg·m−3), Hangzhou (56.1 μg·m−3), Fuzhou (54.9 μg·m−3), Guangzhou (43.4 μg·m−3), Chongqing (36.2 μg·m−3), and Chengdu (52.9 μg·m−3). Compared with foreign cities, the average O3 concentrations were higher than São Paulo (55.24 μg·m−3) in Brazil [38] and lower than Turkey (89.9 μg·m−3) [54].
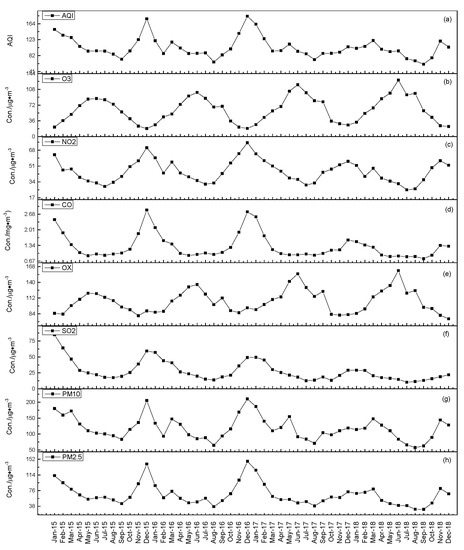
Figure 2.
Average concentrations of air quality index (AQI) and six air pollutants concentrations in BTH area.
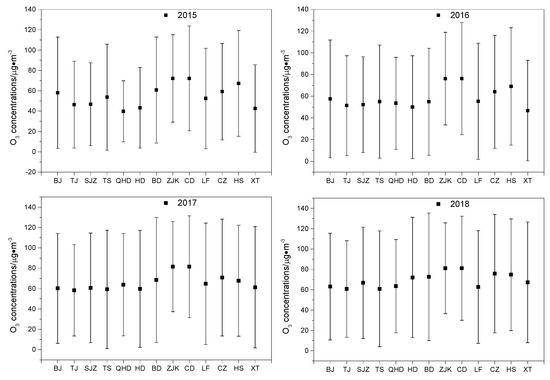
Figure 3.
Inter-annual variability of surface ozone (O3) concentrations in BTH area.
Significant seasonal variation could be seen in Figure 2 and Figure 4a. The trend was a single peak distribution. The average concentrations of O3 reached a peak value (109.27 ± 11.42 μg·m−3) in June in BTH area which met the ambient air quality standards (AAQS, GB 3095–2012) of China. It indicated that the O3 concentrations in summer were much higher than other seasons, which was similar to other previous studies [4,14,38,55]. One of the possible reasons was prone to the occurrence of photochemical reaction with the long sunshine time in summer, which was conducive to the formation of O3 [12,24,56]. Another reason was that NOx was easy to convert to nitrate with the conditions of high temperature and humidity due to the rainfall increasing significantly in summer in BTH area, which should have a decrease in O3 removal by vapor-phase chemistry [57].
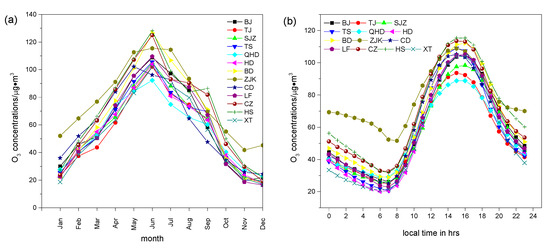
Figure 4.
Average monthly concentrations (a) and diurnal variations (b) of O3 in BTH area.
Diurnal trends of O3 concentrations were basically consistent with each city in BTH area (in Figure 4b). There was trough at 6:00–8:00, while a peak at 15:00–16:00. The peak values ranged from 88.82 to 115.39 μg·m−3, which were similar to the sparely populated region and densely populated region of China [14], and higher than Brazil (55.96 μg·m−3) [58]. The O3 concentrations at daytime (from 7:00 to 20:00) ranged from 1.28 to 2.25 times than at nighttime (from 0:00 to 6:00 and from 21:00 to 23:00). The analysis results agreed with what had been observed in other studies [18,24,29]. The diurnal trends were a possible result of the increase of photochemical reactions of ozone precursors with the increase of solar radiation from sunrise to noon [12,24]. Therefore, there was an increase in O3 concentrations at daytime.
3.2. OX Concentrations
The temporal and spatial changes of OX (OX = NO2 + O3) can be seen in Figure 5. The average OX concentration was 106.15 μg m−3 in this study. By comparison, it was much greater than Canoas (74.23 μg m−3) and Esteio (70.64 μg m−3) in Brazil [58]. The OX concentrations varied in different months and seasons in BTH area. There were obvious peaks of OX concentrations from May to June. Overall, the trends of average OX concentrations were summer (125.25 μg m−3) > spring (118.68 μg m−3) > autumn (92.83 μg m−3) > winter (87.85 μg m−3) in BTH area. Regionally, the average OX concentrations were in order as BD > TS > CZ > XT > HS > LF > SJZ > HD > BJ > ZJK > TJ > QHD > CD. The highest concentration of OX in BD were 1.26 times those monitored at CD. The difference between the two cities was 23.62 μg m−3, which indicated that the atmospheric oxidation was relatively stronger in BD and TS.
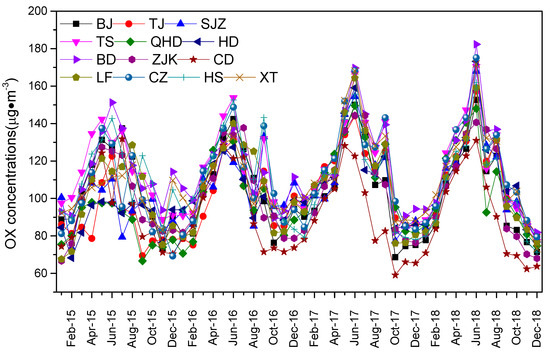
Figure 5.
Oxidant (OX) concentrations in BTH area.
Moreover, the diurnal variations of OX concentrations were distinctive (Figure 6). There was a tendency to ascend from 8:00 and descend at 18:00. The peak values were 118.8–147.93 μg m−3 at 15:00–17:00, which was similar with the results of Tiwari et al. [16] and Notario et al. [24]. The variations of OX concentrations were consistent with O3 concentrations, whereas they were opposite to that of NO2 concentrations (Figure 7a and Table 1). Results of Spearman correlation analysis showed that OX correlated closely with O3 (R2 = 0.895, p < 0.01), while it had a negative with NO2 (R2 = −0.291, p < 0.01) in BTH area. Owing to the enhanced photochemical activity during the afternoon, the O3 and OX maximum was obtained [24]. Thus, the tendency of OX concentrations was more affected by diurnal variations of O3 concentrations, which was associated with the previous study [16].
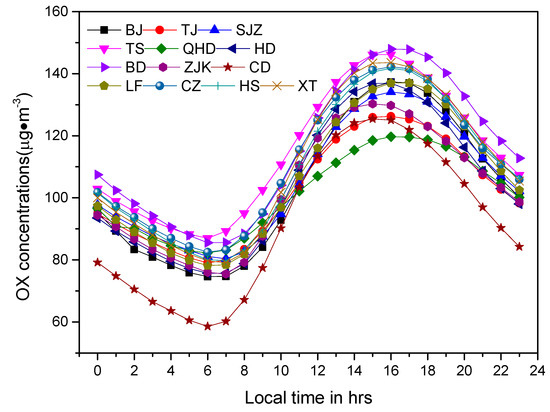
Figure 6.
Average diurnal pattern of OX in BTH area.
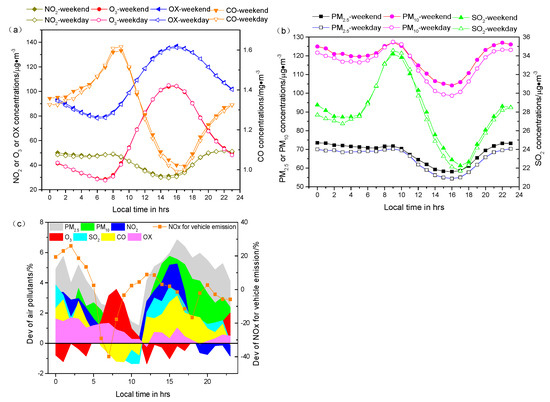
Figure 7.
Diurnal variation of O3 and other pollutant concentrations on weekends and weekdays (a–c) deviations of pollutant concentrations between weekday and weekend (the deviations of NOx for vehicle emissions were calculated based on the data from Jing et al. [59] and Song et al. [53]).

Table 1.
Spearman correlation coefficients between OX and O3 or NO2.
3.3. Ozone Weekend Effect (OWE)
The diurnal variations of O3 and other air pollutant concentrations showed similar trends on the weekend and weekday in Figure 7. Owing to non-normal distribution of O3 concentrations, Friedman was applied in this study, implicating that there were significant differences in the concentrations of O3 between weekend and weekday (p < 0.05). The OWE varied in different regions. The absolute value of the O3 differences (W) and deviations (Dev) ranged from 0.05–1.39 μg m−3 and 0.02%–2.41%, respectively (Table 2). Except in BJ, QHD, BD, ZJK, and CD, the differences (W) and deviations (Dev) of O3 were positive at other observed cities.

Table 2.
Weekend and weekday differences in O3 and other air pollutants in BTH area.
These pollutant concentrations changed dramatically at different times during the day (Figure 7). The average hour concentrations of O3 were correlated with OX, whereas they were contrary to NO2, CO, PM2.5, PM10, and SO2. For O3, the deviations were much higher at 7:00–9:00, exhibiting that the O3 concentrations were higher on weekend than weekday, whereas the deviations of NO2, SO2, and CO were relatively low. As previous studies mentioned, O3 concentrations were linked to a lot of ozone precursor emissions, solar radiation, and vertical transport in the boundary layer [1,12,40,55,60]. Jing et al. [59] found that the traffic volume reached an early peak at 7:00–9:00 on the weekday, while on weekend the peak appeared 2 h later. Additionally, the emissions factors of NOx and CO for the vehicle exhaust had two emission peaks at 8:00–9:00 and 17:00–18:00 which were close to traffic volume; and the emissions factors had an obvious difference between weekend and weekday. The deviation of NOx for vehicle emissions and O3 showed similar trends during the day, as illustrated in Figure 7. In addition, the UV radiation also had a difference on weekend and weekday. Wang et al. [40] indicated that the UV radiation was higher on weekend (12.7 W·m−2) than on weekday (12.3 W·m−2). Therefore, the higher concentration in the morning was most likely due to the reduction of vehicle emissions on weekend. The deviations of O3 were much less than zero at 12:00–17:00, exhibiting that the O3 concentrations were relatively low on weekend, while deviations of PM2.5, PM10, NO2, SO2, and CO reached the peak values. At 0:00–4:00, the deviations of O3 were also below zero, while the deviations of other air pollutants were greater than zero. Moreover, the deviations of OX were much higher than other times. In the whole, the deviations of OX were almost greater than zero, indicating that the photochemical oxidant were higher on weekend. As can be seen from the above, the concentrations of ozone precursors (such as NO2 and CO) were higher on weekend than on weekday at 12:00–17:00 and 0:00–4:00, which resulted in ozone depletion. Moreover, PM would reduce the photolysis frequencies of J(O3) and J(NO2) [61], which showed a reason for lower surface ozone concentrations. PM2.5 and PM10 concentrations were higher on weekend in generally (Table 2). The differences (W) were 2.81 and 3.11 μg·m−3 for PM2.5 and PM10, respectively. The higher PM concentrations on weekend may be as a result of an increase emission or meteorological condition. This pattern may be responsible for the lower concentrations of ozone on weekend.
3.4. Relationships between Ozone and Other Air Pollutants
From the perspective of region, the correlation analysis results were basically the same between the ozone and other air pollutants. The correlation analysis results were slightly different in BJ and ZJK. There was a significant negative correlation among ozone, NO2, and CO in the current complex pollution in BJ. However, the O3 concentrations had a positive correlation with PM10, NO2, and CO in ZJK. It may be due to the higher PM10 concentrations and local meteorological conditions. If the primary components in ambient air are greatly affected by regional transport of air mass, it may undergo photochemical reactions which could accelerate the O3 production process at this location [45].
As a whole, the O3 concentrations had a significant negative correlation with particulate matter, NO2, SO2, and CO concentrations (Figure 8 and Table 3) in BTH area. Similar results were obtained by He et al. [12] and Wang et al. [29] that demonstrated the O3 was significantly negatively correlated with its precursors, such as NO2 and CO. Furthermore, aerosols reduced the actinic flux photolysis rates under absorption and scattering, so the surface ozone production decreased [38,44,61]. Nishanth et al. [45] elucidated that it was a negative correlation between daily values of PM10 and O3 concentration. Li et al. [62] demonstrated that O3 concentration was strongly inhibited under the condition of high PM2.5 concentration using the daily PM2.5 and O3 monitoring data.
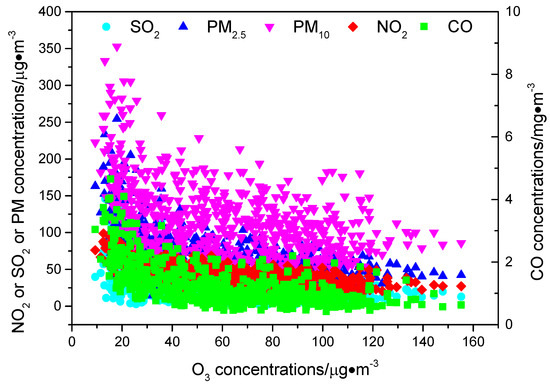
Figure 8.
Scatter plot of O3 and other air pollutants.

Table 3.
Spearman correlation coefficients between O3 and other air pollutants.
3.5. Ozone Pollution Characteristics at Different Air Quality Levels
Based on the Technical Regulation on Ambient Air Quality Index (on trial) (HJ 633-2012) of China, the ambient air quality can be divided into six levels: (1) Excellent (AQI: 0–50), (2) good (AQI: 51 to 100), (3) light polluted periods (AQI: 101–150), (4) moderate polluted periods (AQI: 151–200), (5) severe polluted periods (AQI:201–300), and (6) very severe polluted periods (AQI: >300). According to the O3 concentrations distribution (Figure 9), over 90% of monitoring data were up to the concentration limits of AAQS, respectively. However, the differences of O3 concentrations were obvious at different air quality levels (Figure 10 and Figure 11). The O3 exceeding standard rate were mainly in the order as light polluted periods (16.27%) > moderate polluted periods (12.38%) > good (3.76%) > severe polluted periods (2.50%) > very severe polluted periods (0.83%). In addition, it was zero at excellent. Furthermore, the maximum of O3 exceeding standard rate was 32.47% at ZJK at light polluted periods. The average rates were less than 6% at good periods and severely polluted periods. Overall, the O3 exceeding standard rates were much higher at light and moderate polluted periods than at other air quality levels.
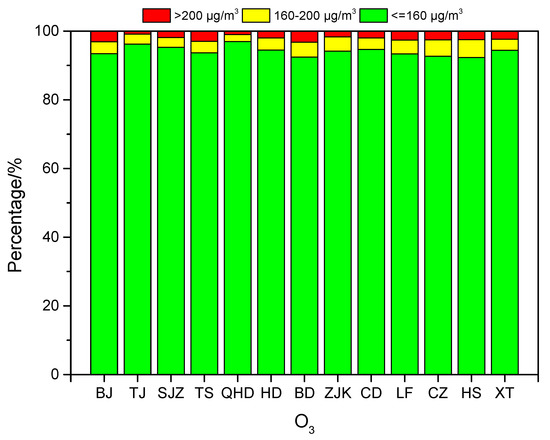
Figure 9.
Percentages of O3 in the range of different concentrations.
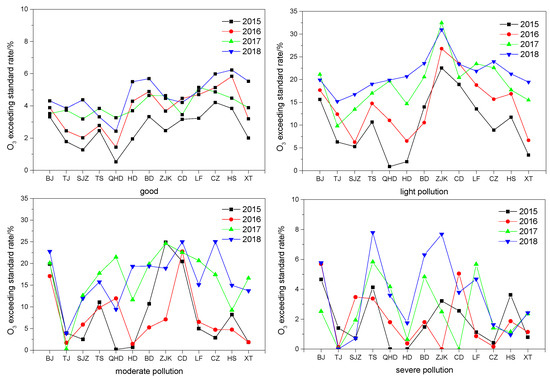
Figure 10.
Annual exceeding standard rate of O3 concentrations at different air quality levels.
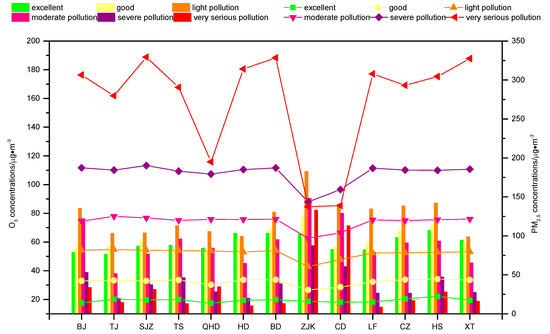
Figure 11.
The O3 (histogram) and PM2.5 concentrations (line chart) at different air quality levels.
Except ZJK and CD, the O3 concentrations were mainly up to the highest at light polluted periods in BTH area, which ranged from 63.67 to 87.21 μg·m−3. Secondly, the O3 concentrations were much higher at excellent, good, and moderate polluted periods, ranging from 38.13 to 76.29 μg·m−3. While the O3 concentrations were much lower at severe and very severe polluted periods, which were less than 40 μg·m−3. The O3 concentrations had the highest values (109.16 μg·m−3) with the highest O3 exceeding standard rate among thirteen cities at light polluted periods at ZJK, while the PM2.5 concentrations were relatively lower. Moreover, the O3 concentrations at ZJK were basically much higher than other cities at different air quality levels, especially at severe and very severe polluted periods. For CD, the O3 concentrations were much higher at light polluted periods, moderate polluted periods, and very severe polluted periods. Additionally, the PM2.5 concentrations were relatively lower. It was more likely to form an ozone pollution in ZJK and CD, especially at light polluted periods.
Although PM was the primary pollutant in severe and very severe pollution events in BTH area, there is a shift tendency from PM to O3 pollution, especially at light and moderate pollution events. Therefore, the direction and measures for air pollution control should be adjusted accordingly.
4. Conclusions
This research mainly discussed the characteristics of O3 in 13 cities of BTH area from 2015 to 2018. For O3, it varied throughout temporal and spatial. The O3 concentrations were much higher in summer due to increased photochemistry reaction and low ozone destruction rate. The diurnal trends were unimodal distribution with maximum values at 15:00–16:00. There was a lower O3 concentration on weekday and a higher concentration on weekend in BTH area. In addition, the difference (W) and deviation (Dev) were applied to elucidate the ozone weekend effect. These results indicated clearly that vehicle emissions, PM concentrations, and solar radiation also contributed to the difference between weekday and weekend except the ozone precursors. Geographically, O3 concentrations showed similar seasonal and diurnal variation trends. However, it was much higher in ZJK and CD.
In addition, the OX concentration also showed seasonal and diurnal variations, which agreed with the trends of O3 concentrations. Additionally, a positive correlation was found between OX and O3 by Spearman analysis, whereas it was negative between OX and NO2. The O3 concentrations had a significant negative correlation with other air pollutants. The aerosol effect was found to decrease O3 concentration because aerosol effects reduced J (NO2) photolysis frequencies. The O3 exceeding standard rate and O3 concentration generally reached the highest values at light polluted periods. Based on the region distribution, the values were much higher at light polluted periods at ZJK and CD than other cities along with lower PM2.5 concentrations, which indicated that the formation of ozone pollution more easily happened at the two cities.
Author Contributions
Conceptualization, X.F. and H.X.; methodology, X.F. and C.L.; formal analysis, X.F.; writing-original draft preparation, X.F.; writing-review and editing, H.S., Y.X., Y.L., Z.Z. and F.W.; visualization, X.F.; project administration, X.H.; funding acquisition, Y.L. All authors have read and agreed to the published version of the manuscript.
Funding
This research was funded by the Jiangxi Provincial Department of Science and Technology (No. 20161ACG70011). And the APC was funded by the Jiangxi Provincial Department of Science and Technology (No. 20161ACG70011).
Acknowledgments
This work was based on data which can be accessed via (http://beijingair.sinaapp.com/). The data is monitored by the National Real-time Publishing Platform for Urban Air Quality of China National Environmental Monitoring Center.
Conflicts of Interest
The authors declare no conflict of interest.
References
- Lu, X.; Hong, J.; Zhang, L.; Cooper, O.R.; Schultz, M.G.; Xu, X.; Wang, T.; Gao, M.; Zhao, Y.; Zhang, Y. Severe surface ozone pollution in China: A global perspective. Environ. Sci. Technol. Lett. 2018, 5, 487–494. [Google Scholar] [CrossRef]
- Turner, M.C.; Jerrett, M.; Pope, C.A., 3rd; Krewski, D.; Gapstur, S.M.; Diver, W.R.; Beckerman, B.S.; Marshall, J.D.; Su, J.; Crouse, D.L.; et al. Long-Term Ozone Exposure and Mortality in a Large Prospective Study. Am. J. Respir. Crit. Care Med. 2016, 193, 1134–1142. [Google Scholar] [CrossRef] [PubMed]
- Fleming, Z.L.; Doherty, R.M.; Von Schneidemesser, E.; Malley, C.S.; Cooper, O.R.; Pinto, J.P.; Colette, A.; Xu, X.; Simpson, D.; Schultz, M.G.; et al. Tropospheric Ozone Assessment Report: Present-day ozone distribution and trends relevant to human health. Elem. Sci. Anth. 2018, 6, 12. [Google Scholar] [CrossRef]
- Liu, H.; Liu, S.; Xue, B.; Lv, Z.; Meng, Z.; Yang, X.; Xue, T. Ground-level ozone pollution and its health impacts in China. Atmos. Environ. 2018, 173, 223–230. [Google Scholar] [CrossRef]
- Wang, M.Y.; Yim, S.H.L.; Wong, D.C.; Ho, K.F. Source contributions of surface ozone in China using an adjoint sensitivity analysis. Sci. Total Environ. 2019, 662, 385–392. [Google Scholar] [CrossRef]
- Brook, R.D.; Brook, J.R.; Urch, B.; Vincent, R.; Rajagopalan, S.; Silverman, F. Inhalation of fine particulate air pollution and ozone causes acute arterial vasoconstriction in healthy adults. Acc Curr. J. Rev. 2002, 11, 32. [Google Scholar] [CrossRef]
- Jerrett, M.; Burnett, R.T.; Pope, C.A.; Ito, K.; Thurston, G.; Krewski, D.; Shi, Y.; Calle, E.; Thun, M. Long-term ozone exposure and mortality. New Engl. J. Med. 2009, 360, 1085–1095. [Google Scholar] [CrossRef]
- Michelle, L.B.; Aidan, M.; Scott, L.Z.; Jonathan, M.S.; Francesca, D. Ozone and short-term mortality in 95 US urban communities, 1987–2000. JAMA. 2004, 292, 2372. [Google Scholar]
- Li, P.; De Marco, A.; Feng, Z.; Anav, A.; Zhou, D.; Paoletti, E. Nationwide ground-level ozone measurements in China suggest serious risks to forests. Environ. Pollut. 2017, 237, 803–813. [Google Scholar] [CrossRef]
- Clare, P.W.; Peter, R.; Jack, S.; Sonya, L.F.; Robyn, S.; Howard, B.; Stephanie, B.; Richard, B.; Scott, D.C.; Lisa, T.C.; et al. A Clean Air Plan for Sydney: An Overview of the Special Issue on Air Quality in New South Wales. Atmosphere. 2019, 10, 774. [Google Scholar]
- WHO. Review of Evidence on Health Aspects of Air Pollution―REVIHAAP Final Technical Report; World Health Organization: Geneva, Switzerland, 2013. [Google Scholar]
- He, J.; Gong, S.; Yu, Y.; Yu, L.; Wu, L.; Mao, H.; Song, C.; Zhao, S.; Liu, H.; Li, X.; et al. Air pollution characteristics and their relation to meteorological conditions during 2014–2015 in major Chinese cities. Environ. Pollut. 2017, 223, 484–496. [Google Scholar] [CrossRef] [PubMed]
- Wang, T.; Xue, L.; Brimblecombe, P.; Lam, Y.F.; Li, L.; Zhang, L. Ozone pollution in China: A review of concentrations, meteorological influences, chemical precursors, and effects. Sci. Total Environ. 2017, 575, 1582–1596. [Google Scholar] [CrossRef] [PubMed]
- Wang, W.N.; Cheng, T.H.; Gu, X.F.; Chen, H.; Guo, H.; Wang, Y.; Bao, W.; Shi, S.; Xu, B.; Zuo, X.; et al. Assessing spatial and temporal patterns of observed ground-level ozone in China. Sci. Rep. 2017, 7, 3651. [Google Scholar] [CrossRef] [PubMed]
- Kota, S.H.; Zhang, H.; Chen, G.; Schade, G.W.; Ying, Q. Evaluation of on-road vehicle CO and NOx national emission inventories using an urban-scale source-oriented air quality model. Atmos. Environ. 2014, 85, 99–108. [Google Scholar] [CrossRef]
- Tiwari, S.; Dahiya, A.; Kumar, N. Investigation into relationships among NO, NO2, NOx, O3, and CO at an urban background site in Delhi, India. Atmos. Res. 2015, 157, 119–126. [Google Scholar] [CrossRef]
- Shao, P.; An, J.; Xin, J.; Wu, F.; Wang, J.; Ji, D.; Wang, Y. Source apportionment of VOCs and the contribution to photochemical ozone formation during summer in the typical industrial area in the Yangtze River Delta, China. Atmos. Res. 2016, 176–177, 64–74. [Google Scholar] [CrossRef]
- Qiao, X.; Tang, Y.; Jaffe, D.; Chen, P.; Xiao, W.; Deng, G. Surface ozone in Jiuzhaigou National Park, eastern rim of the Qinghai-Tibet Plateau, China. J. Mt. Sci. 2012, 9, 687–696. [Google Scholar] [CrossRef]
- Feng, R.; Wang, Q.; Huang, C.C.; Liang, J.; Zheng, H.J. Ethylene, xylene, toluene and hexane are major contributors of atmospheric ozone in Hangzhou, China, prior to the 2022 Asian games. Environ. Chem. Lett 2018, 17, 1151–1160. [Google Scholar] [CrossRef]
- Qiu, W.; Li, S.; Liu, Y.; Lu, K. Petrochemical and Industrial Sources of Volatile Organic Compounds Analyzed via Regional Wind-Driven Network in Shanghai. Atmosphere 2019, 10, 760. [Google Scholar] [CrossRef]
- Alexander, S.Z.; Galina, S.Z.; Vadim, V.T.; Tumen, S.B.; Ayuna, L.D.; Tamara, V.K. Investigation of Transport and Transformation of Tropospheric Ozone in Terrestrial Ecosystems of the Coastal Zone of Lake Baikal. Atmosphere 2019, 10, 739. [Google Scholar]
- Shi, K.; Di, B.; Zhang, K.; Feng, C.; Svirchev, L. Detrended cross-correlation analysis of urban traffic congestion and NO2 concentrations in Chengdu. Transport. Res. D Trans. Environ. 2017, 61, 165–173. [Google Scholar] [CrossRef]
- Van Der, A.R.J.; Eskes, H.J.; Boersma, K.F.; Noije, T.P.C.V.; Roozendael, M.V.; Smedt, I.D.; Peters, D.H.M.U.; Meijer, E.W. Trends, seasonal variability and dominant NOx source derived from a ten year record of NO2 measured from space. J. Geophys. Res. Atmos. 2008, 113, D04302. [Google Scholar] [CrossRef]
- Notario, A.; Bravo, I.; Adame, J.A.; Díaz-de-Mera, Y.; Aranda, A.; Rodríguez, A.; Rodríguez, D. Analysis of NO, NO2, NOx, O3 and oxidant (OX = O3 + NO2) levels measured in a metropolitan area in the southwest of Iberian Peninsula. Atmos. Res. 2012, 104–105, 217–226. [Google Scholar] [CrossRef]
- Brown, S.G.; Frankel, A.; Hafner, H.R. Source apportionment of VOCs in the Los Angeles area using positive matrix factorization. Atmos. Environ. 2007, 41, 227–237. [Google Scholar] [CrossRef]
- Zhang, Q.; Wu, L.; Fang, X.; Liu, M.; Zhang, J.; Shao, M.; Lu, S.; Mao, H. Emission factors of volatile organic compounds (VOCs) based on the detailed vehicle classification in a tunnel study. Sci. Total Environ. 2017, 624, 878–886. [Google Scholar] [CrossRef] [PubMed]
- Hellén, H.; Hakola, H.; Pirjola, L.; Laurila, T.; Pystynen, K.H. Ambient air concentrations, source profiles, and source apportionment of 71 different C2–C10 volatile organic compounds in urban and residential areas of Finland. Environ. Sci. Technol. 2006, 40, 103–108. [Google Scholar] [CrossRef] [PubMed]
- Han, L.; Chen, L.; Li, K.; Bao, Z.; Zhao, Y.; Zhang, X.; Azzi, M.; Cen, K. Source Apportionment of Volatile Organic Compounds (VOCs) during Ozone Polluted Days in Hangzhou, China. Atmosphere 2019, 10, 780. [Google Scholar] [CrossRef]
- Wang, Y.; Ying, Q.; Hu, J.; Zhang, H. Spatial and temporal variations of six criteria air pollutants in 31 provincial capital cities in China during 2013–2014. Environ. Int. 2014, 73, 413–422. [Google Scholar] [CrossRef]
- Streets, D.G.; Fu, J.S.; Jang, C.J.; Hao, J.; He, K.; Tang, X.; Zhang, Y.; Wang, Z.; Li, Z.; Zhang, Q.; et al. Air quality during the 2008 Beijing Olympic Games. Atmos. Environ. 2007, 41, 480–492. [Google Scholar] [CrossRef]
- Gao, W.; Tang, G.; Xin, J.; Wang, L.; Wang, Y. Spatial-temporal variations of ozone during severe photochemical pollution over the Beijing-Tianjin-Hebei region. Res. Environ. Sci. 2016, 29, 654–663. (In Chinese) [Google Scholar]
- Cheng, S.; Lang, J.; Zhou, Y.; Han, L.; Wang, G.; Chen, D. A new monitoring-simulation-source apportionment approach for investigating the vehicular emission contribution to the PM2.5 pollution in Beijing, China. Atmos. Environ. 2013, 79, 308–316. [Google Scholar] [CrossRef]
- Duan, J.; Tan, J.; Yang, L.; Wu, S.; Hao, J. Concentration, sources and ozone formation potential of volatile organic compounds (VOCs) during ozone episode in Beijing. Atmos. Res. 2008, 88, 25–35. [Google Scholar] [CrossRef]
- Cheng, L.; Wang, S.; Gong, Z.; Li, H.; Yang, Q.; Wang, Y. Regionalization based on spatial and seasonal variation in ground-level ozone concentrations across China. J. Environ. Sci. 2018, 67, 179–190. [Google Scholar] [CrossRef]
- Xu, X.; Lin, W.; Xu, W. Surface ozone in China: Present-day distribution and long-term changes. In Proceedings of the AGU Fall Meeting, New Orleans, LA, USA, 11–15 December 2017. [Google Scholar]
- Ho, C.H.; Choi, Y.S.; Hur, S.K. Long-term changes in summer weekend effect over northeastern China and the connection with regional warming. Geophys. Res. Lett. 2009, 36, L15706. [Google Scholar] [CrossRef]
- Derwent, R.G.; Witham, C.S.; Utembe, S.R.; Jenkin, M.E.; Passant, N.R. Ozone in central England: The impact of 20 years of precursor emission controls in Europe. Environ. Sci. Policy. 2010, 13, 195–204. [Google Scholar] [CrossRef]
- de Miranda, R.M.; de Fátima Andrade, M.; Fattori, A.P. Preliminary studies of the effect of aerosols on nitrogen dioxide photolysis rates in the city of São Paulo, Brazil. Atmos. Res. 2005, 75, 135–148. [Google Scholar] [CrossRef]
- Ou, J.; Yuan, Z.; Zheng, J.; Huang, Z.; Shao, M.; Li, Z.; Huang, X.; Guo, H.; Louie, P.K. Ambient ozone control in a photochemically active region: Short-term despiking or long-term attainment? Environ. Sci. Technol. 2016, 50, 5720–5728. [Google Scholar] [CrossRef]
- Wang, Y.H.; Hu, B.; Ji, D.S.; Liu, Z.R.; Tang, G.Q.; Xin, J.Y.; Zhang, H.X.; Song, T.; Wang, L.L.; Gao, W.K.; et al. Ozone weekend effects in the Beijing–Tianjin–Hebei metropolitan area, China. Atmos. Chem. Phys. 2014, 14, 2419–2429. [Google Scholar] [CrossRef]
- Paoletti, E.; De Marco, A.; Beddows, D.C.S.; Harrison, R.M.; Manning, W.J. Ozone levels in european and usa cities are increasing more than at rural sites, while peak values are decreasing. Environ. Pollut. 2014, 192, 295–299. [Google Scholar] [CrossRef]
- Lefohn, A.S.; Malley, C.S.; Simon, H.; Wells, B.; Xu, X.; Zhang, L.; Wang, T. Responses of human health and vegetation exposure metrics to changes in ozone concentration distributions in the european union, united states, and china. Atmos. Environ. 2017, 152, 123–145. [Google Scholar] [CrossRef]
- Li, G.; Zhang, R.; Fan, J.; Tie, X. Impacts of black carbon aerosol on photolysis and ozone. J. Geophys. Res. Atmos. 2005, 110, D23206. [Google Scholar] [CrossRef]
- Bian, H.; Han, S.; Tie, X.; Sun, M.; Liu, A. Evidence of impact of aerosols on surface ozone concentration in Tianjin, China. Atmos. Environ. 2007, 41, 4672–4681. [Google Scholar] [CrossRef]
- Nishanth, T.; Praseed, K.M.; Kumar, M.K.S.; Valsaraj, K.T. Influence of ozone precursors and PM10 on the variation of surface O3 over Kannur, India. Atmos. Res. 2014, 138, 112–124. [Google Scholar] [CrossRef]
- Liao, H.; Adams, P.J.; Chung, S.H.; Seinfeld, J.H. Interactions between tropospheric chemistry and aerosols in a unified general circulation model. J. Geophys. Res. 2003, 108, 4001. [Google Scholar] [CrossRef]
- Tian, Y.Z.; Chen, G.; Wang, H.T.; Huang-Fu, Y.Q.; Shi, G.L.; Han, B.; Feng, Y.C. Source regional contributions to PM2.5 in a megacity in china using an advanced source regional apportionment method. Chemosphere. 2016, 147, 256. [Google Scholar] [CrossRef] [PubMed]
- Tian, Y.Z.; Wang, J.; Peng, X.; Shi, G.L.; Feng, Y.C. Estimation of the direct and indirect impacts of fireworks on the physicochemical characteristics of atmospheric PM10 and PM2.5. Atmos. Chem. Phys. 2014, 14, 9469–9479. [Google Scholar] [CrossRef]
- Jiang, C.; Wang, H.; Zhao, T.; Li, T.; Che, H. Modeling study of PM2.5 pollutant transport across cities in China’s Jing-Jin-Ji region during a severe haze episode in December 2013. Atmos. Chem. Phys. Discuss. 2015, 15, 3745–3776. [Google Scholar] [CrossRef]
- Tan, J.H.; Duan, J.C.; Chai, F.H.; He, K.B.; Hao, J.M. Source apportionment of size segregated fine/ultrafine particle by PMF in Beijing. Atmos. Res. 2014, 139, 90–100. [Google Scholar] [CrossRef]
- Zhao, P.S.; Dong, F.; He, D.; Zhao, X.J.; Zhang, X.L.; Zhang, W.Z.; Yao, Q.; Liu, H.Y. Characteristics of concentrations and chemical compositions for PM2.5 in the region of Beijing, Tianjin, and Hebei, China. Atmos. Chem. Phys. 2013, 13, 4631–4644. [Google Scholar] [CrossRef]
- Song, C.; He, J.; Wu, L.; Jin, T.; Chen, X.; Li, R.; Ren, P.; Zhang, L.; Mao, H. Health burden attributable to ambient PM2.5 in China. Environ. Pollut. 2017, 223, 575–586. [Google Scholar] [CrossRef]
- Song, C.; Li, R.; He, J.; Wu, L.; Mao, H. Analysis of pollution characteristics of NO, NO2 and O3 at urban area of Langfang, Hebei. China Environ. Sci. 2016, 36, 2903–2912. (In Chinese) [Google Scholar]
- Demirel, G.; Özden, Ö.; Döğeroğlu, T.; Gaga, E.O. Personal exposure of primary school children to BETX, NO2 and ozone in Eskişehir, Turkey: Relationship with indoor/outdoor concentrations and risk assessment. Sci. Total Environ. 2014, 473–474, 537–548. [Google Scholar] [CrossRef] [PubMed]
- Li, J.; Wang, Z.; Akimoto, H.; Tang, J.; Uno, I. Modeling of the impacts of China’s anthropogenic pollutants on the surface ozone summer maximum on the northern Tibetan Plateau. Geophys. Res. Lett. 2009, 36, L24802. [Google Scholar] [CrossRef]
- Zhang, L.; Zhu, B.; Gao, J.; Kang, H.; Yang, P.; Wang, H.; Li, Y.; Shao, P. Modeling study of a typical summer ozone pollution event over Yangtze River Delta. Environ. Sci. 2015, 36, 3981–3988. (in Chinese). [Google Scholar]
- Chang, M.; Liu, X.; Liu, M.; Zhang, Q.; Gao, H. Simulation study of ozone and fine particulate matter in Qingdao and Eastern China in non-heating and heating periods. Period. Ocean. Univ. China 2016, 46, 14–25. [Google Scholar]
- Agudelo–Castaneda, D.M.; Teixeira, C.E.; Pereira, N.F. Time–series analysis of surface ozone and nitrogen oxides concentrations in an urban area at Brazil. Atmos. Pollut. Res. 2014, 5, 411–420. [Google Scholar] [CrossRef]
- Jing, B.; Wu, L.; Mao, H.; Gong, S.; He, J.; Zou, C.; Song, G.; Li, X.; Wu, Z. Development of a vehicle emission inventory with high temporal–spatial resolution based on NRT traffic data and its impact on air pollution in Beijing―Part 1: Development and evaluation of vehicle emission inventory. Atmos. Chem. Phys. 2016, 16, 3161–3170. [Google Scholar] [CrossRef]
- Wang, Y.; Shen, L.; Wu, S.; Mickley, L.; He, J.; Hao, J. Sensitivity of surface ozone over China to 2000–2050 global changes of climate and emissions. Atmos. Environ. 2013, 75, 374–382. [Google Scholar] [CrossRef]
- Flynn, J.; Lefer, B.; Rappenglück, B.; Leuchner, M.; Perna, R.; Dibb, J.; Ziemba, L.; Anderson, C.; Stutz, J.; Brune, W.; et al. Impact of clouds and aerosols on ozone production in southeast Texas. Atmos. Environ. 2010, 44, 4126–4133. [Google Scholar] [CrossRef]
- Li, K.; Jacob, D.J.; Liao, H.; Zhu, J.; Shen, L.; Bates, K.H.; Zhang, Q.; Zhai, S.Z. A two-pollutant strategy for improving ozone and particulate air quality in China. Nature Geosci. 2019, 12, 906–910. [Google Scholar] [CrossRef]
© 2020 by the authors. Licensee MDPI, Basel, Switzerland. This article is an open access article distributed under the terms and conditions of the Creative Commons Attribution (CC BY) license (http://creativecommons.org/licenses/by/4.0/).