Abstract
Environmental epidemiological studies have consistently reported associations between ambient particulate matter (PM) concentrations and everyday mortality/morbidity. Many urban dwellers in Asia live in high-rise apartment buildings; thus, the pollutant concentrations of their immediate outdoor environments are affected by the vertical distribution of pollutants in the atmosphere. The vertical distributions of pollutants provide unique information about their sources and dynamic transport in urban areas, as well as their relationship to people’s exposure at ground level, while the vertical distributions of pollutants have rarely been considered in exposure assessment. In the current study, PM concentrations (with aerodynamic diameters less than 1.0 μm (PM1), 2.5 μm (PM2.5), and 10 μm (PM10)), nanoparticles, black carbon (BC), and particle-bound polycyclic aromatic hydrocarbons (p-PAHs) were measured at different residential heights—6 m, 16 m, and 27 m—at Feng Chia University near a popular night market in Western Taiwan. PM2.5 data were further adopted for health risk estimations. In winter, the magnitude of PM1, PM2.5, and PM10 concentrations were 16 m > 6 m > 27 m; nanoparticle concentrations were 6 m > 27 m > 16 m; and BC and p-PAHs concentrations were 27 m > 16 m > 6 m. In summer, PM1, PM2.5, and PM10 concentrations ranged from 6 m > 16 m > 27 m; nanoparticle concentrations were 6 m > 16 m; and BC and p-PAHs concentrations were from 27 m > 16 m. PM and constituents concentrations during winter were significantly higher in the nighttime than those in daytime, and levels of PM1, PM2.5, and PM10 increased rapidly on 6 m and 16 m heights (but did not increase at 27 m) after 5 pm, whereas these trends became less significant in summer. Health risk analysis for PM2.5 concentrations showed a decrease in lung cancer mortality rate and an extended lifespan for residents living at 27 m. Overall, the current study investigated the vertical profile of particulate matters and analyzed health impacts of PM2.5 at different residential heights in urban area of Taiwan. As the distributions of PM and the constituents varied at different residential heights, exposure and risk assessment of particle concentrations with multiple sizes and various components at broader vertical heights should be further investigated.
1. Introduction
As economic development increases, urban air quality decreases because of the increasing air pollution produced by industries, automobiles, and other human activity-based emission sources. In 2013, outdoor air pollution, especially outdoor particulate matter (PM), was classified as carcinogenic to humans (Group 1) by the International Agency for Research on Cancer (IARC) of the World Health Organization (WHO). Global air pollution reports showed that over 95% of the world’s population lived in areas that exceeded the air quality guideline of PM with aerodynamic diameter less than 2.5 μm (PM2.5; fine particulate matter), and that nearly 60% lived in areas that did not meet even the least stringent air quality target from WHO [1]. Air pollution from PM, ozone (O3), and household burning of solid fuels might have contributed to 6.1 million deaths (11% of the global total) in 2016 [1].
In addition to the attention to the health hazards of particles with different sizes, the composition of PM varies; it is formed through complex chemical reactions by different pollutants emitted from fossil fuel power plants, industries, and automobiles. Black carbon (BC), polycyclic aromatic hydrocarbons (PAHs), and heavy metals are also constituents of PM, which are mainly derived from traffic emissions, activities of combustion, and anthropogenic as well as biomass burning emissions [2,3,4].
The health effects of exposure to PM have been getting great attention. A time-series analysis showed that, in China, a 10 μg/m3 increase in PM2.5 levels was associated with 0.65%, 0.63%, and 1.38% increases in non-accidental mortality, respiratory mortality, and circulatory mortality, respectively, during 2005–2009 [5]. In Spain, the relative risks (RR) for an increase level of 25 μg/m3 in PM2.5 were 1.057 for all-cause mortality, 1.088 for circulatory mortality, and 1.122 for respiratory mortality [6]. Pope et al. reported that a 10 μg/m3 elevation of fine particulate in the United States was associated with approximately 4%, 6%, and 8% increases in the risk of all-cause, cardiopulmonary, and lung cancer mortality, respectively [7]. The toxicity potential of PM on respiratory health are in fact based on their residence time in the different regions of the airway [8]. Pan et al. reported that long-term exposure to PM2.5 and low-grade inflammation might lead to hepatic tumorigenesis and increase the risk of liver cancer [9]. Moreover, exposure to PAHs would cause different impacts on human health [10]. With long-term exposure, effects included skin, lung, bladder and gastrointestinal cancers, DNA damage, cataracts, kidney and liver damage, gene mutation cell damaging, and cardiopulmonary mortality [11,12,13,14,15,16,17,18,19]. As a result, the risks of exposure to PM2.5 and PAHs should be of great concern.
On the other hand, the vertical comparison of PM2.5 and PM10 (particulate matter with an aerodynamic diameter less than 10 μm) concentrations were evaluated in previously reports [20,21,22]. Kalaiarasan et al. measured PM2.5 levels at various heights of two typical types of buildings, point block configuration and slab block configuration, near a busy expressway in Singapore. For both buildings, the highest concentration of PM2.5 was at the mid-floors, and the lowest was at upper floors, which might be due to interception by tree leaves or the mixing effect by the inflow of clean air from higher altitude. For point block and slab block, the health risk values at the mid and lower floors suggested that occupants living in these floors experienced 1.62–1.81 and 1.28–1.34 times of risk, respectively, compared to those living at the upper floors [21]. The vertical comparison of PM2.5 and PM10 concentrations was also studied in Osaka, Japan [22]. The concentrations of samples collected at 200 m were lower than those collected on the ground. In summer, the high concentration on the ground might be because particles absorbed water when relative humidity (RH) was high. In winter, the accumulation of particles might be due to stable meteorological conditions and vehicle exhaust on the ground. Despite these findings, the previous studies were conducted in relatively high-rise buildings, while most people in Taiwan lived at the height of life circumstances relatively lower than the heights in the aforementioned studies. In fact, more than 52% of the buildings in Taiwan were less than 30 m height [23]. Therefore, it can be suspected that PM concentrations at different vertical heights might vary in different seasons. The objectives of this study are to investigate the particle distribution at different residential heights in different seasons, where the results will be further taken into consideration for health risk assessment at different residential heights.
2. Materials and Methods
2.1. Field Measurement
Taichung is a special municipality located in central-western Taiwan. Metropolitan Taichung covers an area of 2215 km2 and hosts a population of over 2.8 million people, making it the second largest city on the island [24]. In recent years, the city ran into further climatic anomalies, reducing the number of rainy days and increasing temperatures, providing the appropriate conditions for a chain reaction to occur that contributes to a worsening of the air quality [25]. The field sampling (including instrument collocation) was carried out during the summer and winter of 2014. Outdoor air pollutant concentrations were measured on different floors in a building at Feng Chia University in Taichung. There was a big night market about 100 m west of the building. Vertical sampling at different residential heights was done simultaneously for 10 days from 23 February to 6 March, as well as from 18 to 28 July 2014. Sampling was conducted from the balconies of 2nd floor (6 m), the 5th floor (16 m), and the 8th floor (27 m). Before the vertical sampling began, three sets of identical instruments were set up on the top floor for simultaneous measurement in order to compare and adjust the data collected from the three identical instruments. Instrument collocation was performed for three days in winter and in summer separately.
PM concentrations with aerodynamic diameters less than 1.0 μm (PM1), PM2.5, and PM10 were measured using three portable aerosol monitors (model 1.108/1.109, Grimm, Ainring, Germany). Nanoparticle (20–700 nm) levels were measured using three miniature diffusion size classifiers (DiSCmini, Matter Aerosol, Wohlen, Switzerland). BC and particle-bound PAHs (p-PAHs) were measured using three micro-aethalometers (model AE51, AethLabs, San Francisco, CA, USA) and three photoelectric aerosol sensors (PAS 2200 CE and PAS 2000 CE, EcoChem Analytics, League City, TX, USA). Temperature and RH were also collected simultaneously using three data loggers (HOBO UX100-011A, Onset, MA, USA). All of the monitoring data were set to output data in 1 min.
2.2. Quality Control
Quality control procedures were performed each sampling day. In addition to the routine calibration and maintenance of the instruments used in this study, the research staff performed essential calibration for the instrument readings and flows before and after each monitoring. To ensure the quality of data processing, Microsoft Excel (2010) was used for data management, descriptive analysis, and to calculate health risks of pollutant exposures. Zero, negative, missing, and unreasonably high and low values were excluded, as were continuous values in a range more than ten folds.
2.3. Data Analysis
Simple linear regression analysis was performed to compare concentrations obtained in field collocation and vertical sampling. For a given pollutant, the coefficient of determination (R2) of the identical instruments was determined. The ratio of means between collocating instruments was applied as an adjustment factor to correct for the measured levels. After corrections were made for the testing methods, intraclass correlation coefficients (ICC) were computed to verify the agreement between the collocating measurements. The value of ICC > 0.75 indicates excellent reliability, 0.4 < ICC < 0.75 indicates good reliability, and ICC < 0.4 indicates poor reliability for the comparison among different instruments [26]. Additionally, paired t-tests were also used to investigate the concentration differences between different residential heights during different seasons. Statistical analyses were performed using JMP (version 5.0) and STATISTICA (version 7.1) software.
In the current study, the elevated risks suggested by previous studies were adopted for estimating the excess risk of lung cancer mortality rate for residents living on different floors with different PM2.5 exposures [7,27,28,29,30,31]. The PM2.5 levels measured at the height of 6 m were set as the baseline to calculate the deviation of the mortality rate of lung cancer caused by PM2.5 exposures at different residential heights. Excess lung cancer mortality rate and life expectancy change were calculated by Equations (1) and (2), respectively:
where the vertical deviation of PM2.5 concentrations (16 m, 27 m) was compared with the levels measured at 6 m, the elevating lung cancer risk of 12% per 10 µg/m3 increase of PM2.5 was adopted from Huang et al., and the lung cancer mortality rate in Taiwan was 60.59 per 100,000 in 2017 [30,32].
where the vertical deviation of PM2.5 concentrations (16 m, 27 m) was compared with the levels measured at 6 m, the loss of 0.61 life year per 10 µg/m3 increase of PM2.5 was adopted from Pope et al. [7,33].
Excess lung cancer mortality rate = Vertical deviation of PM2.5 concentration * 0.1 * Elevated lung cancer risk per 10 µg/m3 increase of PM2.5 * Lung cancer mortality rate,
Life expectancy change = Vertical deviation of PM2.5 concentration * 0.1 * Loss of life year per 10 µg/m3 increase of PM2.5 * 365,
As the excess mortality rate of lung cancer was estimated mainly by two factors—vertical PM2.5 concentrations and the RRs of lung cancer mortality in different studies—the software @Risk (version 7.6) was applied for evaluating the sensitivity of the risk estimation. PM2.5 concentrations in different seasons (winter and summer) were combined together for annual analysis at different residential heights, and the extreme high or low values out of 1% (±2.576 standard deviation) were excluded for truncating the reliable results of PM data [34].
3. Results and Discussion
3.1. Collocation Comparison
Results of the collocation comparison were summarized in Table 1. For PM1, PM2.5, and PM10 measurements, R-squared and ICC values were all greater than 0.9 and 0.85, respectively, indicating the measurement agreement between the identical sampling instruments were in high reliability. The concentrations of nanoparticle, temperature, and RH also showed high ICCs in both winter and summer. Meanwhile, for BC, one of the instruments presented poor reliability in summer (ICC less than 0.4 for serial No. 580), as well as one p-PAHs instrument showed a poor ICC (serial No. 210 in summer), as a result, the corresponding sampling data were excluded from further analyses.

Table 1.
Results of collocation comparison.
3.2. PM Concentrations at Different Residential Heights in Different Seasons
The vertical concentrations of PM pollutants at different residential heights in winter and summer are shown in Table 2 and Figure A1 in Appendix A. According to the Taiwan Environmental Protection Administration’s (Taiwan EPA) Ambient Air Quality Standards, the 24 h standard value of PM10 is 100 μg/m3 and the 24 h standard value of PM2.5 is 35 μg/m3 [35]. Given this, the average concentrations of PM2.5 at 6 m and 16 m in the winter exceeded the standard value in the current study for administrative purposes. Current results of PM2.5 concentrations were comparable to the findings of previous research in Taichung [36]. Comparing the monitoring data in different seasons, the levels of PM1, PM2.5, PM10, nanoparticle, and BC were significantly higher in winter than those in summer. In winter, the vertical concentrations of PM1, PM2.5 and PM10 were 16 m > 6 m> 27 m, and nanoparticle concentrations were 6 m > 27 m > 16 m. For BC and p-PAHs concentrations, both were in range as 27 m > 16 m > 6 m, results of which were consistent as the finding in Beijing, China where the concentrations of BC significantly correlated with those of PAHs [37]. In summer, the concentrations of PM1, PM2.5, and PM10 were in range as 6 m > 16 m > 27 m, where the result of a decreasing trend with increasing height was consistent with the concentration distribution of PM2.5 and its chemical compositions in Tianjin, China [38]. Finally, BC and p-PAHs concentrations ranged from 27 m > 16 m.
Table 2.
Vertical PM concentrations at different residential heights in both seasons.
The proportion of PM1 (or PM2.5) in PM10 at different heights were presented in Figure 1. The similar ranges were found in both seasons for PM1/PM10 (between 45% to 65%) and PM2.5/PM10 (66% to 77%), the results of which were comparable with the daytime averaged PM1 and PM2.5 contributing 51–60% and 66–67%, respectively, of PM10 at the roadside in Macao, China [39]. Furthermore, current results indicated that the proportions of different size PM did not vary so much at different residential heights, therefore the components of PM should play a critical role for health risk estimation.
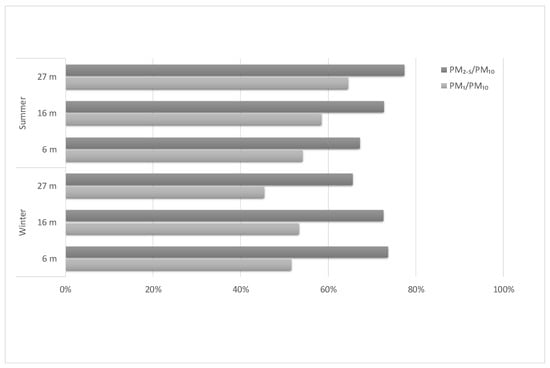
Figure 1.
The proportion of PM (PM1 or PM2.5) in PM10 at different residential heights in both seasons.
3.3. Temporal Patterns of PM Concentrations at Different Residential Heights
In order to investigate the temporal variation of PM concentrations, the hourly averaged concentrations within a day in winter and summer were calculated (as shown in Figure 2 and Figure 3, respectively). In winter, the levels of PM1, PM2.5, and PM10 at 27 m height were apparently lower than those of the other floors, and the PM2.5 concentrations in the nighttime were higher than those measured at daytime. Furthermore, after 5 pm, levels of PM1, PM2.5, and PM10 increased rapidly on 6 m and 16 m heights, but did not increase at 27 m. These results indicated that people living above 27 m might be exposed to less PM from local emission sources. Likewise, the concentrations of nanoparticle presented a similar temporal distribution at different heights, suggesting a well-mixed finer particle size distribution in vertical diffusion [40,41]. For p-PAHs, the concentrations rose at 8 am, but did not considerably increase after 5 pm, results of which showed that emissions from vehicles might be the major source for p-PAHs while the night market activities might be minor in this study. Quang et al. have reported that particle number (PN) and PM2.5 concentration was influenced by vehicle emissions and new particle formation around the building [42]. Concentrations of PN in size range of < 30 nm and total PN increased (7–65% and 5–46%, respectively), while PM2.5 concentration decreased (36–52%) with height.
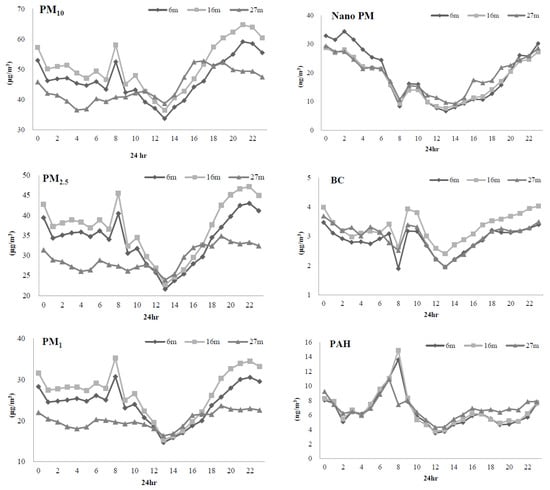
Figure 2.
Hourly averaged concentrations of particulate air pollutants at different residential heights in winter. Vertical sampling at different residential heights was done simultaneously for 10 days from 23 February to 6 March 2014. (Nano PM: nanoparticle; BC: black carbon; PAH: particle-bound polycyclic aromatic hydrocarbons.)
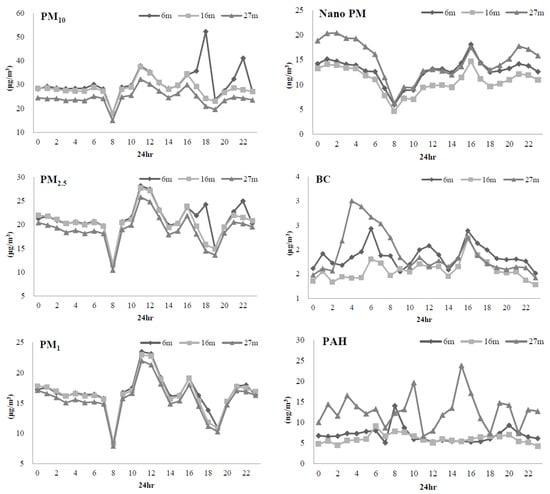
Figure 3.
Hourly averaged concentrations of particulate air pollutants at different residential heights in summer. Vertical sampling at different residential heights was done simultaneously for 10 days from 18 to 28 July 2014. (Nano PM: nanoparticle; BC: black carbon; PAH: particle-bound polycyclic aromatic hydrocarbons.)
In summer, PM2.5 concentrations in the daytime were more variable and higher than those at night, which might be due to intense human activities, like vehicle emission, and suitable meteorological condition in the daytime [38]. The concentrations of PM2.5 and PM10 were relatively high at 6 pm and 10 pm on the 6 m height, while the pattern did not hold at the higher floors, which implied that some coarser PM sources might exist near the ground. In addition, the temporal trend and levels of nanoparticle were similar at different heights, except for those at 27 m in the night. BC and p-PAHs concentrations showed varying fluctuations at different heights, especially for those at 27 m, which in part might be attributed to the semivolatile characteristic of p-PAHs.
Figure 4 presented diurnal averaged concentrations of PM at different heights. In winter, PM1, PM2.5, PM10, nanoparticle, BC, and p-PAHs were significantly higher in the nighttime than those in daytime, whereas these trends became less apparent or even opposite in summer. As wintertime temperature was lower than that in summer, especially at night, the height of atmospheric mixing layer was closer to the ground surface, which resulted in a poor diffusion vertically and accompanied with the accumulation of air pollutants in the night [43,44,45]. In contrast, the temperature variation was less noticeable in summer; hence the diurnal differences of PM pollutants did not show statistical significance. Using an unmanned aerial vehicle, Lu et al. showed that the PM2.5 concentrations at 300–1000 m altitude in morning flights were generally lower than those in afternoon ones, while the variations of PM2.5 in morning flights were much higher than those in afternoon ones [46]. Besides, in a study of 31 Chinese provincial capital cities, the correlation coefficients between PM2.5 and nitrogen dioxide (NO2) (or sulfur dioxide (SO2)) were either high or moderate based on data from 286 monitoring sites [47]. Previous studies have also reported that PM2.5 was associated with PAHs, heavy metals, and other gaseous pollutants, which implied that if the residents were exposed to high levels of PM2.5, they might be exposed to other pollutants, such as NO2 and SO2, at the same time [1,20,48].
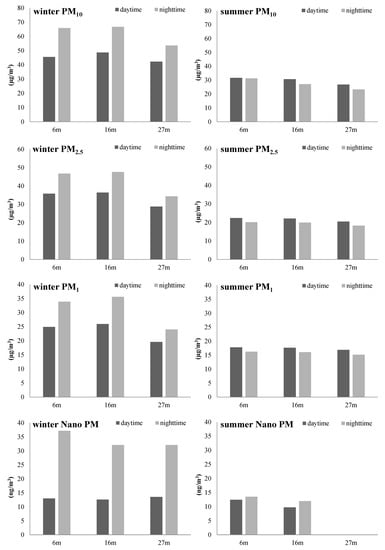
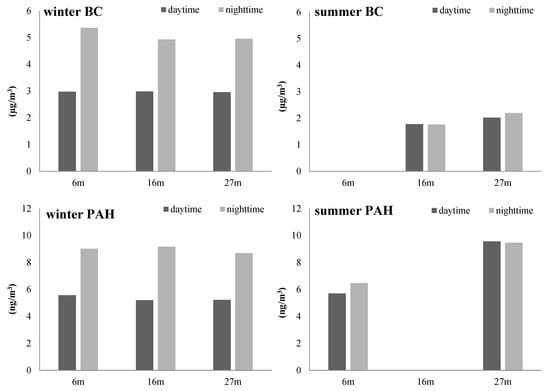
Figure 4.
Diurnal averaged concentrations of particulate air pollutants at different residential heights in winter and summer. (Nano PM: nanoparticle; BC: black carbon; PAH: particle-bound polycyclic aromatic hydrocarbons.)
3.4. Excess Lung Cancer Risk and Loss of Life by PM2.5 Exposure
As of today, the impact of season on the associations between air pollution and mortality were found to vary in different researches [49,50]. We therefore combined all of the winter and summer data for excess risk estimation. In the current study, the elevated risks reported by Pope et al. were first adopted for estimating the excess risk, with the PM2.5 level at 6 m height serving as the baseline to estimate life expectancy changes due to PM2.5 exposure at different heights [7,33]. As shown in Table 3, people living at 16 m height might lose 4.5 days of their life as comparing with the life expectancy of the residents living at 6 m height, and might also increase 0.15 per 100,000 for mortality rate of lung cancer. Additionally, the residents living at 27 m might extend 86.8 days of their life and decrease 2.84 per 100,000 in mortality rate of lung cancer due to less PM2.5 exposures. Even though people in Taiwan have relatively long lifespan, with a life expectancy of 80.39 years of age and the standardized mortality rate of lung cancer 60.59 per 100,000 in 2017, the potential health risk from air pollution still could not be neglected [32,51].
Table 3.
Estimation of PM2.5-associated excess lung cancer mortality rate and life expectancy change.
The relationship between exposure to PM2.5 and lung cancer mortality had been documented worldwide. For qualitative sensitivity analysis in discussing whether the quantitative relative risk or PM2.5 levels is the more important factor in influencing PM2.5 exposure on lung cancer risk at different vertical heights, various associations between PM2.5 and lung cancer mortality were adopted from results of previous studies [7,27,28,29,30,31]. In the United States (U.S.), Pope et al. have shown that the elevation of 10 µg/m3 in PM2.5 concentration was associated with approximately an 8% increase for lung cancer mortality, and a decrease of 10 µg/m3 of fine particulate matter was associated with an estimated increase life expectancy of 0.61 ± 0.20 year [7,33]. Besides, the RRs of lung cancer mortality with a 10 µg/m3 increase in PM2.5 concentrations were 1.20 (95% confidence interval (CI): 0.79, 1.82) in Los Angeles, U.S. and 1.08 (95% CI: 1.07, 1.09) in China [29,52] A meta-analysis of 17 studies showed that the RR of lung cancer per 10 µg/m3 increase in PM2.5 exposure was 1.09 (95% CI: 1.03, 1.15) in Asia; in subgroup analyses for country, the mortality meta-estimate for developed countries was 1.14 (95% CI: 1.06, 1.23), and for developing countries was 1.03 (95% CI: 1.00, 1.07) [30]. Other meta-analysis studies also demonstrated comparable RRs of 1.09 (95% CI: 1.04, 1.14), 1.09 (95% CI: 1.06, 1.11), and 1.14 (95% CI: 1.07, 1.21) for lung cancer associated with PM2.5 [27,28,31]. Lately, the higher risk of lung cancer with increased PM2.5 exposure was found to be more significant for female, and the carcinogenic effects of PM2.5 have urban/rural differences as well as sex differences [53,54].
Results of qualitative sensitivity analysis showed that variations of vertical PM2.5 concentrations were dominant for excess lung cancer risk estimation in different scenarios, which might be attributed to the wide seasonal variation of vertical PM2.5 levels. Variation of PM2.5 at 16 m height as compared to those at 6 m drove the final distribution of excess lung cancer risk at 16 m, accounting for 74.5% of the variance, while the RRs of lung cancer from different studies accounted for 25.5% (Figure 5a). At 27 m height, deviation of PM2.5 concentrations and the lung cancer RRs from different studies explained 88.6% and 12.8% of the variance, respectively (Figure 5b). Findings of the current study demonstrated that the representativeness of PM2.5 monitoring was crucial for estimating the relative risk in alternative heights, and the lung cancer slope factor only had a relatively small influence on the results. Therefore, how to acquire more detailed and representative concentrations at different residential heights warrants further studies.
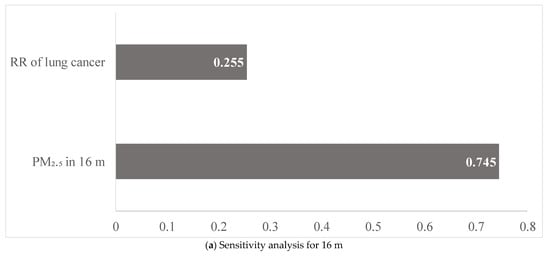
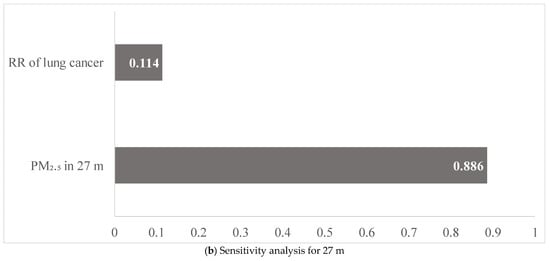
Figure 5.
Sensitivity analysis of the parameters to increasing lung cancer risk in 16 m and 27 m. (RR: relative risk).
As there is no known level of pollution exposure that is harmless, strategies to minimize daily exposure are often impactful across a good range of settings. In Toronto, Canada, Zuraimi and Tan reported that tighter building envelope, use of mechanical ventilation systems, and improved filtration are key factors that reduce PM2.5 exposure and its impacts on population health [55]. In fact, the indoor/outdoor ratios of PM concentration vary considerably due to the different-sized particles with different emission rates, the cracks and leaks in the building envelope, and the air exchange rates [56]. A study in Durbin, Ireland suggested that increasing air exchange between the outdoors and indoors during nighttime periods could flush out air pollutants [57]. Meanwhile, in the current study, as the levels of PM pollutants were higher at night than in the day, the proposal might not be applicable in Taiwan. Some qualified evidence supports individual actions to reduce cardiopulmonary health risks from exposures to ambient air pollutants by staying indoors and limiting physical exertion when air pollutant concentrations exceed levels associated with increased risk of acute and chronic health problems [58,59]. Overall, based on the results of the current study, to minimize PM exposures, personal strategies for people residing in urban areas below 16 m are to keep the windows closed and stay indoors during the traffic rush hour of 8 am as well as the business hour of night market after 5 pm. Besides, keeping away from mobile sources during the traffic jam is advised in avoiding exposure to p-PAHs.
4. Conclusions
The present study analyzed vertical distribution and health impacts of PM in urban residential area of Taiwan. For vertical PM2.5 concentrations, the lowest levels were found at the height of 27 m as compared to those at 6 m and 16 m. In winter, PM and the constituents concentrations were significantly higher in the nighttime than those in daytime, and levels of PM1, PM2.5, and PM10 increased rapidly on 6 m and 16 m heights (but did not increase at 27 m) after 5 pm, whereas these trends became less significant in summer. Health risk analysis for PM2.5 concentrations showed a decrease in lung cancer mortality rate and an extended lifespan for residents living at 27 m. Findings in the current study highlight the needs to integrate more measurement data at broader residential heights, exposure scenarios, and the behaviors of deploying window/door for future investigation.
Author Contributions
Conceptualization, L.-T.C., C.-S.T., and S.-C.C.L.; methodology, H.-L.C. and L.-T.C.; software, H.-L.C. and L.-T.C.; validation, H.-L.C., L.-T.C., and H.-C.C.; formal analysis, H.-L.C., C.-P.L., and L.-T.C.; investigation, C.-S.T. and D.-W.C.; resources, L.-T.C. and S.-C.C.L.; data curation, C.-P.L. and D.-W.C.; writing—original draft preparation, H.-L.C, C.-P.L., and L.-T.C.; writing—review and editing, C.-S.T., S.-C.C.L., and H.-C.C.; supervision, L.-T.C. All authors have read and agreed to the published version of the manuscript.
Funding
This study was funded in part by the Ministry of Science and Technology of Taiwan (MOST 107-2111-M-035-001).
Acknowledgments
We gratefully acknowledge all the field staff in this study.
Conflicts of Interest
The authors declare no conflict of interest. The funders had no role in the design of the study; in the collection, analyses, or interpretation of data; in the writing of the manuscript; or in the decision to publish the results.
Appendix A

Figure A1.
Bar chart of vertical PM mean concentrations at different residential heights in both seasons. Error bars represent the standard deviations of the measurement data. (BC: black carbon; p-PAHs: particle-bound polycyclic aromatic hydrocarbons.)
References
- Wang, J.; Wang, S.; Voorhees, A.S.; Zhao, B.; Jang, C.; Jiang, J.; Fu, J.S.; Ding, D.; Zhu, Y.; Hao, J. Assessment of short-term PM2.5-related mortality due to different emission sources in the Yangtze River Delta, China. Atmos. Environ. 2015, 123, 440–448. [Google Scholar] [CrossRef]
- Bandowe, B.A.M.; Meusel, H.; Huang, R.J.; Ho, K.; Cao, J.; Hoffmann, T.; Wilcke, W. PM2.5-bound oxygenated PAHs, nitro-PAHs and parent-PAHs from the atmosphere of a Chinese megacity: Seasonal variation, sources and cancer risk assessment. Sci. Total Environ. 2014, 473–474, 77–87. [Google Scholar] [CrossRef] [PubMed]
- Zhan, C.; Zhang, J.; Cao, J.; Han, Y.; Wang, P.; Zheng, J.; Yao, R.; Liu, H.; Li, H.; Xiao, W. Characteristics and sources of black carbon in atmospheric dustfall particles from Huangshi, China. Aerosol. Air Qual. Res. 2016, 16, 2096–2106. [Google Scholar]
- Kong, S.; Li, X.; Li, L.; Yin, Y.; Chen, K.; Yuan, L.; Zhang, Y.; Shan, Y.; Ji, Y. Variation of polycyclic aromatic hydrocarbons in atmospheric PM2.5 during winter haze period around 2014 Chinese Spring Festival at Nanjing: Insights of source changes, air mass direction and firework particle injection. Sci. Total Environ. 2015, 520, 59–72. [Google Scholar] [CrossRef]
- Li, P.; Xin, J.; Wang, Y.; Wang, S.; Shang, K.; Liu, Z.; Li, G.; Pan, X.; Wei, L.; Wang, M. Time-series analysis of mortality effects from airborne particulate matter size fractions in Beijing. Atmos. Environ. 2013, 81, 253–262. [Google Scholar] [CrossRef]
- Jiménez, E.; Linares, C.; Rodríguez, L.F.; Bleda, M.J.; Díaz, J. Short-term impact of particulate matter (PM2.5) on daily mortality among the over-75 age group in Madrid (Spain). Sci. Total Environ. 2009, 407, 5486–5492. [Google Scholar] [CrossRef]
- Pope, C.A., III; Burnett, R.T.; Thun, M.J.; Calle, E.E.; Krewski, D.; Ito, K.; Thurston, G.D. Lung cancer, cardiopulmonary mortality, and long-term exposure to fine particulate air pollution. JAMA 2002, 287, 1132–1141. [Google Scholar] [CrossRef]
- Islam, M.S.; Paul, G.; Ong, H.X.; Young, P.M.; Gu, Y.T.; Saha, S.C. A review of respiratory anatomical development, air flow characterization and particle deposition. Int. J. Environ. Res. Public Health 2020, 17, 380. [Google Scholar] [CrossRef]
- Pan, W.C.; Wu, C.D.; Chen, M.J.; Huang, Y.T.; Chen, C.J.; Su, H.J.; Yang, H.I. Fine particle pollution, alanine transaminase, and liver cancer: A Taiwanese prospective cohort study (REVEAL-HBV). J. Natl. Cancer Inst. 2006, 108, djv341. [Google Scholar] [CrossRef]
- Kim, K.H.; Jahan, S.A.; Kabir, E.; Brown, R.J. A review of airborne polycyclic aromatic hydrocarbons (PAHs) and their human health effects. Environ. Int. 2013, 60, 71–80. [Google Scholar] [CrossRef]
- Boffetta, P.; Jourenkova, N.; Gustavsson, P. Cancer risk from occupational and environmental exposure to polycyclic aromatic hydrocarbons. Cancer Causes Control 1997, 8, 444–472. [Google Scholar] [CrossRef] [PubMed]
- Bach, P.B.; Kelley, M.J.; Tate, R.C.; McCrory, D.C. Screening for lung cancer: A review of the current literature. Chest 2003, 123, 72S–82S. [Google Scholar] [CrossRef] [PubMed]
- Olsson, A.C.; Fevotte, J.; Fletcher, T.; Cassidy, A.; Andrea’t Mannetje, A.; Zaridze, D.; Szeszenia-Dabrowska, N.; Rudnai, P.; Lissowska, J.; Fabianova, E.; et al. Occupational exposure to polycyclic aromatic hydrocarbons and lung cancer risk: A multicenter study in Europe. Occup. Environ. Med. 2010, 67, 98–103. [Google Scholar] [CrossRef]
- Diggs, D.L.; Huderson, A.C.; Harris, K.L.; Myers, J.N.; Banks, L.D.; Rekhadevi, P.V.; Niaz, M.S.; Ramesh, A. Polycyclic aromatic hydrocarbons and digestive tract cancers: A perspective. J. Environ. Sci. Health C 2011, 29, 324–357. [Google Scholar] [CrossRef] [PubMed]
- Gunter, M.J.; Divi, R.L.; Kulldorff, M.; Vermeulen, R.; Haverkos, K.J.; Kuo, M.M.; Strickland, P.; Poirier, M.C.; Rothman, N.; Sinha, R. Leukocyte polycyclic aromatic hydrocarbon-DNA adduct formation and colorectal adenoma. Carcinogenesis 2007, 28, 1426–1429. [Google Scholar] [CrossRef]
- John, K.; Ragavan, N.; Pratt, M.M.; Singh, P.B.; Al-Buheissi, S.; Matanhelia, S.S.; Phillips, D.H.; Poirier, M.C.; Martin, F.L. Quantification of phase I/II metabolizing enzyme gene expression and polycyclic aromatic hydrocarbon-DNA adduct levels in human prostate. Prostate 2009, 69, 505–519. [Google Scholar] [CrossRef]
- Garcia-Suastegui, W.A.; Huerta-Chagoya, A.; Carrasco-Colin, K.L.; Pratt, M.M.; John, K.; Petrosyan, P.; Rubio, J.; Poirier, M.C.; Gonsebatt, M.E. Seasonal variations in the levels of PAH-DNA adducts in young adults living in Mexico City. Mutagenesis 2011, 26, 385–391. [Google Scholar] [CrossRef]
- Mumtaz, M.M.; George, J.D.; Gold, K.W.; Cibulas, W.; DeRosa, C.T. ATSDR evaluation of health effects of chemicals. IV. Polycyclic aromatic hydrocarbons (PAHs): Understanding a complex problem. Toxicol. Ind. Health 1996, 12, 742–971. [Google Scholar] [CrossRef]
- Kuo, C.Y.; Hsu, Y.W.; Lee, H.S. Study of human exposure to particulate PAHs using personal air samplers. Arch. Environ. Cont. Toxicol. 2003, 44, 454–459. [Google Scholar] [CrossRef]
- Li, C.; Fu, J.; Sheng, G.; Bi, X.; Hao, Y.; Wang, X.; Mai, B. Vertical distribution of PAHs in the indoor and outdoor PM2.5 in Guangzhou, China. Build. Environ. 2005, 40, 329–341. [Google Scholar] [CrossRef]
- Kalaiarasan, M.; Balasubramanian, R.; Cheong, K.W.D.; Tham, K.W. Traffic-generated airborne particles in naturally ventilated multi-storey residential buildings of Singapore: Vertical distribution and potential health risks. Build. Environ. 2009, 44, 1493–1500. [Google Scholar] [CrossRef]
- Sasaki, K.; Sakamoto, K. Vertical differences in the composition of PM10 and PM2.5 in the urban atmosphere of Osaka, Japan. Atmos. Environ. 2005, 39, 7240–7250. [Google Scholar] [CrossRef]
- The Statistical Yearbook. The Construction and Planning Agency, Ministry of the Interior, Taiwan. Available online: https://www.cpami.gov.tw/public-information/statistics/34346-107.html (accessed on 12 October 2020).
- Population by Sex and 5 Year Age Group for Counties and Cities. Dept. of Household Registration, Ministry of the Interior, Taiwan. Available online: https://www.ris.gov.tw/app/en/3910 (accessed on 12 October 2020).
- Lee, M.; Lin, L.; Chen, C.Y.; Tsao, Y.; Yao, T.H.; Fei, M.H.; Fang, S.H. Forecasting air quality in Taiwan by using machine learning. Sci. Rep. 2020, 10, 4153. [Google Scholar] [CrossRef]
- Fleiss, J.L. The Design and Analysis of Clinical Experiments; Wiley Series in Probability and Mathematical Statistics; Applied Probability and Statistics; Wiley: New York, NY, USA, 1986. [Google Scholar]
- Hamra, G.B.; Guha, N.; Cohen, A.; Laden, F.; Raaschou-Nielsen, O.; Samet, J.M.; Vineis, P.; Forastiere, F.; Saldiva, P.; Yorifuji, T.; et al. Outdoor particulate matter exposure and lung cancer: A systematic review and meta-analysis. Environ. Health Perspect. 2014, 122, 906–911. [Google Scholar] [CrossRef]
- Cui, P.; Huang, Y.; Han, J.; Song, F.; Chen, K. Ambient particulate matter and lung cancer incidence and mortality: A meta-analysis of prospective studies. Eur. J. Public Health 2015, 25, 324–329. [Google Scholar] [CrossRef]
- Guo, Y.; Zeng, H.; Zheng, R.; Li, S.; Pereira, G.; Liu, Q.; Chen, W.; Huxley, R. The burden of lung cancer mortality attributable to fine particles in China. Sci. Total Environ. 2017, 579, 1460–1466. [Google Scholar] [CrossRef] [PubMed]
- Huang, F.F.; Pan, B.; Wu, J.; Chen, E.G.; Chen, L.Y. Relationship between exposure to PM2.5 and lung cancer incidence and mortality: A meta-analysis. Oncotarget 2017, 8, 43322–43331. [Google Scholar] [CrossRef] [PubMed]
- Kim, H.B.; Shim, J.Y.; Park, B.; Lee, Y.J. Long-term exposure to air pollutants and cancer mortality: A meta-analysis of cohort studies. Int. J. Environ. Res. Public Health 2018, 15, 2608. [Google Scholar] [CrossRef] [PubMed]
- Cause of Death Statistics. Department of Statistics, Ministry of Health and Welfare, Taiwan. Available online: https://www.mohw.gov.tw/np-128-2.html (accessed on 15 July 2020).
- Pope, C.A., III; Ezzati, M.; Dockery, D.W. Fine-particulate air pollution and life expectancy in the United States. N. Engl. J. Med. 2009, 360, 376–386. [Google Scholar] [CrossRef]
- Van Zoest, V.M.; Stein, A.; Hoek, G. Outlier detection in urban air quality sensor networks. Water Air Soil Pollut. 2018, 229, 111. [Google Scholar] [CrossRef]
- Ambient Air Quality Standards. Environmental Protection Administration, Taiwan. Available online: https://gazette.nat.gov.tw/egFront/detail.do?metaid=118537&log=detailLog (accessed on 12 October 2020). (In Chinese)
- Chang, L.T.; Chuang, K.J.; Yang, W.T.; Wang, V.S.; Chuang, H.C.; Bao, B.Y.; Liu, C.S.; Chang, T.Y. Short-term exposure to noise, fine particulate matter and nitrogen oxides on ambulatory blood pressure: A repeated-measure study. Environ. Res. 2015, 140, 634–640. [Google Scholar] [CrossRef] [PubMed]
- Liu, S.; Xia, X.; Zhai, Y.; Wang, R.; Liu, T.; Zhang, S. Black carbon (BC) in urban and surrounding rural soils of Beijing, China: Spatial distribution and relationship with polycyclic aromatic hydrocarbons (PAHs). Chemosphere 2011, 82, 223–228. [Google Scholar] [CrossRef]
- Wu, H.; Zhang, Y.F.; Han, S.Q.; Wu, J.H.; Bi, X.H.; Shi, G.L.; Wang, J.; Yao, Q.; Cai, Z.Y.; Liu, J.L.; et al. Vertical characteristics of PM2.5 during the heating season in Tianjin, China. Sci. Total Environ. 2015, 523, 152–160. [Google Scholar] [CrossRef] [PubMed]
- Wu, Y.; Hao, J.; Fu, L.; Wang, Z.; Tang, U. Vertical and horizontal profiles of airborne particulate matter near major roads in Macao, China. Atmos. Environ. 2002, 36, 4907–4918. [Google Scholar] [CrossRef]
- Gan, C.M.; Wu, Y.; Madhavan, B.L.; Gross, B.; Moshary, F. Application of active optical sensors to probe the vertical structure of the urban boundary layer and assess anomalies in air quality model PM2.5 forecasts. Atmos. Environ. 2011, 45, 6613–6621. [Google Scholar] [CrossRef]
- Carnerero, C.; Perez, N.; Reche, C.; Ealo, M.; Titos, G.; Lee, H.K.; Eun, H.R.; Park, Y.H.; Dada, L.; Paasonen, P.; et al. Vertical and horizontal distribution of regional new particle formation events in Madrid. Atmos. Chem. Phys. 2018, 18, 16601–16618. [Google Scholar] [CrossRef]
- Quang, T.N.; He, C.; Morawska, L.; Knibbs, L.D.; Falk, M. Vertical particle concentration profiles around urban office buildings. Atmos. Chem. Phys. 2012, 12, 5017–5030. [Google Scholar] [CrossRef]
- Alföldy, B.; Osán, J.; Tóth, Z.; Török, S.; Harbusch, A.; Jahn, C.; Emeis, S.; Schäfer, K. Aerosol optical depth, aerosol composition and air pollution during summer and winter conditions in Budapest. Sci. Total Environ. 2007, 383, 141–163. [Google Scholar] [CrossRef]
- Schleicher, N.; Stefan, N.; Mathieu, F.; Uwe, K.; Yizhen, C.; Fahe, C.; Shulan, W.; Yang, Y.; Kuang, C. Spatio-temporal variations of black carbon concentrations in the megacity Beijing. Environ. Pollut. 2013, 182, 392–401. [Google Scholar] [CrossRef]
- Zhao, B.; Liou, K.N.; Gu, Y.; Li, Q.; Jiang, J.H.; Su, H.; He, C.L.; Tseng, H.L.R.; Wang, S.X.; Liu, R.; et al. Enhanced PM2.5 pollution in China due to aerosol-cloud interactions. Sci. Rep. 2017, 7, 4453. [Google Scholar] [CrossRef]
- Lu, S.J.; Wang, D.; Li, X.B.; Wang, Z.; Gao, Y.; Peng, Z.R. Three-dimensional distribution of fine particulate matter concentrations and synchronous meteorological data measured by an unmanned aerial vehicle (UAV) in Yangtze River Delta, China. Atmos. Meas. Tech. Discuss. 2016. [Google Scholar] [CrossRef]
- Xie, Y.; Zhao, B.; Zhang, L.; Luo, R. Spatiotemporal variations of PM2.5 and PM10 concentrations between 31 Chinese cities and their relationships with SO2, NO2, CO and O3. Particuology 2015, 20, 141–149. [Google Scholar] [CrossRef]
- Zhai, Y.; Liu, X.; Chen, H.; Xu, B.; Zhu, L.; Li, C.; Zeng, G. Source identification and potential ecological risk assessment of heavy metals in PM2.5 from Changsha. Sci. Total Environ. 2014, 493, 109–115. [Google Scholar] [CrossRef] [PubMed]
- Lu, F.; Zhou, L.; Xu, Y.; Zheng, T.; Guo, Y.; Wellenius, G.A.; Bassig, B.A.; Chen, X.; Wang, H.; Zheng, X. Short-term effects of air pollution on daily mortality and years of life lost in Nanjing, China. Sci. Total Environ. 2015, 536, 123–129. [Google Scholar] [CrossRef] [PubMed]
- Qian, Z.; Lin, H.M.; Stewart, W.F.; Kong, L.; Xu, F.; Zhou, D.; Zhu, Z.; Liang, S.; Chen, W.; Shah, N.; et al. Seasonal pattern of the acute mortality effects of air pollution. J. Air Waste Manag. Assoc. 2010, 60, 481–488. [Google Scholar] [CrossRef] [PubMed]
- Abridged Life Table in Republic of China Area. Department of Statistics, Ministry of the Interior, Taiwan. Available online: https://www.moi.gov.tw/stat/node.aspx?cate_sn=&belong_sn=6028&sn=6073 (accessed on 15 July 2020).
- Jerrett, M.; Burnett, R.T.; Ma, R.; Pope, C.A., III; Krewski, D.; Newbold, K.B.; Thurston, G.; Shi, Y.; Finkelstein, N.; Calle, E.E.; et al. Spatial analysis of air pollution and mortality in Los Angeles. Epidemiology 2005, 16, 727–736. [Google Scholar] [CrossRef] [PubMed]
- Wang, H.; Gao, Z.; Ren, J.; Liu, Y.; Chang, L.T.; Cheung, K.; Feng, Y.; Li, Y. An urban-rural and sex differences in cancer incidence and mortality and the relationship with PM2.5 exposure: An ecological study in the southeastern side of Hu line. Chemosphere 2019, 216, 766–773. [Google Scholar] [CrossRef]
- Turner, M.C.; Krewski, D.; Pope, C.A., III; Chen, Y.; Gapstur, S.M.; Thun, M.J. Long-term ambient fine particulate matter air pollution and lung cancer in a large cohort of never-smokers. Am. J. Respir. Crit. Care Med. 2011, 184, 1374–1381. [Google Scholar] [CrossRef]
- Zuraimi, M.S.; Tan, Z. Impact of residential building regulations on reducing indoor exposures to outdoor PM2.5 in Toronto. Build. Environ. 2015, 89, 336–344. [Google Scholar] [CrossRef]
- Chen, C.; Zhao, B. Review of relationship between indoor and outdoor particles: I/O ratio, infiltration factor and penetration factor. Atmos. Environ. 2011, 45, 275–288. [Google Scholar] [CrossRef]
- Challoner, A.; Gill, L. Indoor/outdoor air pollution relationships in ten commercial buildings: PM2.5 and NO2. Build. Environ. 2014, 80, 159–173. [Google Scholar] [CrossRef]
- Laumbach, R.; Meng, Q.; Kipen, H. What can individuals do to reduce personal health risks from air pollution? J. Thorac. Dis. 2015, 7, 96–107. [Google Scholar] [PubMed]
- Carlsten, C.; Salvi, S.; Wong, G.W.K.; Chung, K.F. Personal strategies to minimise effects of air pollution on respiratory health: Advice for providers, patients and the public. Eur. Respir. J. 2020, 55, 1902056. [Google Scholar] [CrossRef] [PubMed]
Publisher’s Note: MDPI stays neutral with regard to jurisdictional claims in published maps and institutional affiliations. |
© 2020 by the authors. Licensee MDPI, Basel, Switzerland. This article is an open access article distributed under the terms and conditions of the Creative Commons Attribution (CC BY) license (http://creativecommons.org/licenses/by/4.0/).