Article

IEQ Field Investigation in High-Performance, Urban Elementary Schools

1
DLR Group, Washington, DC 20004, USA
2
Hillier College of Architecture and Design, New Jersey Institute of Technology, Newark, NJ 07102, USA
*
Author to whom correspondence should be addressed.
Atmosphere 2020, 11(1), 81; https://doi.org/10.3390/atmos11010081
Submission received: 9 November 2019 / Revised: 24 December 2019 / Accepted: 7 January 2020 / Published: 9 January 2020
(This article belongs to the Special Issue Green Buildings and Indoor Air Quality)

Abstract

:
School buildings are one of the most commonly occupied building types for children, second only to their homes. Indoor environmental quality (IEQ) is an ongoing issue in schools, especially in urban environments where students are exposed to higher levels of outdoor pollutants. To examine this issue, five elementary school buildings located in a major city on the East Coast of the United States were selected for one-week of quantitative IEQ measurements, with a satisfaction survey collected from teachers at the selected schools. The schools included three high-performance schools, one recently renovated school, and one conventional school. Despite building designers and operators following the recommendations of current high-performance design standards, the three high-performance school buildings did not have measurably better IEQ than the renovated and conventional school buildings, nor were they perceived as better based on the satisfaction survey. This indicates that current high-performance design standards may not place enough emphasis on reducing health-related pollutants in urban schools.

1. Introduction

Since the mid 1970s, buildings have become progressively more energy efficient, due in large part to the energy crisis and the subsequent development of building efficiency standards, including the American Society of Heating, Refrigeration, and Air-Conditioning Engineers (ASHRAE) Standard 90.1 [1]. However, early attempts to design energy-efficient buildings resulted in buildings with tight envelopes and little to no ventilation. The lack of adequate ventilation caused occupants to fall ill and suffer from asthma, allergies, and other illnesses generally referred to as sick building syndrome (SBS). In the United States, the ASHRAE Standard 62.1 sets minimum ventilation rates for acceptable indoor air quality (IAQ) in commercial buildings [2]. In the earlier version of the ASHRAE Standard 62.1, “acceptable indoor air quality” was defined only by smells and discomfort. However, in the most recent version published in 2016, the definition was expanded to include a requirement that the air does not likely contain contaminants at concentrations that are known to pose a health risk. In Europe, the European Committee for Standardization (CEN) addresses commercial building ventilation in standard EN 16798 [3], a revision of the former standard EN 15251 [4]. Unlike ASHRAE Standard 62.1, EN 16798 is performance-based and sets minimum filtration efficiency based on outdoor air quality. Since 2014, ASHRAE has been a member of the Indoor Environment Global Alliance (IEQ-GA) along with The Federation of European Heating, Ventilation and Air Conditioning associations (REHVA) and several other organizations working to achieve better IEQ in buildings around the world [5].
Early IEQ (which consists of the four categories: thermal comfort, indoor air quality (IAQ), lighting, and acoustics that affect occupant health, comfort, satisfaction, and productivity) studies focused on office buildings. However, the importance of IEQ in school buildings was quickly realized. According to the U.S. Environmental Protection Agency (EPA), people spend over 90% of their time indoors [6]. School buildings are one of the most commonly occupied building types for children, second only to their homes. Poor IEQ is known to cause health and performance issues in building occupants. School-age children are particularly susceptible to developing long term damage as a result of poor IEQ [7]. Furthermore, the American Lung Association (ALA) reports that school children in urban environments are exposed to higher levels of outdoor air pollutants than in rural areas [8]. A recent review of IEQ field studies in schools by Oldham and Kim [9] found school children in cities were exposed to higher levels of outdoor air pollutants than in rural areas, while facing the same internally generated IAQ issues. However, few studies have examined how IAQ in urban schools differs from IAQ in suburban or rural schools. In addition, other aspects of IEQ, including thermal comfort, lighting, and acoustics, have been shown to have an effect on building occupant performance [10,11].
While many standards and codes provide design guidance for energy-efficiency and basic occupant comfort, there is still a lack of clarity on the relationship of actual building energy performance and perceived IEQ after the building is in operation. Previous efforts such as high-performance design standards and certifications (e.g., Leadership in Energy and Environmental Design (LEED) [12], Building Research Establishment Environmental Assessment Method (BREEAM) [13], and Green Globes [14]), which seek to address both issues have been widely adopted around the world. Further efforts, including the ASHRAE Advanced Energy Design Guide for K-12 School Buildings [15], have been made to provide guidance for both energy efficiency and occupant comfort specifically for schools. However, these efforts have largely focused on the design performance of both issues in a separate way. As a result, perceived IEQ in high-performance school buildings is not always better than in traditional school buildings [16].
Therefore, this study aims to address elements of the research gap in IEQ in schools by investigating the IEQ conditions in high-performance, urban schools in a major city on the East Coast of the United States. For comparative purposes, five case study schools were selected, including three defined as “high-performance” (HP), one recently “renovated”, non-high-performance school (R), and one non-recently renovated “conventional” school (C). All the selected schools were located in the same city. This paper is an extended version of the work presented at the 2019 ASHRAE Annual Conference [17], which reported the preliminary results of this study. The results presented in this paper provide deeper insights into the thermal comfort and lighting in the measured classrooms and schools. This paper also provides a more thorough analysis of the relationship between LEED points earned and measured and perceived IEQ in urban schools.

2. Literature Review

2.1. General Approach

In order to design this study, an extensive literature review was conducted, focusing on IEQ field studies from the past 15 years published in relevant journals. The preliminary results of this review were presented at the Indoor Air Conference in summer 2018 [9]. To identify pertinent studies several combinations of search terms including IEQ, IAQ, schools, high-performance, green, urban, rural, and LEED were entered into WorldCat as well as searched directly through journals including Indoor Air, Building and Environment, and the Journal of Environmental Health. A total of 105 studies were identified, the 38 most relevant studies focusing on IAQ and thermal comfort were selected for detailed analysis [7,15,18,19,20,21,22,23,24,25,26,27,28,29,30,31,32,33,34,35,36,37,38,39,40,41,42,43,44,45,46,47,48,49,50,51,52,53]. Three continents were represented among the 105 studies, North America, Europe, and Asia, with the most studies coming from North America, followed by Europe, and finally Asia. Within the United States, no studies were found in Climate Zone 4a, the climate zone of this study. The number of schools in each study varied from one to 386 with a median value of 18.5 and the number of classrooms measured varied from six to 820 with a median value of 73.

2.2. Previous IAQ and Thermal Comfort Field Measurement Results

The identified studies measured a variety of indoor pollutants, contaminants, comfort metrics, health symptoms, and performance metrics such as test scores, as shown in Table 1. Among the 38 studies most relevant to this paper, the most commonly studied IAQ metric was CO2, which was addressed in 26 of the 38 studies (68%). The second most commonly studied IAQ metric was PM2.5/PM10 which were measured in 16 of the 38 studies (42%). The most commonly studied thermal comfort metric was temperature which was addressed in 15 of the 38 studies (39%). 24 of the 38 studies did not address health or occupant performance at all. Among student outcomes, test-performance was the most commonly reported metric (21%), followed by health symptoms (16%).
Among the wider pool of 105 studies, more studies were found which addressed IEQ metrics including lighting levels, acoustics, and thermal comfort. For example, a 2019 study found a statistically significant relationship between sound type and sound pressure level and student performance [54]. Another recent study presented the results of a workshop where students identified IEQ problems in their classrooms and suggested creative solutions [55]. The issues most commonly identified by the students in this study were noise related, followed by temperature related.
Figure 1 presents the mean CO2 measurements of the 22 studies organized by the type of developed environments: urban, suburban/ mixed, or rural. Out of the 26 studies that reported CO2, four studies [30,36,39,47] were excluded from this graphical analysis because only non-specific or graphical data was available in these studies. Values are plotted using the aggregate data by environment type, with some studies including multiple schools and environment types. The Study ID numbers in Figure 1 and Figure 2 are identical to the reference numbers. The mean CO2 levels exceeded the recommended level of 1000 ppm [2] for 13 of the 22 aggregate data points in which CO2 was measured. The mean CO2 level was determined by taking the mean of all available CO2 data for each study. Studies included differing amounts of data often taken across many classrooms, schools, and districts. Many, but not all, studies also presented peak CO2 (i.e., the highest level of CO2 measured in the study), and low CO2 (i.e., the lowest level of CO2 measured in the study). Maximum CO2 levels were reported in 18 studies of which the highest peak CO2 level was 6000 ppm [22], which was caused by substandard ventilation rates. The methodology of this study required the windows and doors of the classrooms remained closed during the measurement period in order to better estimate mechanical ventilation rates using the measured CO2 data, which might affect the measured low ventilation rates. Based on the available data, school location was not significantly related to CO2 concentrations in classrooms, which is expected since the CO2 concentrations are directly affected by ventilation rates. High CO2 concentrations were observed across all environment types. The percentages of aggregate data points in which mean CO2 levels exceeding 1000 ppm were 40% (four out of 10 studies) in urban environment, 67% (eight out of 12 studies) in suburban/mixed environment, and 25% (1 out of 4 studies) in rural environment.
PM2.5 was measured in only 12 of the 38 studies, four additional studies measured PM10. This small sample is problematic as PM2.5 is a known to deeply penetrate the lungs creating long term impairments of lung function [56]. Figure 2 presents the mean PM2.5 measurements from the selected 12 studies organized by the type of developed environments. The recommended limits for PM2.5 are given in two different concentrations based on time-period of exposure [57]. The acceptable average value of exposure over 1-year is 12 ug/m3. The acceptable average value of exposure in 24 h is 35 ug/m3. On average, urban schools tended to have slightly higher mean PM2.5 levels than suburban/mixed or rural schools with six out of nine (67%) falling outside of the acceptable limit over 24-h. Fewer studies exceeded the acceptable range over 24-h: two out of five studies (40%) in suburban/mixed environment and one of two studies (50%) in rural environment. The observed unexpectedly high PM2.5 concentration in a rural environment was reported by Fuoco et al. [45], which was due to one of the rural schools being located next to a major highway. Generally, PM2.5 appears to be more problematic in urban areas, as expected, however there is still a need for more research to achieve statistical significance.

2.3. Relationship between IEQ and Student Outcome

Several of the selected studies [7,15,18,21,22,23,24,25,28,31,34,35,39] reported an association between poor IEQ, and negative health symptoms or poor performance. In these studies, ventilation rate, which was directly measured or indirectly measured using CO2, has been a main indicator of IAQ which was strongly associated with health and achievement. One of the reviewed studies [21] completed a study of 820 classrooms in Denmark comparing naturally and mechanically ventilated classroom and found that mechanically ventilated classrooms had lower CO2 concentrations. As a result, they found that the students in the mechanically ventilated classrooms had significantly higher achievement indicators. Another study [23] in California elementary schools found that ventilation rates generally fell below the state requirement of 7.1 L/s-person [2], and that increasing ventilation rates could increase attendance. This could in turn increase attendance-linked funding to the schools by $33 million a year, while costing the schools only $4 million a year. There was also a study which looked specifically at the relationship between student absence and CO2 concentrations in 22 schools in the states of Washington and Idaho. The findings of that study indicated a 10–20% increase in student absence is classrooms with elevated concentrations of CO2 [24].
A comprehensive literature review performed in 2003 by Daisey et al. [58] found that while individual studies could not demonstrate a clear relationship between ventilation rates and health symptoms on their own, the meta-analysis did suggest a clear relationship. In this review, the most common health complaints associated with poor ventilation were SBS and asthma. A more recent literature review [59] showed while the health effects of pollutants and ventilation rates continue to be studied, few studies simultaneously looked at thermal comfort in schools [59]. Overall, these reviews showed that, despite early efforts to improve IAQ in schools, the majority of IAQ studies in schools still showed unacceptable levels of common indoor pollutants.

2.4. Research Gap in Previous Field Studies on School IEQ

Of the 38 studies reviewed, only three studies [31,42,47] compared IAQ between urban schools and rural schools. A 2010 study that compared IAQ in 17 urban and rural preschools in Korea [42] showed that indoor and urban concentrations of common pollutants were higher than those in outdoor and rural areas. However, a 2010 study that examined concentrations of PM and CO2 in four naturally ventilated nursery schools located near Gliwice, Poland [47] unexpectedly showed elevated levels of PM, both indoors and outdoors, at the rural schools due partially to the proximity to high-traffic streets. A recent study that examined IAQ in Kuwaiti schools located in either the “urban” sector, or the “industrial” sector [31] reported similar indoor concentrations of outdoor pollutants such as SO2, NO2, H2S, and Acetaldehyde for both zones except for CH2O. In this paper, the “urban zone” refers to an area near the city center, while the “industrial zone” refers to an area near oil and gas processing plants. CH2O was the only metric where the indoor concentrations were significantly higher in the urban zone schools than in the industrial zone schools because of indoor sources in painting and science rooms.
In regard to IEQ in high-performance schools, four studies [15,18,40,52] addressed this subject. Generally, these studies demonstrated slightly better IEQ in high-performance schools than in conventional schools, with some disagreement. A 2009 study of 11 school buildings in the Netherlands [15] showed that common sustainable strategies can ensure acceptable IAQ based on acceptable levels of pollutants and ventilation. However, this does not always mean occupants will be more satisfied with the IEQ. A 2011 study in Toronto, Canada [18] showed that teachers in high-performance schools were more satisfied with the IAQ, lighting and thermal comfort conditions of their classrooms and were less likely to report neuro-physiologic symptoms such as headache, fatigue, and difficulty concentrating. A 2018 study in Athens, Greece [40] found that, during the summer, the green roof system reduced top-floor classroom temperature by about 2.8 °C, but all measured classrooms were insufficiently ventilated. Lastly, a study which measured IAQ in 10 recently built high-performance school buildings in France [52] found that indoor pollutant concentrations in high-performance schools are similar to or lower than the levels in conventional schools. This study focused on volatile organic compounds (VOC’s) and most of the pollutants measured were found to have come from indoor sources.
Overall, there is not sufficient research to provide meaningful recommendations on how to provide acceptable IEQ in high-performance schools in urban environments. No studies were found which looked specifically at IEQ in high-performance school buildings in urban environments. Furthermore, the research findings are often contradictory to each other. As the world continues to rapidly urbanize and faces the realities of climate change, this research gap requires further investigation.

3. Methods

3.1. General Approach

In order to better understand IEQ in high-performance, urban school buildings, five public elementary school buildings located in one school district of a major city on the East Coast of the United States were selected for measurement, as shown in Table 2. Three of the participating schools received LEED Gold certification (i.e., Schools #1 to #3, High-Performance (HP)), one had undergone a recent renovation including energy-saving design strategies but had not been LEED certified (i.e., School #4, Renovated (R)), and one was not LEED certified and had not been recently renovated (i.e., School #5, Conventional (C)). The previous year of energy bills was provided by the school district in order calculate the energy use intensity (EUI) of each school building. In terms of IAQ, the focus of this study is the effect of local outdoor pollution in urban areas on indoor pollutant levels. Thus, CO2 was measured as an indicator of outdoor air ventilation rates, while indoor and outdoor PM2.5 and PM10 were measured to evaluate the intrusion of outdoor pollutants.

3.2. Case-Study Buildings

Upon the selection of the case-study school buildings, a basic survey of each building was undertaken to identify which design and operational elements were present. The LEED scorecards were gathered for applicable schools. School-level demographic, and test performance data, as well as 1-year of building energy use data was provided by the school district. Table 2 presents an overall description of each case-study building, and Table 3 presents the detailed LEED credits earned in each category. School #1 was certified Gold under LEED v3-2009, and schools #2 and #3 were certified Gold under LEED v2-2007. Under LEED for School v2- 2007, 44–57 credits were required to receive Gold certification. Under LEED for Schools v3-2009, 60–70 credits were required to receive Gold certification. Interestingly, School #2 (HP) had the second highest site EUI of the selected schools at 268 kWh/m2/year, while School #4 (R) had the lowest EUI at 113 kWh/m2/year despite not achieving LEED certification. School #5 (C) had the highest EUI while serving the lowest number of students. The case-study schools represented a variety of communities across the city and had varied enrollment demographics.

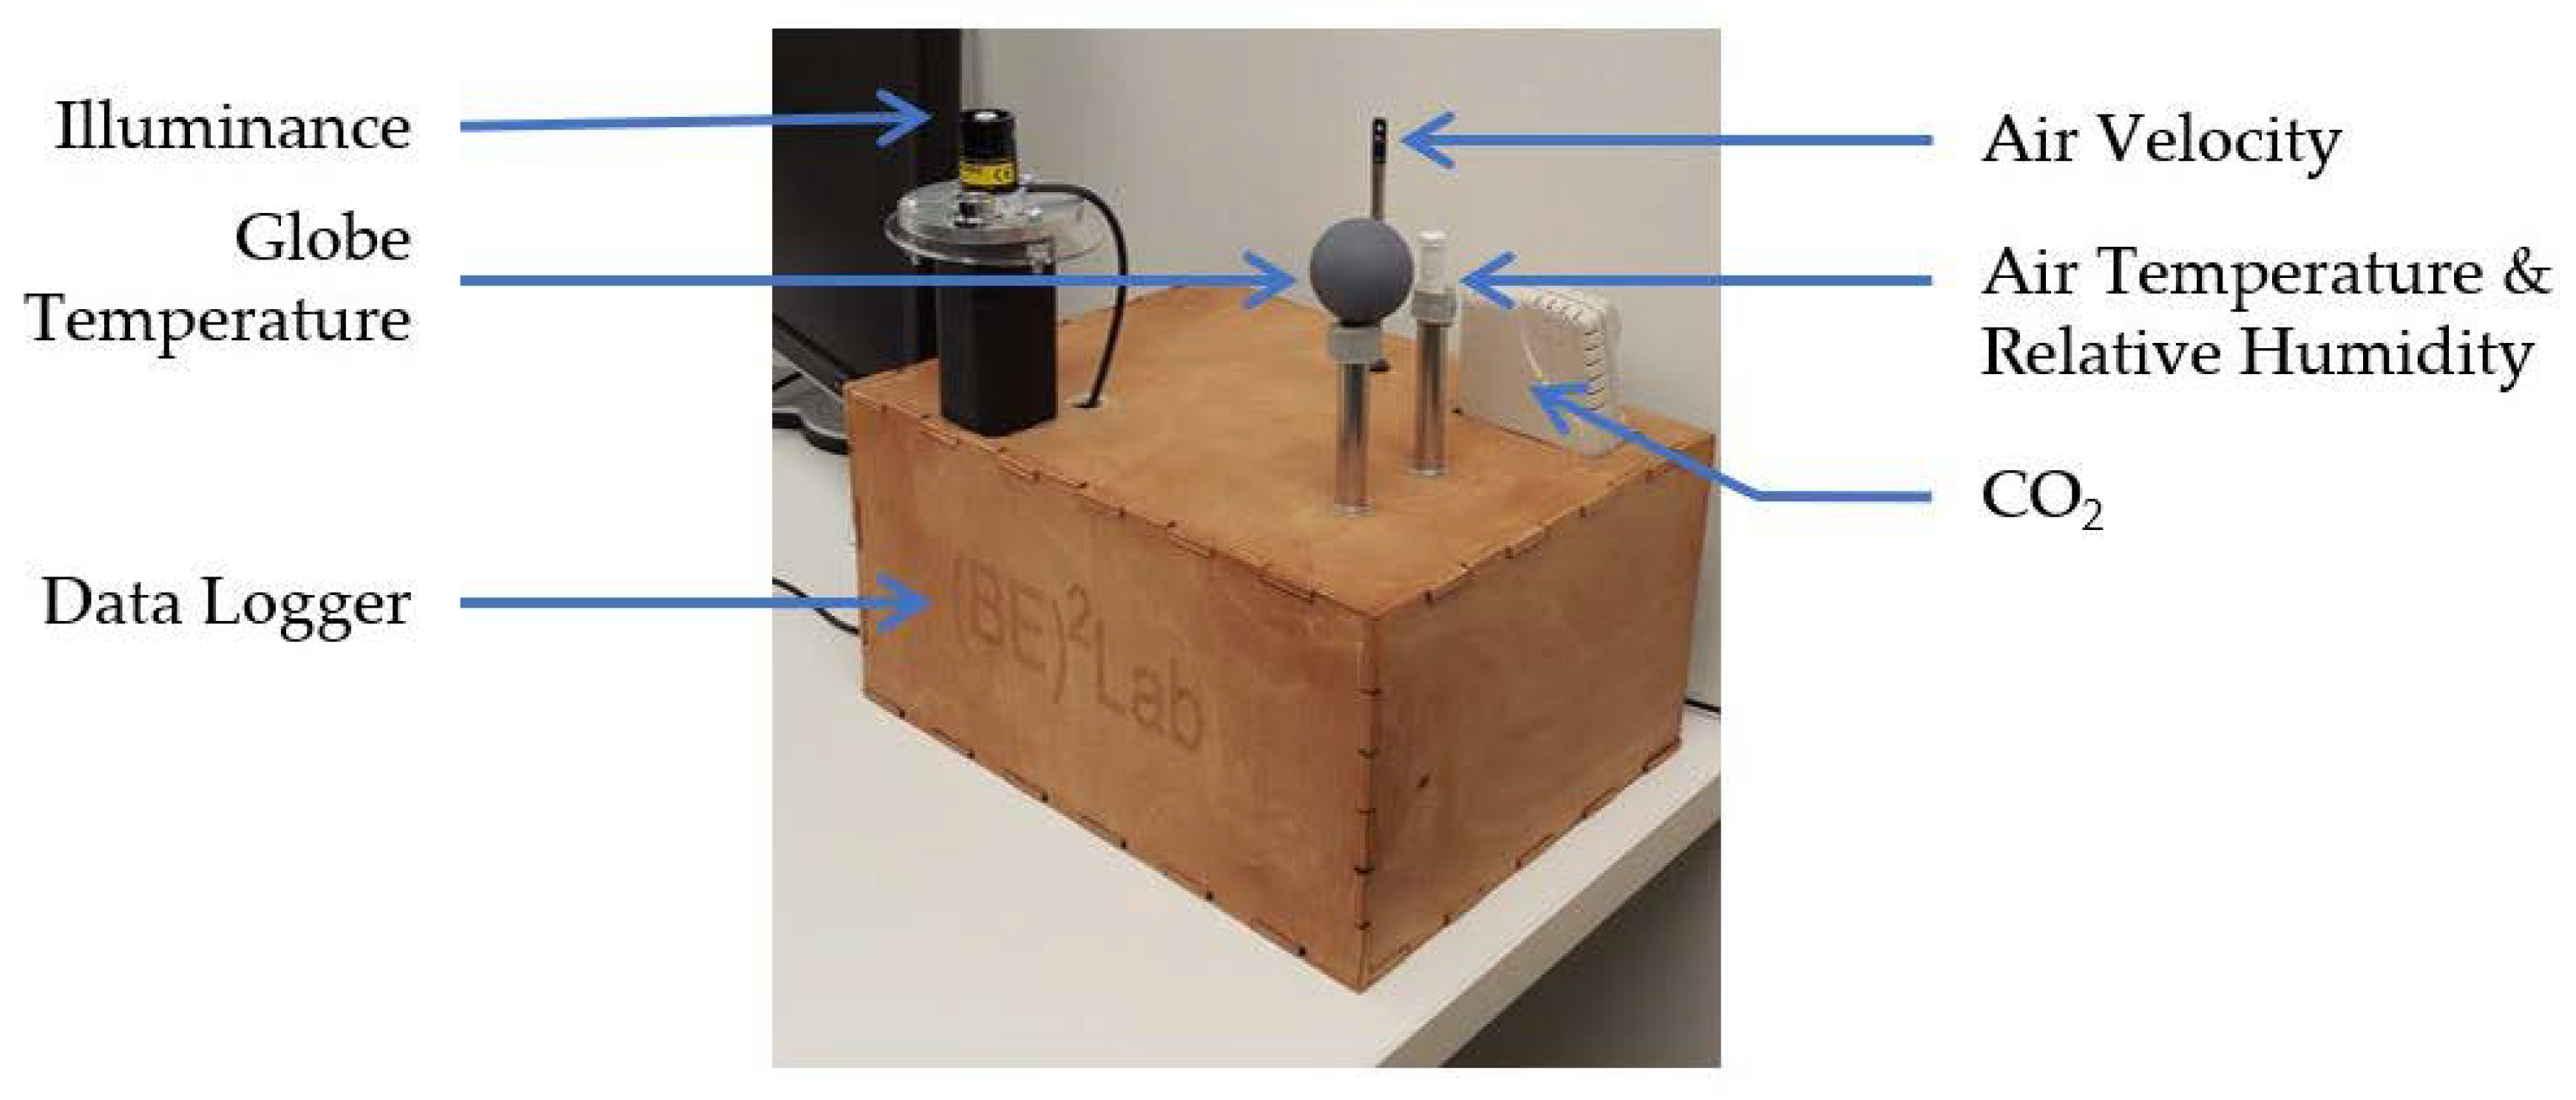
3.3. Data Collection

Within each selected school, two representative classrooms were selected for 1-week of continuous IEQ measurements. IEQ measurements took place between May and October 2018 in the selected classrooms. The measurement period consisted of four school days and one full weekend, from Thursday morning to Tuesday afternoon. Table 4 presents the measurement period at each school with the corresponding mean outdoor air temperature and relative humidity (RH) during each measurement period.
For the continuous IEQ measurements, custom-built IEQ monitoring devices, both furniture integrated and desktop type, were used (Figure 3). These devices measured: air temperature, humidity, globe temperature, air velocity, CO2, and illuminance with occupancy. Data were recorded in one-minute intervals. The IEQ monitoring devices were located near the teacher’s desk in the center of the classroom, away from objects which may have interfered with the data. Spot measurements of particle pollution (i.e., PM10, PM2.5) were taken after school on the final day of the measurement period, around 3:30 PM, using a handheld meter. Table 5 presents the specifications of the IEQ instrument, including the sensor type and accuracy. PM measurements were taken in every school, in both classrooms, as well as outside the front door of the school.
An IEQ assessment survey addressing IEQ satisfaction and self-rated productivity was distributed to elementary school teachers in the selected schools via email and by hard copies which were dropped off and picked-up at the same time as the IEQ monitoring devices. The questionnaire is based on the University of California, Berkeley’s Center for the Built Environment IEQ survey [60]. The assessment survey asked teachers to rate their satisfaction and self-rated productivity with four IEQ categories: thermal comfort, IAQ, lighting, and acoustics. Participants ranked their satisfaction and self-rated productivity on a seven-point scale (i.e., −3 (high dissatisfied), 0 (neither satisfied nor dissatisfied), 3 (highly satisfied)). If participants indicated dissatisfaction, they were directed to a series of follow-up questions which asked them to indicate the source of their dissatisfaction. The survey also included questions regarding demographics, and background information. In total, 44 teacher surveys were collected: seven from School #1 (HP), three from School #2 (HP), nine from School #3 (HP), 14 from School #4 (R), and 11 from School #5 (C). While an inadequate number of surveys were collected to achieve statistical significance, the results proved helpful in identifying the causes of anomalies in the quantitative data.

3.4. Statistical Analysis

For the continuously measured IEQ metrics, a one-way ANOVA between subjects was conducted to determine if there was significant difference between school buildings. The null hypothesis was tested for a p-value of 0.05. When the null hypothesis was rejected a post hoc Fishers Least Significant Difference (LSD) test was preformed to determine which specific groups showed a significant difference.

4. Results & Discussion

Table 6 presents a summary of the mean and standard deviation values of the continuously measured IEQ data from each classroom in each school building (Due to a logger error, only one classroom of data was analyzed at School #2 (HP).). Percent Mean Vote (PMV) and Percent Predicted Dissatisfied (PPD) are also presented and were calculated using a clothing level of 0.57 clo and an activity level of 1 met. The data are presented by three different occupancy modes. The classrooms were considered to be in occupied mode (Occ) during the school’s operating hours, between 08:00 and 15:00 Monday through Friday, were considered to be in unoccupied mode (UnOcc) after school hours during the school week, between 15:00 and 8:00 Monday through Friday morning, and were considered to be in weekend mode from 15:00 Friday afternoon through 08:00 Monday. Table 7 presents the results of the one-way ANOVA analysis between school buildings. Statistical distributions of data are presented in subsequent sections of this paper.

4.1. Thermal Comfort

Indoor temperatures were more variable and overall slightly warmer in the high-performance schools than in the renovated or conventional schools with mean indoor temperature in the three high-performance schools varying from 21.3 °C to 25.8 °C during occupied periods, mean indoor temperature in the renovated school varying from 21.4 °C to 22.1 °C during occupied periods, and mean indoor temperature in the conventional school varying from 22.2 °C to 22.4 °C during occupied periods. Still, the mean indoor temperature was within the ASHRAE comfort zone in all classrooms [61].
Figure 4 presents the statistical distributions (maximum, 90th, median, 10th, minimum) of the indoor temperature data for all measured classrooms in each school building by occupancy mode. In this plot and subsequent statistical distributions plots the diamond represents the mean, the 90th and 10th percentiles are at the ends of the whiskers, and the plus and x symbols represent the minimum and maximum data points. In this plot, the vertical red line represents the lower end of the setpoint range recommended by the district (22.2 °C), while the vertical blue line represents the upper end of this range (25.6 °C). School #1 (HP) had a wider interquartile range than the other schools. This was due to the two classrooms having different temperature setpoints, with an average temperature difference of 4.8 °C between classrooms. School #2 (HP) experienced the highest peak temperature during occupied periods at 29.5 °C. School #4 (R) was the only school which demonstrated expected temperature setback in the evening and weekend. However, upon examination of the data it is evident that this setback was only applied to Classroom #2. Classroom #1 was in an area of the school where minor construction work was being done over the weekends, thus the system remained on in this classroom. Table 8 presents the results of the Fishers LSD test for the mean indoor temperatures by school. Significant differences were found in all school pairs except between School #1 (HP) and School #3 (HP).
Thermal comfort, particularly indoor temperature, has previously been statistically linked to work performance in both classroom and office environments. A study by Seppanen et al. [10] examined the data of several studies which measured indoor temperature and work performance indicators and found that performance increases with temperatures up to 21–22 °C and decreases with temperatures above 23–24 °C. Peak performance occurs around 22 °C. Figure 5 presents the hourly indoor temperature during occupied periods by school with the productivity curve developed by Seppanen et al. A total of 184 hourly average temperature data collected from nine classrooms are presented in the figure. This shows that the high-performance schools, particularly School #1 (HP) and School #2 (HP), experienced a greater number of hours where the indoor temperature exceeded 23 °C, and therefore productivity would be expected to decrease. The expectation of better IEQ and a resultant increase in student performance is a common reason school district pursue high-performance designs for new and renovated school buildings. If these buildings do not meet those expectations, districts may decide to focus their limited funds on other pursuits moving forward.
Figure 6 presents the statistical distributions (maximum, 90th, median, 10th, minimum) of the indoor relative humidity data for all measured classrooms in each school building by occupancy mode. In this plot, the vertical red line represents the lower end of the optimum RH zone as reported by Sterling et al., while the vertical blue line represents the upper end of the optimum RH zone [62]. At both School #2 (HP) and School #4 (R) relative humidity regularly exceeded comfortable levels during occupied periods. Both of these schools experienced precipitation during the measurement periods with 1.63 cm in of rain falling during the measurement period for School #1 (HP) and 1.73 cm of rain during the measurement period for School #4 (R). The HVAC systems at Schools #2 (HP), #3 (HP), and #5 (C) were effective at maintaining comfortable indoor relative humidity at least 75% of the time during occupied periods despite outdoor conditions well exceeding the comfortable range during the measurement period. Table 9 presents the results of the Fishers LSD test for the mean relative humidity by school. Significant differences were found in all school pairs.

4.2. IAQ

Of the three classrooms with the highest average indoor CO2, two were in high-performance schools including Classroom #2 at School #3 (818 ppm), and Classroom #1 at School #2 (961 ppm), as shown in Table 6. School #5 (C) had the largest difference in mean CO2 concentration during occupied hours between classrooms (310 ppm), while School #4 (R) had the smallest difference between classrooms (34 ppm). Classroom #1 at School #5 also had the highest mean CO2 concentration during unoccupied hours (548 ppm) and weekends (530 ppm), which might indicate that this classroom may have a tighter building envelope than expected.
Figure 7 presents the statistical distributions (maximum, 90th, median, 10th, minimum) of the indoor CO2 data for all measured classrooms in each school building by occupancy mode. In this plot the vertical red line represents the baseline outdoor CO2 level (400 ppm), while the vertical blue line represents the maximum recommended CO2 level in classrooms (1000 ppm) [63] (1000 ppm of indoor CO2 concentration threshold limit was estimated using the Informative Appendix C of the ASHRAE 62.1-2010 with the following assumptions: 400 ppm of outdoor CO2 concentration and 0.011 cfm of indoor CO2 generation rate). In all measured schools, the peak CO2 value exceeded the recommended level of 1000 ppm. School #4 (R) had the highest peak value during occupied periods at 1781 ppm, which was affected by increased activity in the classroom which was used for science classes where students were more active than in general classes. School #2 (HP) had higher mean and peak CO2 concentrations than School #1 (HP) or School #3 (HP) despite having an outdoor air delivery monitoring system, indicating that this system may have been operating incorrectly. Compared to the previous studies (Figure 1) all three high-performance schools in this study performed well in terms of mean CO2 concentrations, with an aggregate mean CO2 concentration of the three schools of 739 ppm. Table 10 presents the results of the Fishers LSD test for the mean CO2 by school. Significant differences were found in all school pairs, except between School #2 (HP) and School #5 (C).
Table 11 presents the average PM2.5 concentrations by school, including the concentration for each classroom and outdoor concentrations. The indoor-outdoor (I/O) ratio were also calculated and included in the table. Overall, PM2.5 concentration seemed to be more closely related to school location (i.e., presence of outdoor sources on PM) than to whether the school was high-performance, renovated, or conventional. The PM2.5 concentrations at Schools # 1 (HP) and #3 (HP) were below the EPA recommended average over 1-year exposure level of 12 ug/m3. School #2 (HP) had the highest indoor mean level at 123.7 ug/m3.
I/O ratio was not correlated to whether a school was high-performance, renovated, or conventional, although high-performance schools are expected to have lower indoor emissions and more efficient air filters resulting in lower I/O ratios. The I/O ratio of PM2.5 was greater than one (100%) at Schools #1 (HP) and #4 (R), indicating indoor sources of PM2.5 at these schools. At School #4 (R) this can be explained by the ongoing construction activity. The I/O ratios at schools #2 (HP), #3 (HP), and #5 (C) are all around 0.5, indicating that the PM is likely from outdoor sources and is being filtered effectively.
However high outdoor PM at schools #2 and #5 resulted in indoor levels above the recommended exposure level. Compared to the previous studies (Figure 2), the mean PM 2.5 concentration for School #1 (5.8 ug/m3) and School #3 (11.3 ug/m3) of the high-performance schools in this study were on the low side (i.e., lower than the mean values in 6 of the 9 studies which measured PM2.5 in urban schools). On the other hand, the mean PM 2.5 concentration for School #2 (123.7 ug/m3) was higher than all other studies which measured PM2.5 in urban schools by 29.7 ug/m3.

4.3. Lighting

Figure 8 presents the statistical distributions (maximum, 90th, median, 10th, minimum) of the indoor illuminance data for all measured classrooms in each school building by occupancy mode. In this plot, the vertical red line represents the minimum acceptable illumination level in classroom (300 lux) [64]. Illuminance levels varied widely across the study with no apparent correlation to whether a school was high-performance, renovated, or conventional. The indoor illuminance data showed that School #2 (HP) experienced extremely high peaks in the morning, around 10 AM due to southeast facing glazing in Classroom #1. On the other hand, Schools #1 (HP), #3 (HP), and #5 (C) all had mean illuminance levels below the recommended levels during occupied periods. Only School #4 (R) had a mean illuminance level within the recommended range during occupied periods. Table 12 presents the results of the Fishers LSD test for the mean illuminance by school. Significant differences were found in all school pairs except between School #1 (HP) and School #3 (HP), between School #1 (HP) and School #5 (C), and between School #3 (HP) and School #5 (C).

4.4. Performance & Survey Results

Figure 9 and Table 13 present the results of the teacher satisfaction survey. Overall, occupant satisfaction was not significantly related to whether a school was high-performance, renovated, or conventional. Occupants were most satisfied with thermal comfort at School #1 (HP), likely because they had the most control over the setpoints of their classrooms. Teacher at School #3 (HP) were quite dissatisfied with thermal comfort, and the comments on the surveys showed that this was because they didn’t feel the systems was responsive to their demand. Occupants were dissatisfied with the air quality in all of the measured schools except for School #5 (C). School #2 (HP) had the lowest satisfaction rating due to complaints of stuffy/stale air. This agrees with the CO2 data, which showed high levels during occupied periods and indicates that the ventilation system at School #2 (HP) was not operating as designed. Survey comments for School #4 (R) indicate that the low IAQ satisfaction score for that school is a direct result of dust from the construction activity. Occupants were also very dissatisfied with noise level at School #4, also due to the ongoing construction. Despite irregularities in the measured data, occupants in all of the selected schools were very satisfied with the illuminance levels overall.

4.5. LEED Score Discussion

The stated goal of the LEED certification system is to maximize occupant health and productivity, use fewer resources, reduce waste and negative environmental impacts, and decrease life cycle costs. Some previous studies [65,66] have shown that occupants in LEED certified buildings tend to be more satisfied with thermal comfort and IAQ than occupants in non-LEED certified buildings, and less satisfied with lighting and acoustic quality. Another study [67] found no correlation between either total LEED points or specific IEQ credits earned and occupant satisfaction. In this study, while LEED score alone was not clearly correlated with measured or perceived IEQ performance, there are insight to be found in the specific points each school earned. Figure 10 compares the LEED credits earned in the IEQ category with the mean quantitative IEQ metrics during occupied hours. Figure 11 compares the LEED credits earned in the IEQ category with mean teacher satisfaction rating.
Schools #1 (HP), #2 (HP), and #3 (HP) received points in the LEED thermal comfort category. These schools had lower calculated PDDs than schools #4 (R), and #5 (C) based on the quantitative data with the lowest PPD in the School #2 (11.3%) that obtained the highest LEED IEQ score. School #1 (HP) had the highest mean thermal comfort satisfaction rating on the teacher survey (1.29). However, School #3 (HP) had the lowest satisfaction rating on the teacher survey. Specific complaints at School #3 indicated the HVAC system is often unresponsive and unreliable, creating large temperature swings.
School #2 had the highest average CO2 concentration during occupied hours, and the highest PM2.5 counts, despite receiving the most LEED IEQ category points. As previously shown in Table 3, most of the LEED IEQ Points School #2 received were in the Low-Emitting Materials and Daylight and Views Categories. These categories do not address the possibility of outdoor contaminants entering the school. However, School #2 was also the only school which received 2 points for Outdoor Air Delivery Monitoring. If the monitoring system was operating correctly School #2 should not have had the evident IAQ issues. School #1 had the lowest average CO2 concentration during occupied hours, the lowest PM2.5 counts, and the highest total LEED score, including all LEED credit categories.
School #2 had nearly perfect lighting survey scores and achieved all possible LEED daylighting points. The quantitative lighting levels were unusually high in School #2 due to the large East facing windows in one of the measured classrooms. This also resulted in overheating in the mornings in this classroom.

5. Summary and Conclusions

The aim of this study was to investigate IEQ conditions in high-performance schools in an urban environment. It was expected that IEQ in high-performance schools would be better than in renovated or conventional schools in urban environments as these schools were designed using guidelines, such as LEED, which address IEQ. The results of this study showed that generally, the high-performance schools provided comparable IEQ conditions to conventional schools, although in some areas the high-performance schools did not perform as intended. Mean indoor temperatures during occupied hours were within the comfort zone for all the high-performance schools. Further thermal comfort analysis showed that indoor temperatures were slightly warmer and more variable in the high-performance schools. This is likely due to more energy conscious operators of the high-performance buildings slightly raising the setpoint temperature during the cooling season. In terms of IAQ, two of the three classrooms in the high-performance schools had the highest average indoor CO2 indicating insufficient ventilation. PM2.5 concentration seemed to be more closely related to the specific location of the school (i.e., presence of outdoor sources on PM) than to whether the school was high-performance, renovated, or conventional. However, the I/O ratio of PM2.5 indicated indoor sources at School #1 (HP), although high-performance schools are expected to have lower indoor emissions and more efficient air filters. Occupant satisfaction was not significantly related to whether a school was high-performance and did not always agree with the measured data.
Some limitations of this study include that the measured classrooms were selected somewhat randomly, at the convenience of the schools. Ideally, a greater number of classrooms, on all floors and facing all different facades of the buildings would be measured. Not being able to sample all of the schools at the same time and being limited to spot measurements for PM was another limitation as PM can vary widely from day to day. In addition, while the teacher survey offered useful insight into the perceived IEQ, it cannot be assumed that the student’s perception agrees with the teacher’s perception. Future studies should include student qualitative IEQ surveys.
Overall, the expectation that IEQ in high-performance schools would be better than in renovated or conventional schools in urban environments was not fully met in this study. This indicates that current high-performance design standards may not place enough emphasis on reducing health-related pollutants in urban schools. Many high-performance design standards including LEED suggest only general recommendations for providing acceptable IAQ in schools. Outdoor sources of pollution are rarely addressed despite the fact that they are as harmful as indoor sources. This is likely because outdoor contaminants are more difficult to predict and control. For example, the LEED v4 Enhanced IAQ Strategies credit requires ventilation systems which provide outdoor air to have a particle filter with a minimum rating of MERV 13 but does not provide guidance regarding when a more efficient filter may be appropriate. Green Globes does not address filtration at all.
However, to ensure acceptable IEQ in high-performance schools in urban environments, high-performance design standards should focus on performance-based requirements, such as requirements for pre-construction analysis of localized outdoor contaminants and pre-occupancy and post-occupancy analysis of actual indoor pollutant levels, including PM2.5 and PM10. Focusing on performance-based measurements will ensure that resources are being used effectively to address the actual IAQ problems present in a particular project. For example, BREEAM provides more guidance than typical design standards in terms of IAQ [13]. BREEAM specifically states: “HVAC systems must incorporate suitable filtration to minimize external air pollution.” A credit for post-occupancy IAQ measurement of formaldehyde and TVOC is included in BREEAM. BREEAM also reference CEN standard EN 16798 which specifies ventilation rates based on outdoor pollution levels.
Therefore, more research is needed to address the observed disconnect between the aims and goals of high-performance design standards, such as LEED, and actual performance. Standardized methods of classroom sampling across these potential studies could help ensure accurate and comparable data across the board. IAQ, particularly in urban areas, is a localized issue, which should be properly considered in the design standards. Standards could be improved by using a performance-based approach.
The results presented in this study indicate that school districts may not be seeing the results they expect when they invest in high-performance school buildings. This is troubling for the future of high-performance school design as leaders in urban school districts often have to make difficult decisions about where to spend limited funds in order to best serve student needs. Moving forward designers and researchers need to continue to ask themselves how high-performance design standards can provide meaningful, quality recommendations for schools in a variety of contexts, in our rapidly urbanizing world.

Author Contributions

The authors declare the following contributions: conceptualization, E.O. and H.K.; methodology development, E.O. and H.K.; data collection, E.O., analysis, E.O.; resources, H.K.; visualization, E.O.; writing—original draft preparation, E.O.; writing—review and editing, H.K.; supervision, H.K. All authors have read and agreed to the published version of the manuscript.

Funding

This research was partially funded by the ASHRAE graduate student Grant-in-Aid program.

Conflicts of Interest

The authors declare no conflict of interest. The funders had no role in the design of the study; in the collection, analyses, or interpretation of data; in the writing of the manuscript, or in the decision to publish the results.

References

  1. ASHRAE. ANSI/ASHRAE Standard 90.1-2016 Energy Standard for Buildings Except Low-Rise Residential Buildings; ASHRAE: Atlanta, GA, USA, 2016. [Google Scholar]
  2. ASHRAE. ANSI/ASHRAE Standard 62.1-2016 Ventilation for Acceptable Indoor Air Quality; ASHRAE: Atlanta, GA, USA, 2016. [Google Scholar]
  3. CEN. Energy Performance of Buildings—Ventilation for Buildings—Part 3: For Non-Residential Buildings—Performance Requirements for Ventilation and Room-Conditioning Systems (Modules M5-1, M5-4); European Standard EN 16798-3:2017: Brussels, Belgium, 2017. [Google Scholar]
  4. CEN. Indoor Environmental Input Parameters for Design and Assessment of Energy Performance of Buildings Addressing Indoor Air Quality, Thermal Environment, Lighting and Acoustics; European Standard EN 15251:2007: Brussels, Belgium, 2007. [Google Scholar]
  5. The Federation of European Heating, Ventilation and Air Conditioning Associations. REHVA is the Voice of European HVAC Designers and Building Services Engineers; The Federation of European Heating, Ventilation and Air Conditioning Associations: Brussels, Belgium, 2014; Available online: https://ieq-ga.net/2019/10/the-creation-of-indoor-environment-global-alliance/ (accessed on 14 December 2019).
  6. U.S. Environmental Protection Agency. Report to Congress on Indoor Air Quality; U.S. Environmental Protection Agency: Washington, DC, USA, 1989; Volume 2.
  7. Haverinen-Shaughnessy, U.; Shaughnessy, R.J.; Cole, E.C.; Toyinbo, O.; Moschandreas, D.J. An assessment of indoor environmental quality in schools and its association with health and performance. Build. Environ. 2015, 93, 35–40. [Google Scholar] [CrossRef]
  8. Billings, P.; Nolen, J. State of the Air 2016; American Lung Association: Chicago, IL, USA, 2016. [Google Scholar]
  9. Oldham, E.; Kim, H. IAQ in High-Performance, Urban Schools: A Review. In Proceedings of the 15th Conference of the International Society of Indoor Air Quality and Climate, Philadelphia, PA, USA, 22–27 July 2018. Paper ID 781. [Google Scholar]
  10. Seppänen, O.A.; Fisk, W. Some Quantitative Relations between Indoor Environmental Quality and Work Performance or Health. HVAC&R Res. 2006, 12, 957–973. [Google Scholar]
  11. Mendell, M.; Heath, G. Do indoor pollutants and thermal conditions in schools influence student performance? A critical review of the literature. Indoor Air 2015, 15, 27–52. [Google Scholar] [CrossRef] [PubMed]
  12. U.S. Green Building Council. LEED V4; USGBC: Washington, DC, USA, 2016. [Google Scholar]
  13. BREEAM. BREEAM International New Construction Manual; Building Research Establishment: Watford, UK, 2016. [Google Scholar]
  14. Green Building Initiative. Green Globes Building Certification for New Construction; Green Building Initiative: Portland, OR, USA, 2019. [Google Scholar]
  15. ASHRAE. Advanced Energy Design Guide for K-12 School Buildings: Achieving Zero Energy; ASHRAE: Atlanta, GA, USA, 2018. [Google Scholar]
  16. Zeiler, W.; Boxem, G. Ventilation of sustainable schools: Better than traditional schools? ASHRAE Trans. 2009, 115, 815–823. [Google Scholar]
  17. Oldham, E.; Kim, H. IEQ in High-Performance, Urban Elementary Schools. In Proceedings of the 2019 ASHRAE Annual Conference, Kansas City, MO, USA, 22–26 June 2019. Extended Abstract ID KC-19-A005. [Google Scholar]
  18. Issa, M.; Rankin, J.; Attalla, M.; Christian, A. Absenteeism, Performance and Occupant Satisfaction with the Indoor Environment of Green Toronto Schools. Indoor Built Environ. 2011, 20, 511–523. [Google Scholar] [CrossRef]
  19. Shendell, D.G.; Winer, A.M.; Stock, T.H.; Zhang, L.; Zhang, J.J.; Maberti, S.; Colome, S.D. Air concentrations of VOCs in portable and traditional classrooms: Results of a pilot study in Los Angeles County. J. Expo. Sci. Environ. Epidemiol. 2004, 14, 44–59. [Google Scholar] [CrossRef] [Green Version]
  20. Canha, N.; Mandin, C.; Ramalho, O.; Wyart, G.; Ribéron, J.; Dassonville, C.; Hänninen, O.; Almeida, S.M.; Derbez, M. Assessment of ventilation and indoor air pollutants in nursery and elementary schools in France. Indoor Air 2016, 26, 350–365. [Google Scholar] [CrossRef]
  21. Toftum, J.; Kjeldsen, B.U.; Wargocki, P.; Menå, H.R.; Hansen, E.M.; Clausen, G. Association between classroom ventilation mode and learning outcome in Danish schools. Build. Environ. 2015, 92, 494–503. [Google Scholar] [CrossRef]
  22. Haverinen-Shaughnessy, U.; Moschandreas, D.J.; Shaughnessy, R.J. Association between substandard classroom ventilation rates and students’ academic achievement. Indoor Air 2011, 21, 121–131. [Google Scholar] [CrossRef]
  23. Mendell, M.J.; Eliseeva, E.A.; Davies, M.M.; Spears, M.; Lobscheid, A.; Fisk, W.J.; Apte, M.G. Association of classroom ventilation with reduced illness absence: A prospective study in California elementary schools. Indoor Air 2016, 23, 515–528. [Google Scholar] [CrossRef] [Green Version]
  24. Shendell, D.G.; Prill, R.; Fisk, W.J.; Apte, M.G.; Blake, D.; Faulkner, D. Associations between classroom CO2 concentrations and student attendance in Washington and Idaho. Indoor Air 2004, 14, 333–341. [Google Scholar] [CrossRef] [PubMed]
  25. Kielb, C.L.; Lin, S.; Muscatiello, N.; Hord, W.; Rogers-Harrington, J.; Healy, J. Building-related health symptoms and classroom indoor air quality: A survey of school teachers in New York State. Indoor Air 2015, 25, 371–380. [Google Scholar] [CrossRef] [PubMed]
  26. Yang, J.; Nam, I.; Yun, H.; Kim, J.; Oh, H.-J.; Lee, D.; Jeon, S.-M.; Yoo, S.-H.; Sohn, J.-R. Characteristics of indoor air quality at urban elementary schools in Seoul, Korea: Assessment of effect of surrounding environments. Atmos. Pollut. Res. 2015, 6, 1113–1122. [Google Scholar] [CrossRef]
  27. Stranger, M.; Potgieter-Vermaak, S.; Grieken, R.V. Characterization of indoor air quality in primary schools in Antwerp, Belgium. Indoor Air 2008, 18, 454–463. [Google Scholar] [CrossRef]
  28. Zhang, Q.; Zhu, Y. Characterizing ultrafine particles and other air pollutants at five schools in South Texas. Indoor Air 2012, 22, 33–42. [Google Scholar] [CrossRef]
  29. Muscatiello, N.; McCarthy, A.H.; Kielb, C.L.; Hsu, W.; Hwang, S.; Lin, S. Classroom conditions and CO2 concentrations and teacher health symptom reporting in 10 New York State Schools. Indoor Air 2015, 25, 157–167. [Google Scholar] [CrossRef]
  30. Petronella, S.A.; Thomas, R.A.; Stone, J.A.; Goldblum, R.M.; Brooks, E.G. Clearing the air: A model for investigating indoor air quality in Texas schools. J. Environ. Health 2005, 67, 35–42. [Google Scholar]
  31. Al-Hemoud, A.; Al-Awadi, L.; Al-Rashidi, M.; Rahman, K.A.; Al-Khayat, A.; Behbehani, W. Comparison of indoor air quality in schools: Urban vs. Industrial ‘oil & gas’ zones in Kuwait. Build. Environ. 2017, 122, 50–60. [Google Scholar]
  32. Mi, Y.; Norbäck, D.; Tao, J.; Mi, Y.; Ferm, M. Current asthma and respiratory symptoms among pupils in Shanghai, China: Influence of building ventilation, nitrogen dioxide, ozone, and formaldehyde in classrooms. Indoor Air 2006, 16, 454–464. [Google Scholar] [CrossRef]
  33. Mendell, M.J.; Eliseeva, E.A.; Davies, M.; Lobscheid, A.B. Do classroom ventilation rates in California elementary schools influence standardized test scores? Results from a prospective study. Indoor Air 2016, 26, 546–557. [Google Scholar] [CrossRef]
  34. Haverinen-Shaughnessy, U.; Shaughnessy, R.J. Effects of Classroom Ventilation Rate and Temperature on Students’ Test Scores. PLoS ONE 2015, 10, e0136165. [Google Scholar] [CrossRef] [PubMed]
  35. Ronsse, L.M.; Wang, L.M. Effects of Noise from Building Mechanical Systems on Elementary School Student Achievement. ASHRAE Trans. 2009, 116, 347–354. [Google Scholar]
  36. Theodosiou, T.; Ordoumpozanis, K.T. Energy, comfort and indoor air quality in nursery and elementary school buildings in the cold climatic zone of Greece. Energy Build. 2008, 40, 2207–2214. [Google Scholar] [CrossRef]
  37. Santamouris, M.; Synnefa, A.; Asssimakopoulos, M.; Livada, I.; Pavlou, K.; Papaglastra, M.; Gaitani, N.; Kolokotsa, D.; Assimakopoulos, V. Experimental investigation of the air flow and indoor carbon dioxide concentration in classrooms with intermittent natural ventilation. Energy Build. 2008, 40, 1833–1843. [Google Scholar] [CrossRef]
  38. Ferreira, A.M.; Cardoso, S.M. Exploratory study of air quality in elementary schools, Coimbra, Portugal. Revista de Saude Publica 2013, 47, 1059–1068. [Google Scholar] [CrossRef] [PubMed]
  39. Ferreira, A.M.; Cardoso, M. Indoor air quality and health in schools. J. Bras. Pneumol. 2014, 40, 259–268. [Google Scholar] [CrossRef] [Green Version]
  40. Barmparesos, N.; Assimakopoulos, M.N.; Assimakopoulos, V.D.; Loumos, N.; Sotiriou, M.A.; Koukoumtzis, A. Indoor Air Quality and Thermal Conditions in a Primary School with a Green Roof System. Atmosphere 2018, 9, 75. [Google Scholar] [CrossRef] [Green Version]
  41. Kabir, E.; Kim, K.; Sohn, J.R.; Kweon, B.Y.; Shin, J.H. Indoor air quality assessment in child care and medical facilities in Korea. Environ. Monit. Assess. 2011, 184, 6395–6409. [Google Scholar] [CrossRef]
  42. Yoon, C.; Lee, K.; Park, D. Indoor air quality differences between urban and rural preschools in Korea. Environ. Sci. Pollut. Res. 2011, 18, 333–345. [Google Scholar] [CrossRef]
  43. Pegas, P.N.; Alves, C.; Evtyugina, M.G.; Nunes, T.; Cerqueira, M.; Franchi, M.; Pio, C.A.; Almeida, S.M.; Freitas, M.C. Indoor air quality in elementary schools of Lisbon in spring. Environ. Geochem. Health 2011, 33, 455–468. [Google Scholar] [CrossRef]
  44. Godwin, C.G.; Batterman, S.A. Indoor air quality in Michigan schools. Indoor Air 2007, 17, 109–121. [Google Scholar] [CrossRef] [PubMed] [Green Version]
  45. Fuoco, F.C.; Stabile, L.; Buonanno, G.; Trassiera, C.V.; Massimo, A.; Russi, A.G.; Mazaheri, M.; Morawska, L.; Andrade, A. Indoor Air Quality in Naturally Ventilated Italian Classrooms. Atmosphere 2015, 6, 1652–1675. [Google Scholar] [CrossRef] [Green Version]
  46. Madureira, J.; Paciência, I.; Pereira, C.; Teixeira, J.P.; Fernandes, E.D. Indoor air quality in Portuguese schools: Levels and sources of pollutants. Indoor Air 2016, 26, 526–537. [Google Scholar] [CrossRef] [PubMed] [Green Version]
  47. Mainka, A.; Zajusz-Zubek, E.; Tchounwou, P.B. Indoor Air Quality in Urban and Rural Preschools in Upper Silesia, Poland: Particulate Matter and Carbon Dioxide. Int. J. Environ. Res. Public Health 2015, 12, 7697–7711. [Google Scholar] [CrossRef] [Green Version]
  48. Sohn, J.; Yang, W.; Kim, J.; Son, B.; Park, J. Indoor air quality investigation according to age of the school buildings in Korea. J. Environ. Manag. 2009, 90, 348–354. [Google Scholar] [CrossRef]
  49. Tippayawong, N.; Khuntong, P.; Nitatwichit, C.; Khunatorn, Y.; Tantakitti, C. Indoor/outdoor relationships of size-resolved particle concentrations in naturally ventilated school environments. Build. Environ. 2009, 44, 188–197. [Google Scholar] [CrossRef]
  50. Michelot, N.; Marchand, C.; Ramalho, O.; Delmas, V.; Carrega, M. Monitoring indoor air quality in French schools and day-care centers. HVAC&R Res. 2013, 19, 1083–1089. [Google Scholar]
  51. Frommea, H.; Twardellaa, D.; Dietricha, S.; Heitmannb, D.; Schierlc, R.; Liebld, B.; Rüdene, H. Particulate matter in the indoor air of classrooms—Exploratory results from Munich and surrounding area. Atmos. Environ. 2006, 41, 854–866. [Google Scholar] [CrossRef]
  52. Verrièle, M.; Schoemaecker, C.; Hanoune, B.; Leclerc, N.; Germain, S.; Gaudion, V.; Locoge, N. The MERMAID study: Indoor and outdoor average pollutant concentrations in 10 low-energy school buildings in France. Indoor Air 2016, 26, 702–713. [Google Scholar] [CrossRef]
  53. Batterman, S.; Su, F.; Wald, A.; Watkins, F.; Godwin, C.; Thun, G. Ventilation rates in recently constructed U.S. school classrooms. Indoor Air 2017, 27, 880–890. [Google Scholar] [CrossRef]
  54. Zhang, D.; Tenpierik, M.; Bluyssen, P.M. Interaction effect of background sound type and sound pressure level on children of primary schools in the Netherlands. Appl. Acoust. 2019, 154, 161–169. [Google Scholar] [CrossRef]
  55. Bluyssen, P.M.; Kim, N.H.; Eijkelenboom, A.; Ortiz-Sanchez, M. Workshop with 335 primary school children in The Netherlands: What is needed to improve the IEQ in their classrooms? Build. Environ. 2020, 168, 106486. [Google Scholar] [CrossRef]
  56. Xing, Y.-F.; Xu, Y.-H.; Shi, M.-H.; Lian, Y.-X. The impact of PM2.5 on the human respiratory system. J. Thorac. Dis. 2016, 8, E69–E74. [Google Scholar] [PubMed]
  57. U.S. Environmental Protection Agency. The National Ambient Air Quality Standards for Particle Pollution 2012; U.S. Environmental Protection Agency: Washington, DC, USA, 2012.
  58. Daisey, J.M.; Angell, W.J.; Apte, M.G. Indoor air quality, ventilation and health symptoms in schools: An analysis of existing information. Indoor Air 2003, 13, 53–64. [Google Scholar] [CrossRef] [PubMed]
  59. Chatzidiakou, L.; Mumovic, D.; Summerfield, A.J. What do we know about indoor air quality in school classrooms? A critical review of the literature. Intell. Build. Int. 2012, 4, 228–259. [Google Scholar] [CrossRef]
  60. ASHRAE. ASHRAE/CIBSE/USGBC Performance Measurement Protocols for Commercial Buildings; ASHRAE: Atlanta, GA, USA, 2010. [Google Scholar]
  61. ASHRAE. ANSI/ASHRAE Standard 55-2017 Thermal Environmental Conditions for Human Occupancy; ASHRAE: Atlanta, GA, USA, 2017. [Google Scholar]
  62. Sterling, E.M.; Arundel, A.; Sterling, T.D. Criteria for Human Exposure to Humidity in Occupied Buildings. ASHRAE Trans. 1985, 91, 611–622. [Google Scholar]
  63. ASHRAE. ANSI/ASHRAE Standard 62.1-2010 Ventilation for Acceptable Indoor Air Quality; ASHRAE: Atlanta, GA, USA, 2010. [Google Scholar]
  64. DiLaura, D.L.; Houser, K.W.; Mistrick, R.G.; Stelly, G.R. The Lighting Handbook: Reference and Application; The Illuminating Engineering Society: New York, NY, USA, 2011. [Google Scholar]
  65. Altomonte, S.; Schiavon, S. Occupant satisfaction in LEED and non-LEED certified buildings. Build. Environ. 2013, 68, 66–76. [Google Scholar] [CrossRef]
  66. Lee, Y.S.; Kim, S.K. Indoor Environmental Quality in LEED-Certified Buildings in the U.S. J. Asian Archit. Build. Eng. 2008, 7, 293–300. [Google Scholar] [CrossRef] [Green Version]
  67. Altomonte, S.; Schiavon, S.; Kent, M.G.; Brager, G. Indoor environmental quality and occupant satisfaction in green-certified buildings. Build. Res. Inf. 2019, 47, 255–274. [Google Scholar] [CrossRef] [Green Version]
Figure 1. Low, Mean, and Peak CO2 of the Selected Studies by Environment Type.
Atmosphere 11 00081 g001
Figure 2. Low, Mean, and Peak PM2.5 of the Selected Studies by Environment Type.
Atmosphere 11 00081 g002
Figure 3. Custom-Built Continuous IEQ Monitoring Station, Desktop Type.
Atmosphere 11 00081 g003
Figure 4. Classroom Temperature Statistical Distributions by Occupancy Mode.
Atmosphere 11 00081 g004
Figure 5. Hourly Indoor Temperature and Relative Performance Analysis.
Atmosphere 11 00081 g005
Figure 6. Classroom Relative Humidity Statistical Distributions by Occupancy Mode.
Atmosphere 11 00081 g006
Figure 7. Classroom CO2 Statistical Distributions by Occupancy Mode.
Atmosphere 11 00081 g007
Figure 8. Classroom Illuminance Statistical Distributions by Occupancy Mode.
Atmosphere 11 00081 g008
Figure 9. Overall Teacher Satisfaction by IEQ Metric.
Atmosphere 11 00081 g009
Figure 10. LEED IEQ Category Score vs. Mean Quantitative IEQ Metrics During Occupied Hours.
Atmosphere 11 00081 g010
Figure 11. LEED IEQ Category Score vs. Mean Teacher Satisfaction Rating.
Atmosphere 11 00081 g011
Table 1. Number of Studies Addressing (a) Specific Indoor Air Quality (IAQ) Metrics and (b) Specific Thermal Comfort Metric and (c) Student Outcomes (Total Number of Studies = 38) [7,15,18,19,20,21,22,23,24,25,26,27,28,29,30,31,32,33,34,35,36,37,38,39,40,41,42,43,44,45,46,47,48,49,50,51,52,53].
(a) Number of Studies by IAQ Metric
VentilationCO2VOCsCH2OPM2.5/PM10Allergens
Number of Studies1226127164
(b) Number of Studies by Thermal Comfort Metric
TemperatureHumidityAir VelocityThermal Satisfaction
Number of Studies151413
(c) Number of Studies by Student Outcome
AbsenteeismTest PerformanceHealth Symptoms
Number of Studies386
Table 2. Case-Study Building Descriptions.
ID #Year BuiltYear RenovatedGross Floor Area (m2)Number of Students% Non-White StudentsLEED RatingEUI (kWh/m2/year)
#1 (HP)19322016431830058%Gold249
#2 (HP)19292013790059925%Gold268
#3 (HP)19092010796238896%Gold183
#4 (R)19162012763644294%N/A113
#5 (C)1907unknown8203272100%N/A363
Table 3. Detailed LEED Credits by School Including (a) Total Credits by Category and (b) Specific Credits Earned in the IEQ Category.
(a) Total Credits by Category
LEED CategorySchool #1 (HP)School #2 (HP)School #3 (HP)
LEED VersionSchools v3Schools v2Schools v2
LEED RatingGoldGoldGold
Total Points Earned 614849
Sustainable Sites211010
Water Efficiency645
Energy & Atmosphere1359
Materials & Resources588
Indoor Environmental Quality101613
Innovation554
Regional Priority100
(b) Specific Credits Earned in the IEQ Category
Outdoor Air Delivery Monitoring120
Mold Prevention000
Increased Ventilation001
Construction IAQ Management Plan: During Construction111
Construction IAQ Management Plan: Before Occupancy001
Low-Emitting Materials344
Indoor Chemical & Pollutant Source Control100
Lighting System Design & Controllability111
Thermal Comfort Controllability111
Thermal Comfort: Design111
Thermal Comfort: Verification111
Daylight & Views: Daylight031
Daylight & Views: Views010
Enhanced Acoustical Performance011
Table 4. Measurement Period of Each School.
ID #First Date of MeasurementLast Date of MeasurementMean Outdoor Temperature (°C)Mean Outdoor RH (%)
#1 (HP)Thursday, September 13, 2018Tuesday,
September 18, 2018.
24.482.3
#2 (HP)Thursday, August 23, 2018Tuesday,
August 28, 2018
25.573.5
#3 (HP)Thursday, August 23, 2018Tuesday,
August 28, 2018
25.573.5
#4 (R)Thursday, May 31, 2018Tuesday, June 5, 201822.773.3
#5 (C)Thursday, October 11, 2018Tuesday,
October 16, 2018.
16.579.6
Table 5. Specifications of IEQ Measurement Instrumentation.
ParameterSensor TypeAccuracyRange
Air Temperature (°C)Thermistor±0.21 °C
(from 0° to 50 °C)
−40 to 75 °C
Relative Humidity (%)Capacity polymer sensor±2% RH
(from 20% to 80% RH)
0% to 100%
Globe Temperature (°C)Thermistor±0.21 °C
(from 0° to 50 °C)
40 to 75 °C
Air speed (m/s)Thermal anemometer±0.05 m/s or 10%
of reading
0.15 m/s to 5 m/s
CO2 (ppm)Single beam absorption infrared sensor±50 ppm or ±5%
of reading
0 to 5000 ppm
Horizontal Illuminance (lux) Silicon photovoltaic detector± 5.0% of reading0 to 20,000 Lux
PM 2.5, PM10 (ug/m3)Particle Counter5% loss at 2,000,000 particles per ft30.3, 0.5, 1.0, 2.5, 5.0, 10 µm
Table 6. Mean (Standard Deviation) of the Measured IEQ Variables by Occupancy Mode.
Mode Air Temp. (°C)RH (%)Air Velocity (m/s)PMVPPD (%)CO2 (ppm)Illuminance (lux)
School #1OccCR121.2 (0.4)70.4 (1.4)0.09 (0.00)−1.4 (0.1)46.1 (8.2)607 (180)199 (99)
CR225.7 (1.0)61.9 (8.4)0.12 (0.01)0.0 (0.3)7.5 (6.3)540 (192)36.7 (12)
UnOccCR120.6 (0.5)20.6 (0.5)0.09 (0.01)−1.6 (0.1)58.1 (10.6)445 (52.5)20.6 (0.5)
CR225.2 (0.2)25.2 (0.2)0.12 (0.00)0.0 (0.1)5.6 (0.6)486 (77.9)25.2 (0.2)
WkndCR120.2 (0.3)20.2 (0.3)0.09 (0.00)−1.7 (0.1)64.9 (6.8)429 (18.1)20.3 (0.4)
CR225.3 (0.1)25.3 (0.0)0.12 (0.00)−0.1 (0.0)5.3 (0.1)417 (26.9)25.3 (0.1)
School #2OccCR125.3 (1.5)52.8 (6.5)0.1 (0.01)0.0 (0.5)11.2 (7.6)961 (267)2903 (3723)
NA-------
UnOccCR122.9 (0.8)22.9 (0.8)0.11 (0.02)−0.8 (0.3)24 (15.7)502 (155)23.0 (0.8)
NA-------
WkndCR123.2 (1.1)23.2 (1.1)0.10 (0.01)−0.7 (0.4)21.2 (11.1)422 (75)23.3 (1.1)
NA-------
School #3OccCR123.5 (1.1)50.5 (2.8)0.12 (0.01)−0.8 (0.3)22.9 (14.8)777 (150)255 (161)
CR223.3 (1.1)53.1 (3.2)0.1 (0.00)−0.8 (0.3)22 (16.4)818 (148)100 (49)
UnOccCR123.4 (0.9)23.4 (0.9)0.12 (0.01)−0.8 (0.3)21.8 (11.2)469 (74.0)23.4 (1.0)
CR222.8 (0.8)22.8 (0.8)0.10 (0.00)−0.9 (0.3)26 (12.1)492 (62.8)22.9 (0.9)
WkndCR123.3 (0.9)23.3 (0.9)0.12 (0.00)−0.9 (0.3)24.7 (10.6)443 (64.1)23.4 (1.0)
CR222.4 (0.9)22.4 (0.9)0.10 (0.00)−1.1 (0.3)34.3 (13.2)443 (49.6)22.4 (0.9)
School #4OccCR122.1 (1.1)65.9 (6)0.12 (0.01)−1.2 (0.4)37.8 (19)664 (267)702 (434)
CR221.3 (1.2)63.7 (5.8)0.11 (0.01)−1.4 (0.4)51.1 (20.1)697 (275)117 (102)
UnOccCR122.0 (1.3)22 (1.3)0.11 (0.00)−1.1 (0.5)37.1 (23.7)424 (44.9)22.1 (1.3)
CR222.6 (1.8)22.6 (1.8)0.13 (0.01)−1.0 (0.6)32.8 (27.0)484 (56.2)22.7 (1.8)
WkndCR120.7 (0.1)20.7 (0.1)0.12 (0.00)−1.6 (0.0)60.2 (3.9)395 (21.4)20.7 (0.2)
CR225.5 (0.8)25.5 (0.8)0.13 (0.00)0.0 (0.3)7.3 (2.7)445 (56.1)25.5 (0.8)
School #5OccCR122.3 (0.5)48.6 (2.6)0.13 (0.02)−1.2 (0.2)39.3 (10.7)926 (365)176 (93)
CR222.2 (0.4)49.7 (12.1)0.12 (0.01)−1.2 (0.1)40.0 (9.0)616 (126)245 (155)
UnOccCR122.5 (0.3)22.5 (0.3)0.13 (0.01)−1.1 (0.1)33.4 (6.4)547 (142)22.6 (0.3)
CR221.9 (0.5)21.9 (0.5)0.11 (0.01)−1.3 (0.1)42.1 (9.5)460 (79.3)21.9 (0.6)
WkndCR122.3 (0.3)22.3 (0.3)0.12 (0.02)−1.2 (0.1)36.7 (6.5)530 (119)22.4 (0.3)
CR222.2 (0.5)22.2 (0.5)0.11 (0.00)−1.3 (0.2)41.2 (11.3)420 (13.1)22.3 (0.6)
Table 7. One-Way ANOVA Summary Table for Measured IEQ Variables by School.
IEQ MetricSum of SquaresdfMean SquareFSig.
Air Temp. (°C)17274432 1440.00
RH (%)985,2214246,305 50190.00
Air Velocity (m/s)0.540.1 6860.00
CO213,255,75443,313,938 1120.00
Illuminance (lux)2,110,066,9084527,516,7274290.00
Table 8. Fishers LSD Analysis for Classroom Temperature by School.
School #School #Mean DifferenceStd. ErrorSig.Lower BoundUpper Bound
#1#2−0.590.060.00−0.70−0.48
#3−0.020.050.73−0.110.08
#40.300.050.000.220.39
#50.660.050.000.570.75
#2#30.570.060.000.460.68
#40.890.060.000.781.00
#51.250.060.001.141.36
#3#40.320.050.000.230.42
#50.680.050.000.580.77
#4#50.350.050.000 0.270.44
Table 9. Fishers LSD Analysis for Relative Humidity by School.
School #School #Mean DifferenceStd. ErrorSig.Lower BoundUpper Bound
#1#29.700.230.009.2510.14
#314.700.190.0014.3215.08
#4−2.730.180.00−3.09−2.37
#519.170.180.0018.8119.53
#2#35.010.230.004.555.46
#4−12.430.230.00−12.87−11.99
#59.470.230.009.039.92
#3#4−17.430.190.00−17.82−17.05
#54.470.190.004.094.85
#4#521.900.180.0021.5422.26
Table 10. Fishers LSD Analysis for CO2 by School.
School #School #Mean DifferenceStd. ErrorSig.Lower BoundUpper Bound
#1#2−78.515.540.00−89.38−67.65
#3−63.304.760.00−72.63−53.97
#4−14.484.530.00−23.35−5.61
#5−74.264.530.00−83.13−65.39
#2#315.215.730.013.9726.45
#464.035.540.0053.1774.89
#54.255.540.44−6.6115.11
#3#448.824.760.0039.4958.14
#5−10.964.760.02−20.29−1.64
#4#5−59.784.530.00−68.65−50.91
Table 11. PM2.5 Concentration (ug/m3) by Location.
School #1School #2School #3School #4School #5
Classroom #16.499.813.887.432.9
Classroom #25.2147.78.9144.038.9
Outdoor4.5226.922.285.889.4
Indoor Mean5.8123.711.3115.735.9
I/O Ratio1.280.550.511.350.40
Table 12. Fishers LSD Analysis for Classroom Illuminance by School.
School #School #Mean DifferenceStd. ErrorSig.Lower BoundUpper Bound
#1#2−1338.735.80.00−1408.9−1268.5
#3−52.530.70.09−112.87.8
#4−128.429.20.00−185.7−71.1
#5−53.629.20.07−110.93.7
#2#31286.237.00.001213.61358.8
#41210.335.80.001140.11280.5
#51285.135.80.001215.01355.3
#3#4−75.930.70.01−136.2−15.7
#5−1.130.70.97−61.359.2
#4#574.929.20.0117.5132.2
Table 13. Mean Teacher Satisfaction Rating by School.
IEQ MetricSchool #1School #2School #3School #4School #5
Thermal Comfort1.29−0.33−1.670.00−0.82
IAQ−0.57−1.00−0.11−0.710.45
Lighting Level1.833.002.251.362.67
Visual Comfort0.832.670.880.642.00
Noise Level2.172.331.50−0.211.22
Sound Privacy2.170.671.381.001.75

