Abstract
Mineral dust aerosols, which comprise multiple mineral species, are transported far from their source desert areas to the open ocean. After an Asian dust outflow event was observed over a marine boundary layer in the western North Pacific on February 29, 2012 on research vessel (R/V) Hakuho Maru, two dust particles of about 6 μm diameter were analyzed. First, they were sliced by using a focused ion beam (FIB). Their mineralogical structures and the elemental distribution of their cross-sections were subsequently analyzed with the use of transmission electron microscopy (TEM) and energy-dispersive X ray spectrometry (EDS). These analyses revealed that the dust particles consisted mainly of calcite and silica. Furthermore, Fe-containing domains were found in the submicrometer area surrounded by calcite and silica. A sulfur-containing domain that co-exists with calcium was found in a small domain near the particle surface, but no clear sign of atmospheric aging was found in most of the calcite domain. The inhomogeneous particle structure implies that the dissolution of iron and calcite in dust particles after ocean deposition depends on the physical structures of particles and their degree of aging according to atmospheric conditions during transport. Those factors must be adequately treated when estimating Asian dust effects on marine primary production.
1. Introduction
Asian dust is blown by dust-storms from arid and semi-arid continental areas in eastern Asia. It is then transported long distances to broad remote regions including the North Pacific. During spring time, large amounts of Asian dust are transported to the North Pacific [1], where they are deposited into the ocean, thereby stimulating phytoplankton blooms in the western North Pacific region [2]. There, iron availability limits primary production by marine phytoplankton, which is the so-called high-nutrient low-chlorophyll (HNLC) condition [3]. Based on the observed scale of dust events, estimates that were done using the solubilities of iron in dust particles in their source regions have indicated that the dissolved iron influx from deposited Asian dust is sufficient to stimulate phytoplankton blooms in the HNLC water [2]. Nevertheless, the atmospheric conditions and scale of dust events vary. Moreover, the physicochemical properties of dust particles can change through deposition and atmospheric chemical (aging) processes during long-range transport [4,5,6,7,8,9,10], both of which cause variations of the soluble-iron supply to broad ocean areas.
The iron solubility of mineral dust particles in their source regions tends to be lower than that of the atmospheric particles collected around industrial areas [4]. Mineral dust aerosols commonly exist as coarse particles with super-micrometer diameters. They comprise multiple mineral species such as quartz, calcite, and feldspars [11,12,13]. Most of the main chemical substances are insoluble or are poorly soluble in seawater. If the trace iron component was encapsulated beyond the particle surface, then the iron component would be neither exposed to nor dissolved in seawater after deposition into the ocean. Therefore, the amount of dissolved iron after deposition in the ocean might be controlled not only by the amount and solubility of iron but also by the co-existence of chemical species, their surface, and their internal distribution in atmospheric dust aerosols.
As one example, particles containing calcium and sulfur, which are regarded as aged calcite (CaCO3) particles, have often been found via electron microscopy to be ca. 2 μm droplet-like particles. That size and composition indicate possible atmospheric aging through heterogeneous reactions occurring between calcium carbonate and sulfuric acid [14,15]. Though unreacted calcite is poorly soluble, such atmospheric aging and subsequent chemical transformation, e.g., from calcite into calcium sulfate or calcium nitrate, can markedly alter the particle’s solubility. Table 1 presents reports that describe Ca-rich particles of Asian dust by individual analyses done via electron microscopy. Often, Ca-rich particles containing S of a few micrometers tend to be found at urban sites near dust sources [14,15,16,17]. Several studies have elucidated Asian dust events around Hawaii, describing large fractions of Ca-rich particles containing sulfur [17,18]. Asian dust laden with giant dust particles larger than 10 μm was observed in Korea [13]. Coarse particles larger than several micrometers can be important carriers of minerals. Given the heterogeneous nature of the internal chemical and mineralogical structures of coarse-sized dust, such chemical transformations can be expected to occur heterogeneously inside dust particles. The degree of chemical transformation and its effects on the internal mineralogical structure in dust particles might promote the enhanced dissolution of iron in the particles. Nevertheless, the internal structures for calcite and iron in coarse particles of Asian dust have rarely been reported [11,13]. The degree of transformation at dust arrival to HLNC areas of the western North Pacific is especially important in terms of its effects on marine biological activity, although such effects have still not been characterized.

Table 1.
Studies of individual, Ca-rich Asian dust particles by using electron microscopy.
By using scanning electron microscopy (SEM) and transmission electron microscopy (TEM) combined with an energy-dispersive X-ray spectrometer (EDS) analyzer, the elemental distribution and morphology of individual dust particles have widely been studied [14,15,16,17,18,19,20]. EDS analysis probes the elemental composition of dust particles from the surface to a few micrometers of depth from the surface. Therefore, EDS analysis can elucidate the average elemental composition of their surface and internal composition in the analysis of atmospheric dust particles. To ascertain the internal elemental distribution within aerosol particles such as dust and fly ash, several recent studies used a focused ion beam (FIB) to mill/slice particles. They then analyzed the sliced cross-sections by using SEM/TEM-EDS [11,12,13,21,22,23]. Such analytical approaches remain quite limited, probably because of the difficulty in FIB sample milling and slicing, as well as their subsequent sample handling processes. However, such methods are expected to provide useful information related to the distribution of minerals within dust particles.
To characterize the internal chemical and mineralogical structure of long-range transported dust particles, we collected Asian dust particles in the western North Pacific during a research vessel (R/V) Hakuho Maru research cruise (KH-12-1; December 1 2011–March 7 2012). We also conducted cross-section observations of two particles by using TEM analysis combined with FIB particle milling/slicing. Specific attention was devoted to iron-containing domains and their surrounding composition in individual dust particles. This study particularly examines atmospheric aging, its effects on the internal mineralogical structure and the elemental distribution of the dust particles, and the possible enhancement of iron dissolution from dust aerosols after deposition into seawater.
2. Dust Aerosol Sampling and Laboratory Analysis
2.1. Shipboard Sample Collection and Peripheral Aerosol Measurement
Atmospheric aerosol sampling and aerosol measurements, including meteorological observations, were conducted onboard the R/V Hakuho Maru during an equatorial pacific ocean and stratospheric/tropospheric atmosphere study (EqPOS) cruise (cruise ID: KH-11-10 and KH-12-1) [24,25,26,27,28]. Details of the cruises and aerosol number concentration measurements were reported by Ueda et al. [28]. Briefly, the number concentrations of dried aerosol particles were continuously measured with a laser particle counter (LPC, KC01D; Rion Co. Ltd., Tokyo, Japan) and five size bins (>0.3, 0.5, 1, 2, and 5 μm). The LPC was placed inside a container box on the compass deck of the ship. When the ship’s exhaust affected the LPC measurement, the observation data were screened out and were not used for additional data analysis. Ueda et al. [28] presented additional details.
Water-soluble ion concentrations in aerosols were analyzed similarly to the method described by Jung et al. [29]. Briefly, marine aerosols were collected on Teflon filters (90 mm diameter, PF040; Advantec Toyo Kaisha Ltd., Tokyo, Japan) by using a high-volume (13 m3 h−1) virtual impactor air sampler (AS-9; Kimoto Electric Co. Ltd., Osaka, Japan). The sampler used inertial force to separate aerosols according to their aerodynamic diameters. They were segregated into fine (D < 2.5 μm) and coarse (D > 2.5 μm) modes on the same filter. The aerosol sampler was placed at the front of the compass deck of the ship. To avoid contamination from the ship’s exhaust, a wind-select controller was set to collect aerosol samples only when the relative wind direction was within ±100° from the ship’s bow and when the relative wind speed was greater than 1 m s−1. After taking samples back to the laboratory, water-soluble ion analysis was conducted. Each aerosol sample was first ultrasonically extracted with 50 mL of Milli-Q water and was then filtered through a polytetrafluoroethylene syringe filter (13 mm diameter, 0.45 μm pore-size membrane filter; Millipore Corp, Darmstadt, Germany) to remove water-insoluble substances. The filtrates were subsequently analyzed by using ion chromatography (IC; Dionex-320; Thermo Scientific Dionex, Sunnyvale, CA, USA).
A seven-day backward trajectory analysis was conducted to diagnose the origins of the air masses encountered during the cruises by using a Hybrid Single-Particle Lagrangian Integrated Trajectory (HYSPLIT 4) model that was developed by the National Oceanic and Atmospheric Administration (NOAA) Air Resources Laboratory (ARL) [30,31]. The seven-day backward trajectory calculations were initiated from the ship’s locations at three altitudes (500, 1000, and 1500 m a.s.l.). The model vertical velocity and GOSAT Data Archive Service (GDAS) meteorological data were used, respectively, as the vertical mode calculation method and the meteorological dataset.
Aerosol samples during dust events for TEM analysis were collected with reference to real-time number concentrations. Samples were collected at the upwind side of the ship when the ship stayed at an ocean observation point. A low-pressure cascade impactor (Model I-1L; PIXE Int. Corp., Middleton, PA, USA) was used with a flow rate of 1 L/min for sampling to collect coarse atmospheric aerosols. A Ti aerosol collection plate was placed on an impaction stage (50% cut-off diameter of 2 μm). The collected aerosol samples were stored at room temperature ca. 25 °C in a well-closed container under dry conditions until FIB analyses were performed.
2.2. Preparation of Particle Cross-Sections with FIB and Detailed Analysis Using TEM-EDS-SAED
Cross-sections of individual dust particles were prepared by using an FIB-SEM system that incorporated dual-beam focused ion beam (FIB) milling and an SEM imaging system (JIB-4500FE; JEOL, Tokyo, Japan). The instrument incorporated a scanning electron microscope (SEM) with a Schottky-type emitter and FIB. The FIB used an accelerated Ga ion beam, not only for fine sample milling but also for scanning ion microscope (SIM) surface observation and the deposition of carbon to the sample surface. The FIB column was attached at a 53° tilted angle relative to SEM column. The sample stage was also freely tilted relative to the columns. The FIB-SEM system was useful for deposition and milling from several directions. SIM surface observation causes more sample damage than SEM observation. Therefore, to the greatest extent possible, SEM was used to observe the surfaces and cross-sections of the samples after milling.
Using the FIB-SEM system, sliced particle samples were prepared for cross-section observation with TEM according to the following procedure. First, the sample Ti plate was placed inside the FIB-SEM system. Sample dust particles larger than 5 μm of diameter were selected for cross-section preparation. Then, a carbon coating was deposited around the target region of the target sample particle by FIB to minimize damage to the sample. This process also adhered the particle to the Ti plate. Next, the area around the target region in the particle, including the Ti plate, was milled by the FIB. The sliced portion of the particle and the Ti plate were then adhered to a microprobe by carbon deposition to be transferred to a half-round Cu TEM grid that was placed vertically beside the Ti plate. On the TEM grid, the target sliced portion was again carefully milled to a particle cross-section thickness of less than 200 nm, which is an acceptable thickness for TEM observations. Because the FIB slicing procedure is quite time-consuming and cumbersome, it was inapplicable for the analysis of numerous particles. Sliced particles easily broke up and were weak. For this study, we conducted FIB slicing for 11 particles. However, only two particles were processed on the TEM grid; they were analyzed with TEM.
Observations of the particle cross-sections of sliced particles on the TEM grid were conducted by using TEM (H-9000NAR; Hitachi Ltd., Tokyo, Japan) at Tokyo University of Science, including selected-area electron diffraction (SAED) analysis. The EDS analyses of Dust Particle 1 were conducted with a TEM (H-9500NAR; Hitachi Ltd., Tokyo, Japan) with an Lanthanum hexaboride (LaB6) thermal emission gun operated in scanning transmission electron microscopy (STEM) mode at 200 keV. The microscope was equipped with an Si (Li) EDS detector (Genesis 2000; Ametek Inc., Berwyn, PA, USA). We acquired EDS hyperspectral imaging (HSI) data by scanning a focused electron probe in STEM mode. They were sampled by 256 × 256 pixels for 5 min. Referenced to detected EDS spectra from the whole view field before scanning, STEM-EDS elemental maps were extracted from the EDS-HSI data for Al, Ca, C, Cl, Cu, Fe, Ga, Na, O, Si, S, and Ti after appropriate peak separation and background subtraction by using software (EDAX Genesis; Edax Inc., Berwyn, PA, USA). The dot size was 42 × 42 nm in the observed field at ×25 k magnification. We conducted EDS analyses of Dust Particle 2 by using TEM (JEM-2100plus; JEOL Ltd., Tokyo, Japan) with an LaB6 thermal emission gun operated in STEM mode at 200 keV. The microscope was equipped with a silicon drift EDS detector (EX-24200M1G2T; JEOL Ltd., Japan). We sampled EDS-HSI data for 7 min and kept them for each dot of 256 × 256 pixels by using software (NSS 3; Thermo Fisher Scientific Inc., Hampton, NH, USA). The dot size was 26 × 26 nm in the observed field at ×20 k magnification. Ti and Cu were contained in the sample plate and the TEM grid. Ga and C were used, respectively, for milling and deposition by FIB. Elemental maps of Ti, Ga, and C were not used because the separation of their signals from the background was difficult. O and Na were also not reliably detected because their characteristic X ray wavelengths overlapped with those of Ti and Ga. Clearly, an Na-rich domain was not found from the cross-section of the particles. The SAED pattern was analyzed with analytical software (EDA; The University of Tokyo, http://www-gbs.eps.s.u-tokyo.ac.jp/kogure/EDANA/EDA/EDANA.htm [32]).
3. Results
3.1. Sampling Condition of Long-Range Transported Dust Particles
A dust event was observed on February 29, 2012, when the ship was at 27.68 N°, 169.41 E° during leg 2 of the KH-12-1 cruise en route from Honolulu to Tokyo (February 22–March 7, 2012), about 4000 km from the Asian continent. On-board LPC aerosol number concentration measurements (Figure 1) clearly showed that the coarse aerosol (D > 5 µm) concentration increased by one order of magnitude during the dust outflow event. In a high-wind condition, the generation of sea salt particles by wave-breaking might be enhanced and might contribute to an observed increase in coarse aerosols. However, the wind speed during the dust event was less than 10 m∙s−1. In addition, the concentration of particulate Na+ remained rather constant during February 27–29, but the non-sea-salt (nss)-Ca2+ concentration in the coarse aerosol abruptly increased on February 29. Therefore, the sudden increase in the coarse aerosol number concentrations observed on February 29 could be regarded as a dust event. The backward air mass trajectory analysis suggested that the air mass at 500 m a.s.l. encountered on February 29 originated from around Japan, whereas those at 1000 and 1500 m a.s.l. originated from the Asian continent and passed over the Taklamakan Desert region. Before the Asian dust outflow event on February 29, 2012, nss-SO42− and NO3− concentrations also remained high during February 27–29. NO3− is a good indicator of anthropogenic influence. One can infer that NO3− particles of >2.5 µm would be produced by the Cl− displacement of sea salt particles by HNO3. HNO3 tends to preferentially displace the Cl− of sea salt particles compared to SO2 because of the high uptake coefficient to sea salt [33]. In addition to anthropogenic influences, nss-SO42− is formed by the oxidation of dimethyl sulfide originated marine biota. The temporal change of total nss-SO42− in the period corresponded to that of NO3−, suggesting effects of Asian outflow. The temporal change of these concentrations was asynchronous with the increase of nss-Ca2+, suggesting that the dust event augmented the effects of the first event of the long-range transportation of anthropogenic Asian outflow. The long-range transportation of dust particles from the Asian continent followed on February 29, 2012.
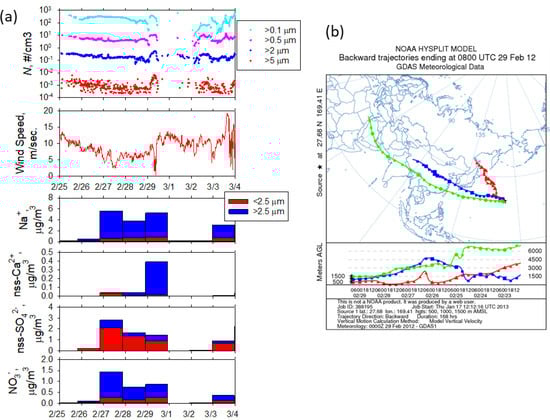
Figure 1.
(a) Temporal variations of aerosol number concentration (N), wind speed, and concentrations of Na+, nss-Ca2+, nss-SO42+, and NO3−. (b) 168 h horizontal backward trajectories for the dust event on February 29, 2012. The trajectories represented by the red, blue, and light green lines were, respectively, were calculated for altitudes of 500, 1000, and 1500 m above sea level.
During the dust event, atmospheric aerosols were collected between 7:13 and 7:40 a.m. (UT) on 29 February 2012. Continuous LPC aerosol number concentration measurements and relative wind direction data indicated that the sampling was unaffected by ship exhaust contamination.
3.2. Dust Particles Collected at the Western North Pacific
The SEM image shown in Figure 2a presents an example of the dust particles collected during the dust event. The image shows that coarse atmospheric particles with diameters larger than several micrometers were collected on the Ti plate. Most of the collected micrometer-size particles had a dust-like rough surface rather than a cubic-crystalline shape, which is typical of sea-salt particles. Among the dust-like micrometer-sized particles, two particles of the sample that were large were sliced and analyzed. The particles were designated as Dust Particle 1 and Dust Particle 2. They are shown, respectively, in Figure 2b,c. Each particle had a rough surface and dust-like shape. Their diameters were approximately 6 μm. An EDS elemental analysis showed that primary chemical components of the particles were Ca and Si, supporting the inference of Particles 1 and 2 as dust particles. Section 3.2 presents additional details. By FIB milling, thin sections (approximately 200 nm thickness) shown as broken white lines in Figure 2b,c, were prepared for additional detailed TEM analyses.
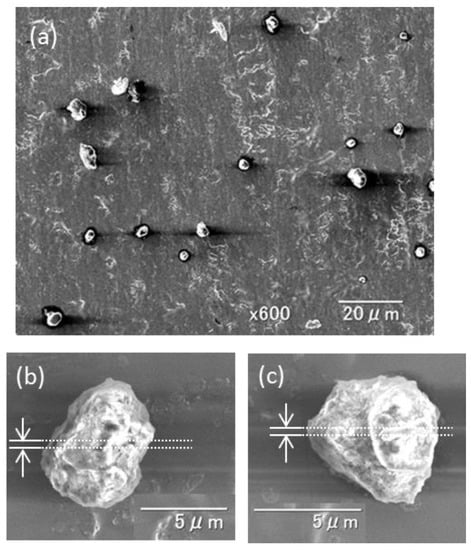
Figure 2.
(a) Example SEM image of particles collected on the Ti plate during the dust event. SEM images of the dust particles were sliced by the focused ion beam (FIB) milling and were used for additional TEM and selected-area electron diffraction (SAED) analyses. (b) Dust Particle 1 and (c) Dust Particle 2. Cross-sections between the broken lines were used for detailed TEM analyses.
3.3. Detailed TEM Analysis of Dust Particle Cross-Sections
Figure 3a,b presents cross-sections of the Dust Particles 1 and 2 that were observed with TEM. The cross-sections of the particles are inside the broken white lines in the figure. Outside of the broken white lines are the Ti plate or the carbon deposit added during FIB processing. The TEM images clearly show that several domains existed with different contrasts. To examine their local crystalline structures, an SAED analysis was applied for the spots A–F. The obtained diffraction patterns are presented as Figure 3c,d. Spots B, C, and D in Dust Particle 1 and spot E in Dust Particle 2 show periodic patterns of bright spots, indicating their crystal structure. However, no periodic diffraction pattern was observed in spot A in Dust Particle 1 or in spot F in Dust Particle 2, suggesting that the two regions (A and F) were amorphous.
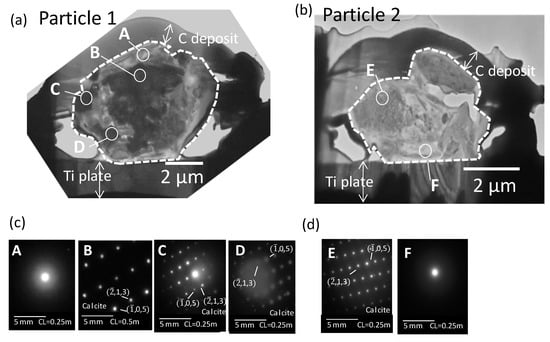
Figure 3.
Transmission electron microphotograph of the cross-sections of Dust Particles 1 (a) and 2 (b) and SAED patterns for the spots A–D in the Dust particle 1 (c) and for the spots E and F in the Dust particle 2 (d). The particle part borders are presented as broken white lines. CL is the camera length.
Figure 4a presents a TEM image and the internal distribution of Ca, Si, and Fe within Dust Particle 1. Calcium was detected from large parts of the particles. S, Al and Cl-rich domains were not found in the cross-sections of the particles. Spots B, C, and D were Ca-rich domains. Therefore, the SAED patterns observed in the spots were compared with those of the SAED reference data of Ca compounds (Ca, Ca (OH)2, and CaCO3). Among these compounds, the SAED patterns observed in spots B, C, and D matched that of calcite (CaCO3, the unit cell with a = 4.990 and c = 17.00 with the space group R3c (at room temperature) [34]) for zone axes [1,5,7]. However, some observed reflection corresponded to forbidden reflection of calcite (−2,1,3). The forbidden reflection can have intensity, which caused by modulation from impurities, multipath reflection, and ordering of cation. As with the other minerals that have close cell constants to calcite, the SAED patterns of dolomite (CaMg(CO3)2) were also similar to those in spots B, C, and D. Though a clear peak of Mg was not detected from the EDS spectra for whole field view, some dolomite might have existed with calcite. Spot A and the right-hand side of Dust Particle 1 were Si-rich regions with little Ca content. The SAED pattern in spot A showed that the area was amorphous. Though discerning the low sample Fe from background noise was difficult, some areas that had slightly higher area-density of Fe were observed, mainly inside the particles. In Figure 5a, the internal heterogeneous chemical and mineralogical structures of Dust Particle 1 can be deduced based on the TEM image above. In addition, the results of SAED and EDS analyses are presented.
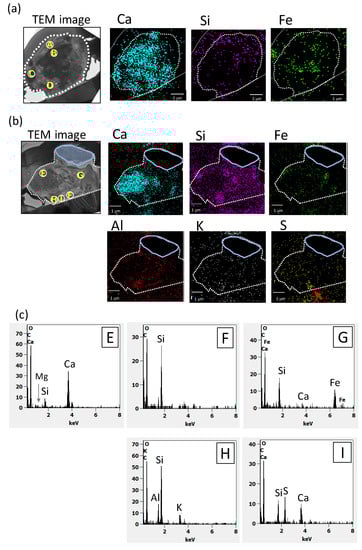
Figure 4.
TEM images and EDS element maps of Dust Particles 1 and 2 and EDS spectra: (a) Dust Particle 1, (b) Dust Particle 2 and (c) EDS spectra for spots E–I in Dust particle 2. The maps are X-ray counts after background subtraction. Borders of the particle cross-section are presented as broken white lines. In Dust Particle 2, the region surrounded by a solid light blue line is the portion that was lost before the EDS analysis.
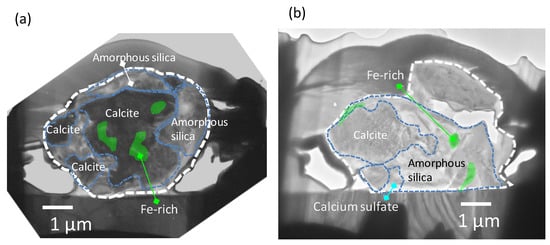
Figure 5.
Deduced internal heterogeneous chemical and mineralogical structures within the cross-sections of Dust Particles 1 (a) and 2 (b) based on results of TEM, EDS, and SAED analyses.
In Figure 4b, a TEM image and elemental mapping of Dust Particle 2 are presented, showing Ca, Si, Fe, Al, K, and S with EDS spectra for areas E–I. Unfortunately, the upper right part of Dust Particle 2 was lost during sample handling before the EDS analysis. Several Ca-rich domains were found, including spot E. Small peaks of Si and Mg was also detected with high-Ca from EDS spectra for spot E. The SAED patterns obtained from spot E also matched that of the calcite (zone axis [1,5,7]) containing the forbidden reflections. Based on the analysis of EDS spectra, the molar ratio of Mg to Ca was 0.1 for spot E. These results support the idea that the area was composed mainly of calcite but contained a small amount of dolomite. Several Si-rich small domains without Ca were also found, including spot F. The SAED patterns of spot F suggested amorphous silica. In a Si-rich domain, including spot H, both Al and K were found to be abundant.
Sulfur was also detected in a domain in spot I (shown as a red arrow in the S-map of Figure 4b). Ca and Si peaks were found in EDS spectra of spot I. The area might have contained calcium sulfate. Though Fe was undetected from large area of the cross-section, Fe-rich small domains were found in spot G. The domains corresponded to those observed as high contrast region in the TEM images (Figure 3b). In Figure 5b, the internal heterogeneous chemical and mineralogical structure of Dust Particle 2 can be deduced based on the above TEM image, and the SAED and EDS analyses are presented. One small Fe-rich region was close to the surface of the particle (above the Ca-rich region). However, other Fe-rich regions were located inside the particle and mainly inside the amorphous-silica regions, implying that most of the Fe was confined inside the dust particles. It is noteworthy that surfaces of the examined dust particles exhibited no clear sign of surface chemical modification by atmospheric aging.
4. Discussion
The present results demonstrate that the analyzed coarse dust particles that had been transported long distances from the western North Pacific were composed mainly of amorphous silica and calcite. The Fe was detected mainly inside the particles. Jeong and Nousiainen reported the characteristics of the internal structure of Asian dust particles that were collected in Korea, a country that is much closer to the dust source region than the dust sampling location that was used for this study while using a similar combined FIB thin-slice preparation and TEM analysis [11]. Their reports revealed that individual dust particles consisted of numerous mineral grains that were classifiable into internal structures of several types: single and polycrystalline cores of quartz, feldspars, calcite, and amphibole. They also found that iron oxide was distributed as submicrometer grains inside the main minerals, such as clay. Conny [23] reported the elemental distributions of five atmospheric dust particles collected in Atlanta, Georgia, USA, using EDS with a FIB-SEM system. Results showed approximately 2 μm iron grains in the dust particles with diameters larger than 10 μm, and these particles were composed mainly of dolomite [20]. Most Fe-rich parts in this study were also grains smaller than 1 μm that were surrounded by amorphous silica and calcite. Actually, SiO2 and CaCO3 are, respectively, insoluble and poorly soluble in water. The Fe encapsulated by such compounds might not contribute to the enhancement of marine biological activity in oligotrophic oceans after deposition.
A calcium sulfate domain with a size of 2 μm was found in Dust Particle 2. Earlier reports have described droplet particles that contained both calcium and sulfur in Asian dust particles (approximately 2 μm diameter) in an urban area in China [14,15]. Those results suggest that atmospheric processing of calcite caused the calcium sulfate formation. The water solubility of CaSO4 is higher than that of CaCO3, which would assist the dissolution of particles and their composition into seawater. The co-existence of calcite and sulfur in the same domain was found for Dust Particle 2. Conny et al. [18] reported the similar co-existence of sulfur on the surface of Asian dust particles collected in Hawaii from an element map while using FIB-SEM, although they did not provide the elemental distribution of a cross-section of the dust. They also reported that sulfur was detected in all Ca-rich particles. However, no such co-existence was observed in earlier studies that specifically examined the internal structure of Asian dust particles closer to the dust source region and that used FIB-SEM techniques [11,13]. In this study, in spite of this co-existence, no clear sign of atmospheric aging was found in the large part of calcite, including that bounded particle surface.
Backward trajectory analyses at 1000 and 1500 m a.s.l. indicated that the air mass that transported dust particles to the sampling site passed at high altitude (higher than 3000 m a.s.l.) over the populated and industrialized eastern Asian continental region. However, the trajectory at 500 m a.s.l. did not pass over the Taklamakan Desert. Therefore, the observed coarse particles were inferred to have been dust particles that had been deposited from high altitudes. The nss-SO42− concentration on the event day was lower than that on earlier days, whereas the nss-Ca+ concentration was much higher on the event day. These results from backward trajectory analysis and temporal behavior of nss-SO42− and nss-Ca+ concentrations suggest that the observed dust particles were transported through the higher altitudes, whereas anthropogenic Asian continental outflow was transported mainly through low altitudes. The transition from calcite to calcium sulfate in the atmosphere is regarded as occurring by chemical reaction with sulfuric acid [15]. The dust particles in this study mostly consisted of non-hygroscopic compounds. Therefore, coagulation with a sulfuric acid droplet or uptake of acidic gas to solid phase calcite would be necessary for the progress of the transition. Though coagulation can frequently occur under a higher number concentration of aerosols, the number concentration of aerosols during this observation was one order less for the 0.1 µm diameter particles than that those near Japan [28]. In addition, SO2, which is a precursor of gaseous and droplet H2SO4, can decrease by diffusion, the displacement of sea salt, particulation, and deposition during transport. Dust lifted at the source might have mixed with the air mass at lower altitudes through the deposition process after the decrease of aerosols and acidic gases, settling out to marine surface atmosphere. That process might have led to a lesser aging of coarse dust.
It is also interesting that only a certain domain of the particle exhibited signs of atmospheric aging, which might imply an inhomogeneous structure of dust particles and subsequent inhomogeneous atmospheric aging in atmospheric dust particles. Though more particles must be examined for additional clarification, the degree of atmospheric aging during long-range transportation of particles might be different depending on the atmospheric conditions in their pathway. Consequently, the degree of chemical transformation and the internal chemical and mineralogical structures in atmospheric dust particles might also be different, which is quite important in the quantitative terms of supplying trace metals into the ocean and promoting marine primary production in HNLC oceans.
5. Conclusions
To elucidate the internal chemical and mineralogical structures of coarse dust particles that had been transported long distances from the Asian continent to the HNLC areas of the western North Pacific, dust particles collected on shipboard were thin-sliced by using FIB. The TEM images of the particle cross-sections revealed the existence of multiple domains containing different substances within the dust particles, a fact that was also supported by results of SAED and EDS analyses of the sliced particle cross-sections. Unfortunately, the success rate of such sample preparation was low because of the difficulty of FIB processing and the brittleness of the sliced samples. Only a few sample particles were successfully analyzed.
Asian dust particles with diameters of approximately 6 μm that were collected over the western North Pacific were analyzed. Detailed microscopic analyses showed that the observed dust particles were composed mainly of amorphous silica and calcite, whereas Fe-rich domains were found inside the particles as submicrometer-diameter grains. This finding suggests that super-micrometer mineral dust particles have potential as large carriers of iron to HNLC regions of the western North Pacific, but it also suggests that it is difficult for a large part of the iron to dissolve because of the physical structure of the dust particles. Therefore, to estimate stimulation to phytoplankton blooms in the HNLC water, the solubilities of iron in dust particles should be adequately treated according to the event dust particle size.
Though the transition of calcite to calcium sulfate by long-range transport was expected based on earlier studies, no sign of aging was found over wide areas of calcite-rich regions. Sulfur was only found in association with calcium within a small domain closer to the particle surface. Long-range transport at high altitudes might have slowed the aging of calcite. However, inhomogeneous internal structures of calcium compounds in dust particles also implied possible inhomogeneous atmospheric aging on the atmospheric dust particles. Such a degree of aging might vary depending on atmospheric conditions during transport and particle size, and acknowledging such aging is quite important for estimating the effects of Asian dust particles on stimulating marine primary production after deposition into the ocean. Therefore, a further investigation of actual atmospheric dust particles to assess their degree of aging and their size distribution in different transport and atmospheric conditions is required.
Author Contributions
Investigation, S.U., Y.M., H.K. and H.N.; writing and original draft preparation, S.U.; supervision, K.M.; project administration, H.F. and M.U.; funding acquisition, S.U., K.M. and M.U. All authors have read and agreed to the published version of the manuscript.
Funding
This research was funded by a Grant-in-Aid for Scientific Research, Category C, grant number 22510019 and a Grant-in-Aid for JSPS Research Fellows, grant number 18 J40204 from JSPS, funded by the Steel Foundation for Environmental Protection Technology, and funded by the Sasakawa Scientific Research Grant from the Japan Science Society.
Acknowledgments
We thank the crews of R/V Hakuho Maru during KH-11-10 and KH-12-1 cruises for their kind assistance with our shipboard observations. We especially thank R. Kawata for contributing to atmospheric observations during the cruises and the data analysis at the Atmosphere and Ocean Research Institute, The University of Tokyo. We express our gratitude also for technical support at the High Voltage Electron Microscope Laboratory of Nagoya University. We gratefully acknowledge the NOAA Air Research Laboratory (ARL) for provision of the HYSPLIT transport and dispersion model. This study was partly supported by a Grant-in-Aid for Scientific Research, Category C (Grant No. 22510019) and a Grant-in-Aid for JSPS Fellows (Grant No. 18 J40204) from JSPS, supported by the Steel Foundation for Environmental Protection Technology, and supported by the Sasakawa Scientific Research Grant from the Japan Science Society.
Conflicts of Interest
The authors declare that they have no conflict of interest.
References
- Uematsu, M.; Duce, R.A.; Prospero, J.M.; Chen, L.; Merrill, J.T.; McDonald, R.L. Transport of mineral aerosol from Asia over the North Pacific Ocean. J. Geophys. Res. 1893, 88, 5343–5352. [Google Scholar] [CrossRef]
- Iwamoto, Y.; Yumimoto, K.; Toratani, M.; Tsuda, A.; Miura, K.; Uno, I.; Uematsu, M. Biogeochemical implications of increased mineral particle concentrations in surface waters of the northwestern North Pacific during an Asian dust event. Geophys. Res. Lett. 2011, 38, L01604. [Google Scholar] [CrossRef]
- Harrison, P.J.; Boyd, P.W.; Varela, D.E.; Takeda, S.; Shiomoto, A.; Odate, T. Comparison of factors controlling phytoplankton productivity in the NE and NW subarctic Pacific gyres. Prog. Oceanogr. 1999, 43, 205–234. [Google Scholar] [CrossRef]
- Ingall, E.D.; Feng, Y.; Longo, A.F.; Lai, B.; Shelley, R.U.; Landing, W.M.; Morton, P.L.; Nenes, A.; Mihalopoulos, N.; Violaki, K.; et al. Enhanced Iron Solubility at Low pH in Global Aerosols. Atmosphere 2018, 9, 201. [Google Scholar] [CrossRef]
- Baker, A.R.; Jickells, T.D. Mineral particle size as a control on aerosol iron solubility. Geophys. Res. Lett. 2006, 33. [Google Scholar] [CrossRef]
- Sullivan, R.C.; Guazzotti, S.A.; Sodeman, D.A.; Prather, K.A. Direct observations of the atmospheric processing of Asian mineral dust. Atmos. Chem. Phys. 2007, 7, 1213–1236. [Google Scholar] [CrossRef]
- Journet, E.; Desboeufs, K.V.; Caquineau, S.; Colin, J.L. Mineralogy as a critical factor of dust iron solubility. Geophys. Res. Lett. 2008, 35. [Google Scholar] [CrossRef]
- Kumar, A.; Sarin, M. Aerosol iron solubility in a semi-arid region: Temporal trend and impact of anthropogenic sources. Tellus Ser. B Chem. Phys. Meteorol. 2009, 62, 125–132. [Google Scholar] [CrossRef]
- Li, J.; Osada, K. Water-insoluble particles in spring snow at Mt. Tateyama, Japan: Characteristics of the shape factors and size distribution in relation with their origin and transportation. J. Meteorol. Sci. Jpn. 2007, 85, 137–149. [Google Scholar] [CrossRef]
- Li, J.; Osada, K. Preferential settling of elongated mineral dust particles in the atmosphere. Geophys. Res. Lett. 2007, 34. [Google Scholar] [CrossRef]
- Jeong, G.Y.; Nousiainen, T. TEM analysis of the internal structures and mineralogy of Asian dust particles and the implications for optical modeling. Atmos. Chem. Phys. 2014, 14, 7233–7254. [Google Scholar] [CrossRef]
- Jeong, G.Y.; Park, M.Y.; Kandler, K.; Nousiainen, T.; Kemppinen, O. Mineralogical properties and internal structures of individual fine particles of Saharan dust. Atmos. Chem. Phys. 2016, 16, 12397–12410. [Google Scholar] [CrossRef]
- Jeong, G.Y.; Kim, J.Y.; Seo, J.; Kim, G.M.; Jin, H.C.; Chun, Y. Long-range transport of giant particles in Asian dust identified by physical, mineralogical, and meteorological analysis. Atmos. Chem. Phys. 2014, 14, 505–521. [Google Scholar] [CrossRef]
- Matsuki, A.; Iwasaka, Y.; Shi, G.; Zhang, D.; Trochkine, D.; Yamada, M.; Kim, Y.-S.; Chen, B.; Nagatani, T.; Miyazawa, T.; et al. Morphological and chemical modification of mineral dust: Observational insight into the heterogeneous uptake of acidic gases. Geophys. Res. Lett. 2005, 32, L22806. [Google Scholar] [CrossRef]
- Okada, K.; Qin, Y.; Kai, K. Elemental composition and mixing properties of atmospheric mineral particles collected in Hohhot, China. Atmos. Res. 2005, 73, 45–67. [Google Scholar] [CrossRef]
- Zhang, D.; Iwasaka, Y. Nitrate and sulfate in individual Asian dust-storm particles in Beijing, China in spring of 1995 and 1996. Atmos. Environ. 1999, 33, 3213–3223. [Google Scholar] [CrossRef]
- Okada, K.; Naruse, H.; Tanaka, T.; Nemoto, O.; Iwasaka, Y.; Wu, P.-M.; Ono, A.; Duce, R.A.; Uematsu, M.; Merrill, J.T.; et al. X-ray spectrometry of individual Asian dust-storm particles over the Japanese islands and the North Pacific Ocean. Atmos. Environ. 1990, 24A, 1369–1378. [Google Scholar] [CrossRef]
- Conny, J.M.; Willis, R.D.; Ortiz-Montalvo, D.L. Analysis and optical modeling of individual heterogeneous Asian Dust Particles collected at Mauna Loa Observatory. J. Geophys. Res. Atmos. 2019, 124, 270–2723. [Google Scholar] [CrossRef]
- Reid, E.A.; Reid, J.S.; Meier, M.M.; Dunlap, M.R.; Cliff, S.S.; Broumas, A.; Perry, K.; Maring, H. Characterization of African dust transported to Puerto Rico by individual particle and size segregated bulk analysis. J. Geophys. Res. 2003, 108, 8591. [Google Scholar] [CrossRef]
- Li, W.; Xu, L.; Liu, X.; Zhang, J.; Lin, Y.; Yao, X.; Gao, H.; Zhang, D.; Chen, J.; Wang, W.; et al. Air pollution-aerosol interactions produce more bioavailable iron for ocean ecosystems. Sci. Adv. 2017, 3, e1601749. [Google Scholar] [CrossRef]
- Kaegi, R.; Gasser, P. Application of the focused ion beam technique in aerosol science: Detailed investigation of selected, airborne particles. J. Microsc. 2006, 224, 140–145. [Google Scholar] [CrossRef] [PubMed]
- Chen, H.; Grassian, V.H.; Saraf, L.V.; Laskin, A. Chemical imaging analysis of environmental particles using the focused ion beam/scanning electron microscopy technique: Microanalysis insights into atmospheric chemistry of fly ash. Analyst 2013, 138, 451–460. [Google Scholar] [CrossRef] [PubMed]
- Conny, J.M. Internal composition of atmospheric dust particles from focused ion-beam scanning electron microscopy. Environ. Sci. Technol. 2013, 47, 8575–8581. [Google Scholar] [CrossRef]
- Miki, Y.; Ueda, S.; Miura, K.; Furutani, H.; Uematsu, M. Atmospheric Fe-containing particles over the North Pacific Ocean: The mixing states with water soluble materials. Earozoru Kenkyo 2014, 29, 104–111. [Google Scholar]
- Cui, Y.; Suzuki, S.; Omori, Y.; Wong, S.-K.; Ijichi, M.; Kaneko, R.; Kameyama, S.; Tanimoto, H.; Hamasaki, K. Abundance and distribution of dimethylsulfoniopropionate degradation genes and the corresponding bacterial community structure at dimethyl sulfide hot spots in the tropical and subtropical Pacific Ocean. Appl. Environ. Microbiol. 2015, 81, 4184–4194. [Google Scholar] [CrossRef]
- Kamogawa, M.; Ohhora, O.; Ueda, S.; Miura, K.; Yajima, K.; Hashamoto, S.; Nakamura, M.; Kakinami, Y.; Furutani, H.; Uematsu, M. Simultaneous observations of atmospheric electric field, aerosols, and c1ouds on the R/V Hakuho Maru over the Pacific Ocean. J. Atmos. Electr. 2014, 34, 12–26. [Google Scholar]
- Omori, Y.; Tanimoto, H.; Inomata, S.; Ikeda, K.; Iwata, T.; Kameyama, S.; Uematsu, M.; Gamo, T.; Ogawa, H.; Furuya, K. Sea-to-air flux of dimethyl sulfide in the South and North Pacific Ocean as measured by proton transfer reaction-mass spectrometry coupled with the gradient flux technique. J. Geophys. Res. Atmos. 2017, 122, 7216–7231. [Google Scholar] [CrossRef]
- Ueda, S.; Miura, K.; Kawata, R.; Furutani, H.; Uematsu, M.; Omori, Y.; Tanimoto, H. Number–size distribution of aerosol particles and new particle formation events in tropical and subtropical Pacific Ocean. Atmos. Environ. 2016, 142, 324–339. [Google Scholar] [CrossRef]
- Jung, J.; Furutani, H.; Uematsu, M.; Park, J. Distribution of atmospheric non-sea-salt sulfate and methanesulfonic acid over the Pacific Ocean between 48°N and 55°S during summer. Atmos. Environ. 2014, 99, 374–384. [Google Scholar] [CrossRef]
- Rolph, G.; Stein, A.; Stunder, B. Real-time Environmental Applications and Display sYstem: READY. Environ. Model. Softw. 2017, 95, 210–228. [Google Scholar] [CrossRef]
- Stein, A.F.; Draxler, R.R.; Rolph, G.D.; Stunder, B.J.B.; Cohen, M.D.; Ngan, F. NOAA’s HYSPLIT atmospheric transport and dispersion modeling system. Bull. Am. Meteorol. Soc. 2015, 96, 2059–2077. [Google Scholar] [CrossRef]
- Kogure, T. Geometry of electron diffraction and its calculation. Kenbikyo 2015, 50, 6–10. [Google Scholar] [CrossRef]
- Kawakam, N.; Osada, K.; Nishita, C.; Yabuki, M.; Kobayashi, H.; Hara, K.; Shiobara, M. Factors controlling sea salt modification and dry deposition of nonsea-salt components to the ocean. J. Geophys. Res. 2008, 113, D14216. [Google Scholar] [CrossRef]
- Chessin, H.; Hamilton, W.C.; Post, B. Position and thermal parameters of oxygen atoms in calcite. Acta Cryst. 1965, 18, 689–693. [Google Scholar] [CrossRef]
© 2020 by the authors. Licensee MDPI, Basel, Switzerland. This article is an open access article distributed under the terms and conditions of the Creative Commons Attribution (CC BY) license (http://creativecommons.org/licenses/by/4.0/).