Article

Three-Dimensional Modelling of Precipitation Enhancement by Cloud Seeding in Three Different Climate Zones

1
Institute of Meteorology, University of Belgrade, Dobračina 16, 11000 Belgrade, Serbia
2
Department of Meteorology, Republic Hydrometeorological Service of Serbia, Kneza Višeslava 66, 11000 Belgrade, Serbia
3
Wind Engineering, Energy and Environment (WindEEE) Research Institute, Western University, London, ON N6M 0E2, Canada
4
Department of Civil Infrastructure and Environment Engineering, Masdar Institute, Khalifa University of Science and Technology, P.O. Box 127788, Abu Dhabi, UAE
*
Author to whom correspondence should be addressed.
Atmosphere 2019, 10(6), 294; https://doi.org/10.3390/atmos10060294
Submission received: 8 April 2019 / Revised: 18 May 2019 / Accepted: 21 May 2019 / Published: 29 May 2019
(This article belongs to the Section Aerosols)

Abstract

:
This study numerically investigates precipitation enhancement from cumuliform clouds in three different climate regions: (1) Arid climate of the United Arab Emirates (UAE); (2) maritime climate of Thailand; and (3) continental climate of Serbia. Recently developed core/shell sodium chloride (NaCl)/titanium dioxide (TiO2) nanostructure (CSNT) aerosol was tested as a precipitation enhancer in all three climate regions. Previous experimental studies in cloud chambers and idealized numerical simulations demonstrated that CSNT is a significantly more effective precipitation enhancer than the traditional NaCl. Here, CSNT and NaCl seeding agents are incorporated into the WRF (Weather Research and Forecasting) model microphysics with explicate treatment of aerosol. Our results show that CSNT is a profoundly more effective precipitation enhancer in the case of arid climate characterized with low humidity. The accumulated surface precipitation in the arid test was 1.4 times larger if CSNT seeding agent was used instead of NaCl. The smallest difference in the effectiveness between CSNT and NaCl was observed in the maritime case due to their similar activation properties at high values of relative humidity.

1. Introduction

Water is at the base of sustainable development and is a quintessential ingredient for energy and food production, health, and life itself. However, currently 2.1 billion people lack access to safely managed drinking water [1], while water scarcity affects approximately 4 billion people around the world [2]. Zhao and Dai (2015) [3] reported a projected increase of occurrence of agricultural draughts by 50%–100% by the end of this century over most of the globe. Their numerical prediction under a low–moderate greenhouse gas concentration scenario indicates a decrease in the mean precipitation rates; particularly in subtropical areas. Moreover, on average, droughts cause US$ 6–8 billion damage per year in the United States [4]. Cloud modification and precipitation enhancement might play a central role in decreasing the frequency of draughts and positively contributing to sustainable development by providing a significant source of fresh water.
Precipitation modification is not a new subject in atmospheric sciences. Various weather modification attempts employing different methods have been carried out since the dawn of civilization [5]. However, the modern scientific era of precipitation enhancement began when Vincent Schaefer in 1946 demonstrated the possibilities of cloud seeding with aerosols injected into the cloud environment. After that time, several different methods for cloud seeding were proposed by researchers. One methodology of cloud seeding is based on using aircrafts equipped with a rack containing releasable pyrotechnics. This released material is ignited as it falls from the airplane into the upper region of a convective cloud where it ultimately serves as an ice nuclei. Another method of cloud seeding is carried out using aircrafts that fly underneath the cloud base and eject the seeding agent into updrafts [6,7]. This methodology is employed in the presented work. Recently, some novel and prospective technologies for weather modification activities have also been under development such as the autonomous unmanned aircraft systems [8]. Regardless of the seeding methodology—from above cloud top or below cloud base—any cloud seeding with the proper material is designed to give an ample number of aerosols that can serve as cloud condensation nuclei or ice nuclei.
A large number of precipitation enhancement studies is based on numerical modelling of clouds and cloud microphysics processes in the presence of an artificial seeding aerosol (e.g., [9,10,11,12]). Recently, Lompar et al. (2018) [13] used a newly developed one-dimensional (1D) cloud model to compare the precipitation enhancement after seeding using a novel seeding material made out of core/shell sodium chloride (NaCl)/titanium dioxide (TiO2) nanostructure (hereafter CSNT) [14]. The authors reported a 15% increase of precipitation if CSNT was used instead of pure NaCl—an artificial aerosol which is a well-studied and traditional precipitation enhancer—and a 30% increase of precipitation in comparison to the natural, unseeded case (hereafter UNSD). However, the results of a 1D cloud model are largely idealized and in principle almost impossible to compare against field observations. Xue et al. (2013) [15] altered the Thompson and Eidhammer (2014) microphysics scheme [16] in WRF (weather research and forecasting) model with the objective to analyze several cases of cloud seeded with silver iodide (AgI) in an idealized atmosphere [15], as well as in real environmental conditions [17]. Their research showed that different nucleation modes were prevailing depending on the location of the released seeding material. They also reported that the resulting enhancement of precipitation might vary from as little as 0.3% to as much as 429% depending on the seeding conditions. Two other research approaches to investigate the effectiveness of different seeding materials on increasing surface precipitation are laboratory experiments in cloud chambers (e.g., [14,18,19]) and field campaigns (e.g., [20,21,22]). However, these methods are more financially expensive and potentially environmentally harmful ([23,24]) when compared to numerical studies. Therefore, the present article focuses on numerical investigation of effectiveness of CSNT in three different climate zones around the globe using a three-dimensional (3D) WRF model.
According to Tai et al. (2017) [14], CSNT is a substance that produces approximately 6–10 times larger droplets than the pure NaCl at the values of relative humidity between 62% and 66%. In the same paper, they also demonstrated that NaCl tends to remain in its crystal form at those values of low relative humidity. Their study concluded that the high hygroscope of CSNT is a resulting combination of the hydrophilic shell of TiO2 placed around the hygroscopic NaCl core nanostructure. As such, this new substance (CSNT) adsorbs water vapor molecules at the boundary between the TiO2 shell and air. Deliquescence of NaCl crystals occurs afterwards at the core/shell boundary. In the case of pure NaCl, however, the processes of adsorption, condensation and deliquescence all simultaneously occur between the air-NaCl interface, which consequently reduces the activation properties of NaCl in comparison to CSNT.
Recently, Lompar and his colleagues [
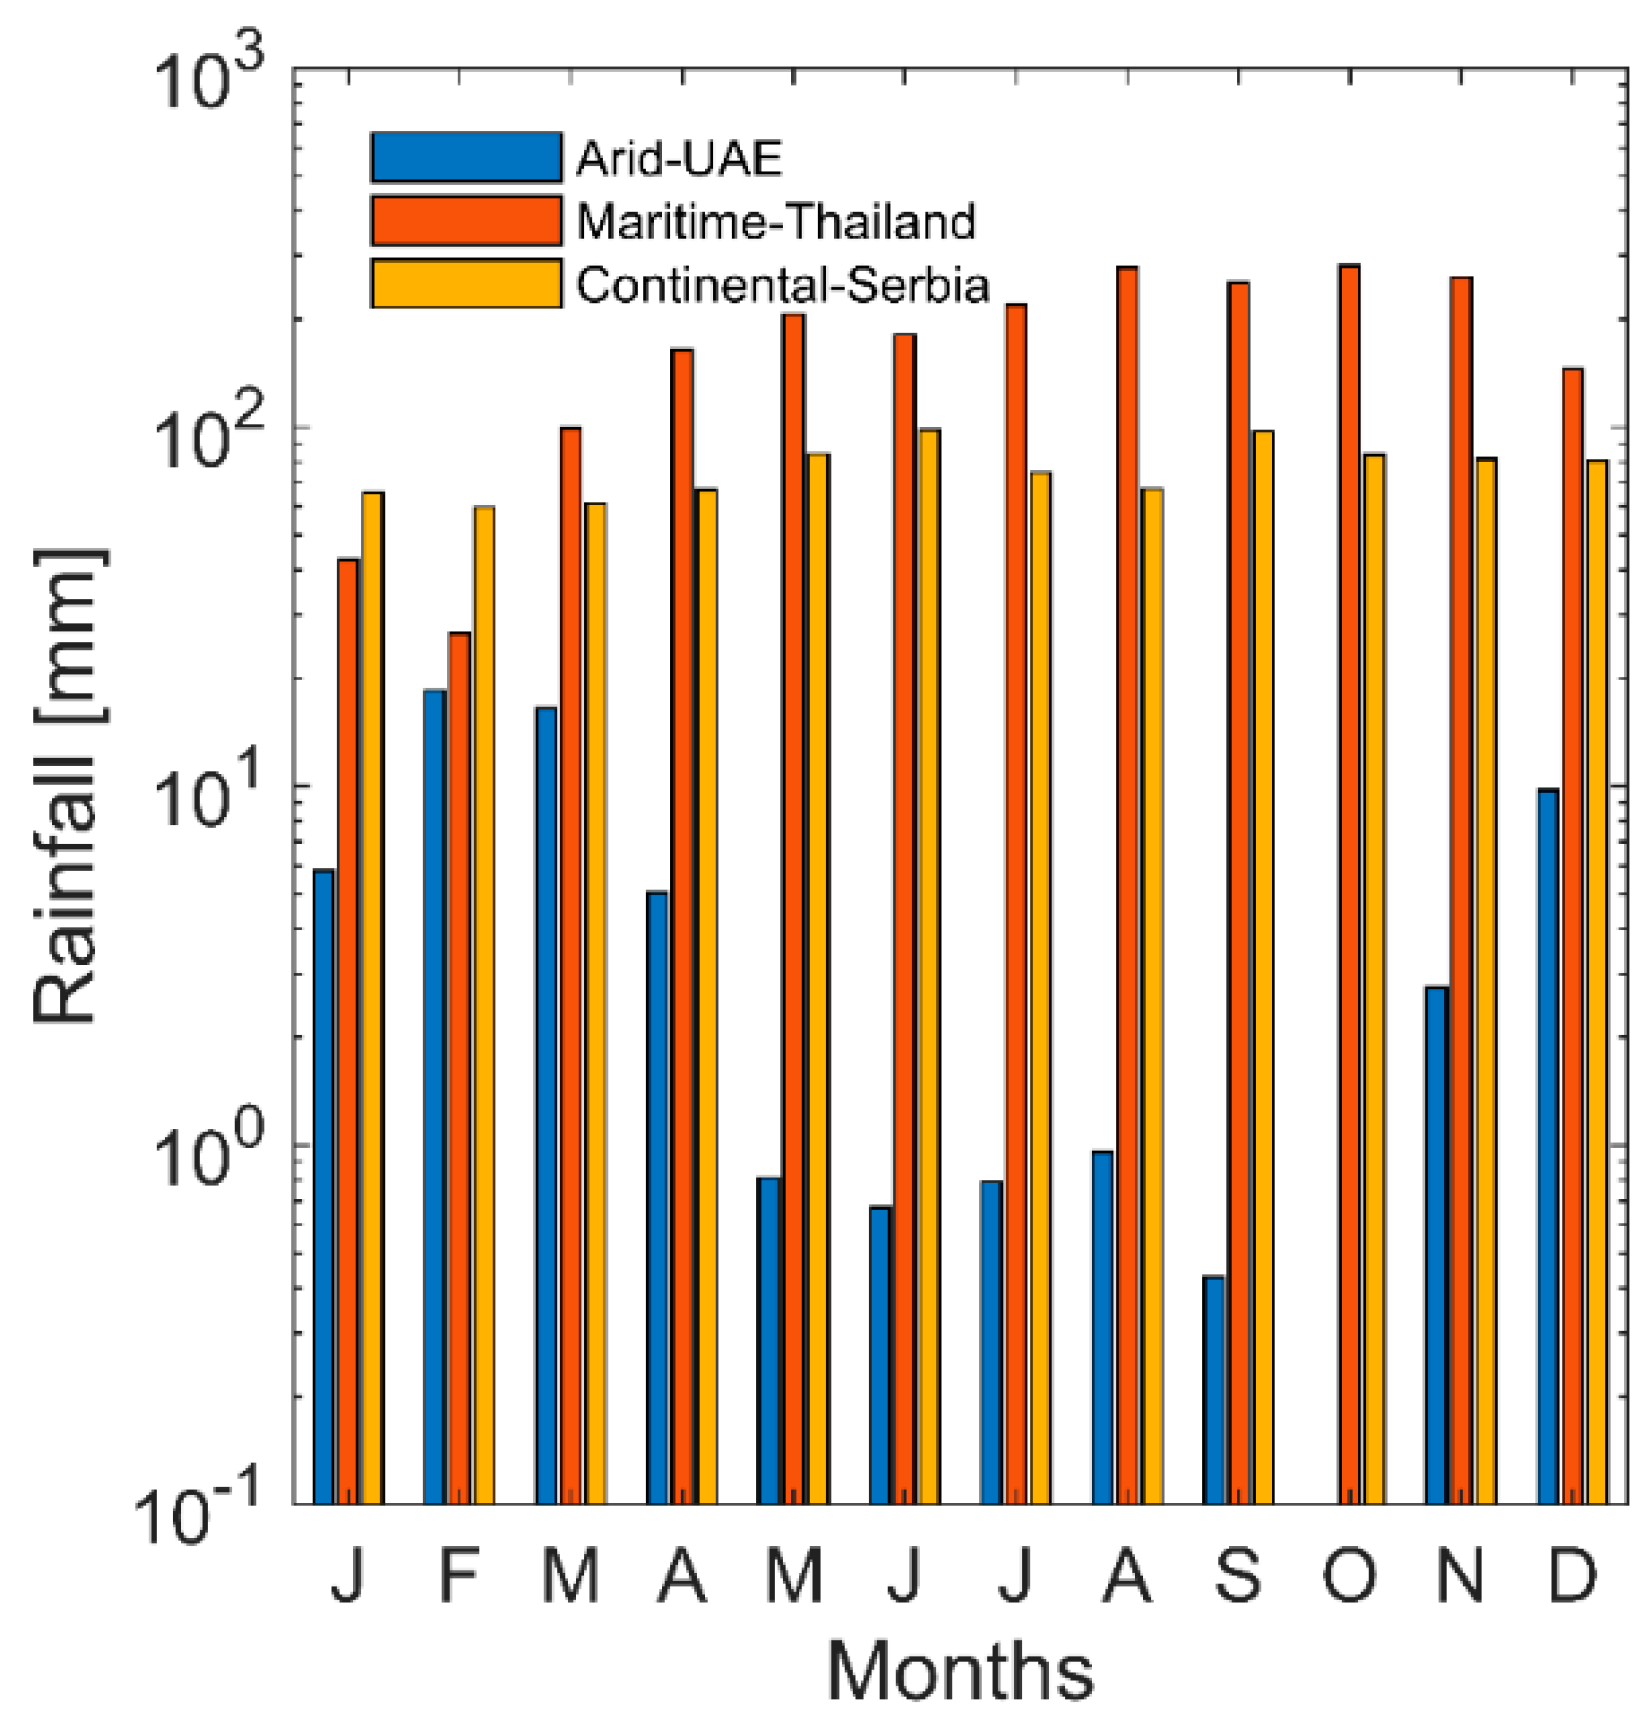
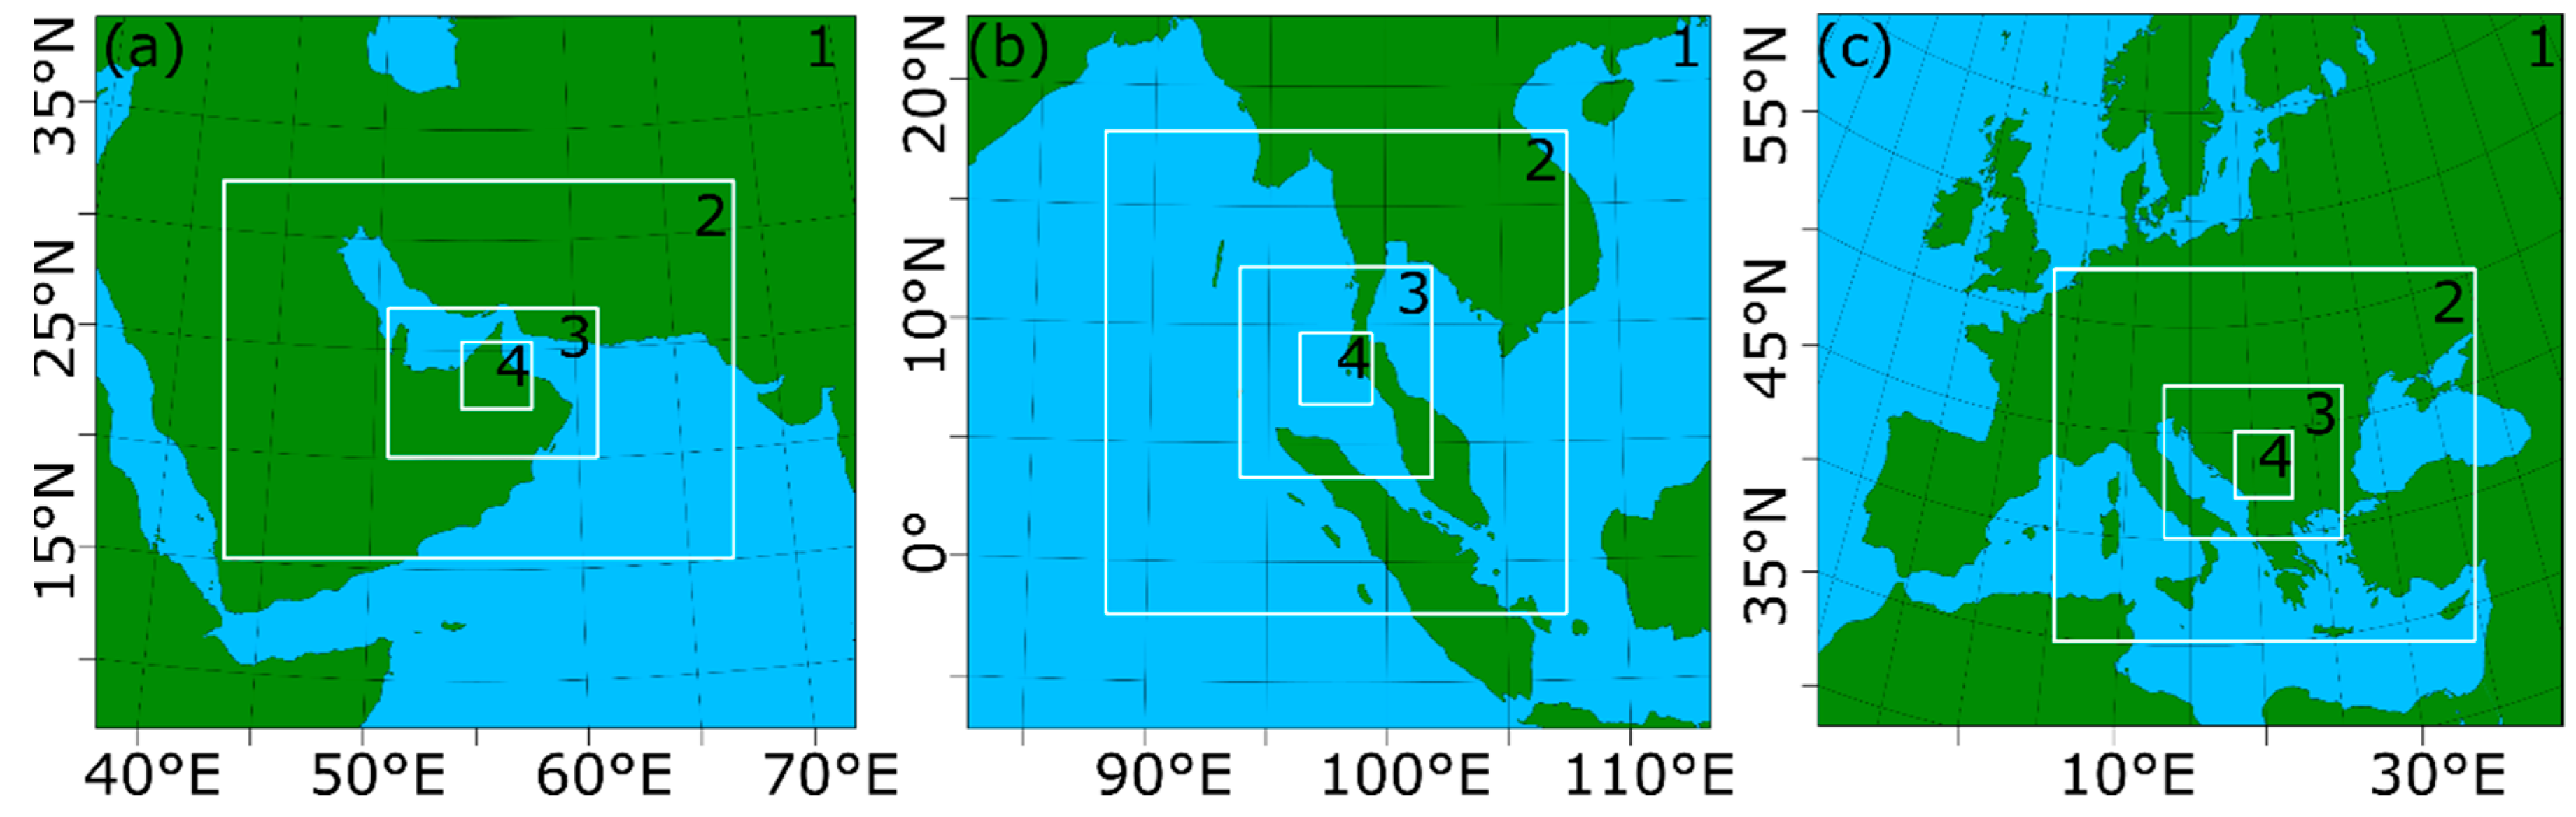
25] discussed how cloud properties and their microphysics highly depend on geographical region around the world and thereby emphasized the importance of case studies that cover different climates. Along the same lines, it is logical to expect that the success rate of cloud seeding experiments/projects is highly dependent on the geographical region where the seeding activity takes place. That is, different cloud depths, cloud base heights, temperature (warm or cold clouds), water content, number concentration of natural aerosols in the atmosphere, orography, etc., will all influence the efficiency and performances of a seeding project. Therefore, this study considers three profoundly different climate regions around the world for numerical cloud seeding experiments: (1) Arid; (2) maritime, and (3) continental climate types with the corresponding locations being (1) the United Arab Emirates (UAE); (2) Thailand, and (3) Serbia, respectively. The goal of this work is to learn how cloud seeding with the same seeding materials manifests in rainfall enhancement in these three different climate regions.
Several airborne field studies have been conducted in the UAE in order to assess the potential for precipitation enhancement through hygroscopic cloud seeding in that region. A comprehensive dataset from the 2001–2002 filed measurements, randomized seeding experiments, and numerical studies is presented at [26]: http://www.rap.ucar.edu/projects/UAE/. The seeding was usually carried out near the UAE-Oman border were the deep orographic-induced cumulus clouds are sometimes observed [27] A very recent study on cloud cover climatology of the UAE is carried out by Yousef et al. (2019) [28]. The overall conclusion of the completed cloud seeding campaigns in that region is that the majority of hydrologically significant rainfall events over the UAE occur in the summer season and that the summer clouds are more suitable for seeding than the clouds that develop over the rest of the year. However, different regions around the globe favor different cloud development in terms of cloud vertical structure, convection intensity, cloud water content, etc. For example, the surface precipitation climate of Thailand is under the dominant influence of seasonal monsoon winds with the abundance of rain during the southwest monsoon which regularly starts in May [29].
In our numerical experiments, we opt for airborne seeding approach over the ground-based release of seeding material. Xue et al. (2017) [30] recently demonstrated that airborne cloud seeding techniques are more efficient for precipitation enhancement than ground seeding methods. When it comes to airborne seeding, this study employs the below-cloud seeding approach motivated by the results from the recent laboratory experiments using CSNT [14] that showed the higher activation of CSNT over the pure NaCl in sub-saturated environments. Moreover, the CSNT is a seeding agent developed for warm rain processes and to serve as cloud condensation nuclei instead of ice nuclei, which additionally favors the below-cloud seeding instead of the above-cloud seeding locations. In all investigated cases in this study, the clouds are seeded with the novel aerosol (CSNT) and afterwards the numerical experiments are repeated using pure NaCl. These two cases are then compared against each other as well as against the control case when seeding was not conducted. While numerous studies focused on verifying WRF forecasts in terms of accumulated surface precipitation and cloud cover by investigating different physical packages and/or geographical regions around the world (e.g., [16,25,31,32]), this article is the first study that introduces the CSNT aerosol into the WRF model and tests its performances under real weather conditions. The CSNT substance has not yet been tested in real atmosphere and therefore a comparison against seeding field projects is not possible at this point. The earlier numerical study using a 1D model [13], the present study, as well as the previous experimental research [14] in cloud chamber, are much needed research prior to eventual CSNT testing in the real atmosphere.
The rest of the paper is organized as follows. A brief description of selected test cases in terms of their location and weather conditions is presented in Section 2.1. Section 2.2 describes the model setup and the main characteristics of the CSNT seeding agent. Section 3 presents the results of this study with an emphasis on the relative comparison of CSNT performances against the control case and pure NaCl seeding across three different climate regions. The main conclusions of this numerical research are summarized in Section 4.

2. Data and Model Setup

2.1. Description of Test Cases

By choosing the UAE, Thailand and Serbia for three geographical regions of interest, this study attempts to investigate the CSNT performances in three different climate zones: (1) Arid; (2) maritime; and (3) temperate continental, respectively. According to recent climate classification by Beck et al. (2018) [33] and Peel et al. (2007) [34], the arid climate (BWh—warm desert climate) of the UAE (Figure 1a) is characterized with an annual excess of evaporation over precipitation. Maritime climate (Af—tropical rainforest climate with precipitation in all months and Am—same as Af, but there is a short dry season) of the southern Thailand region (Figure 1b) is characterized with at least 25 mm of rainfall every month (Figure 2). The third climate type considered in this research is continental climate of Serbia (Dfa and Dfb—temperate continental climate with hot and warm summers, respectively) (Figure 1c). This climate zone is described by the large temperature differences between seasons, and with a warm to hot and often humid summers and cold winters. The average monthly rainfall for these three regions is portrayed in Figure 2. As an illustration of pronounced difference between rainfalls in the analyzed regions, notice that the rainfall in Thailand for the month of July is more than two orders of magnitude larger than in the UAE in the same month.
The selected geographical regions also differ in the concentration number of aerosols naturally present in the atmosphere. In the Thomson and Eidhammer microphysics [16], aerosols are classified into two main categories: (1) Water-friendly; and (2) ice-friendly aerosols. The water-friendly aerosols serve as cloud condensation nuclei (CCN) and few typical representatives of this category are sulfates, sea salts, organic carbon and black carbon. The ice-friendly aerosols serve as ice nuclei (IN) particles and the most common IN is dust. The concentration, size, as well as chemical characteristics of natural aerosols may rapidly vary in space and throughout the year. These variabilities are represented in the Thompson and Eidhammer microphysics [16] using the global model simulations by Colarco et al. (2010) [36] in which the aerosol particles are explicitly modelled with several size bins using the Goddard Chemistry Aerosol Radiation and Transport (GOCART) model [37]. Similar to the work carried out by Lompar and his collaborators [25], the natural aerosols in this study were modelled using their climatological means for the given month. The chemical properties of natural aerosols, such as their activation in wet environment, were calculated based on the kappa ( κ ) hygroscopicity approach using a parcel model ([38,39]).
Numerical simulations for the arid climate of UAE were carried out for 17 July 2009 (Figure 3a). The dominant circulation at 500 hPa was westward and driven by the cyclone situated above the north part of the Arabian Sea. Convective clouds in this region developed as a result of moist easterly winds (coming from the Arabian Sea) crossing over the mountainous region near the UAE-Oman border. This weather situation usually results in the intense convection in this area [27]. Despite this phenomenon being well known to the local meteorologists, it is not described adequately in literature due to the limited number of studies that focused on this region of Arabian Peninsula. The detail description of this event is presented in Lompar et al. (2018) [31]. The verification of WRF simulation against satellite measurements showed in [31] showed that the model produced less convection than the observed amount. In addition, Lompar and his co-authors [31] also verified the model simulations against the available Doppler radar measurements and noticed a significant discrepancy between the simulated and observed values of the composite radar reflectivity.
This study represents the maritime case of Thailand using the weather situation of 25 July 2007 (Figure 3b). At 500 hPa, the dominant circulation was from the east with a weak pressure gradients (Figure 3b) across the map when compared to the other two weather scenarios analyzed here. The heights of 500-hPa level was similar to the UAE event (~570 geopotential decameters). Also, in contrast to the UAE and western Serbia model forecasts, which were compared against filed measurements in [31,25], respectively, this WRF simulation was not evaluated against any in-situ or remote measurements. Therefore, the value of this study lies in the relative rather than absolute numbers of simulated surface precipitation between three different seeding cases.
Lastly, the continental climate of west Serbia is represented using the weather conditions that occurred on 21 July 2014 (Figure 3c). This event was characterized with a strong convection and it was analyzed in detail in [25]. However, the onus of the Lompar et al. study [25] was not on precipitation modification, but rather on verification of Thomson and Eidhammer microphysics [16]; simulating the cloud properties and surface precipitation from a severe weather event. The deep cumulonimbus (Cb) clouds that arose on 21 July 2014 over western Serbia were associated with the eastward passage of cold front that was situated over the central Mediterranean. The most intensive precipitation occurred over the cities of Čačak and Gornji Milanovac (around 50 mm over 24 h). This weather scenario was characterized with the strongest pressure gradients and the most severe weather (intense precipitation and hail) out of the three investigated test cases. Similar to the UAE forecasts in [31], the WRF model once again under-estimated the values of composite radar reflectivity for this event (not shown, see [25]). In addition, the WRF results compared against surface precipitation measurements from 147 weather stations in this region showed an overestimation of light and strong precipitation. The model’s production of hail was also diminished in this case.

2.2. Model and Experiments Setup

This study used the non-hydrostatic WRF (version 3) numerical model to investigate the precipitation enhancement after the cloud seeding with the CSNT aerosol. All simulations were run using four subdomains with the one-way nesting employed between consecutive domains. The horizontal grid resolutions from the outer coarse domain to the finest inner domain were 27, 9, 3 and 1 km (i.e., 3:1 nesting ratio). The model domains are portrayed in Figure 4. The total number of vertical levels in every simulation was 64. The selected physics packages and model dynamics were the same in all simulations and they are listed in Table 1. The unchanged configuration of the WRF model between different runs enabled correct relative comparisons between different seeding cases. Cumulus parameterization was only used in the outer two coarse domains (27 and 9 km). The Runge–Kutta 3rd order time discretization was employed with the time step of 100 s in the 27-km domain. In space domain, the model used the 5th and the 3rd order horizontal and vertical advections, respectively, and the 2nd order diffusion on coordinate surfaces. All simulations started at 00:00 UTC on the investigated date of the events and the integration time was 18 h. The first 8 h of simulation were used as a short spin-up time. Hereafter, the dates of investigated events will be omitted in text for the sake of shortness.
As shown in Table 1, the Thompson and Eidhammer (2014) microphysics [16] was modified in [13] for the purposes of conducting cloud seeding experiments using the CSNT agent, as well as pure NaCl. The activation properties of CSNT in the modified microphysics of Thompson and Eidhammer are represented through the diffusion growth equation proposed by Lompar et al. (2018) in [13] and formulated therein based on the laboratory tests carried out by Tai et al. (2017) [14], i.e.,:
d r d z = C 1 V 1 ( R H C 2 ) C 3 .
Here, r is the droplet radius, z is the height,   V is the vertical wind speed, R H is the relative humidity, and the empirical constants C 1 , C 2 and C 3 are 5 × 10⁻⁷ m s−1, 0.7 and 2.13, respectively. The values of the constants are obtained from the experimental study of Tai et al. (2017) [10] and numerical experiments in [13]. The implementation of Equation (1) into the 3D WRF model and Thompson and Eidhammer (2014) microphysics [16] was the same as in the 1D model in [13]. The uncertainty of incorporation of Equation (1) into WRF from a 1D model and the robustness of the changes to the microphysics scheme have not been considered in this study.
The implementation of a seeding material (either CSNT or NaCl) into WRF was as follows. First, a new 3D variable that represents the seeding aerosol number concentration was added to the model registry based on already existing number concentration of water-friendly aerosols (NWFA) and number concentration of ice-friendly aerosols (NIFA) variables [16] in the WRF model. This step ensures that the model dynamics is capable of transporting and spreading seeding material as a passive substance. Secondly, a new configuration file (i.e., WRF namelist) was created in order to setup the seeding experiment such as the seeding location, initial time and duration of seeding, as well as the type and amount of seeding material. The seeding agent was released in an ascending air current in front of the cloud where conditions for droplet activation were satisfactory. Lastly, cloud droplet growth was defined using Equation (1) for seeding particles (CSNT or pure NaCl) and was evaluated in the cloud water condensation and evaporation section of the microphysical scheme. The particles were ascending in the current and grow depending on available relative humidity and vertical velocity in that column as described in the papers Tai et al. (2017) and Lompar et al. (2018); and depicted by Equation (1). The particle’s terminal velocity was also considered. When the final cloud droplet radius was estimated using Equation (1), the model computed the contribution of each activated cloud droplet to cloud water assuming that droplets were spherical. Contribution to cloud water number concentration was equal to the number of seeded particles reaching the cloud base and contribution to cloud water mixing ratio was computed using spherical droplet assumption and depended on the number of droplets reaching the cloud base.
The laboratory-produced CSNT particles all had a unimodal distribution with a mean diameter of 1.4 ± 0.3 μm [14]. The high activation rate of CSNT in comparison to pure NaCl also required different drag force parameterization of this artificial reagent. Even at the low values of relative humidity (~60%), the CSNT started to adhere water vapor remaining a spherical particle with the reduced drag force in comparison to pure NaCl, which still remained in a crystal form at those values of relative humidity. These characteristics of CSNT were empirically modelled as [13]:
V t = k D c ,
where V t is the advection velocity of the particle, k is the shape parameter (150 for NaCl and 350 for CSNT), D is the particle diameter, and c = 0.31 is an empirical constant. The shape parameter is determined from the classical fluid dynamics studies [44] which demonstrated that 3D cubes have approximately 2.3 times higher drag coefficients that spheres. In other words, at the low values of relative humidity pure NaCl will be advected into the cloud faster than CSNT due to the higher drag of NaCL particles.

3. Results and Discussion

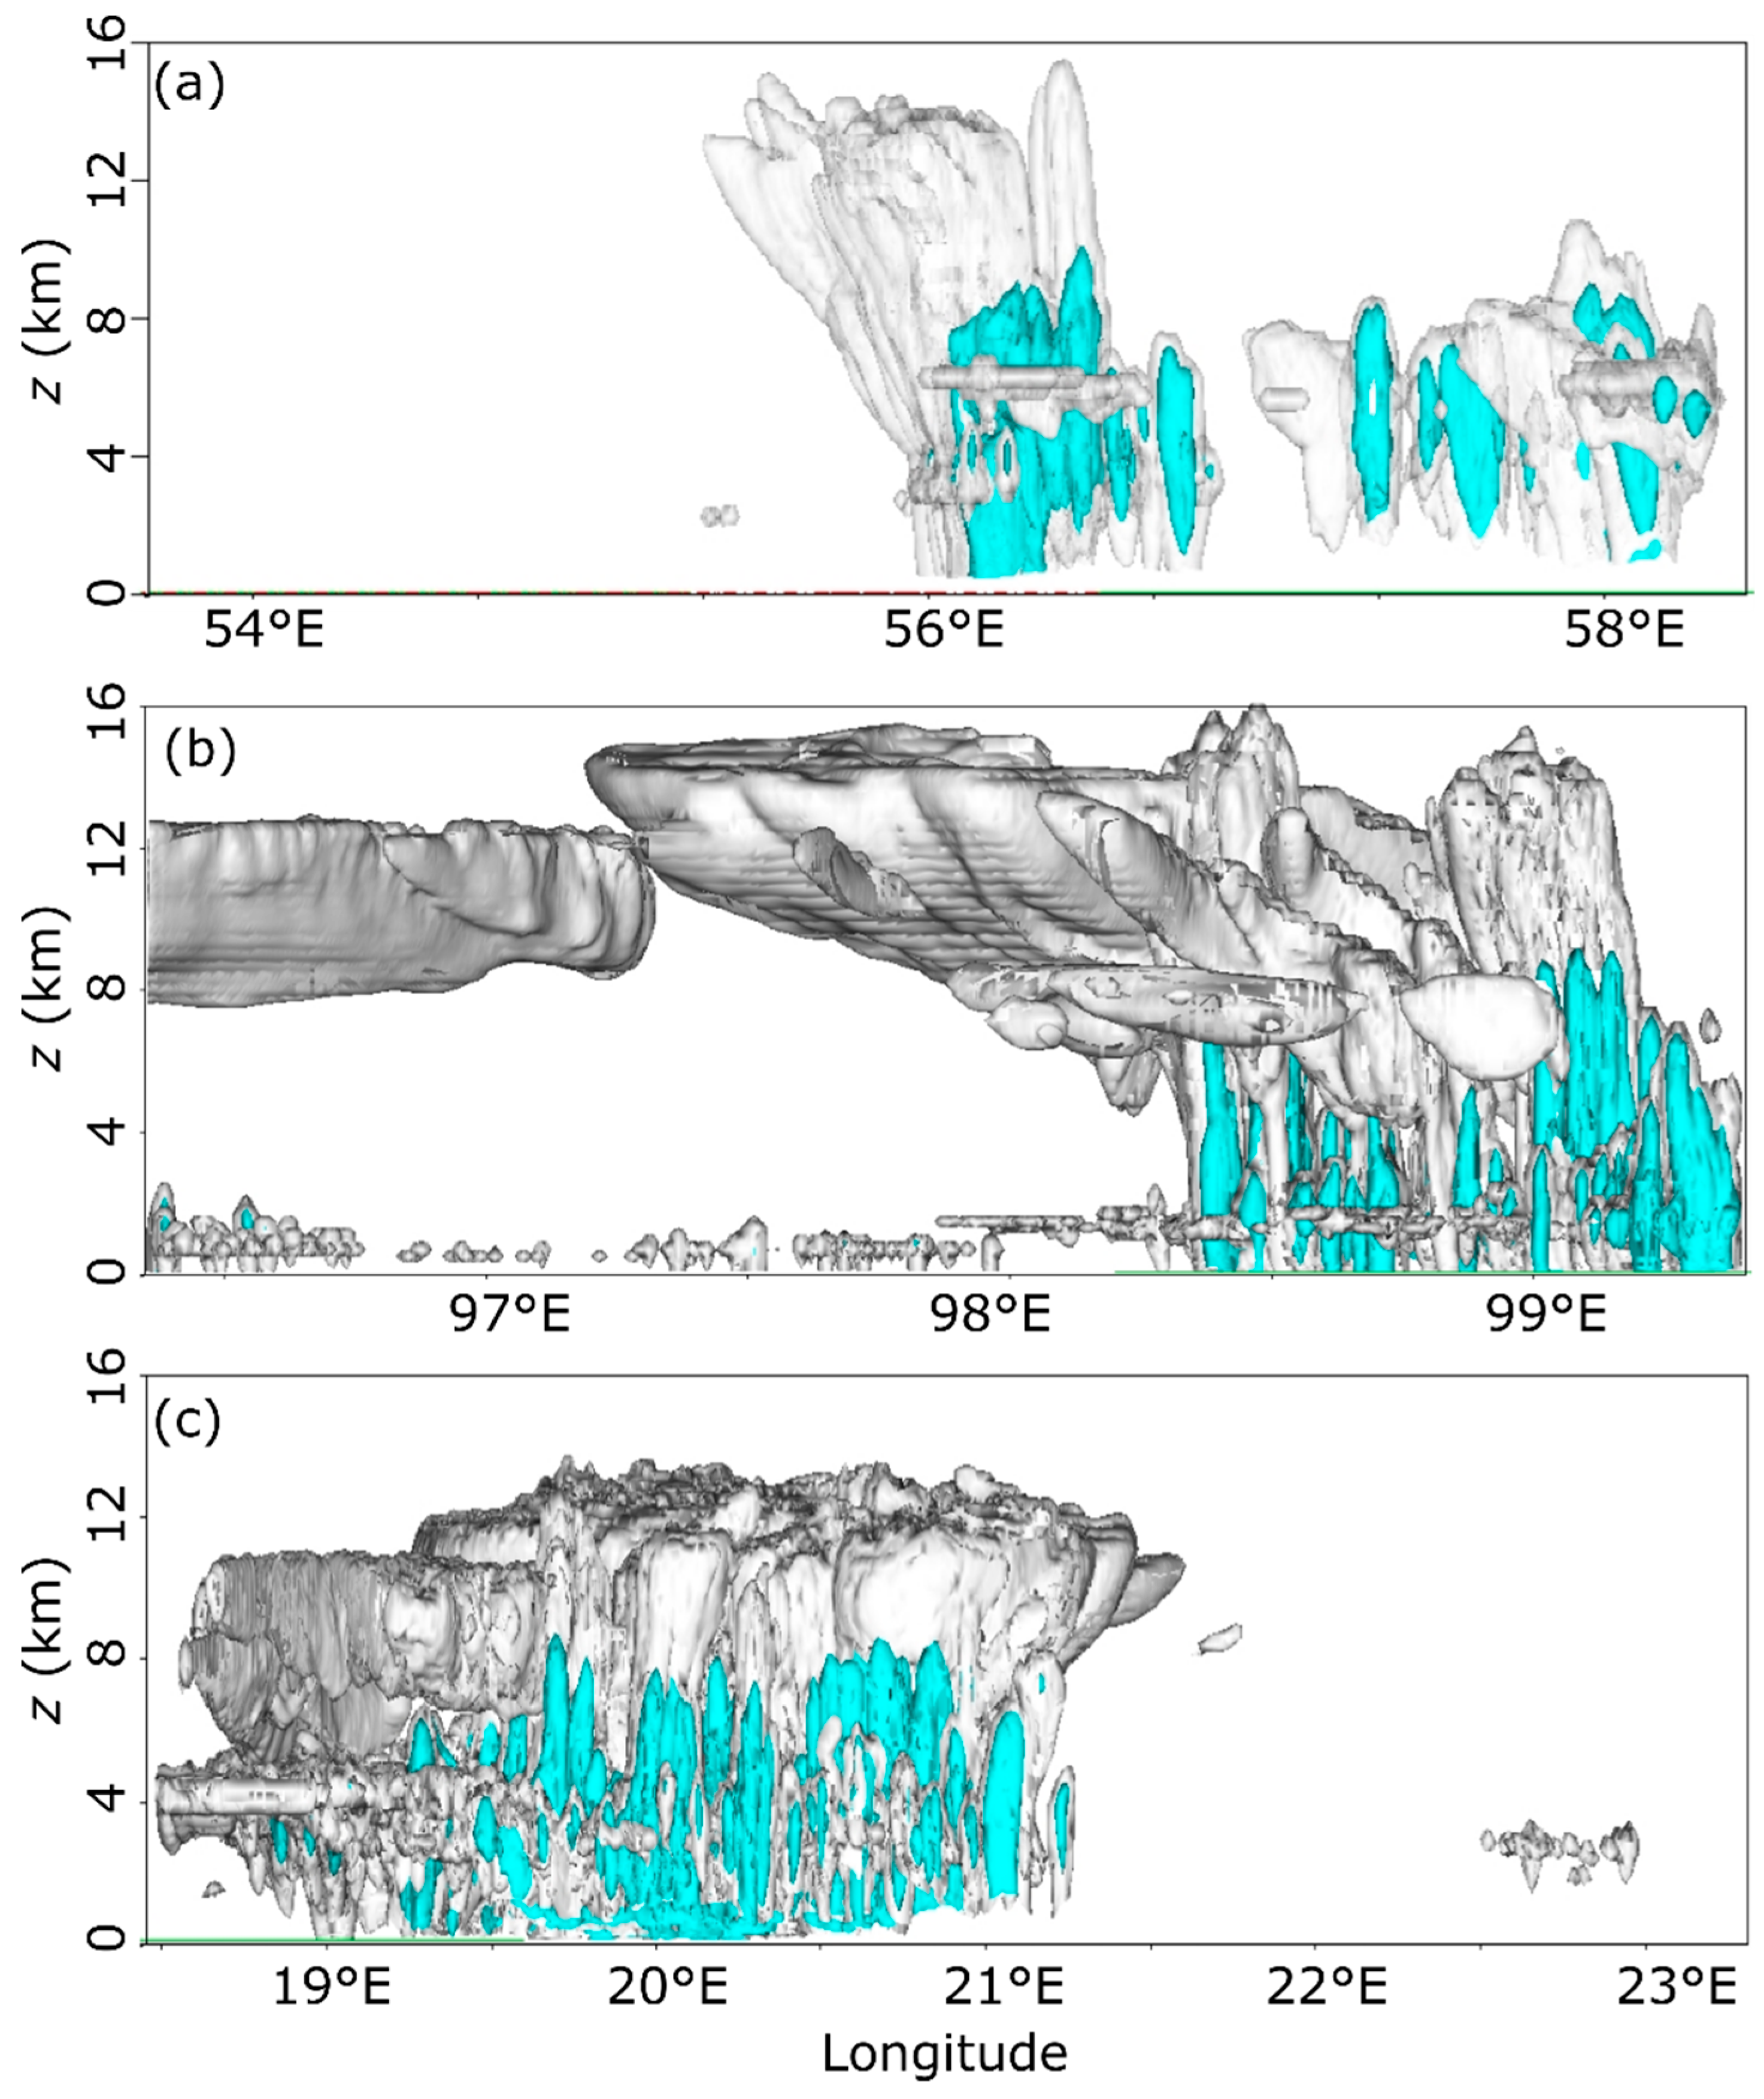
Vertical structures of cumuliform clouds in three investigated regions were significantly different from one case to another (Figure 5). The portrayed 3D structure of analyzed clouds in Figure 5 is shown for the control case without seeding. The UAE case is characterized with an isolated Cb cloud that developed over the mountainous region between the UAE and Oman. The cloud tops reached approximately 16 km above ground level (AGL) (Figure 6a). The formation of an anvil-like top in the downstream direction (see Figure 3a) is nicely depicted in Figure 5a and Figure 6a. Also observed is the development of new convective cells upstream from the parent cloud. The maritime case of Thailand is characterized with a cluster of cumuliform clouds that develop in the zonal direction (i.e., the direction of the prevailing wind at 500 hPa; see Figure 3b). Similar to the UAE case, the anvil-like feature of the cloud top is accurately represented in this configuration of WRF model. The clouds reached the height of 16 km AGL in the arid and maritime cases (Figure 6a,b). The continental case of western Serbia (Figure 5c) depicts a frontal mesoscale convective system that developed over Bosnia and Herzegovina and moved over to western Serbia. Due to the higher latitude of this geographic region in comparisons to the UAE and Thailand, the cloud tops over western Serbia do not exceed approximately 13 km AGL. The entire animation of cloud developments from the WRF model are presented in the Supplementary Materials.
The most distinguished advantage of CSNT over pure NaCl in terms of their activation is expected in unsaturated atmospheric conditions. Following the experimental results of Tai et al. (2017) [14], we expect that the novel aerosol and the pure NaCl have similar activation characteristics in the regions far below or far away (side-wise) from the cloud base where the relative humidity is below approximately 50%. Between 50% and 70% of relative humidity, the new substance (CSNT) should grow faster, but not more than about 1.5 times faster than the pure NaCl. However, for the relative humidity of around 75% and above, the CSNT ought to experience an eightfold difference in the growth rate compared to NaCl. 
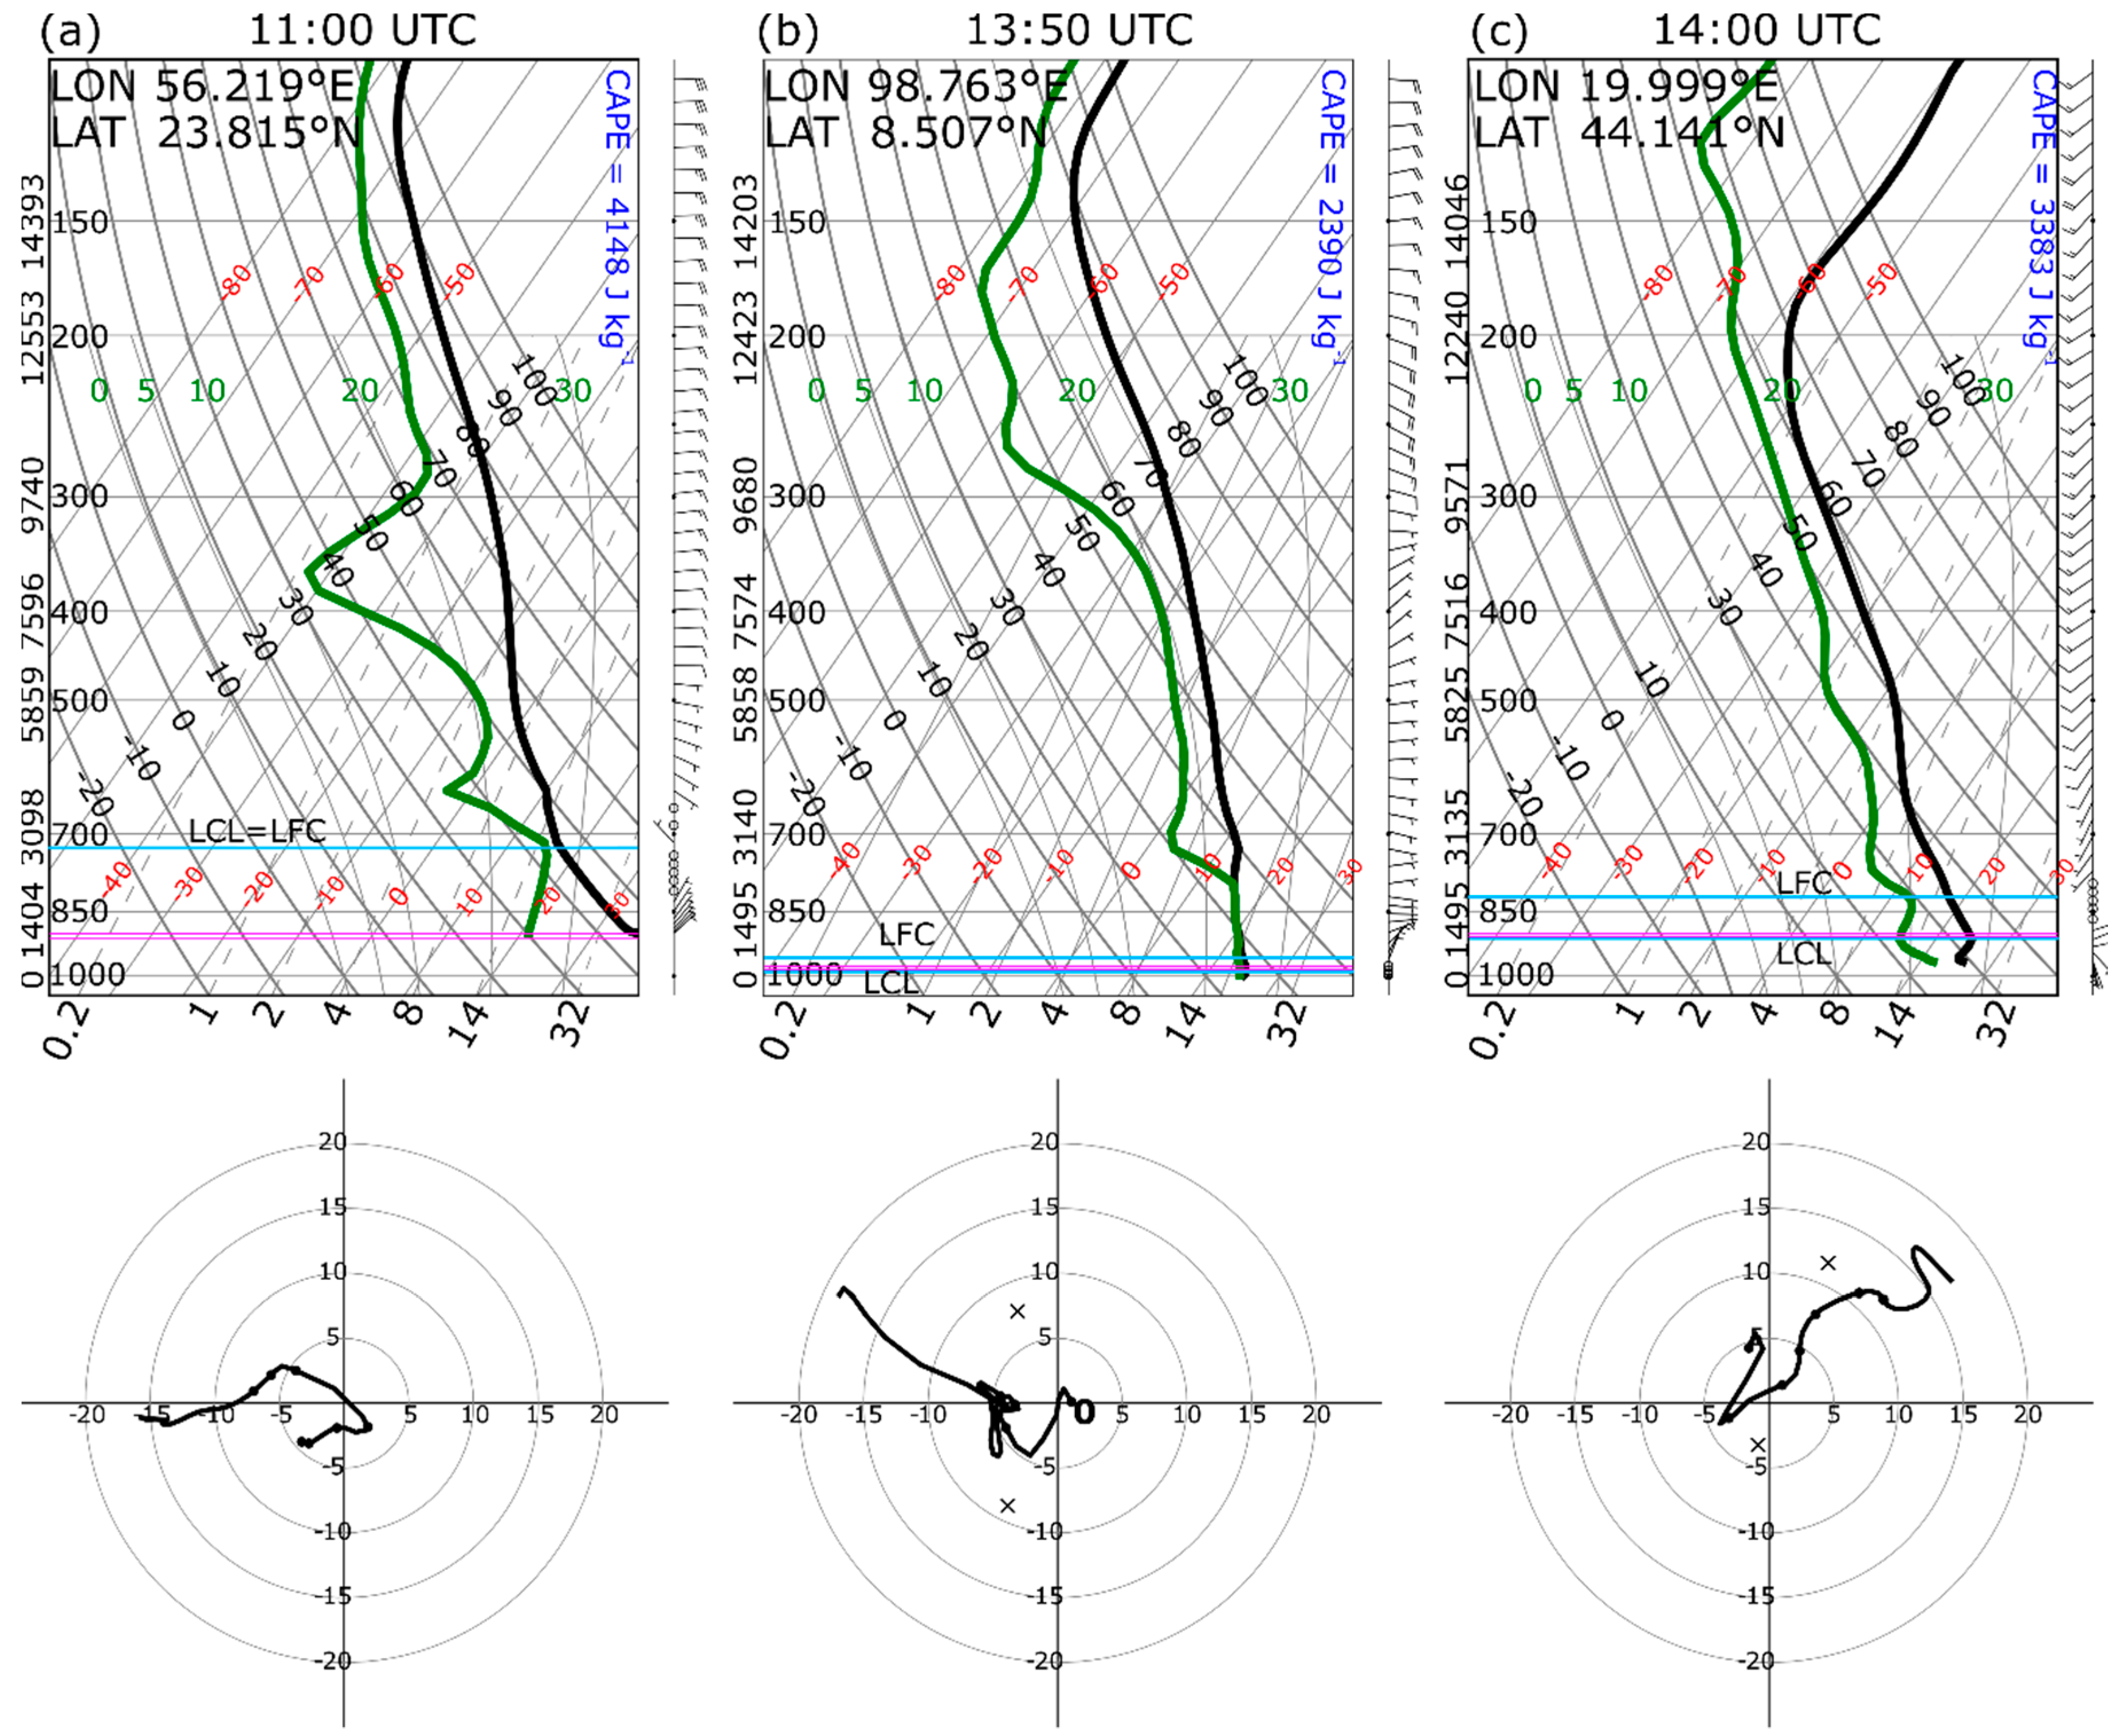
Figure 7a indicates that the relative humidity upstream from the cloud and at the height where the seeding took place (830–930 m AGL) was not sufficiently high for either CSNT or NaCl activation. However, soon after their release into the updraft, both seeding materials reached the levels with higher values of relative humidity (>55%) and CSNT started to grow faster than NaCl. The activated CSNT droplets in the updraft (and below cloud) will enter the cloud environment as the formed cloud droplets that can further grow through the processes of collision and coalescence [13]. These two methods are the dominant processes for precipitation formation in warm clouds.
On the other hand, in the maritime case the air is already saturated in the first approximately 2 km AGL (Figure 7b), which implies that the activation of airborne released CSNT as well as pure NaCl can take place in this environment even outside of the cloud. The continental case of western Serbia somewhat fits in between the previous two cases. In this test, the relative humidity reached a maximum of around 84% at around 2.1 km AGL. A deficit of water vapor in the arid event in the first 2 km AGL was evident in comparison to the other two cases; in particular when matched against the maritime example. However, it should be noted here that due to the fixed diameter of the released CSNT (1.4 μm), as well as the unchanged seeding height and other environmental conditions, the presented results are deemed valid only for the investigated conditions in this study. Besides WRF result verifications of continental and arid simulations in Lompar et al. ([25,31]), the UNSD precipitation had not been evaluated against observations for the Thailand case. Accordingly, any quantification between CSNT (or NaCL) and UNSD is only theoretical at this point.
In the arid case of UAE, the convection started around 10:00 UTC and lasted until 17:00 UTC [31]. The seeding was initiated at 11:00 UTC and the seeding process lasted for 20 min. A wide area below and upstream from the Cb cloud was seeded with the reagent concentration of 5.9 mg m−3. The plain view of the seeding zone is depicted in Figure 8 b–e (red rectangle), while the seeding height is shown in Figure 7a. In this case, cloud seeding with pure NaCl did not result in any significant increase of the accumulated surface precipitation ( P ) in respect to the control case (Figure 8c). The total increase of P from the control case was practically negligible (~0.005 mm over the whole analyzed area). The low values of relative humidity underneath the cloud were not sufficient for the rapid activation of pure NaCl (Figure 7a) and the material entered the cloud environment as inactivated CCNs or very small cloud droplets. Either of these two cases are not adequate for a noticeable enhancement of P . Xue et al. (2013) ([15,16]) also reported a negligible precipitation increase (0.3%) in the unfavorable cases of cloud seeding with AgI.
Cloud seeded with CSNT, on the other hand, produced a significant increase of P downstream from the release zone (Figure 8e). In particular, we noticed that the area without precipitation decreased twofold in respect to the control case (Figure 8f) and the largest increase of precipitation was observed for the light precipitation ( P < 5   mm ). In addition to these results, Figure 8g also illustrated that seeding with CSNT caused: (1) An increase of P for approximately 1.4 times over the whole duration of this event; and (2) prolonged precipitation for around 80 min in comparison to the UNSD or pure NaCl cases. When compared to pure NaCl, the activation of CSNT takes place in unsaturated environment underneath the cloud (Figure 7a). The activated particles in the form of cloud droplets are then transported in the updraft into the cloud. This progress of released CSNT particle from a seeding substance to cloud droplet was demonstrated in a 1D model by Lompar and his colleagues [13]. In conclusion, the activated CSNT particles in the updraft entered the cloud environment as droplets with significantly larger radii than in the case of NaCl seeding. This discrepancy between activation properties of CSNT and pure NaCl and fast growth of CSNT particles are the main contributors for the significant increase of P in the CSNT cloud seeding approach.
The seeding outcomes for the maritime case of Thailand are shown in Figure 9. We observed that the results were profoundly different from the arid case (Figure 8). In this case, the seeding with pure NaCl also resulted in a quantifiable and significant increase of P . In fact, the increase of P in the interval between 1 and 50 mm was larger using the NaCl seeding agent than utilizing the CSNT substance. However, the overall increase of precipitation when considering all precipitation intervals was still larger when the CSNT was used instead of pure NaCl (Figure 8f,g). The sum of P over the whole investigated area in the CSNT case was approximately 1.21 times larger than in the control case. This ratio was 1.12 if the seeding was performed using pure NaCl (a decrease of 7.44% from CSNT case).
In Figure 10, we finally describe the precipitation enhancing performances of two seeding materials in the case of continental climate of Serbia. This event was characterized with the largest amount of P when compared to the other two studied case. This severe thunderstorm also produced large hail [25]. Both precipitation enhancers analyzed in this study increased P (Figure 10c,e,g), but, similarly to the previous two events, the CSNT outperformed the pure NaCl. In particular, the largest increase of P was when CSNT is used for cloud seeding was observed for the moderate ( 25   mm < P < 50   mm ) and strong ( P > 50   mm ) precipitation intensities (Figure 10b,d,f). The ratios of the sum of P over the whole domain at 18:00 UTC between the seeded cases, on one side, and the control case, on the other side, were similar (but slightly larger) to the corresponding values from the maritime case. Namely, the overall P after the seeding with CSNT was 1.25 larger than in the control (UNSD) case. On the other hand, the ratio was 1.13 if pure NaCl is used for cloud seeding experiment.
Finally, we want to point out that while the present work demonstrated the higher precipitation enhancing potential of CSNT over pure NaCl in the three investigated case studies, more experimental and numerical research is needed in order to generalize this conclusion. A parametric study that would analyze the sensitivity of surface precipitation enhancement using CSNT under different model configurations including different planetary boundary layer and surface layer schemes, finer grid resolutions and different initial conditions would help to better understand the performances of this new seeding agent. In particular, the very fine grid resolution in the large eddy simulation mode of WRF coupled with the explicit treatment of aerosol in [16] might be required to accurately quantify the seeding material trajectories (advection and convection) and its activation inside the cloud. Also, the process of release of seeding particles upon drop evaporation, as well as the scavenging processes were not considered at this point but need to be included in the future work.

4. Conclusions

This article numerically investigated the performances of a new seeding material for precipitation enhancement—core/shell sodium chloride (NaCl)/titanium dioxide (TiO2) nanostructure (CSNT) [14]—in three different climate regions using the WRF (Weather Research and Forecasting) model. The considered climates were: (1) The arid climate of the United Arab Emirates (UAE) (17 July 2009); (2) the maritime climate of Thailand (25 July 2007); and (3) the continental climate of Serbia (21 July 2014). In all three cases, the precipitation enhancing performances of CSNT were compared against the test when seeding was conducted using pure NaCl, as well as against the control case when no seeding was carried out.
The results of this work demonstrated that CSNT outperformed the traditional pure NaCl in all three climate regions. However, the largest benefits of using the novel aerosol were found to be in the arid case of UAE. The scarcity of water vapor and small relative humidity in this desert region favors the growth of CSNT particles over pure NaCl. In the considered case of UAE, the increase of accumulated surface precipitation ( P ) from cloud seeded with pure NaCl was negligible. However, this result was limited to the conditions investigated in this study and we acknowledge that different weather scenarios, seeding conditions, and cloud properties (e.g., different seeding spatiotemporal windows, different sizes of aerosols and their concentration, altered updraft velocities, etc.) may lead to significantly different findings. In the same case of UAE, the CSNT resulted in approximately 1.4 times more P than in the control and NaCl cases.
The smallest differences between the seeded and the control cases were found in the case of maritime climate of Thailand. Due to the high relative humidity (~100%) on 25 July 2007 over Thailand, the activation characteristics of both seeding materials were similar and therefore the overall increase of P was also similar; namely, 1.2 P control and 1.1 P control using the CSNT and pure NaCl seeding substances, respectively. Lastly, the continental climate of Serbia fitted in between investigated maritime and arid cases in terms of the resulting precipitation enhancements after seeding with CSNT. In this experiment, both seeding agents lead to an intensification of P , but the increase was not as profound as in the arid case. More precisely, the increase of P using the CSNT substance was 1.25 times larger than in the control case.
By numerically investigating the activation properties of CSNT in several modelled atmospheric conditions, this article attempted to provide much needed data on the CSNT performances as a precipitation enhancer prior to its eventual field tests in the real atmosphere. By doing this, the paper demonstrates that CSNT could be particularly efficient seeding material in arid climates characterized with a scarcity of water vapor. However, more numerical and laboratory research work is needed before a definite conclusion can be drawn on the precipitation enhancing performances of CSNT.

Supplementary Materials

Supplementary data associated with the article can be found in https://www.mdpi.com/2073-4433/10/6/294/s1. These data include the animations of development of cumuliform clouds above the three investigated regions.

Author Contributions

Conceptualization, M.Ć.; methodology, M.Ć.; software, M.L. and D.R.; validation, M.Ć. and M.L.; formal analysis, M.Ć.; investigation, M.L.; resources, H.L. and M.L.; data curation, M.L., H.L. and D.R.; writing—original draft preparation, D.R.; writing—review and editing, D.R., M.L. and M.Ć.; visualization, M.L., D.R. and M.Ć.; supervision, M.Ć. and L.Z.; project administration, L.Z.; funding acquisition, M.Ć. and L.Z.

Funding

This research was funded by the National Center of Meteorology, Abu Dhabi, the United Arab Emirates (UAE) under the UAE Research Program for Rain Enhancement.

Acknowledgments

The authors would like to thank two reviewers for carefully reading the manuscript and providing insightful comments that significantly improved the quality of this study.

Conflicts of Interest

The authors declare no conflict of interest.

References

  1. WHO/UNICEF. Progress on Drinking Water, Sanitation and Hygiene: 2017 Update and SDG Baselines; World Health Organization (WHO) and the United Nations Children’s Fund (UNICEF): Geneva, Switzerland, 2017; p. 116. [Google Scholar]
  2. Mekonnen, M.M.; Hoekstra, A.Y. Four billion people facing severe water scarcity. Sci. Adv. 2016, 2, e1500323. [Google Scholar] [CrossRef] [PubMed]
  3. Zhao, T.; Dai, A. The Magnitude and Causes of Global Drought Changes in the Twenty-First Century under a Low–Moderate Emissions Scenario. J. Clim. 2015, 28, 4490–4512. [Google Scholar] [CrossRef]
  4. Dai, A. Drought under global warming: a review. Wiley Interdiscip. Rev. Clim. Chang. 2011, 2, 45–65. [Google Scholar] [CrossRef]
  5. Fleagle, R.G. Weather Modification Science and Public Policy; University of Washington Press: Seattle, WA, USA, 1970. [Google Scholar]
  6. Bruintjes, R.T. A review of cloud seeding experiments to enhance precipitation and some new prospects. Bull. Am. Meteor. Soc. 1999, 80, 805–820. [Google Scholar] [CrossRef]
  7. Cotton, W.R.; Pielke, R.A., Sr. Human Impacts on Weather and Climate; Cambridge University Press: Cambridge, UK; New York, NY, USA, 1995; ISBN 978-0-521-49592-9. [Google Scholar]
  8. DeFelice, T.P.; Axisa, D. Modern and prospective technologies for weather modification activities: Developing a framework for integrating autonomous unmanned aircraft systems. Atmos. Res. 2017, 193, 173–183. [Google Scholar] [CrossRef]
  9. Chen, B.; Xiao, H. Silver iodide seeding impact on the microphysics and dynamics of convective clouds in the high plains. Atmos. Res. 2010, 96, 186–207. [Google Scholar] [CrossRef]
  10. Guo, X.; Zheng, G.; Jin, D. A numerical comparison study of cloud seeding by silver iodide and liquid carbon dioxide. Atmos. Res. 2006, 79, 183–226. [Google Scholar] [CrossRef]
  11. Ćurić, M.; Janc, D. Dependence of the simulated seeding effects of Cb cloud on the types of the AgI agents. Meteorl. Atmos. Phys. 1993, 52, 91–100. [Google Scholar] [CrossRef]
  12. Ćurić, M.; Janc, D. Numerical study of the cloud seeding effects. Meteorl. Atmos. Phys. 1990, 42, 145–164. [Google Scholar] [CrossRef]
  13. Lompar, M.; Ćurić, M.; Romanic, D.; Zou, L.; Liang, H. Precipitation enhancement by cloud seeding using the shell structured TiO2/NaCl aerosol as revealed by new model for cloud seeding experiments. Atmos. Res. 2018, 212, 202–212. [Google Scholar] [CrossRef]
  14. Tai, Y.; Liang, H.; Zaki, A.; El Hadri, N.; Abshaev, A.M.; Huchunaev, B.M.; Griffiths, S.; Jouiad, M.; Zou, L. Core/shell microstructure induced synergistic effect for efficient water-droplet formation and cloud-seeding application. ACS Nano 2017, 11, 12318–12325. [Google Scholar] [CrossRef]
  15. Xue, L.; Hashimoto, A.; Murakami, M.; Rasmussen, R.; Tessendorf, S.A.; Breed, D.; Parkinson, S.; Holbrook, P.; Blestrud, D. Implementation of a Silver Iodide Cloud-Seeding Parameterization in WRF. Part I: Model Description and Idealized 2D Sensitivity Tests. J. Appl. Meteor. Climatol. 2013, 52, 1433–1457. [Google Scholar] [CrossRef] [Green Version]
  16. Thompson, G.; Eidhammer, T. A study of aerosol impacts on clouds and precipitation development in a large winter cyclone. J. Atmos. Sci. 2014, 71, 3636–3658. [Google Scholar] [CrossRef]
  17. Xue, L.; Tessendorf, S.A.; Nelson, E.; Rasmussen, R.; Breed, D.; Parkinson, S.; Holbrook, P.; Blestrud, D. Implementation of a Silver Iodide Cloud-Seeding Parameterization in WRF. Part II: 3D Simulations of Actual Seeding Events and Sensitivity Tests. J. Appl. Meteor. Climatol. 2013, 52, 1458–1476. [Google Scholar] [CrossRef] [Green Version]
  18. Kumar, P. Towards design and development of isothermal cloud chamber for seeding experiments in tropics and testing of pyrotechnic cartridge. J. Atmos. Sol.-Terr. Phys. 2018, 181, 79–93. [Google Scholar] [CrossRef]
  19. Garvey, D.M. Testing of Cloud Seeding Materials at the Cloud Simulation and Aerosol Laboratory, 1971–1973. J. Appl. Meteor. 1975, 14, 883–890. [Google Scholar] [CrossRef]
  20. Kulkarni, J.R.; Morwal, S.B.; Deshpande, N.R. Rainfall enhancement in Karnataka state cloud seeding program “Varshadhare” 2017. Atmos. Res. 2019, 219, 65–76. [Google Scholar] [CrossRef]
  21. Vujović, D.; Protić, M. The behavior of the radar parameters of cumulonimbus clouds during cloud seeding with AgI. Atmos. Res. 2017, 189, 33–46. [Google Scholar] [CrossRef]
  22. Freud, E.; Koussevitzky, H.; Goren, T.; Rosenfeld, D. Cloud microphysical background for the Israel-4 cloud seeding experiment. Atmos. Res. 2015, 158–159, 122–138. [Google Scholar] [CrossRef]
  23. Fajardo, C.; Costa, G.; Ortiz, L.T.; Nande, M.; Rodríguez-Membibre, M.L.; Martín, M.; Sánchez-Fortún, S. Potential risk of acute toxicity induced by AgI cloud seeding on soil and freshwater biota. Ecotoxicol. Environ. Saf. 2016, 133, 433–441. [Google Scholar] [CrossRef]
  24. Ćurić, M.; Janc, D. Wet deposition of the seeding agent after weather modification activities. Environ. Sci. Pollut. Res. 2013, 20, 6344–6350. [Google Scholar] [CrossRef]
  25. Lompar, M.; Ćurić, M.; Romanic, D. Simulation of a severe convective storm using a numerical model with explicitly incorporated aerosols. Atmos. Res. 2017, 194, 164–177. [Google Scholar] [CrossRef]
  26. RAL | | Feasibility Study of the Potential for Rainfall Enhancement - United Arab Emirates. Available online: https://ral.ucar.edu/projects/UAE/ (accessed on 21 May 2019).
  27. Breed, D.; Jensen, T.; Bruintjes, R.; Piketh, S.; Al Mangoosh, A.; Al Mandous, A. Precipitation Development in Convective Clouds over the Eastern Arabian Peninsula (2005- H20SUPPLY); AMS Conference on Planned and Inadvertent Weather Modification American Meteorological Society: San Diego, CA, USA, 2005; J10.6. [Google Scholar]
  28. Yousef, L.A.; Temimi, M.; Wehbe, Y.; Mandous, A.A. Total cloud cover climatology over the United Arab Emirates. Atmos. Sci. Lett. 2019, 20, e883. [Google Scholar] [CrossRef]
  29. Singhrattna, N.; Rajagopalan, B.; Kumar, K.K.; Clark, M. Interannual and Interdecadal Variability of Thailand Summer Monsoon Season. J. Clim. 2005, 18, 1697–1708. [Google Scholar] [CrossRef]
  30. Xue, L.; Edwards, R.; Huggins, A.; Lou, X.; Rasmussen, R.; Tessendorf, S.; Holbrook, P.; Blestrud, D.; Kunkel, M.; Glenn, B.; et al. WRF Large-eddy Simulations of chemical tracer deposition and seeding effect over complex terrain from ground- and aircraft-based AgI generators. Atmos. Res. 2017, 190, 89–103. [Google Scholar] [CrossRef]
  31. Lompar, M.; Ćurić, M.; Romanic, D. Implementation of a gust front head collapse scheme in the WRF numerical model. Atmos. Res. 2018, 203, 231–245. [Google Scholar] [CrossRef]
  32. Efstathiou, G.A.; Zoumakis, N.M.; Melas, D.; Lolis, C.J.; Kassomenos, P. Sensitivity of WRF to boundary layer parameterizations in simulating a heavy rainfall event using different microphysical schemes. Effect on large-scale processes. Atmos. Res. 2013, 132–133, 125–143. [Google Scholar] [CrossRef]
  33. Beck, H.E.; Zimmermann, N.E.; McVicar, T.R.; Vergopolan, N.; Berg, A.; Wood, E.F. Present and future Köppen-Geiger climate classification maps at 1-km resolution. Sci. Data 2018, 5, 180214. [Google Scholar] [CrossRef]
  34. Peel, M.C.; Finlayson, B.L.; McMahon, T.A. Updated world map of the Köppen-Geiger climate classification. Hydrol. Earth Syst. Sci. 2007, 11, 1633–1644. [Google Scholar] [CrossRef]
  35. Harris, I.; Jones, P.D.; Osborn, T.J.; Lister, D.H. Updated high-resolution grids of monthly climatic observations – the CRU TS3.10 Dataset. Int. J. Climatol. 2014, 34, 623–642. [Google Scholar] [CrossRef]
  36. Colarco, P.; da Silva, A.; Chin, M.; Diehl, T. Online simulations of global aerosol distributions in the NASA GEOS-4 model and comparisons to satellite and ground-based aerosol optical depth. J. Geophys. Res. 2010, 115, D14207. [Google Scholar] [CrossRef]
  37. Ginoux, P.; Chin, M.; Tegen, I.; Prospero, J.M.; Holben, B.; Dubovik, O.; Lin, S.-J. Sources and distributions of dust aerosols simulated with the GOCART model. J. Geophys. Res. 2001, 106, 20255–20273. [Google Scholar] [CrossRef]
  38. Pruppacher, H.R.; Klet, J.D. Microphysics of Clouds and Precipitation, 2nd ed.; Atmospheric and Oceanographic Sciences Library; Springer: Heidelberg, Germany; Dordrecht, The Netherlands, 2010; Volume 18, ISBN 978-0-7923-4211-3. [Google Scholar]
  39. Petters, M.D.; Kreidenweis, S.M. A single parameter representation of hygroscopic growth and cloud condensation nucleus activity. Atmos. Chem. Phys. 2007, 7, 1961–1971. [Google Scholar] [CrossRef] [Green Version]
  40. Mlawer, E.J.; Taubman, S.J.; Brown, P.D.; Iacono, M.J.; Clough, S.A. Radiative transfer for inhomogeneous atmospheres: RRTM, a validated correlated-k model for the longwave. J. Geophys. Res. Atmos. 1997, 102, 16663–16682. [Google Scholar] [CrossRef] [Green Version]
  41. Dudhia, J. Numerical Study of Convection Observed during the Winter Monsoon Experiment Using a Mesoscale Two-Dimensional Model. J. Atmos. Sci. 1988, 46, 3077–3107. [Google Scholar] [CrossRef]
  42. Ek, M.B.; Mitchell, K.E.; Lin, Y.; Rogers, E.; Grunmann, P.; Koren, V.; Gayno, G.; Tarpley, J.D. Implementation of Noah land surface model advances in the National Centers for Environmental Prediction operational mesoscale Eta model. J. Geophys. Res. 2003, 108, 8851. [Google Scholar] [CrossRef]
  43. Kain, J.S. The Kain–Fritsch Convective Parameterization: An Update. J. Appl. Meteor. 2004, 43, 170–181. [Google Scholar] [CrossRef]
  44. Potter, M.C.; Wiggert, D.C.; Ramadan, B.H. Mechanics of Fluids; Cengage Learning: Boston, MA, USA, 2011; ISBN 978-0-495-66773-5. [Google Scholar]
Figure 1. Three climate types considered for the cloud seeding experiments (grey rectangles): (a) Arid climate of UAE; (b) maritime climate of Thailand; and (c) temperate continental climate of Serbia. Modified after [33].
Atmosphere 10 00294 g001
Figure 2. Average monthly rainfall for three investigated regions in the period 1991–2016. The y -axis is logarithmic in order to depict the small values of precipitation in the arid region of the UAE. Data source: [35] (obtained at: http://sdwebx.worldbank.org/climateportal/).
Atmosphere 10 00294 g002
Figure 3. Synoptic charts for: (a) The UAE on 17 July 2009 (00:00 UTC); (b) Thailand on of 25 July 2007 (00:00 UTC); and (c) Serbia on 21 July 2014 (12:00 UTC). Purple and blue lines are the mean sea level pressure (MSLP; in hPa) and the height of 500-hPa pressure surface (in geopotential decameters), respectively. Wind velocity (green arrows) are plotted at 500 hPa. The reference length of wind velocity vector provided below plots. Data are based on GFS (Global Forecasting System) reanalysis at the horizontal resolution of 0.25° × 0.25°.
Atmosphere 10 00294 g003
Figure 4. Weather research and forecasting (WRF) model domains with the focus on: (a) UAE; (b) Thailand; and (c) Serbia.
Atmosphere 10 00294 g004
Figure 5. 3D cloud rendering from WRF model over (a) UAE; (b) Thailand; and (c) Serbia. The white color is the sum of mixing ratios of cloud water, rain, snow, ice and graupel (isoline of 5 × 10⁻⁷ kg kg−1 shown) while the cyan color is the mixing ratio of rain-water alone (isoline of 5.3 × 10⁻⁵ kg kg−1 shown).
Atmosphere 10 00294 g005
Figure 6. Side view (from the south) of the seeded cloud systems over (a) UAE; (b) Thailand; and (c) Serbia. See Figure 5 for interpretation of colors.
Atmosphere 10 00294 g006
Figure 7. Modelled skew- T –log P diagrams for (a) UAE (b) Thailand and (c) Serbia. Time and location of profiles shown in each plot. The thick black and green lines are the vertical profiles of temperature and dew point, respectively. Heights of significant pressure levels are given in the ordinate (in m). The lifted condensation level (LCL) and the level of free convection (LFC) are shown with blue lines. The values of model-estimated convective available potential energy (CAPE) are also included in the plots. The seeding layers shown with horizontal pink lines (~100 m deep).
Atmosphere 10 00294 g007
Figure 8. Spatial distribution of accumulated precipitations for the arid case of the UAE for (a) the unseeded case (UNSD), (b) core/shell sodium chloride (NaCl) and (d) sodium chloride (NaCl)/titanium dioxide (TiO2) nanostructure (CSNT) cases. The red rectangle shows the seeding region. The differences between the accumulated precipitation in the cases shown in panels (c) and (e). (f) Bar plot of areas characterized with different intensities of accumulated precipitations. (g) Time histories of accumulated precipitation in the UNSD (blue), NaCl (green) and CSNT (red) cases.
Atmosphere 10 00294 g008
Figure 9. Spatial distribution of accumulated precipitations for the arid case of the Thailand for (a) the unseeded case (UNSD), (b) core/shell sodium chloride (NaCl) and (d) sodium chloride (NaCl)/titanium dioxide (TiO2) nanostructure (CSNT) cases. The red rectangle shows the seeding region. The differences between the accumulated precipitation in the cases shown in panels (c) and (e). (f) Bar plot of areas characterized with different intensities of accumulated precipitations. (g) Time histories of accumulated precipitation in the UNSD (blue), NaCl (green) and CSNT (red) cases.
Atmosphere 10 00294 g009
Figure 10. Spatial distribution of accumulated precipitations for the arid case of the Serbia for (a) the unseeded case (UNSD), (b) core/shell sodium chloride (NaCl) and (d) sodium chloride (NaCl)/titanium dioxide (TiO2) nanostructure (CSNT) cases. The red rectangle shows the seeding region. The differences between the accumulated precipitation in the cases shown in panels (c) and (e). (f) Bar plot of areas characterized with different intensities of accumulated precipitations. (g) Time histories of accumulated precipitation in the UNSD (blue), NaCl (green) and CSNT (red) cases.
Atmosphere 10 00294 g010
Table 1. WRF physics packages used in this study.
WRF SchemeScheme Name
Microphysics Modified Thompson and Eidhammer (2014) [16]
Longwave radiation RRTM [40]
Shortwave radiation Dudhia (1989) [41]
Gust front head collapse Lompar et al. (2018) [31]
Land surface Noah [42]
Cumulus convectionKain-Fritsch [43]
Planetary boundary layerYonsei University

