Abstract
The characteristics and formation of a synoptic situation that causes a sudden turning motion of warm-sector mesoscale convective systems (MCSs) over South China are described, based on the collection and investigation of associated cases during April–June 2011–2017 using high-resolution observational data and ERA (ECMWF Re-Analysis)-Interim data. The results show that the blocking of a marked low-level high over eastern China (eastern high) on a strengthening low-level trough over southwestern China (southwestern trough) results in significant enhancement of southerly winds ahead of the trough, which produces a strong southeastward vertical wind shear at low levels near western Guangdong province. This low-level vertical wind shear results in sudden southeastward turning motion for the warm-sector MCSs entering into Guangdong province from Guangxi province. The formation of the eastern high is mainly attributable to the strong cyclonic wind anomaly over the northwestern Pacific Ocean, which continuously brings cold air from higher latitudes to eastern China, where high synoptic-scale transient anomaly of geopotential height (SSTA-GH) forms. This cyclonic wind anomaly is induced by a low SSTA-GH, which travels from the north and south sides of the Tibetan Plateau to the northwestern Pacific Ocean and develops significantly as a result of a strong upper-level low SSTA-GH coupling with it or approaching it. On the other hand, the high SSTA-GH over eastern China blocks the eastward extension of the low SSTA-GH originating from the Tibetan Plateau. Consequently, this low SSTA-GH turns to extend or move southeastward/southward to southwestern China, leading to intensification of the southwestern trough.
1. Introduction
The rainfall of the pre-flood rainy season (April–June) contributes more than 40% of the annual rainfall for South China, and warm-sector mesoscale convective systems (MCSs) have been indicated as the principal systems causing heavy or extreme rainstorms in this rainy season [1,2,3,4]. Compared to frontal rainfall systems, warm-sector MCSs are harder to predict [5], owing to difficulties in accurately capturing their initiation, development and motion.
Numerous studies have emphasized the important role of low-level jets (LLJs) in the initiation of MCSs over South China [6], because of their significant effect on the enhancement of upward motion (e.g., References [7,8,9]), moisture flux (e.g., References [10,11,12]) and atmospheric instability (e.g., References [13,14,15,16]). On the other hand, the convergence induced by the differential surface friction between the land and sea and orographic uplift in the context of an LLJ have been shown clearly to activate the initiation of warm-sector MCSs [17]. Furthermore, mesoscale wind convergence or shear lines can also promote the initiation of warm-sector rainfall, even if no evident LLJ occurs (e.g., References [18,19,20]).
The development of MCSs are believed to be closely related to the organizational process which is a key factor leading to the occurrence of heavy rainfall (e.g., References [21,22,23]). Many rainstorms in South China are often produced by well-organized mesoscale β (or γ) convective systems [24,25] which are primarily band-shaped [26]. A train of multiple rain bands that move successively with the steering of upper-level winds is one of the most important organization modes of MCSs over South China (e.g., References [19,27,28]). Furthermore, the synoptic situation plays a key role in the organization of MCSs (e.g., References [23,29,30]). With regard to South China, a low-level wind shear line oriented between the southwesterly and southeasterly, an LLJ along the coastal region or ahead of a southward moving cold front, and the convergence between southwesterly and easterly winds, are the characteristic synoptic ingredients that modulate the organization of warm-sector MCSs (e.g., References [2,5,6]).
The motion characteristics of MCSs also have a great impact on the evolution of warm-sector MCSs. However, in contrast to their initiation and development, the motion of MCSs over South China has seldom been investigated, especially for those with complex motion. Several methods or conditions have been proposed to identify the nature of MCS motion. Based on an examination of some 100 MCS events, Merritt and Fritsch [31] found that the most active convective portion of an MCS tends to move along the 850–300 hPa thickness isopleths, and the motion speed appears to be modulated by the magnitude and relative position of low-level moisture convergence. Later, Juying and Scofield [32] classified MCSs into fast and slow forward-propagating, backward-propagating, and regenerating MCSs, which can be identified by different features in satellite, surface and upper-air observations. Aside from confirming that forward-propagating MCSs move parallel to the 850–300 hPa thickness isopleths, they emphasized the importance of thickness diffluence to the slow forward- and backward-propagating MCSs. Moore et al. [33] introduced a list of synoptic conditions to assist in identifying where forward propagation, backward propagation, and quasi-stationary situations tend to occur for MCSs. In addition to the 850–300 hPa mean wind and a diffluent thickness, the key ingredients shown in these synoptic conditions include maximum convective available potential energy, a frontal boundary, an 850-hPa theta-e (equivalent potential temperature) ridge axis, a 300-hPa upper-level jet, and a southerly LLJ. These ingredients help in identifying the nature of MCS motion based on the relationship between the area favorable for new cell development and the MCS location, as MCSs tend to move to places of new cell generation. Furthermore, Corfidi et al. [34] described a vector-based method for calculating the motion of MCSs which is useful in forecasting the motion of upwind propagating MCSs. With respect to downwind-propagating MCSs, Corfidi [35] revised this vector-based method by adding the derived MCS motion vector to the cell motion vector to produce a new motion vector. These studies, from another point of view, indicate the importance of synoptic environment or situation to MCS motion.
A study [36] of a heavy rainfall case that occurred in South China on 8 May 2014 (case 20140508) showed sudden turning motion of warm-sector MCSs, which led to a significant migration of heavy rainfall from the northwest to the coastal region of Guangdong province. This sudden turning motion of warm-sector MCSs has not been investigated previously, and is likely to cause difficulty in forecasting the location of heavy rainfall. Further investigation revealed that this sudden turning motion of warm-sector MCSs was induced by the evolution of the synoptic situation characterized by the blocking of a low-level anticyclone over eastern China on a strengthening low-level trough over the southwest. The evolution of this synoptic situation resulted in a strong vertical wind shear at low levels, which promoted the sudden turning motion of the warm-sector MCSs. However, whether this synoptic situation is common to cause sudden turning motion of warm-sector MCSs needs further verification. In the present study, more cases during the pre-flood rainy seasons of 2011–2017 that presented a sudden turning motion of warm-sector MCSs over South China are collected using high-resolution observational data. The evolution characteristics of the synoptic situations for these cases are then analyzed to verify whether the synoptic situation of case 20140508 was typical in its cause of sudden turning motion of warm-sector MCSs, utilizing ERA (ECMWF Re-Analysis)-Interim data. Additionally, how this prevailing synoptic situation forms is worthy of further investigation, as it may provide some early signals for the cause of sudden turning motion of warm-sector MCSs. Thus, the discussion of the formation of such a synoptic situation is another important part of this study.
Following this introduction, Section 2 describes the data and methods used in our analysis. The characteristics and formation of the synoptic situation that causes sudden turning motion of warm-sector MCSs are analyzed and discussed in Section 3 and Section 4, respectively, based on verification of the synoptic situation with collected cases. Conclusions and some further discussion are presented in Section 5.
2. Data and Methods
The provinces of Guangxi and Guangdong in South China (shaded areas in Figure 1a), where multiple types of observations are available, are taken as the study area (Figure 1b). The dense network of automatic weather stations in these provinces, as well as the surrounding sea region (gray dots in Figure 1b), provides observations of near-surface wind, temperature and rainfall, at 1-h time intervals, for analysis of the evolution of rainfall and near-surface wind and temperature. The observations of wind from L-band (L wave band) radiosonde stations (marked by circles in Figure 1b) are used to analyze the vertical wind profile. The L-band radiosonde data are available at a vertical resolution of 5 m and valid at 08:00 and 20:00 Beijing Time. These data are resampled with a vertical resolution of 50 m, which is sufficient to characterize the vertical structure of wind. The radars in/nearby the study area (marked by rectangles in Figure 1b), with reflectivity data at 0.5-h intervals, are utilized to provide composite mosaic radar reflectivity for analysis of the evolution of MCSs. All these observational data are provided by the China Meteorological Administration, and cover the months of April–June (the pre-flood rainy season in South China) for the period 2011–2017. Furthermore, daily ERA-Interim data [37,38], at a resolution of 0.75° × 0.75° and with the same time span, obtained from the publicly accessible website of the European Centre for Medium-Range Weather Forecasts (ECMWF), are used to analyze the synoptic situation, including the mean sea level (MSL) and 850- and 500-hPa circulations.
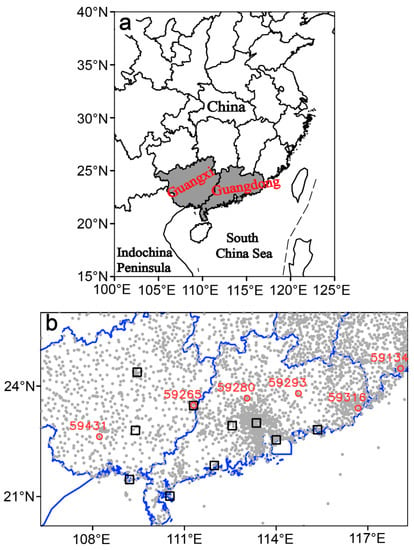
Figure 1.
(a) Map of the locations of the provinces of Guangxi and Guangdong (the shaded areas) in South China. (b) Distributions of surface (dots), radiosonde (circles) and radar (rectangles) stations in the provinces of Guangxi and Guangdong. The numbers “59431”, “59265”, “59280”, “59293”, “59316” and “59134” denote radiosonde station IDs.
All cases presenting sudden turning motion of MCSs during April–June 2011–2017 are preliminarily identified through analysis of the evolution of the hourly rainfall. These cases are then further confirmed by analyzing the evolution of the composite mosaic radar reflectivity. Furthermore, the distributions of the hourly near-surface temperature and wind assist by ensuring the MCSs are within the warm sector. The characteristics of MSL and 850- and 500-hPa circulations for these cases are then investigated. On this basis, cases with a similar synoptic situation to case 20140508 are ultimately identified. The main periods of these cases are shown in Table 1.

Table 1.
The occurrence times of the cases presenting sudden turning motion of mesoscale convective systems (MCSs) from eastward/northeastward to southeastward over South China during the April–June (pre-flood rainy season) periods of 2011-2017.
The L-band radiosonde data are utilized to estimate the motion vectors of the MCSs influenced by the synoptic situation of the studied cases, based on the vector-based method described in Corfidi et al. [34]. This vector-based method is suitable for estimating the motion of upwind-propagating (or back-building) MCSs, which are common among the cases studied here (see the composite mosaic radar reflectivity in Figure 2). The method involves three main vectors, called cell (C), system (S) and propagation (P) vectors (refer to Figure 1 in Corfidi et al. [34]), which satisfy the relationship P = S − C. Based on observational analysis, Corfidi et al. [34] found that cells tend to move with the mean 850–300-hPa wind with respect to speed and direction. This was consistent with the observational studies of Brooks [39] and Byers and Battan [40]. On the other hand, the magnitude and direction of the propagation vector P are assumed to be equal and opposite to those of the LLJ, and the LLJ vector is defined as the maximum wind vector below 3.5 km. Based on these methods for calculating the cell and propagation vectors, the system motion vector S can be obtained. This vector runs parallel to the low-level shear, roughly between 1 and 3.5 km above MSL. The actual motion of a MCS is obtained by checking the evolution of composite mosaic radar reflectivity at 0.5-h intervals, focusing on the evolution of the location and orientation of the MCS. The orientation of a MCS is defined as the rough direction of the axis of intense convection area (larger than 20 dBz), which is indicated by the dashed lines in Figure 2. These lines also help to mark the locations of the MCSs. The motion of a MCS is then obtained by comparing the locations of the MCS at two adjacent moments at 0.5-h intervals. In this way, the actual MCS motion is obtained and compared with the estimated MCS motion to verify the influence of the synoptic situation on the motion of the MCS.
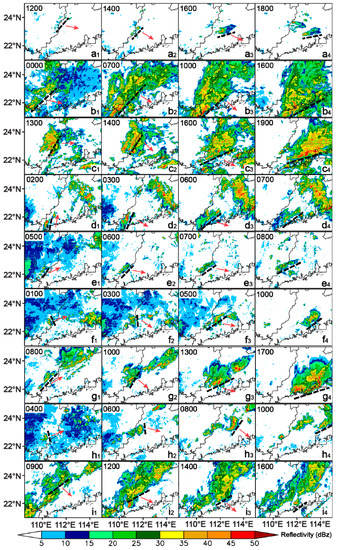
Figure 2.
Evolution of composite mosaic radar reflectivity (color-shaded; units: dBZ) over South China for cases 1 to 9 (a–i). The occurrence times of the cases are shown in Table 1, and the times labeled in the bottom-right corner of each panel are Beijing Times (BTs). The dashed lines indicate the locations and orientations of the mesoscale convective systems (MCSs), and the arrows indicate their motion directions.
Additionally, a decomposition method for regional-scale atmospheric transient anomalies, proposed by Qian [41], is used to investigate the formation of the low-level anticyclone over eastern China and the intensification of the low-level trough over southwestern China, which were indicated as the key synoptic situation characteristics for the sudden turning motion of MCSs in case 20140508. As described in this decomposition method, atmospheric variables can be decomposed into four parts: the zonal time-average climate symmetric part, the time-average climate asymmetric part, the zonal-average transient symmetric anomaly, and the transient asymmetric anomaly. These parts are denoted by the right-hand terms of Equation (1):
Here, denotes the state of an atmospheric variable (geopotential height, wind, temperature, humidity, etc.) at longitude and latitude , and on day of year . The denotation of is shown by Equation (2), which represents the zonal () and years’ () average of at latitude and on day . and are obtained by subtracting from the years’ and the zonal averages of , respectively (Equations (3) and (4)). On this basis, the transient asymmetric anomaly is derived by subtracting , and from (Equation (5)):
The transient asymmetric anomaly represents the regional-scale/synoptic-scale atmospheric transient anomaly, which has been proven to be a very useful parameter for the analysis and prediction of the early signal of a great number of synoptic events causing severe disasters, such as events of extreme temperature [42], regional rainstorms [43], snow-ice storms [44], typhoons [45], and tornados [46].
3. Characteristics of the Synoptic Situation Causing the Turning Motion of Mesoscale Convective Systems (MCSs)
All the cases featuring significant turning motion of warm-sector MCSs (simply MCSs hereafter) under a similar synoptic situation to case 20140508 during April–June 2011–2017 are listed in Table 1. As mentioned previously, identification of these cases is based on analysis of the surface rainfall, temperature and winds, composite mosaic radar reflectivity, and ERA-Interim data. Many of the MCSs in these cases exhibit a transition from a symmetric line to an asymmetric MCS during their mature-to-dissipating stages (Figure 2), which is consistent with the life cycle of MCSs indicated by Loehrer and Johnson [47]. Along with this transition, the movement of MCSs in these cases is clearly illustrated. A sudden southeastward turning motion of MCSs is apparent in all these cases when the MCSs move into Guangdong province from Guangxi province. Owing to this southeastward turning motion, the orientation of the MCSs changes accordingly to southwest–northeast, which runs parallel to the coastline of Guangdong province. These changes in MCS motion and orientation lead to the migration of a large area of the rainstorm towards the coastal region of Guangdong province, where most modern cities in this province are located. Furthermore, the MCSs tend to move eastward (Figure 2a–c,i) or northeastward (Figure 2d–h) before they suddenly turn to move southeastward.
Regarding the similarity of the synoptic situations of these cases, the composite MSL and 850- and 500-hPa circulations are calculated and depicted in Figure 3. The most common characteristics for these cases appear at 850 hPa, featuring a strong trough and a marked high over southwestern and eastern China (referred to as the southwestern trough and eastern high hereafter), respectively (Figure 3(b1,b2)). The eastern high evolves into an anticyclone in some cases (e.g., case 3) in which it is strong enough. The eastern high maintains its strength and blocks the southwestern trough from moving eastward. At the same time, the southwestern trough intensifies markedly. As a result, large geopotential height gradients and much larger associated winds occur ahead of the southwestern trough (according to the geostrophic wind relation), as well as a counterclockwise rotation of the orientation of these winds from southwesterly to southerly (Figure 3b2). A low center in the MSL pressure (MSLP) field forms correspondingly under the southwestern trough, while a high MSLP center occurs under the eastern high (Figure 3(a1,a2)). Corresponding to the intensification of the southwestern trough and the maintenance of the eastern high, the low MSLP center reinforces in southwestern China, while the high MSLP center strengthens and expands southwestward to South China (Figure 3a2). Consequently, warm southerly (southwesterly or southeasterly) winds enhance near the surface of South China (Figure 3a2). The enhancement of the southerly winds likely encourages the development of the MCSs during their southeastward motion, as these winds collide with the MCSs in a direction opposite to their movement. In contrast, the 500-hPa circulation exhibits no distinct change when the MCSs turn to move southeastward. Additionally, the trough and ridge shown in the 500-hPa circulation are weak over South China. These findings indicate that the sudden turning motion and development of the MCSs over South China in these cases are principally related to the evolution of the low-level circulation rather than the middle- or upper-level circulation.
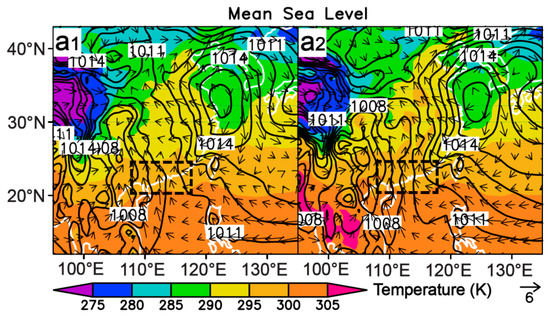
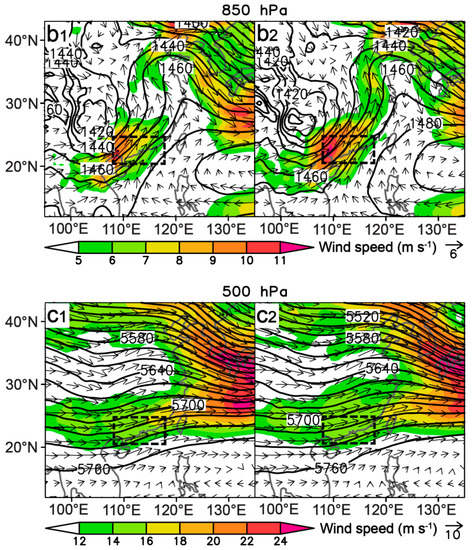
Figure 3.
Composite (a1–a2) mean-sea-level pressures (color-shaded; units: hPa) and wind vectors (units: m s−1), and (b1–b2) 850-hPa and (c1–c2) 500-hPa geopotential heights (contours; units: gpm) and winds (color-shaded: wind speeds; vectors: wind vectors; units: m s−1) before (a1,b1,c1) and after (a2,b2,c2) MCSs turned to move southeastward. The solid rectangles indicate the location of the provinces of Guangdong and Guangxi.
As indicated in our previous case study [36], the synoptic situation described above can result in a strong low-level vertical wind shear, which is the key factor causing the sudden turning motion of MCSs. To verify whether all the cases here feature a significant low-level vertical wind shear vector favorable for the turning motion of MCSs, the vertical wind profiles and their evolution near the motion path of the MCSs are shown in Figure 4 and Figure 5, respectively. As the observation of the vertical wind profiles are at 12-h intervals, they are not able to be used to verify the actual motion of the MCSs at 0.5-h intervals which are shown in Figure 2. Instead, they are used to verify the overall motion evolution of the MCSs under the studied synoptic situation, that is, whether they exhibit a marked change of low-level vertical wind shear for the motion of MCSs from eastward/northeastward to southeastward. As shown in Figure 4, an LLJ occurring ahead of the southwestern trough (Figure 3(b1,b2)) is a principal feature for all cases. Particularly, the LLJ center mainly prevails over western Guangdong province where radiosonde stations “59265” and “59280” are located (Figure 1b and Figure 4). As pointed out by Corfidi et al. [34], the propagation vector P of an MCS is equal in magnitude and opposite in direction to the LLJ. Thus, the motion of MCSs will be affected by the LLJ when they move into Guangdong province from Guangxi province. Furthermore, a sudden southeastward turning motion of MCSs requires a more southerly LLJ, which we demonstrated in our previous study (Figure 8 in Liang et al. [36]). In this regard, hodographs of the radiosonde station near the motion paths of MCSs before (black dots) and after (red dots) their turning motion are shown and compared in Figure 5 for each case. Basically, a significant reinforcement of southerly winds is apparent below 3.5 km (open circles in Figure 5) for all cases during the periods of southeastward turning motion of MCSs. This is consistent with the result shown in the evolution of 850-hPa circulation (Figure 3(b1,b2)), which indicates that the strengthening of the southwestern trough and the blocking of the eastern high on the trough significantly promote the occurrence of strong southerly winds ahead of it. In addition, the motion vectors of the MCSs (black and red vectors in Figure 5) are calculated using the vector-based method described in Section 2. A clockwise rotation of the motion vector of the MCSs (compare the red and black vectors in Figure 5) is obvious for all cases, because of the reinforcement of southerly winds ahead of the southwestern trough. This rotation of the MCS motion vector corresponds to the southeastward turning motion of the MCSs. This analysis verifies that the synoptic situation characterized by intensification of the southwestern trough and blocking of the eastern high on the trough is a synoptic situation that can lead to a sudden turning motion of MCSs over South China, owing to a strong southeastward MCS motion vector provoked by the reinforcement of southerly winds ahead of the southwestern trough. Furthermore, the turning motion of the MCSs generally occurs when they move into Guangdong province, as the reinforcement of southerly winds ahead of the southwestern trough principally happens over the boundary area between Guangxi and Guangdong provinces and western Guangdong province under this synoptic situation.
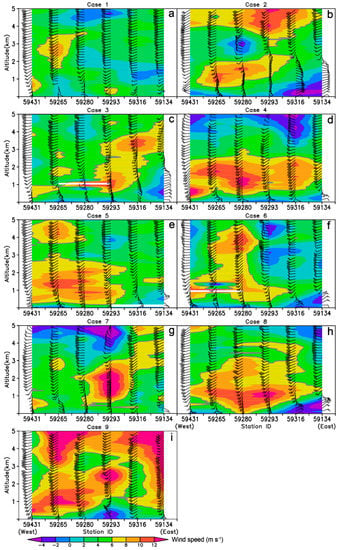
Figure 4.
Vertical sections of wind speeds (color-shaded; units: m s−1) and vectors along radiosonde stations “59431”–“59265”–“59280”–“59293”–“59316”–“59134” for cases 1 to 9 (a–i; a: 2000 BT 11 April 2012; b: 0800 BT 6 April 2014; c: 2000 BT 8 May 2014; d: 0800 BT 23 May 2014; e: 0800 BT 1 May 2015; f: 2000 BT 5 May 2015; g: 2000 BT 4 April 2016; h: 0800 BT 15 April 2016; i: 2000 BT 19 April 2017). The locations of the radiosonde stations are shown in Figure 1b.
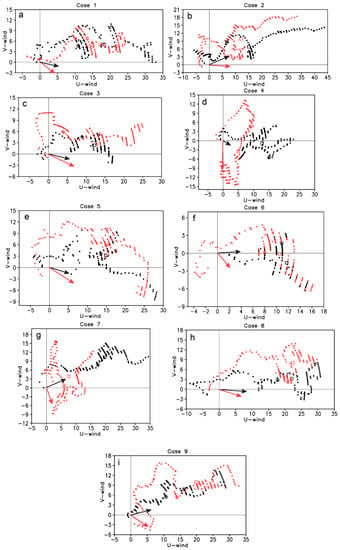
Figure 5.
Hodographs of radiosonde stations (a: “59265”; b: “59265”; c: “59293”; d: “59280”; e: “59265”; f: “59265”; g: “59293”; h: “59265”; i: “59293”) before (black) and after (red) MCSs turned to move southeastward (a–i: cases 1–9). The times for the black hodographs in a–i are 0800 BT 11 April 2012, 2000 BT 5 April 2014, 0800 BT 8 May 2014, 2000 BT 22 May 2014, 2000 BT 30 April 2015, 2000 BT 4 May 2015, 0800 BT 4 April 2016, 2000 BT 14 April 2016 and 0800 BT 19 April 2017, respectively, and the times for the red hodographs are 12 h later. The open circles indicate the wind vector (units: m s−1) at 3.5 km and the open rectangles indicate the mean wind vector (units: m s−1) between 850 and 300 hPa. The vectors plotted on the hodographs indicate the motion vectors of MCSs.
In addition, the enhancement of southerly winds associated with the intensification/maintenance of the southwestern trough and the eastern high greatly improve the water vapor flux over South China (see the departures of low-level winds and water vapor fluxes in Figure 6), which largely favors the development of MCSs during their turning motion. The increase in water vapor flux is attributable to the enhancement of southwesterly winds ahead of the southwestern trough for most of the cases (Figure 6a,b,d–f,h,i), and the enhancement of southeasterly winds relates to the reinforcement of the eastern high in some cases (Figure 6c,g).
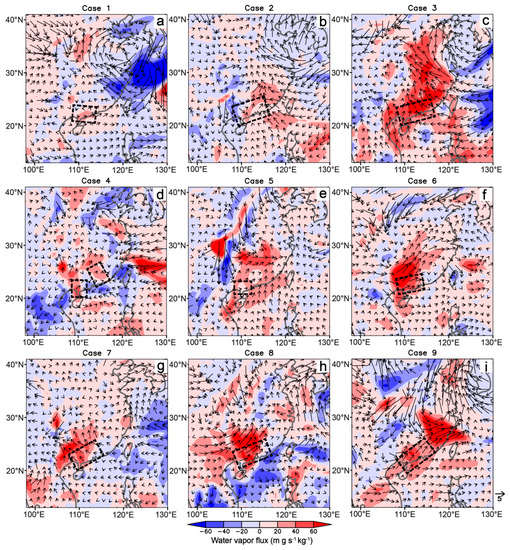
Figure 6.
Distributions of low-level water vapor flux (color-shaded; units: m g kg−1 s−1) and wind vector (units: m s−1) increments for cases 1–9 (a–i) when MCSs turned to move southeastward. The levels for a–i are 775, 850, 900, 900, 850, 800, 900, 975 and 750 hPa, respectively. The differences for a–i are calculated by the fields at 1400 BT 11 April 2012, 0800 BT 6 April 2014, 2000 BT 8 May 2014, 0800 BT 23 May 2014, 0800 BT 1 May 2015, 1400 BT 5 May 2015, 2000 BT 4 April 2016, 1400 BT 15 April 2016 and 1400 BT 19 April 2017 subtracting those 6 h earlier, respectively. The dashed rectangles indicate the locations of the MCSs.
4. Formation of the Synoptic Situation Causing Turning Motion of MCSs
The above results indicate that the southwestern trough and the eastern high are the main synoptic ingredients for the sudden turning motion of MCSs over South China. The southwestern trough is a common synoptic ingredient during the April–June period, as indicated by the 10-yr (2008–2017) average of low-level circulation in this period for each case (contours in Figure 7). The formation of the southwestern trough is believed to be the result of the southern branch of westerlies flowing around the Yunnan–Guizhou Plateau (the southeast corner of the gray-shaded area in Figure 7). However, the eastern high is not universally and significantly shown in the 10-yr average of low-level circulation during the April–June period (contours in Figure 7). Regarding Equation (1), taking as the circulation (geopotential height), the 10-yr average of low-level circulation is actually the sum of the parts and . Additionally, represents the zonal-average circulation and cannot capture the local system. Thus, it can be inferred that the formation of the eastern high is associated with the evolution of the remaining part of the circulation; that is, the synoptic-scale transient anomaly . Incidentally, the cause of the intensification of the southwestern trough can be analyzed by the evolution of the synoptic-scale transient anomaly.
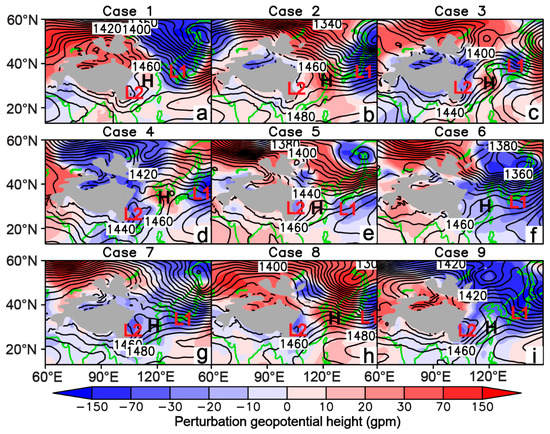
Figure 7.
Distributions of synoptic-scale transient anomaly (SSTA; color-shaded) and 10-yr (2008–2017) averages (contours) of geopotential height (GH; units: gpm) at 850 hPa near the time when MCSs turned to move southeastward (a–i: cases 1–9; a: 1400 BT 11 April 2012; b: 0800 BT 6 April 2014; c: 2000 BT 8 May 2014; d: 1400 BT 22 May 2014; e: 1400 BT 30 April 2015; f: 0800 BT 5 May 2015; g: 1400 BT 4 April 2016; h: 0800 BT 15 April 2016; i: 0800 BT 19 April 2017). “H”, “L1” and “L2” indicate the high synoptic-scale transient anomaly of low-level geopotential height (SSTA-GH) near eastern China and the low SSTA-GHs over northwestern Pacific Ocean and southwestern China, respectively. The gray-shaded area are Tibetan Plateau.
In Figure 7, the synoptic-scale transient anomaly of low-level geopotential height (SSTA-GH; color-shaded) is overlaid with the 10-yr average low-level geopotential height (shortened to YA-GH hereafter; contours) for each case. A low–high–low pattern of SSTA-GH from southwestern China to the northwestern Pacific Ocean is basically shown near the period of sudden turning motion of MCSs for all cases. Regarding this pattern of SSTA-GH, southwestern China and the northwestern Pacific Ocean are significantly influenced by low SSTA-GH (denoted by “L2” and “L1” in Figure 7), while eastern China is mostly controlled by high SSTA-GH (denoted by “H” in Figure 7). The occurrence of low SSTA-GH over southwestern China and high SSTA-GH over eastern China is in good accordance with the intensification of the southwestern trough and the maintenance or development of the eastern high. This indicates that SSTA-GH is the key factor leading to the formation of the synoptic situation analyzed in Section 3.
Given this finding, a further question regarding the source of these low and high SSTA-GHs naturally arises. Investigation of the evolution of SSTA-GH reveals that the development of the high SSTA-GH “H” over eastern China is associated with the evolution of the low SSTA-GH “L1” over the northwestern Pacific Ocean. The development of the low SSTA-GH “L1” induces a strong cyclonic wind anomaly, which continuously brings cold air from higher latitudes (larger than 40° N) to eastern China (near 30° N), where the high SSTA-GH “H” ultimately forms (Figure 8 and Figure 9). A tongue-shaped high SSTA-GH extending from North/Northeast Asia to eastern China also demonstrates this conclusion from another point of view. Once the high SSTA-GH “H” forms near eastern China, it acts like a barrier preventing the eastward extension/movement of the low SSTA-GH from the Tibetan Plateau (“L2” in Figure 10). As a result, the low SSTA-GH “L2” extends southward/southeastward from the Tibetan Plateau to southwestern China (see the vectors in Figure 10), along with a significant development, which ultimately leads to the formation of the low SSTA-GH “L2” over southwestern China (in Figure 7). This indicates that the formation of the low SSTA-GH “L2” over southwestern China is assisted by the blocking effect of the high SSTA-GH “H” over eastern China.
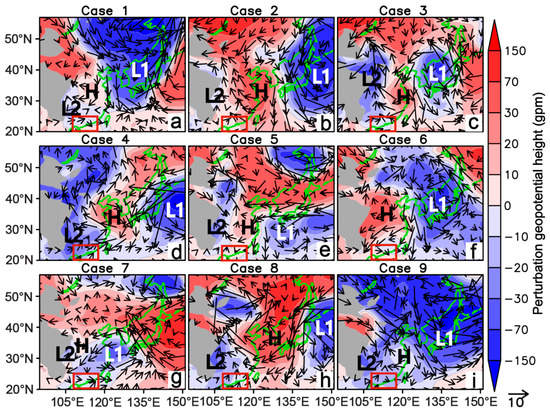
Figure 8.
Distributions of SSTA-GH (color-shaded; units: gpm) and synoptic-scale transient anomaly of wind vector (units: m s-1) at 850 hPa near the time when MCSs turned to move southeastward (a–i: cases 1–9; a: 1400 BT 11 April 2012; b: 0800 BT 6 April 2014; c: 2000 BT 8 May 2014; d: 1400 BT 22 May 2014; e: 1400 BT 30 April 2015; f: 1400 BT 4 May 2015; g: 2000 BT 3 April 2016; h: 0800 BT 15 April 2016; i: 0800 BT 19 April 2017). “H”, “L1” and “L2” indicate the high SSTA-GH near eastern China and the low SSTA-GHs over northwestern Pacific Ocean and Southwest China, respectively. The gray-shaded area is the Tibetan Plateau. The rectangles indicate the position of South China, where sudden turning motion of the MCSs occurred.
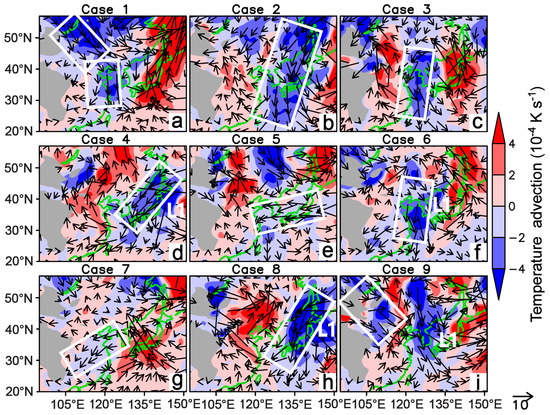
Figure 9.
Same as Figure 8, except for temperature advection (color-shaded; units: 10−4 K s−1) caused by the synoptic-scale transient anomaly of wind vector (units: m s−1) for cases 1-9 (a–i). The rectangles indicate the temperature advection areas associated with the formation of SSTA-GH ‘H’ shown in Figure 8.
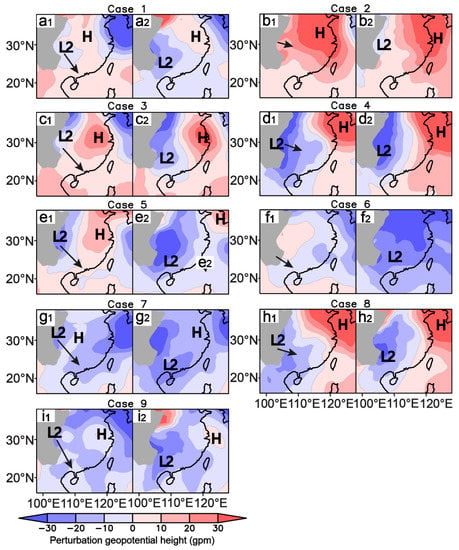
Figure 10.
Evolution of 850-hPa SSTA-GH (color-shaded; units: gpm) on the east side of Tibetan Plateau (gray-shaded) (a–i: cases 1–9; a1–a2: 0800–2000 BT 11 April 2012; b1–b2: 2000 BT 5–0800 BT 6 April 2014; c1–c2: 0800–2000 BT 8 May 2014; d1–d2: 2000 BT 22–0800 BT 23 May 2014; e1–e2: 1400 BT 30 April–0800 BT 1 May 2015; f1–f2: 0200–1400 BT 5 May 2015; g1–g2: 0200–1400 BT 4 April 2016; h1–h2: 0200–1400 BT 15 April 2016; i1–i2: 0200–1400 BT 19 April 2017). “H” and “L2” indicate the high SSTA-GH near eastern China and the low SSTA-GH over southwestern China, respectively. The arrows indicate the propagation directions of the low SSTA-GH “L2”.
The above findings indicate that the formation of the low and high SSTA-GHs over southwestern and eastern China constitute a chain reaction leading to the development of the low SSTA-GH “L1” over the northwestern Pacific Ocean. Therefore, the source and development of the low SSTA-GH “L1” are worthy of further discussion. The motion paths of the low SSTA-GH “L1” for all cases are exhibited in Figure 11, based on the track of their past locations using the ERA-Interim data at 6-h intervals. Apparently, there are two types of motion path for the low SSTA-GH “L1”. One of them shows the low SSTA-GH “L1” as deriving from the north side of the Tibetan Plateau, as in cases 1, 2, 4, 5, 7 and 9 (Figure 11a). The other type indicates initiation in the southeast corner of the Tibetan Plateau, and movement northeastward to the northeastern Pacific Ocean, as in cases 2, 6 and 8 (Figure 11b). The intersection point of these two types of motion path is located near eastern China. These motion paths are mainly present in good accordance with the flow lines of the 10-yr average of low-level circulation (contours in Figure 7), which are separated into northern and southern branches by the Tibetan Plateau and ultimately converge near eastern China. The motion paths along the southern branch of the low-level mean flow generally reach higher latitudes than those along the northern branch of the low-level mean flow (compare Figure 11a,b). This is because the low SSTA-GH from the southern branch of the low-level mean flow needs the assistance of the flows ahead of the strong trough over Northeast Asia to get to high latitudes (Figure 7b,f,h), where it can drag cold air of high latitudes southward to eastern China. With the effect of the southwesterly flows ahead of the trough, the low SSTA-GH could go further north. Whereas, it is relatively easy for the low SSTA-GH from the northern branch of the low-level mean flow to bring the cold air of high latitudes to eastern China, as it comes from the north. Consequently, the high SSTA-GH over eastern China has already formed when the low SSTA-GH from the north moves to behind (west of) the bottom of the trough over Northeast Asia (Figure 7a,c–e,g,i).
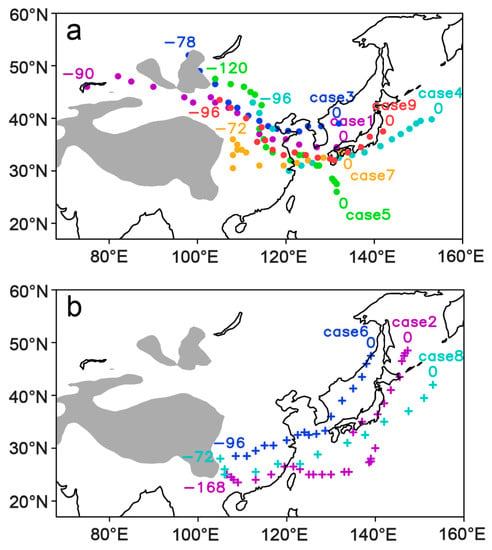
Figure 11.
Motion paths (a: southeastward; b: northeastward) of the low SSTA-GH “L1” (shown in Figure 7) for cases 1–9. The dots or pluses indicate the locations of the low SSTA-GH “L1” at 6-h intervals, and the numbers indicate the moments (units: hours) before MCSs turned to move southeastward. The gray-shaded area are Tibetan Plateau.
On the other hand, the development of the low SSTA-GH “L1” is another essential factor in the introduction of the cold air of high latitudes to eastern China. The evolution of the low SSTA-GH “L1” in the cases studied here show that the low SSTA-GH “L1” enhances distinctly after it enters into the northwestern Pacific Ocean (figure not shown). With regard to this finding, the evolution of upper-level low SSTA-GH is additionally investigated. The reason for the consideration of the upper-level low SSTA-GH is that it can basically clarify whether the low-level low SSTA-GH “L1” enhances by itself or because of other external factors. Figure 12 depicts the evolution of the low-level (850 hPa) and upper-level (300 hPa) low SSTA-GHs over East Asia. We can see that significant upper-level low SSTA-GH (rectangle in Figure 12) occurs near or over the low-level SSTA-GH “L1” (circle in Figure 12) when the low-level low SSTA-GH “L1” enters into the northwestern Pacific Ocean, except in case 5. This upper-level low SSTA-GH does not form because of the vertical development of the low-level low SSTA-GH “L1”. Instead, it travels from North or Northeast Asia, in general (compare Figure 12(a2–d2) to Figure 12(a1–d1), and Figure 12(f2–i2) to Figure 12(f1–i1)). This suggests that the significant development of the low-level low SSTA-GH is mostly attributable to a strong upper-level low SSTA-GH coupling with it or approaching it.
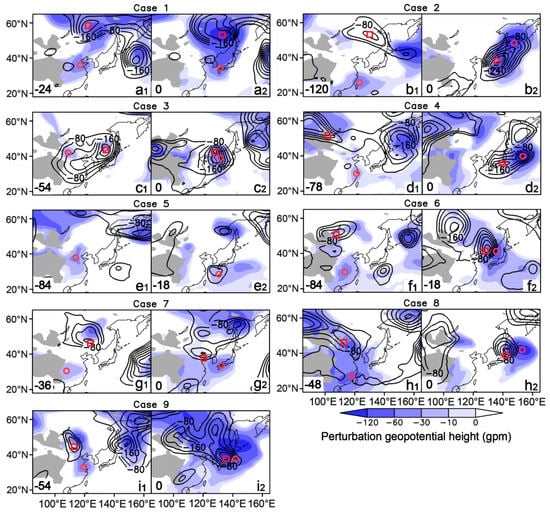
Figure 12.
Evolution of low SSTA-GH (units: gpm) at 850 (color-shaded) and 300 (contours) hPa for cases 1–9 (a–i). The numbers labeled in the bottom-left corner of each panel are the moments (units: hours) before MCSs turned to move southeastward. The circles indicate the locations of the low SSTA-GH “L1” at 850 hPa (shown in Figure 7), and the rectangles indicate the locations of the low SSTA-GH at 300 hPa associated with the intensification of “L1”.
5. Conclusions and Discussion
The formation mechanism of rainstorms caused by warm-sector MCSs is unclear, principally owing to insufficient understanding of their initiation, organization and motion. The initiation and organization of warm-sector MCSs has been investigated in numerous studies. In contrast, analysis of the motion of warm-sector MCSs is in its infancy. A previous case study [36] found a synoptic situation that led to a sudden southeastward turning motion of warm-sector MCSs, which completely changed the heavy rainfall distribution and produced a large area of strong rainfall over the coastal region of Guangdong province. This synoptic situation has not been mentioned before as a characteristic situation that can result in a sudden turning motion for the MCSs entering into Guangdong province from Guangxi province. In the present study, multiple types of observations and ERA-Interim data, are used to collect all cases during April–June (the pre-flood rainy season) 2011–2017 featuring a similar synoptic situation to verify whether it is a common synoptic situation causing sudden turning motion of warm-sector MCSs, by analyzing the characteristics of the evolution of this synoptic situation and its resultant vertical wind shear. Furthermore, the formation of the synoptic situation is discussed by investigating the evolution of the synoptic-scale transient anomaly. The major findings can be summarized as follows.
A synoptic situation, featured with a strong low-level trough over southwestern China (southwestern trough) with increasing strength and a marked low-level high/anticyclone forming and maintaining over eastern China (eastern high), can cause a suddenly southeastward turning motion of warm-sector MCSs (Figure 13(b2,c2)). The blocking of the eastern high on the intensifying southwestern trough results in a significant enhancement and counterclockwise rotation (from southwesterly to southerly) of the winds ahead of the southwestern trough (Figure 13(b1,b2)). This reinforcement of southerly winds at low levels produces a distinct southeastward motion vector which leads to the sudden turning motion of warm-sector MCSs. The reinforced southerly winds also favor the development of MCSs during their turning motion by enhancing the water vapor transportation. Furthermore, the sudden turning motion of MCSs generally occurs when they enter into Guangdong province from Guangxi province (Figure 13(c1,c2)), as the boundary area between these two provinces is basically located ahead of the southwestern trough.
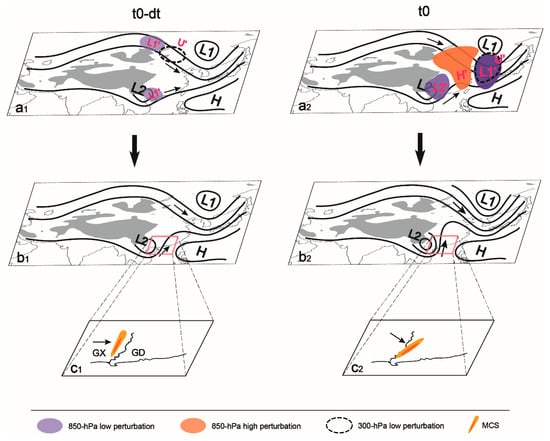
Figure 13.
Schematic illustration of how (a1–a2) the evolution of SSTA (color-shaded) and climatic average (contours) of geopotential height impact (b1–b2) that of the complete geopotential height field (contours) at low levels, which promoted warm-sector MCSs to move suddenly from (c1) eastward/northeastward to (c2) southeastward when they entered Guangdong (GD) province from Guangxi (GX) province. “L” and “H” indicate the low and high value centers of geopotential height, respectively, while “L1’/L2’/U’” and “H’” indicate the low and high SSTA-GHs, respectively. The arrows indicate the (a1–a2 and b1–b2) flows or (c1–c2) MCS motion directions.
The southwestern trough (denoted by “L2” in Figure 13(a1,a2,b1,b2)) is a common synoptic ingredient during the pre-flood rainy season, whereas the formation of the eastern high requires appropriate environmental conditions. Analysis of the evolution of the synoptic-scale transient anomaly indicates that the intensification of the southwestern trough and the formation or maintenance of the eastern high constitute a chain reaction that leads to a significantly low synoptic-scale transient anomaly of geopotential height (SSTA-GH) over the northwestern Pacific Ocean next to eastern China (denoted by the shaded area L1’ in Figure 13a2). The low SSTA-GH over the northwestern Pacific Ocean mainly comes from the northern and southern branches of the low-level mean flows that are separated by Tibetan Plateau and converge over eastern China (see the evolution of the shaded area L1’ in Figure 13(a1,a2)). A significant development occurs when it arrives in the northwestern Pacific Ocean, because of a strong upper-level low SSTA-GH (denoted by the dashed ellipse area U’ in Figure 13(a1,a2)) from North or Northeast Asia coupling with it or moving close to it. Consequently, notable cyclonic wind anomalies caused by this low SSTA-GH continuously bring cold air from high latitudes to eastern China (denoted by the shaded area H’ in Figure 13a2), leading to the formation of the eastern high. The high SSTA-GH over eastern China then blocks the eastward extension of the low SSTA-GH originating from the Tibetan Plateau (denoted by the shaded area L2’ in Figure 13a2), which turns to move southeastward/southward and reinforces the southwestern trough.
These findings indicate that the low-level mean flows affected by the Tibetan Plateau over East Asia determine the motion path of the low-level synoptic-scale transient anomaly, which provides a precondition for the chain reaction leading to the formation of the eastern high and the intensification of the southwestern trough. The southwestern trough also forms as a result of the low-level southern mean flows moving around the southeast corner of the Tibetan Plateau. This demonstrates that the Tibetan Plateau plays an important role in the formation of the synoptic situation that causes a sudden turning motion of warm-sector MCSs over South China. Additionally, an early signal of the formation of this type of synoptic situation cannot be seen clearly from the full field of circulation. In contrast, the synoptic-scale transient anomaly of circulation shows a more conspicuous signal. In this respect, the construction of a set of synoptic-scale perturbation prognostic equations may be useful for forecasting the evolution of this synoptic situation, an approach that has already been proven feasible by Du and Qian [48].
Author Contributions
Conceptualization, Z.L.; methodology, Z.L.; formal analysis, Z.L.; investigation, Z.L.; resources, Z.L. and Y.L.; data curation, Z.L. and J.Y.; writing—original draft preparation, Z.L.; writing—review and editing, Z.L., Y.L. and J.Y.; visualization, Z.L.; supervision, Z.L.; project administration, Z.L.; funding acquisition, Z.L. and Y.L.
Funding
This research was supported by the National Natural Science Foundation of China, the China Meteorological Administration Special Public Welfare Research Funds, Key Laboratory of South China Sea Meteorological Disaster Prevention and Mitigation of Hainan Province and Fundamental Research Funds for Chinese Academy of Meteorological Sciences under grants 41705026, GYHY201406003, U1433202, 91437215, SCSF201801, 41575047, GYHY201506002 and 2017Y010 respectively.
Acknowledgments
The authors thank Hongyan Wang from the Chinese Academy of Meteorological Sciences (CAMS) for her support on the processing of the radar data.
Conflicts of Interest
The authors declare that there are no conflicts of interest regarding the publication of this research.
References
- Tao, S.Y.; et al. Rainstorms in China; Science Press: Beijing, China, 1980. (In Chinese) [Google Scholar]
- Huang, S.S.; et al. Rain Storm in South China in Early Summer; Guangdong Science and Technology Press: Guangzhou, China, 1986. (In Chinese) [Google Scholar]
- Zhou, X.J.; Xue, J.S.; Tao, Z.Y.; et al. Scientific Test Study of Rainstorm in Huanan in 1998; China Meteorological Press: Beijing, China, 2003. [Google Scholar]
- Ni, Y.Q.; Zhang, R.H.; Liu, L.P.; et al. Rainstorms in South China Field Science Experiment (SCHeREX); China Meteorological Press: Beijing, China, 2013. (In Chinese) [Google Scholar]
- He, L.F.; Chen, T.; Kong, Q. A review of studies on prefrontal torrential rain in South China. J. Appl. Meteorol. Sci. 2016, 27, 559–569. (In Chinese) [Google Scholar]
- Lin, L.X.; et al. Guangdong Province Weather Forecasting Technology Manual; China Meteorological Press: Beijing, China, 2006. (In Chinese) [Google Scholar]
- Wang, Y.M.; Xue, J.S. Diagnostic analysis of low level jet over South China during earlier rainy season. J. Trop. Meteorol. 1985, 1, 121–128. (In Chinese) [Google Scholar]
- Chen, G.T.J.; Wang, C.C.; Lin, D.T.W. Characteristics of low-level jets over Northern Taiwan in Mei-yu season and their relationship to heavy rain. Mon. Weather Rev. 2005, 133, 20–43. [Google Scholar] [CrossRef]
- Liu, H.B.; He, M.Y.; Wang, B.; Zhang, Q. Advances in low-level jet research and future prospects. J. Meteorol. Res. 2014, 28, 57–75. [Google Scholar] [CrossRef]
- Tao, Z.Y. The structure and formation of the moist jet stream. Acta Meteorol. Sin. 1980, 38, 331–340. (In Chinese) [Google Scholar]
- Higgins, R.W.; Yao, Y.; Yarosh, E.S.; Janowiak, J.E.; Mo, K.C. Influence of the Great Plains low-level jet on summertime precipitation and moisture transport over the central United States. J. Clim. 1997, 10, 481–507. [Google Scholar] [CrossRef]
- Weaver, S.J.; Nigam, S. Variability of the Great Plains low-level jet: Large-scale circulation context and hydroclimate impacts. J. Clim. 2008, 21, 1532–1551. [Google Scholar] [CrossRef]
- Raymond, D.J. Instability of the low-level jet and severe storm formation. J. Atmos. Sci. 1978, 35, 2274–2280. [Google Scholar]
- Stensrud, D.J. Importance of low-level jets to climate: A review. J. Clim. 1996, 9, 1698–1709. [Google Scholar] [CrossRef]
- Walters, C.K.; Winkler, J.A. Air flow configurations of warm season southerly low-level wind maxima in the Great Plains. Part I: Spatial and temporal characteristics and relationship to convection. Weather Forecast. 2001, 16, 513–530. [Google Scholar] [CrossRef]
- Walters, C.K.; Winkler, J.A. Airflow configurations of warm season southerly low-level wind maxima in the Great Plains. Part II: The synoptic and subsynoptic-scale environment. Weather Forecast. 2001, 16, 531–551. [Google Scholar] [CrossRef]
- Chen, X.C.; Zhao, K.; Xue, M. Spatial and temporal characteristics of warm season convection over Pearl River Delta region, China, based on 3 years of operational radar data. J. Geophys. Res. Atmos. 2014, 119, 447–465. [Google Scholar] [CrossRef]
- Liu, Y.C.; Zhuang, X.D.; Li, X.Z. Severe local storms initiated by the sea breeze front in the Pearl River Delta during the late spring and summer. Q. J. Appl. Meteorol. 2001, 12, 433–441. (In Chinese) [Google Scholar]
- Mu, J.L.; Wang, J.J.; Li, Z.C. A study of environment and mesoscale convective systems of continuous heavy rainfall in the South of China in June 2005. Acta Meteorol. Sin. 2008, 66, 437–451. (In Chinese) [Google Scholar]
- Wu, M.W.; Luo, Y.L. Mesoscale observational analysis of lifting mechanism of a warm-sector convective system producing the maximal daily precipitation in China mainland during pre-summer rainy season of 2015. J. Meteorol. Res. 2016, 30, 719–736. [Google Scholar] [CrossRef]
- Doswell, C.A., III; Brooks, H.E.; Maddox, R.A. Flash flood forecasting: An ingredients-based methodology. Weather Forecast. 1996, 11, 560–581. [Google Scholar] [CrossRef]
- Davis, R.S. Flash flood forecast and detection methods. In Severe Convective Storms; American Meteorological Society: Boston, MA, USA, 2001; pp. 481–525. [Google Scholar]
- Schumacher, R.S.; Johnson, R.H. Organization and environmental properties of extreme-rain-producing mesoscale convective systems. Mon. Weather Rev. 2005, 133, 961–976. [Google Scholar] [CrossRef]
- Akiyama, T. A medium-scale cloud cluster in a Baiu front. Part I: Evolution process and a fine structure. J. Meteorol. Soc. Jpn. 1984, 62, 485–504. [Google Scholar] [CrossRef]
- Chen, G.T.J. Mesoscale features observed in the Taiwan Meiyu season. J. Meteorol. Soc. Jpn. 1992, 70, 497–515. [Google Scholar] [CrossRef]
- Liang, Q.Q.; Xiang, S.X.; Lin, L.G.; Meng, W.G. MCS characteristics over South China during the annually first rainy season and their organization types. J. Trop. Meteorol. 2012, 28, 541–551. (In Chinese) [Google Scholar]
- Luo, Y.L.; Gong, Y.; Zhang, D.L. Initiation and organizational modes of an extreme-rain-producing mesoscale convective system along a Mei-Yu front in east China. Mon. Weather Rev. 2014, 142, 203–221. [Google Scholar] [CrossRef]
- Wang, H.; Luo, Y.L.; Jou, B.J.D. Initiation, maintenance, and properties of convection in an extreme rainfall event during SCMREX: Observational analysis. J. Geophys. Res. Atmos. 2014, 119, 206–232. [Google Scholar] [CrossRef]
- Bluestein, H.B.; Jain, M.H. Formation of mesoscale lines of precipitation: Severe squall lines in Oklahoma during the spring. J. Atmos. Sci. 1985, 42, 1711–1732. [Google Scholar] [CrossRef]
- Parker, M.D.; Johnson, R.H. Organizational modes of midlatitude mesoscale convective systems. Mon. Weather Rev. 2000, 128, 3413–3436. [Google Scholar] [CrossRef]
- Merritt, J.H.; Fritsch, J.M. On the movement of the heavy precipitation areas of mid-latitude mesoscale convective complexes. In Proceedings of the 10th Conference on Weather Forecasting and Analysis, Clearwater Beach, FL, USA, 25–29 June 1984; pp. 529–536. [Google Scholar]
- Juying, X.; Scofield, R.A. Satellite-Dervied Rainfall Estimates and Propagation Characteristics Associated with Mesoscale Convective Systems (MCS); NOAA Technical Memorandum NESDIS 25; NOAA: Silver Spring, MD, USA, 1989; 49p.
- Moore, J.T.; Pappas, C.H.; Glass, F.H. Propagation characteristics of mesoscale convective systems. In Proceedings of the 17th Conference on Severe Local Storms, St. Louis, MO, USA, 4–8 October 1993; pp. 538–542. [Google Scholar]
- Corfidi, S.F.; Meritt, J.; Fritsch, J. Predicting the movement of mesoscale convective complexes. Weather Forecast. 1996, 11, 41–46. [Google Scholar] [CrossRef]
- Corfidi, S.F. Cold pools and MCS propagation: Forecasting the motion of downwind-developing MCSs. Weather Forecast. 2003, 18, 997–1017. [Google Scholar] [CrossRef]
- Liang, Z.M.; Liu, Y.; Yin, J.F.; Liu, C.J. A case study of the effects of a synoptic situation on the motion and development of warm-sector mesoscale convective systems over South China. Asia-Pac. J. Atmos. Sci. 2019. [Google Scholar] [CrossRef]
- Berrisford, P.; Dee, D.P.; Poli, P.; Brugge, R.; Fielding, K.; Fuentes, M.; Kallberg, P.; Kobayashi, S.; Uppala, S.; Simmons, A. The ERA-Interim Archive; ERA Report Series 1; ECMWF: Reading, UK, 2011. [Google Scholar]
- Dee, D.P.; Uppala, S.M.; Simmons, A.J.; Berrisford, P.; Poli, P.; Kobayashi, S.; Andrae, U.; Balmaseda, M.A.; Balsamo, G.; Bauer, P.; et al. The ERA-Interim reanalysis: Configuration and performance of the data assimilation system. Q. J. R. Meteorol. Soc. 2011, 137, 553–597. [Google Scholar] [CrossRef]
- Brooks, H.B. A summary of some radar thunderstorm observations. Bull. Am. Meteorol. Soc. 1946, 27, 557–563. [Google Scholar] [CrossRef][Green Version]
- Byers, H.R.; Battan, L.J. Some effects of vertical wind shear on thunderstorm structure. Bull. Am. Meteorol. Soc. 1949, 30, 168–175. [Google Scholar] [CrossRef]
- Qian, W.H. Physical decomposition principle of regional-scale atmospheric transient anomaly. Chin. J. Geophys. 2012, 55, 1439–1448. (In Chinese) [Google Scholar]
- Zhang, Z.J.; Qian, W.H. Precursors of regional prolonged low temperature events in China during winter half year. Chin. J. Atmos. Sci. 2012, 36, 1269–1279. (In Chinese) [Google Scholar]
- Qian, W.H.; Zhang, M.; Shan, X.L. The physical decomposition principles on atmospheric variables and their application in the analysis of regional rainstorms. Meteorol. Mon. 2013, 39, 537–542. (In Chinese) [Google Scholar]
- Jiang, M.; Yu, T.T.; Qian, W.H. Analysis on atmospheric anomalous signals of winter low temperature and snow ice storms in southern China. Chin. J. Atmos. Sci. 2014, 38, 813–824. (In Chinese) [Google Scholar]
- Qian, W.H.; Zhang, G.W.; Huang, J. Intensity evolution of typhoon Megi (2010) revealed from anomaly-based atmospheric variables. Meteorol. Mon. 2015, 41, 806–815. (In Chinese) [Google Scholar]
- Qian, W.H.; Liang, Z.X.; Luo, W.M.; Du, J. Examining performances of numerical models in predicting tornado environmental systems. Adv. Meteorol. Sci. Technol. 2018, 8, 36–43. (In Chinese) [Google Scholar]
- Loehrer, S.M.; Johnson, R.H. Surface pressure and precipitation life cycle characteristics of PRE-STORM mesoscale convective systems. Mon. Weather Rev. 1995, 123, 600–621. [Google Scholar] [CrossRef]
- Du, J.; Qian, W.H. Three revolutions in weather forecasting. Adv. Meteorol. Sci. Technol. 2014, 4, 13–26. (In Chinese) [Google Scholar]
© 2019 by the authors. Licensee MDPI, Basel, Switzerland. This article is an open access article distributed under the terms and conditions of the Creative Commons Attribution (CC BY) license (http://creativecommons.org/licenses/by/4.0/).