Climatology and Trend of Severe Drought Events in the State of Sao Paulo, Brazil, during the 20th Century


Abstract
1. Introduction
2. Data and Methodology
3. Results
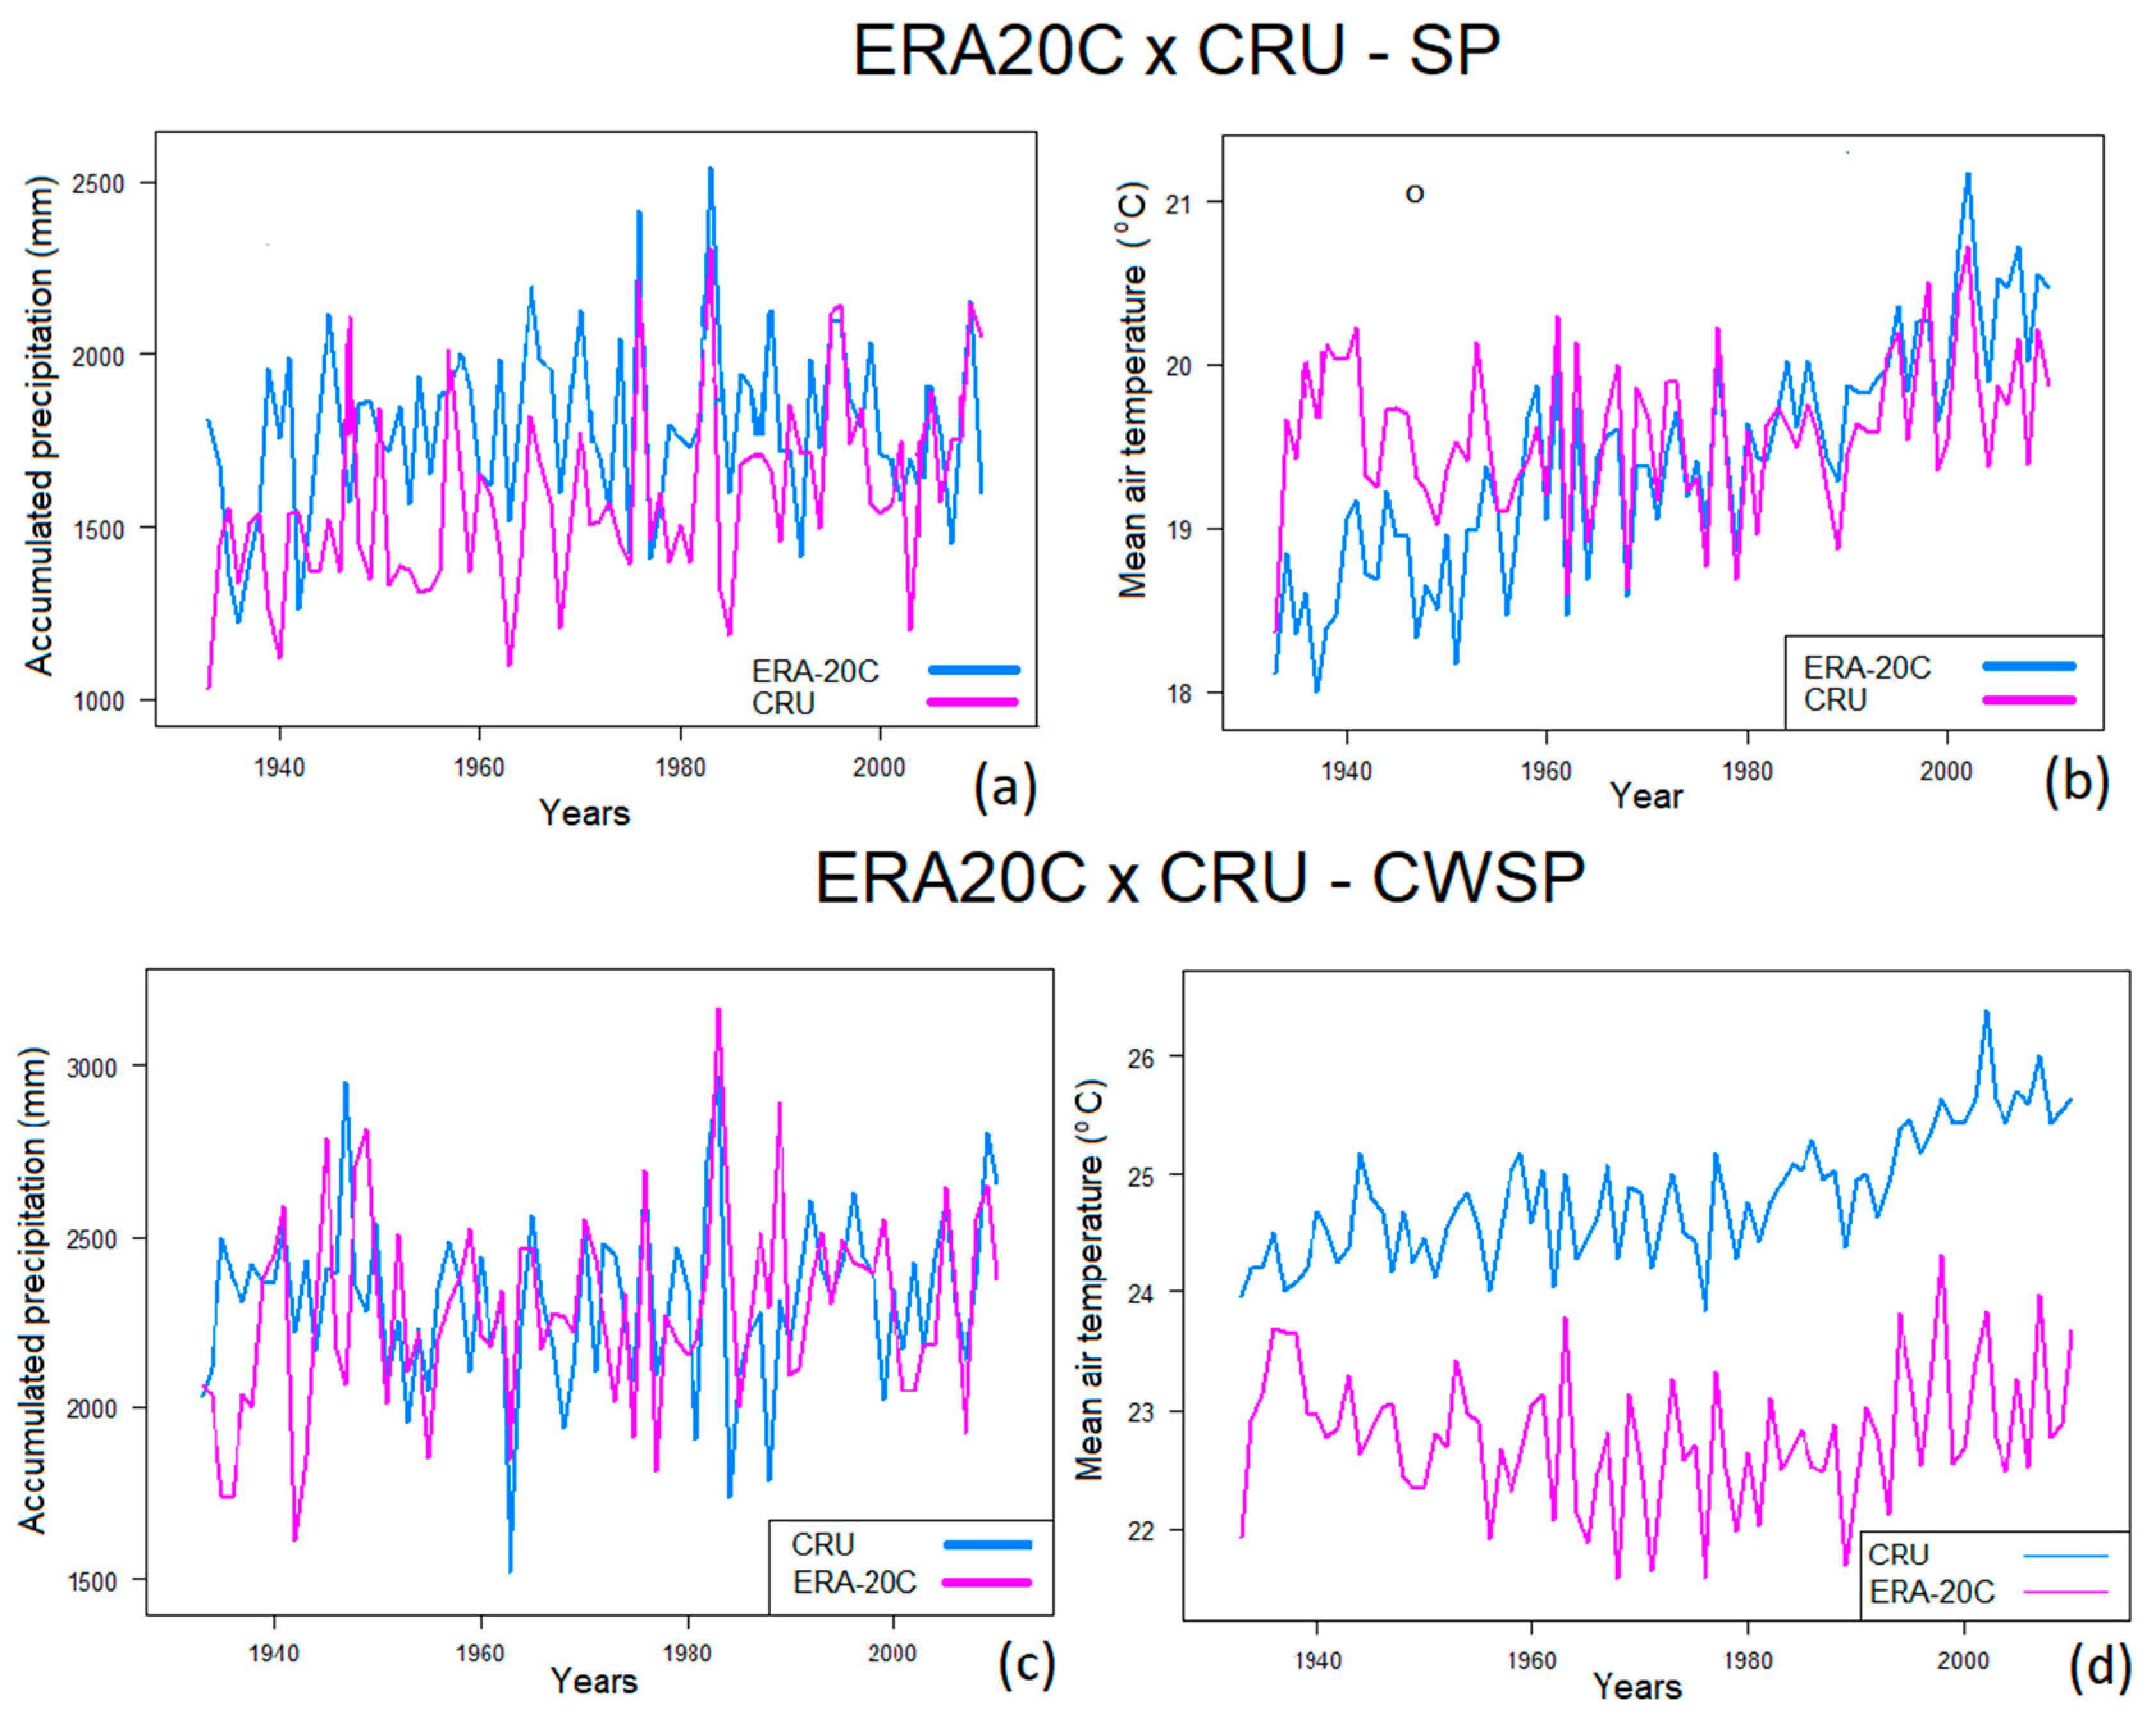
3.1. São Paulo City
3.2. Eastern São Paulo state (ESP)
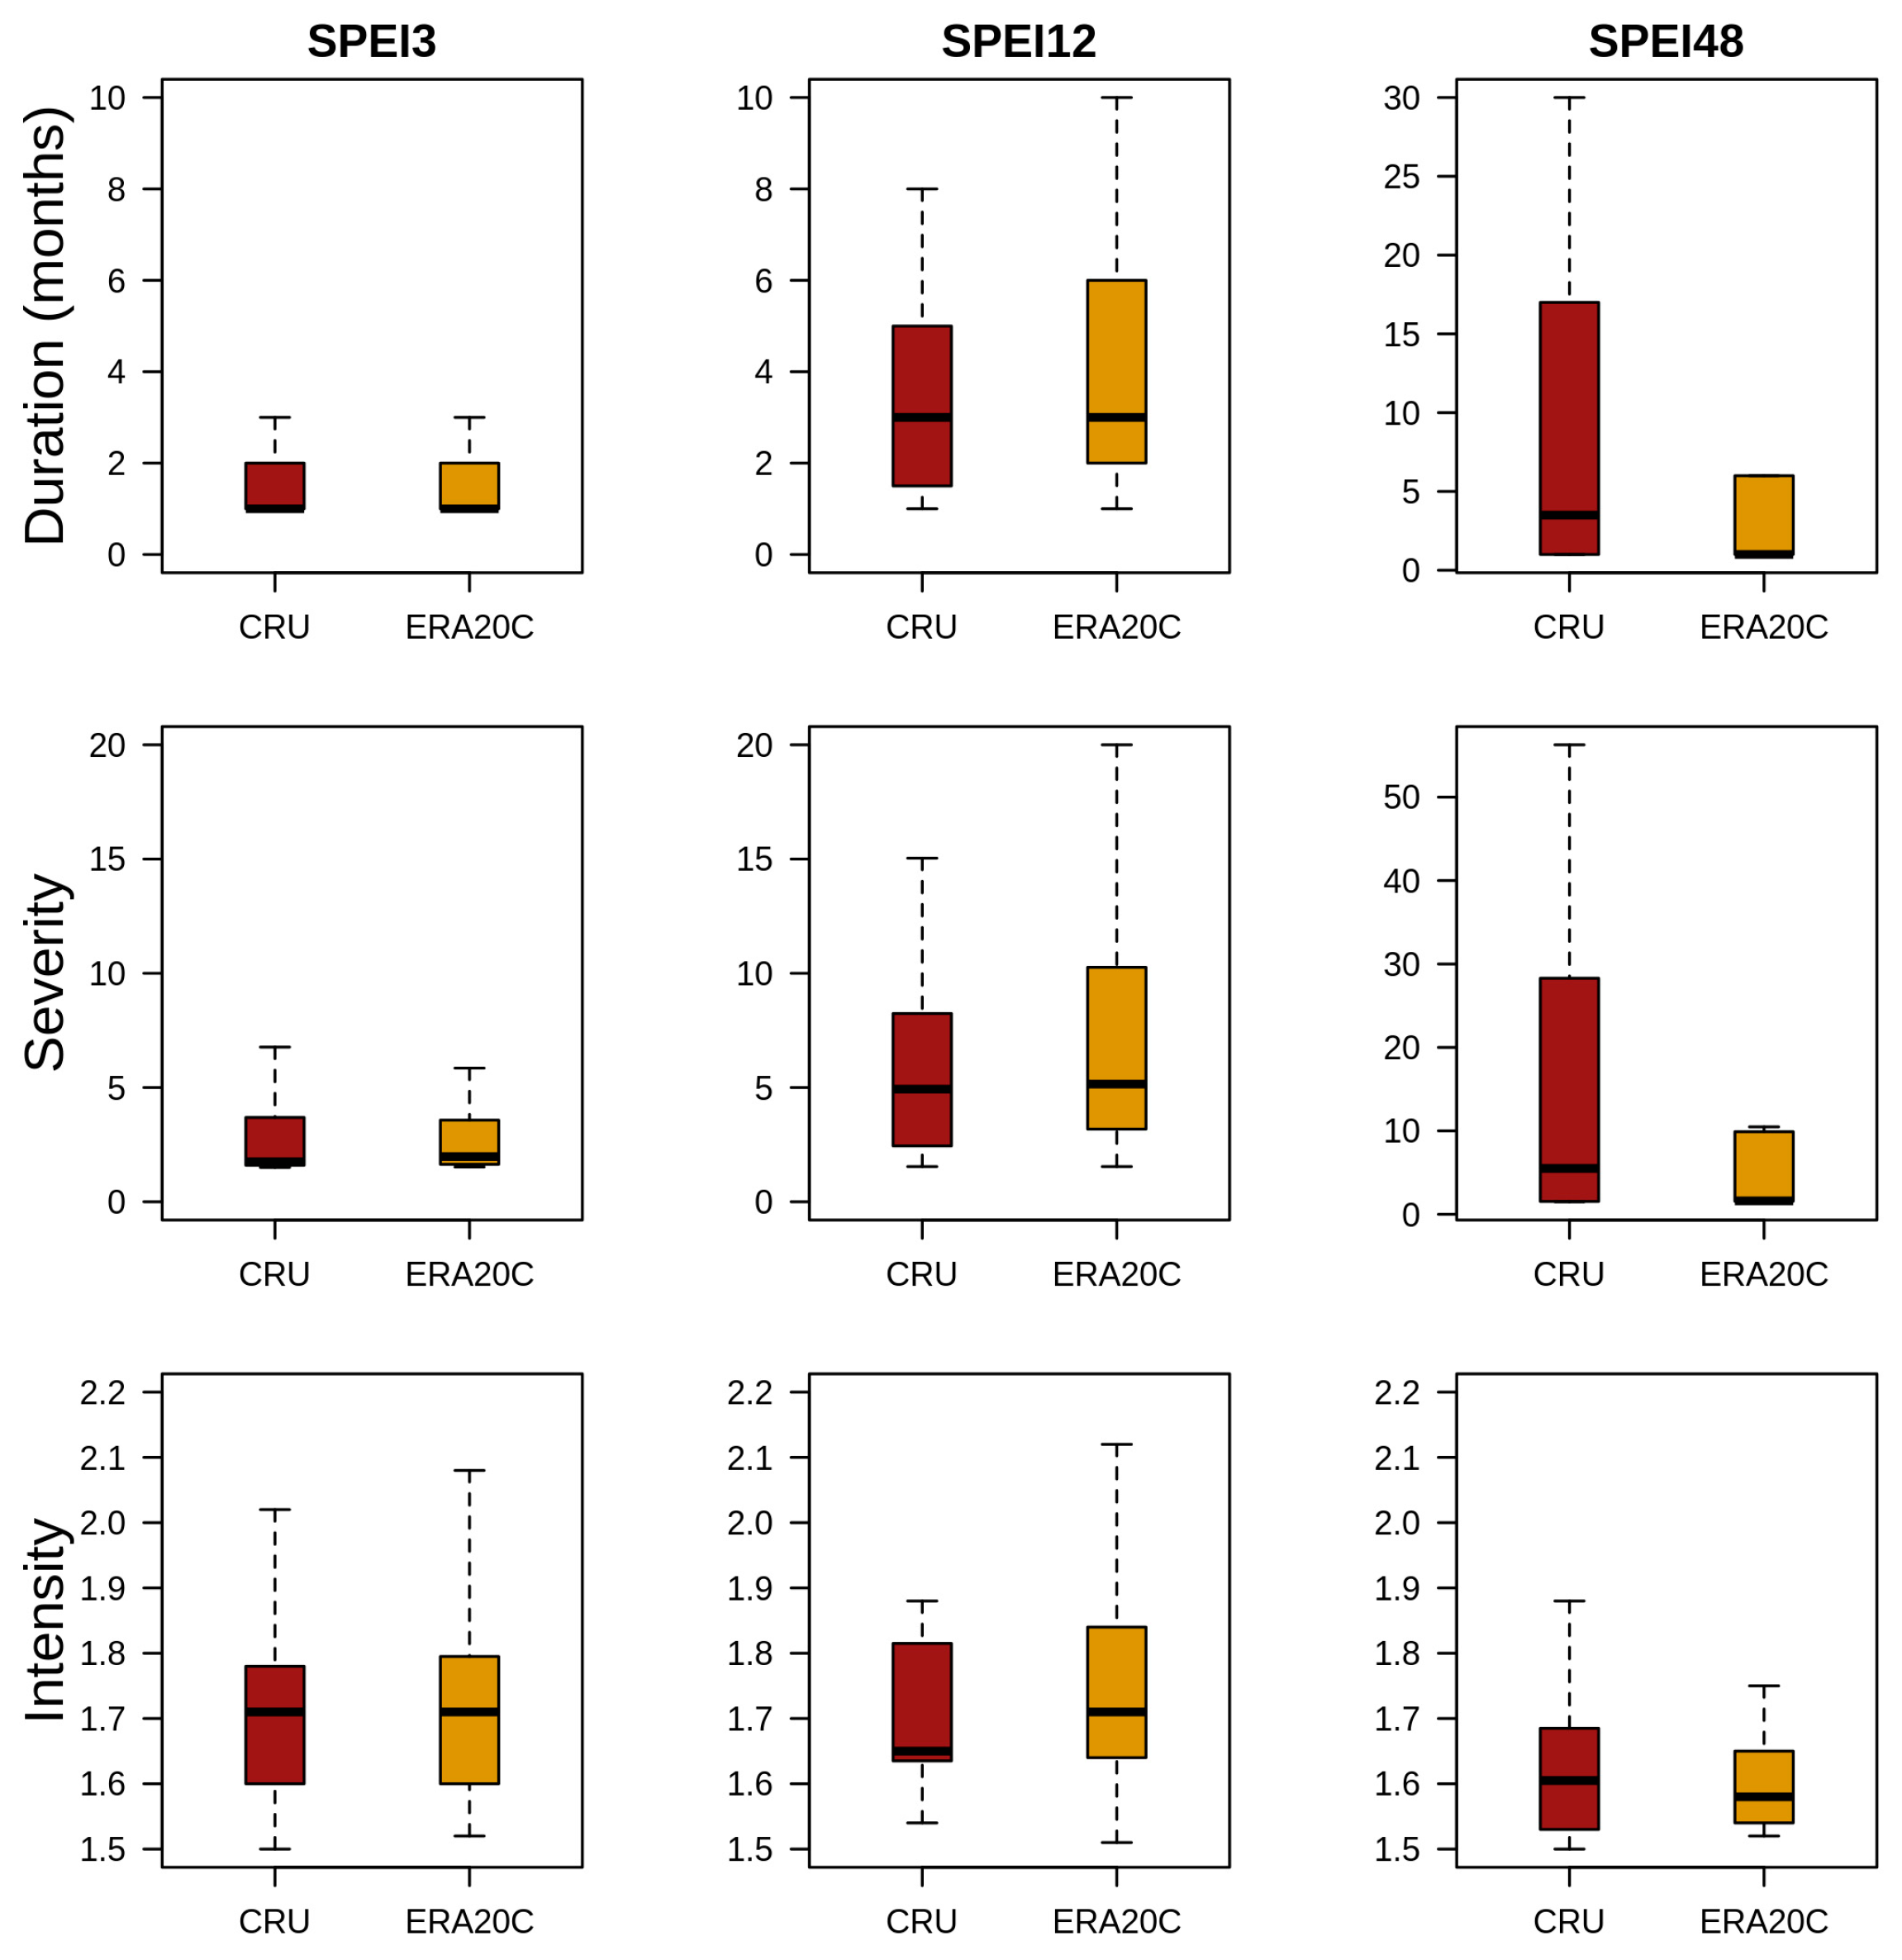
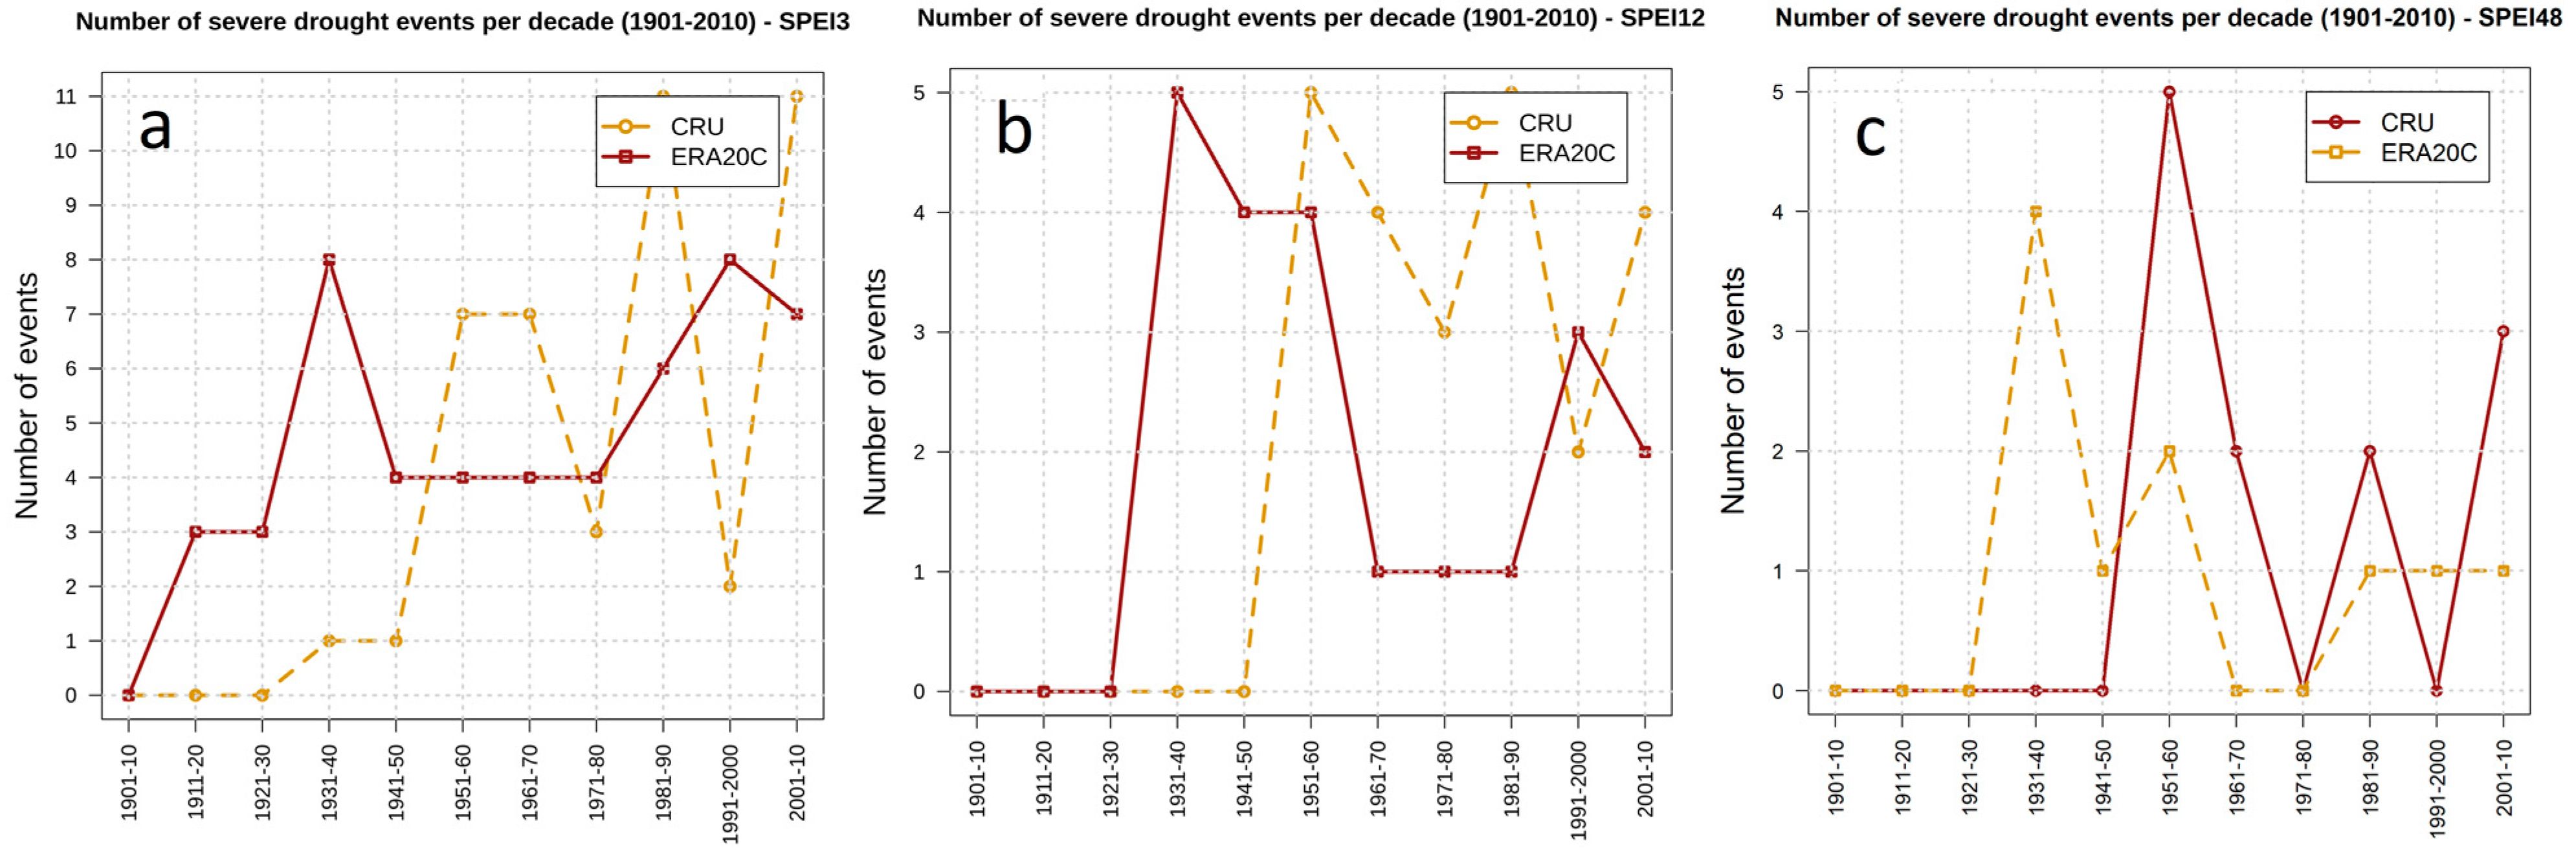
3.3. Central western São Paulo State (CWSP)
3.4. Comments
4. Conclusions
Author Contributions
Funding
Acknowledgments
Conflicts of Interest
References
- Kogan, F.N. Global drought watch from space. Bull. Am. Meteorol. Soc. 1997, 78, 621–636. [Google Scholar] [CrossRef]
- Boken, V.K.; Cracknell, A.P.; Heathcote, R.L. Monitoring and Predicting Agricultural Drought: A Global Study; Oxford University Press: Oxford, UK, 2005. [Google Scholar]
- Grayson, M. Agriculture and drought. Nature 2013, 501, S1. [Google Scholar] [CrossRef] [PubMed]
- Simoes, S.J.; Barros, A.P. Regional hydroclimatic variability and Brazil’s 2001 energy crisis. Manag. Environ. Qual. Int. J. 2007, 18, 263–273. [Google Scholar] [CrossRef]
- Wilhite, D.A.; Glantz, M.H. Understanding the Drought Phenomenon: The Role of Definitions. Water Int. 1985, 10, 111–120. [Google Scholar] [CrossRef]
- Easterling, D.R.; Wallis, T.W.; Lawrimore, J.H.; Heim, R.R., Jr. Effects of temperature and precipitation trends on US drought. Geophys. Res. Lett. 2007, 34, L20709. [Google Scholar] [CrossRef]
- McKee, T.B.; Doesken, N.J.; Kleist, J. The relationship of drought frequency and duration to time scales. In Proceedings of the Eighth Conference on Applied Climatology, Anaheim, CA, USA, 17–22 January 1993; pp. 179–184. [Google Scholar]
- Vicente-Serrano, S.M.; Begueria, S.; Lopez-Moreno, A.J. A multiscalar drought index sensitive to global warming: The standardized precipitation evapotranspiration index. J. Clim. 2010, 23, 1696–1718. [Google Scholar] [CrossRef]
- Joetzjer, E.; Douville, H.; Delire, C.; Ciais, P.; Decharme, B.; Tyteca, S. Evaluation of drought indices at interannual to climate change timescales: A case study over the Amazon and Mississippi river basins. Hydrol. Earth Syst. Sci. Discuss. 2013, 17, 4885–4895. [Google Scholar] [CrossRef]
- Terassi, B.; Oliveira-Júnior, J.F.D.; Góis, G.D.; Galvani, E. Standardized Precipitation Index Variability in the Northern Region of Paraná State Associated with the El Niño-Southern Oscillation. Rev. Bras. Meteorol. 2018, 33, 11–25. [Google Scholar]
- Nascimento, F.D.; Braga, C.C.; Araújo, F.R. Statistical Analysis of Dry and Rainy Event of Maranhão Rainfall. Rev. Bras. Meteorol. 2017, 32, 375–386. [Google Scholar] [CrossRef]
- Brito, S.S.B.; Cunha, A.P.M.A.; Cunningham, C.C.; Alvalá, R.C.; Marengo, J.A.; Carvalho, M.A. Frequency, duration and severity of drought in the Semiarid Northeast Brazil region. Int. J. Climatol. 2018, 38, 517–529. [Google Scholar] [CrossRef]
- Sobral, B.S.; Oliveira-Júnior, J.F.; de Gois, G.; Pereira-Júnior, E.R. Spatial variability of SPI and RDIst drought indices applied to intense episodes of drought occurred in Rio de Janeiro State, Brazil. Int. J. Climatol. 2018, 38, 3896–3916. [Google Scholar] [CrossRef]
- Blain, G.C.; Brunini, O. Quantificação da seca agrícola pelo índice padronizado de evapotranspiração real (IPER) no estado de São Paulo. Bragantia 2006, 65, 517–525. [Google Scholar] [CrossRef]
- Alley, W.M. The Palmer drought severity index: Limitations and assumptions. J. Clim. Appl. Meteorol. 1984, 23, 1100–1366. [Google Scholar] [CrossRef]
- Blain, G.C. Monthly values of the standardized precipitation index in the State of São Paulo, Brazil: Trends and spectral features under the normality assumption. Bragantia 2012, 71, 122–131. [Google Scholar] [CrossRef]
- Pereira, V.R.; Blain, G.C.; Avila, A.M.; Pires, R.C.; Pinto, H.S. Impacts of climate change on drought: Changes to drier conditions at the beginning of the crop growing season in southern Brazil. Bragantia 2018, 77, 201–211. [Google Scholar] [CrossRef]
- Centro de Estudos Avançados em Economia Aplicada. GDP Agribusiness—Brazil Outlook; ESALQ, USP: Piracicaba, Brazil, 2013. [Google Scholar]
- Nobre, C.A.; Marengo, J.A.; Seluchi, M.E.; Cuartas, L.A.; Alves, L.M. Some characteristics and impacts of the drought and water crisis in Southeastern Brazil during 2014 and 2015. J. Water Res. Prot. 2016, 8, 252. [Google Scholar] [CrossRef]
- Spinoni, J.; Naumann, G.; Carrao, H.; Barbosa, P.; Vogt, J. World drought frequency, duration, and severity for 1951–2010. Int. J. Climatol. 2014, 34, 2792–2804. [Google Scholar] [CrossRef]
- Coelho, C.A.; Cardoso, D.H.; Firpo, M.A. Precipitation diagnostics of an exceptionally dry event in São Paulo, Brazil. Theor. Appl. Clim. 2016, 125, 769–784. [Google Scholar] [CrossRef]
- Pampuch, L.A.; Drumond, A.; Gimeno, L.; Ambrizzi, T. Anomalous patterns of SST and moisture sources in the South Atlantic Ocean associated with dry events in southeastern Brazil. Int. J. Climatol. 2016, 36, 4913–4928. [Google Scholar] [CrossRef]
- Hayhoe, K.; Wake, C.P.; Huntington, T.G.; Luo, L.; Schwartz, M.D.; Sheffield, J.; Wood, E.; Anderson, B.; Bradbury, J.; DeGaetano, A.; et al. Past and future changes in climate and hydrological indicators in the US northeast. Clim. Dyn. 2007, 28, 381–407. [Google Scholar] [CrossRef]
- Svoboda, M.; Hayes, M.; Wood, D. Standardized Precipitation Index User Guide (WMO-No 1090); World Meteorological Organization: Geneva, Switzerland, 2012. [Google Scholar]
- Spinoni, J.; Naumann, G.; Vogt, J.; Barbosa, P. Meteorological Droughts in Europe: Events and Impacts: Past Trends and Future Projections. 2016. Available online: http://www.droughtmanagement.info/literature/EC-JRC_Report%20on%20Droughts%20in%20Europe_2016.pdf (accessed on 25 January 2019).
- Vicente-Serrano, S.M.; Beguería, S.; Camarero, J.J. Drought Severity in a Changing Climate. In Handbook of Drought and Water Scarcity: Principles of Drought and Water Scarcity; Eslamian, S., Eslamian, F., Eds.; CRC Press: Boca Raton, FL, USA, 2017. [Google Scholar]
- Wang, Q.; Wu, J.; Lei, T.; He, B.; Wu, Z.; Liu, M.; Liu, D. Temporal-spatial characteristics of severe drought events and their impact on agriculture on a global scale. Quat. Int. 2014, 349, 10–21. [Google Scholar] [CrossRef]
- Yu, M.; Li, Q.; Hayes, M.J.; Svoboda, M.D.; Heim, R.R. Are droughts becoming more frequent or severe in China based on the standardized precipitation evapotranspiration index: 1951–2010? Int. J. Climatol. 2014, 34, 545–558. [Google Scholar] [CrossRef]
- Stagge, J.H.; Kohn, I.; Tallaksen, L.M.; Stahl, K. Modeling drought impact occurrence based on meteorological drought indices in Europe. J. Hydrol. 2015, 530, 37–50. [Google Scholar] [CrossRef]
- Um, M.J.; Kim, Y.; Park, D.; Kim, J. Effects of different reference periods on drought index (SPEI) estimations from 1901 to 2014. Hydrol. Earth Syst. Sci. 2017, 21, 4989–5007. [Google Scholar] [CrossRef]
- Camargo, A.D.; Sentelhas, P.C. Avaliação do desempenho de diferentes métodos de estimativa da evapotranspiração potencial no Estado de São Paulo, Brasil. Rev. Bras. Agrometeorol. 1997, 5, 89–97. [Google Scholar]
- Harris, I.C.; Jones, P.D. University of East Anglia Climatic Research Unit, CRU TS4. 01: Climatic Research Unit (CRU) Time-Series (TS) Version 4.01 of High-Resolution Gridded Data of Month-by-Month Variation in Climate (Jan. 1901–Dec. 2016); Centre for Environmental Data Analysis: Oxfordshire, UK, 2017; Volume 4. [Google Scholar]
- Poli, P.; Hersbach, H.; Dee, D.P.; Berrisford, P.; Simmons, A.J.; Vitart, F.; Trémolet, Y. ERA-20C: An atmospheric reanalysis of the twentieth century. J. Clim. 2016, 29, 4083–4097. [Google Scholar] [CrossRef]
- Sun, Q.; Miao, C.; Duan, Q.; Ashouri, H.; Sorooshian, S.; Hsu, K.L. A review of global precipitation data sets: Data sources, estimation, and intercomparisons. Rev. Geophys. 2018, 56, 79–107. [Google Scholar] [CrossRef]
- Donat, M.G.; Alexander, L.V.; Herold, N.; Dittus, A.J. Temperature and precipitation extremes in century-long gridded observations, reanalyses, and atmospheric model simulations. J. Geophys. Res. Atmos. 2016, 121, 11174–11189. [Google Scholar] [CrossRef]
- Keller Filho, T.; Assad, E.D.; Lima, P.R. Rainfall homogeneous areas in Brazil. Pesqui. Agropecu. Bras. 2005, 40, 311–322. [Google Scholar] [CrossRef]
- Kendall, M.G.; Stuart, A. The Advanced Theory of Statistics; Charles Griffin and Company: London, UK, 1967. [Google Scholar]
- Wohland, J.; Omrani, N.E.; Witthaut, D.; Keenlyside, N.S. Inconsistent wind speed trends in current 20th century reanalyses. J. Geophys. Res. Atmos. 2019, 124, 1931–1940. [Google Scholar] [CrossRef]
- Drumond, A.; Gimeno, L.; Nieto, R.; Trigo, R.M.; Vicente-Serrano, S.M. Drought episodes in the climatological sinks of the Mediterranean moisture source: The role of moisture transport. Glob. Planet. Chang. 2017, 151, 4–14. [Google Scholar] [CrossRef]
- Stojanovic, M.; Drumond, A.; Nieto, R.; Gimeno, L. Moisture Transport Anomalies over the Danube River Basin during Two Drought Events: A Lagrangian Analysis. Atmosphere 2017, 8, 193. [Google Scholar] [CrossRef]
- Stojanovic, M.; Drumond, A.; Nieto, R.; Gimeno, L. Variations in Moisture Supply from the Mediterranean Sea during Meteorological Drought Episodes over Central Europe. Atmosphere 2018, 9, 278. [Google Scholar] [CrossRef]
- Dai, A. Characteristics and trends in various forms of the Palmer Drought Severity Index during 1900–2008. J. Geophys. Res. Atmos. 2011, 116, D12115. [Google Scholar] [CrossRef]
- New, M.; Todd, M.; Hulme, M.; Jones, P. Precipitation measurements and trends in the twentieth century. Int. J. Climatol. 2001, 21, 1889–1922. [Google Scholar] [CrossRef]
- Dai, A. Increasing drought under global warming in observations and models. Nat. Clim. Chang. 2013, 3, 52. [Google Scholar] [CrossRef]
- Rao, V.B.; Franchito, S.H.; Santo, C.M.; Gan, M.A. An update on the rainfall characteristics of Brazil: Seasonal variations and trends in 1979–2011. Int. J. Climatol. 2016, 36, 291–302. [Google Scholar] [CrossRef]
- Rustemeier, E.; Ziese, M.; Meyer-Christoffer, A.; Schneider, U.; Finger, P.; Becker, A. Uncertainty assessment of the ERA-20C reanalysis based on the monthly in-situ precipitation analysis of the Global Precipitation Climatology Centre. J. Hydrometeorol. 2019, in press. [Google Scholar] [CrossRef]


| Number of Events–ERA20C | Number of Events–IAG | Correlation Coefficient | Trend–ERA20C | Trend–IAG | |
|---|---|---|---|---|---|
| SPEI 3 | 28 | 36 | 0.32 ** | −0.28 | −0.07 |
| SPEI 12 | 10 | 16 | 0.44 ** | −0.07 | −0.33 ** |
| SPEI 48 | 4 | 8 | 0.65 ** | −0.17 | −0.43 * |
| Number of Events–ERA20C | Number of Events–CRU | Correlation Coefficient | Trend–ERA20C | Trend–CRU | |
|---|---|---|---|---|---|
| SPEI 3 | 54 | 44 | 0.25 ** | −0.41 | −0.03 |
| SPEI 12 | 24 | 24 | 0.30 ** | −0.20 | −0.22 |
| SPEI 48 | 3 | 6 | 0.55 ** | −0.10 | −0.20 |
| Mean Temperature Correlation | Precipitation Correlation | |||
|---|---|---|---|---|
| CRU | ERA20C | CRU | ERA20C | |
| Sao Carlos (CWSP) | 0.97 | 0.91 | 0.81 | 0.80 |
| Votuporanga (CWSP) | 0.95 | 0.42 | 0.83 | 0.43 |
| Pres. Prudente (CWSP) | 0.96 | 0.89 | 0.71 | 0.64 |
| Franca (CWSP) | 0.91 | 0.91 | 0.85 | 0.84 |
| Sorocaba (ESP) | 0.97 | 0.93 | 0.83 | 0.79 |
| Mir. de Santana (ESP) | 0.98 | 0.81 | 0.90 | 0.69 |
| Correlation between Areal Average SPEI and Local SPEI | ||||||
|---|---|---|---|---|---|---|
| SPEI 3 | SPEI 12 | SPEI 48 | ||||
| CRU | ERA20C | CRU | ERA20C | CRU | ERA20C | |
| Sao Carlos (CWSP) | 0.75 | 0.87 | 0.61 | 0.88 | 0.65 | 0.93 |
| Votuporanga (CWSP) | 0.65 | 0.88 | 0.58 | 0.90 | 0.75 | 0.85 |
| Pres. Prudente (CWSP) | 0.64 | 0.83 | 0.57 | 0.80 | 0.72 | 0.80 |
| Franca (CWSP) | 0.70 | 0.80 | 0.61 | 0.80 | 0.63 | 0.80 |
| Sorocaba (ESP) | 0.96 | 0.85 | 0.92 | 0.83 | 0.87 | 0.86 |
| Mir. de Santana (ESP) | 0.96 | 0.90 | 0.90 | 0.88 | 0.84 | 0.88 |
© 2019 by the authors. Licensee MDPI, Basel, Switzerland. This article is an open access article distributed under the terms and conditions of the Creative Commons Attribution (CC BY) license (http://creativecommons.org/licenses/by/4.0/).
Share and Cite
Gozzo, L.F.; Palma, D.S.; Custodio, M.S.; Machado, J.P. Climatology and Trend of Severe Drought Events in the State of Sao Paulo, Brazil, during the 20th Century. Atmosphere 2019, 10, 190. https://doi.org/10.3390/atmos10040190
Gozzo LF, Palma DS, Custodio MS, Machado JP. Climatology and Trend of Severe Drought Events in the State of Sao Paulo, Brazil, during the 20th Century. Atmosphere. 2019; 10(4):190. https://doi.org/10.3390/atmos10040190
Chicago/Turabian StyleGozzo, Luiz F., Doris S. Palma, Maria S. Custodio, and Jeferson P. Machado. 2019. "Climatology and Trend of Severe Drought Events in the State of Sao Paulo, Brazil, during the 20th Century" Atmosphere 10, no. 4: 190. https://doi.org/10.3390/atmos10040190
APA StyleGozzo, L. F., Palma, D. S., Custodio, M. S., & Machado, J. P. (2019). Climatology and Trend of Severe Drought Events in the State of Sao Paulo, Brazil, during the 20th Century. Atmosphere, 10(4), 190. https://doi.org/10.3390/atmos10040190