Abstract
In this paper, the Weather Research Forecast (WRF) Comprehensive Air Quality Model with Extensions (CAMx) modeling system with the particulate source apportionment technology (PSAT) module was used to study and analyze the spatial and temporal distribution of atmospheric pollutant concentrations and the source apportionment of fine particles (PM2.5) under the base year and an emission reduction scenario in the Shandong province, China. Our results show that industry is the largest contributor of PM2.5. In addition, the contribution of key energy-related industries was as high as 29.5%, with the thermal power industry being the largest individual contributor. In January, the largest contribution came from residents, reaching 41.3%. Moreover, loose coal burning in rural areas contributed up to 19.4% in winter. Our results also show that the emission reduction scenario had palpable effects on the reduction of air pollution. The more the emissions of SO2, NOX, PM2.5, and PM10 were reduced, the more the average concentration was decreased. The implementation of energy conservation and emission reduction policies by industry and resident is conducive to improving the quality of the atmospheric environment. In particular, a comprehensive control of loose coal burning in winter could significantly improve heavy pollution by particulate matter in winter.
1. Introduction
Rapid economic development is often accompanied by large energy consumption and by the generation of atmospheric pollutants, thereby resulting in serious atmospheric environmental problems. The current serious air pollution in China has attracted the attention of the government, the public, and academia [1,2,3]. Shandong is the major economic province in China, having high energy consumption. The total energy consumption of Shandong ranks first among all the provinces in the country. Due to the unsustainable structure of the energy consumption and the industry of fossil fuels, especially for heating in winter, Shandong is affected by severe air pollution. With continuing industrialization and urbanization, the energy demand will continue to grow at a sustained pace. The contradiction between energy demand and environmental protection faced by Shandong Province is becoming increasingly prominent.
Energy consumption is closely related to the generation of atmospheric pollution. Most of the emissions of sulfur dioxide, nitrogen oxides, and particulate matter produced by anthropogenic activities originate from the burning of fossil fuels and biomass [4]. To date, many studies have been carried out on the relationship between energy consumption and the emission of atmospheric pollutants, both in China and abroad. Econometric models such as long-range energy alternatives planning (LEAP), Stochastic impacts by regression on population, affluence, and technology model (STIRPAT), market allocation (MARKAL), and the factorization model have been used in such studies. These models are often combined with scenario analyses to forecast and plan future energy needs, estimate the corresponding environmental impacts, and perform cost–benefit analyses. In these models, the emissions of atmospheric pollutants and greenhouse gases during energy production, transport, and consumption were calculated, and the scenarios for reducing energy consumption and the impact factors were discussed [5,6,7,8,9,10,11,12,13,14,15,16].
Analysis of the impacts on the atmospheric environment using these energy–environmental modeling tools mostly focuses on greenhouse gas emissions. There have been relatively few predictive studies on the emissions and effects of common atmospheric pollutants, such as sulfur dioxide, nitrogen oxides, and particulate matter, on the atmospheric environment in different energy planning scenarios [17,18,19,20]. The regional numerical air quality model can accurately simulate the temporal and spatial variations of atmospheric pollutant concentrations, as well as the contributions of different pollution sources to pollutant concentrations. This model has become one of the mainstream research methods for environmental air quality prediction and pollution source analysis in regional numerical simulations [21]. At present, third-generation air quality models, such as community multi-scale air quality (CMAQ), CAMx, etc., are being widely utilized [22,23,24,25,26,27,28,29]. Many published studies in China used the WRF–CMAQ and WRF–CAMx models to predict the reduction of emissions resulting from the implementation of air pollution control plans or measures in China, the Yangtze River Delta, and the Pearl River Delta [30,31,32,33,34,35,36,37,38,39]. Wu et al. and Huang et al. used the CAMx–PSAT model to simulate the characteristics of the particulate matter pollution and its transport in the Pearl River Delta region. They found that the trans-regional transport and mobile sources were the main sources of particulate matter and that their contributions to particulate matter concentrations in winter were 62% and 21%, respectively [40,41]. Allard et al. used the WRF–CAMx–PSAT model to assess the impact of the implementation of Thailand’s power development plan on the country’s ambient air quality from 2016 to 2036 [42]. Shahbazi et al. found that that the concentration of NOX had decreased by 1.7% after implementing a traffic regulation measure in Tehran, the capital of Iran, using the WRF–CAMx model [43]. All the above studies have shown that using an air quality model is of great significance for the prediction and evaluation of atmospheric environmental impacts and for assessing the effects of the implementation of various energy conservation and emission reduction policies and measures. It would certainly be beneficial to achieve a deeper understanding of the relationships between energy consumption, economic development, energy conservation, and emission reduction, and regional atmospheric environmental quality. This would also be useful for assessing the effectiveness of plan and policy implementation, as well as for identifying and screening targeted strategies and measures to improve the regional atmospheric environment.
At present, the majority of studies on the analysis and prediction of atmospheric environmental quality using air quality models have focused on the impacts of the implementation of traffic regulations, industrial planning, and atmospheric environmental control measures on air quality [44,45,46,47,48,49]. However, few studies are available on the prediction and analysis of atmospheric environmental impacts after the implementation of energy planning, which is closely related to air pollution [50,51]. This study was based on the “Medium- and Long-Term Energy Development Plan of Shandong Province (2016) (MLED_SD)” and focused on thermal power, steel, chemical, coal, and oil extraction, and other key energy-related industries. The impact of different energy conservation and emission reduction policies and measures on the atmospheric environment in Shandong were analyzed herein.
The study is summarized as follows: using 2015 as the base year, a provincial-level atmospheric pollutant emission inventory (baseline inventory) was developed using a bottom-up approach; by combining the “Medium- and Long-Term Energy Development Plan of Shandong Province” and various government-developed energy conservation and emission reduction policies and measures, an emission scenario for 2020 was prepared; the WRF–CAMx–PSAT air quality model system was used to simulate the temporal and spatial distributions and variations of conventional atmospheric pollutant concentrations in Shandong Province in 2015 and 2020; the contributions of key energy-related industries to the concentrations of fine particulate matter were analyzed. This study is expected to provide important data support for the prediction and assessment of the atmospheric environmental impact of medium- and long-term energy development in Shandong Province, as well as a reference for policy makers at the provincial level to formulate energy conservation and emission reduction policies and measures. This will also provide a reference for future atmospheric environment impact assessments at the provincial level in China that focus on energy-related planning.
2. Methodology
2.1. Study Area
Shandong Province is located on the eastern coast of China. In 2015, the energy consumption of the province accounted for 10% of China’s total energy consumption, the highest among all the provinces in China. The consumption of coal also was high, with industrial coal consumption accounting for 96% of the total coal consumption. In particular, coal consumption for power generation accounted for 35% of the total coal consumption [52]. Numerous studies have shown that fossil fuel burning is closely related to primary particulate matter emissions and secondary aerosol generation [30,53,54,55]. The high energy consumption industry-intensive structure resulted in the heavy dependence of Shandong Province industry on energy. The energy consumption structure dominated by fossil energy, especially coal, has put enormous pressure on the environment, especially the atmospheric environment [56]. Recent monitoring data of ambient air quality in Shandong Province show that particulate matter (especially fine particulate matter) poses the most serious pollution issue [57].
The above analysis demonstrates that due to the energy system with coal as the main component and the industrial structure dominated by high energy consumption and high pollution industry, the environmental problems in Shandong (especially the air pollution problem) have become increasingly serious in recent years.
2.2. Emission Inventory
In this study, a “bottom-up” approach was used to develop a 2015 (base year) Shandong Province atmospheric pollutant emission inventory (baseline emission inventory) on the basis of the Shandong Province Environment Statistics Database and Pollution Discharge Declaration Database. The types of primary pollutants that were considered include sulfur dioxide (SO2), nitrogen oxides (NOX), carbon monoxide (CO), volatile organic compounds (VOCs), ammonia (NH3), respirable particulate matter (PM10), and fine particulate matter (PM2.5). The data required for the calculation of atmospheric pollutant emissions from various sources came from the Shandong Province Environment Statistics Database, the Pollution Discharge Declaration Database, the Shandong Statistical Yearbook, statistical yearbooks of prefecture-level cities in the Shandong Province, and questionnaire data on loose coal burning by the rural residents.
2.2.1. Calculation Method and Emission Factors
The emission coefficient method is the most commonly used method for calculating the emission of various pollutants both in China and abroad [58,59,60]. The basic principle is as follows:
where EM is the pollutant emission, AC is the pollutant activity, EF is the emission factor, i is the geographical range of the study area, j is the pollutant emission process, k is the time, and l is the pollutant type.
Table 1 provides the basis for calculating the main atmospheric pollutants from different pollution sources and the emission factors. It should be noted that the SO2 and NOX emission values from industrial and urban living sources were directly taken from the Shandong Province Environment Statistics Database. The pollutant emissions from on-road mobile and agriculture derive from the multi-resolution emission inventory for China (MEIC) [61]. No special calculation was performed in this paper.

Table 1.
The calculation method of the main atmospheric pollutants emission from different pollution sources and the source of the emission coefficient used in this study.
2.2.2. Source Categorization
Based on the emission characteristics of atmospheric pollutants, the emission inventory was divided into 4 emission categories, including industrial sources (industry), residential sources (resident), transportation sources (traffic), and agricultural ammonia emission sources (agriculture).
In this study, the main focus was on industries that are closely related to fossil energy development and utilization, have high fossil energy consumption, and high atmospheric pollutant emissions. Based on MLED_SD and the production characteristics and energy consumption of various industries, 10 types of industries were selected as key energy-related industries, namely coal mining, oil mining, coking, refining, chemical, building materials, graphite carbon, steel, non-ferrous metal smelting, and thermal power production. In 2015, the above-mentioned key energy-related industries accounted for 54% of the total number of enterprises, while in terms of coal consumption, they accounted for more than 90%. In addition, considerable loose coal burning occurs in rural and urban fringe areas, and its impact on the surrounding atmosphere environment cannot be ignored [62]. Therefore, in this study, emissions due to loose coal burning were calculated separately and were categorized as a part of the residents’ emissions.
2.3. The 2020 Emission Reduction Scenario
On the basis of the MLED_SD, this study predicted a future emission reduction plan called the 2020 emission reduction scenario. The atmospheric pollutant emission inventories for 2020 were developed on the basis of the baseline emission inventory. The future scenario of atmospheric pollutant emissions and spatial distribution in Shandong was constructed using the “bottom-up” approach, by comprehensively considering the MLED_SD, the government’s energy-related policies and plans, the environmental protection plan, the energy conservation and emission reduction action plan, and the emissions standards.
For the 2020 emission reduction scenario, the changes in the emissions of atmospheric pollutants from industry and residents caused by the implementation of energy-related planning were considered. It was assumed that the emissions and spatial distributions from on-road mobile road dust, agriculture, outer domains, and the boundary were consistent with the baseline emission inventory. Based on the above considerations, a projected emissions inventory was developed for the 2020 emission reduction scenario. In this study, relevant policies and plans, as well as various specific measures for energy conservation and emission reduction for 2020, were issued. The document directory of the relevant policies, plans, and measures is given in Table 2.
Table 2.
The relevant policies, plans, and measures carried out in the 2020 emission reduction scenario.
2.4. Modeling Configuration
The WRF model is a new-generation mesoscale numerical weather prediction model and assimilation system. The CAMx model is a third-generation air quality model based on the “one atmosphere” framework that can comprehensively simulate the distribution of gaseous and particulate atmospheric pollutants in cities and regions. PSAT is an important extension module of CAMx for particulate matter source analysis for specific source areas and emission sources [63]. This study used WRF v3.9.1 to simulate the 2015 regional meteorological field and provided hourly weather input data to CAMx. Then, CAMx v6.4 and the extension module PSAT were used to simulate the situation of Shandong Province in 2015, as well as the distribution of the concentrations of major atmospheric pollutants and the contributions of key energy-related industries to particulate matter concentrations under 2020 emission scenario [64]. January, April, July, and October were simulated to represent winter, spring, summer, and fall, respectively, to reflect seasonal variations of atmospheric pollutant concentrations. In order to make the emission reduction scenario simulation comparable to the base year, the meteorological field of the base year (2015) was used in the 2020 simulations and the model parameter settings were kept consistent with those of the baseline year simulation.
As shown in Figure 1, CAMx simulations are performed over three domains. Domain 1 covers the North China region with a resolution of 36 × 36 km, Domain 2 covers Shandong Province and part of the Beijing–Tianjin–Hebei region with a resolution of 12 × 12 km, and Domain 3 covers Shandong Province with a resolution of 4 × 4 km. In the simulation area, the Shandong Province area in the third grid layer relied on the emission inventory we developed. The other areas relied on the 2012 MEIC emission inventory developed by Tsinghua University [61].
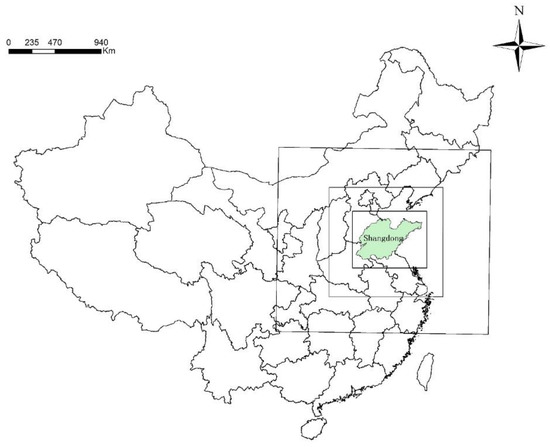
Figure 1.
Model domain setting.
Many studies have shown that PM2.5 mainly originates from local coal-fired power plants, steel, and transportation [65,66,67,68]. Therefore, to study the contributions of energy-consumption-related pollution sources to the particulate matter concentrations, especially pollution sources related to coal burning, 12 emission sources were set up in the PSAT module (Table 3.)
Table 3.
Emission source settings in CAMx-PSAT.
3. Results and Discussion
3.1. Base Year Emission Inventory, and 2020 Emission Reduction Scenario
3.1.1. Base Year Emission Inventory
Table 4 and Figure A1 show the emissions of the main atmospheric pollutants in Shandong Province in 2015. As can be seen from the table, the emissions of SO2, NOX, CO, PM2.5, PM10, VOCs, and NH3 were approximately 1.61, 1.46, 24.20, 0.548, 0.80, 1.33, and 0.663 million t, respectively. The industry contributed more than 65% of the SO2, NOX, CO, PM2.5, PM10, and VOCs emissions. The NH3 emissions originated mainly from agriculture, accounting for up to 98%. The key energy-related industries emitted more than 55% of SO2, NOX, CO, PM2.5, PM10, and VOCs. These are the industries that need to be focused on when controlling air pollution in Shandong Province.
Table 4.
The main atmospheric pollutant emissions in Shandong Province in 2015.
3.1.2. Emission Inventories for 2020 Emission Reduction Scenario
Table 5 shows the main atmospheric pollutant emissions in Shandong Province in the 2020 emission reduction scenario. In the 2020 emission reduction scenario, the emissions of SO2, NOX, CO, PM2.5, and PM10 all decreased significantly, mainly due to the reduction in emissions from key energy-related industries. The emissions of SO2 and NOX from key energy-related industries were 56% and 55% lower than those in 2015, respectively. The thermal power industry exhibited the largest reduction. This was mainly caused by the energy conservation and emission reduction measures, such as “eliminating backward production capacity”, “raising pollutant emission standards”, and “promoting clean coal use” in these industries.
Table 5.
The main atmospheric pollutant emissions in Shandong Province in the 2020 emission reduction scenario.
3.2. Model Verification
3.2.1. Statistical Performance of Meteorological Variable Prediction
Observation data from 27 meteorology stations in Shandong Province were used in our evaluation. Figure 2 shows the location of meteorological monitoring sites. Table 6 presents the evaluation (27 stations on average) of wind speed, wind direction, 2-m temperature, and humidity as simulated by WRF and shows the recommended values for the above statistical quantities provided by the study of Emery et al. [69]. Model performance statistics include mean bias (MB), mean absolute gross error (MAGE), root mean square error (RMSE), correlation coefficient (r) and index of agreement (IOA). The statistical quantities in this study fall within the recommended range, indicating that the simulation error is small, and the results of the simulation are acceptable. The time series comparison between the simulation and the observations of wind speed, wind direction, 2-m temperature, and humidity are shown in Figure 3.
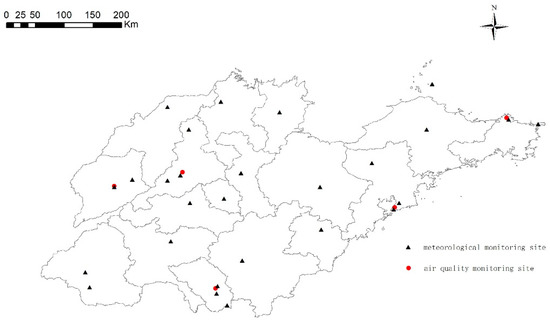
Figure 2.
The location of meteorological monitoring sites and air quality monitoring sites.
Table 6.
The evaluation of hourly Weather Research Forecast (WRF) meteorology simulation and recommended values.
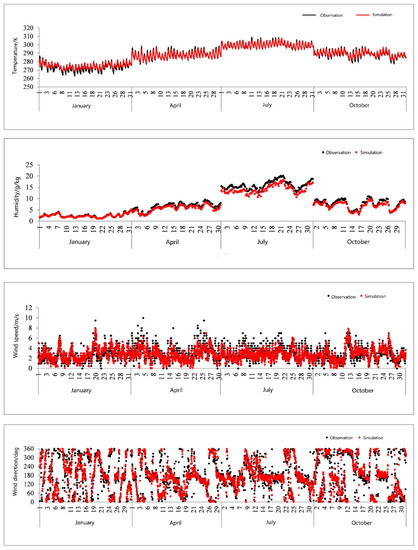
Figure 3.
Model and observation comparison for 27 stations in Shandong province: (a) temperature; (b) humidity; (c) wind speed; (b) wind direction.
3.2.2. Statistical Performance of Air Pollutant Predictions
For the assessment of the effect of pollutant concentrations in the simulation, five provincial monitoring stations in Shandong Province were selected, including the Jinan (JN), Qingdao (QD), Liaocheng (LC), Zaozhuang (ZZ), and Weihai (WH) stations, as representatives of different locations across the province. The location of the air quality monitoring sites is shown in Figure 2. The observation data used for the assessment were the daily averages of five types of pollutants from these stations in January, April, July, and October of 2015. The model evaluation statistics matrix for the CAMx results for SO2, NO2, PM2.5, and PM10 is shown in Table 7 and Table 8.
Table 7.
Performance statistics for hourly pollutant concentrations.
Table 8.
The diurnals of simulated and observed air pollutants concentrations.
In general, the overall simulation results of the five pollutants were good. By comparing the average simulation value and the observation value of the province in 2015, it can be seen that the overall simulated values were systematically lower. The values of SO2, NO2, PM2.5, and PM10 were lower by 12.3%, 38.6%, 9.4%, and 41.6%, respectively. There are three reasons that could cause errors in the simulation: (1) the uncertainty of the source inventory. The relatively low PM10 concentration in the simulation could be related to the fact that the dust in the stack was considered in the emission inventory, and the emission from the road dust sources in the MEIC inventory was low; (2) errors in the meteorological field simulation; (3) theoretical flaws in the model, since the model simulation value is the average of the pollutant concentration in the 4-km grid, which caused the simulation value to be low. The atmospheric chemical reaction mechanism used in the model is also a possible source of error.
3.3. Results of the Simulation of the Base Year
3.3.1. Distribution Characteristics of Atmospheric Pollutants in Different Seasons
The simulated concentration fields of SO2, NO2, PM2.5, and PM10 exhibited obviously spatial and seasonal variations. The spatial distribution of SO2, NO2, PM2.5, and PM10 presented a characteristic of “high in the west and low in the east”. This phenomenon is related to the horizontal diffusion of pollutants, meteorological conditions, and land and sea differences of the underlying surface [70,71]. The eastern coastal areas of Shandong Province are perennially affected by the oceans. Boundary layer processes, such as the sea–land breeze circulation, affect the spatial distribution, transport, diffusion, and accumulation of pollutants [72,73,74]. In general, these processes produce meteorological conditions that are conducive to the diffusion and dilution of pollutants. The concentrations in winter were significantly higher than in the other seasons, which was consistent with the seasonal trend of monitoring data (Figure 4, Figure 5, Figure 6 and Figure 7). The seasonal variation pattern is similar to that of many regions in China [75,76,77,78,79].
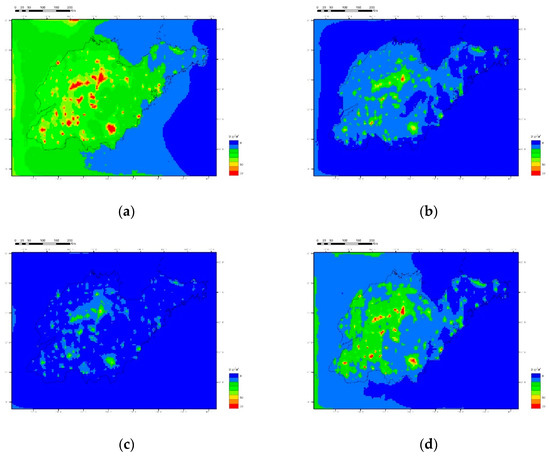
Figure 4.
Simulated concentration of SO2 (µg/m3) in (a) January 2015, (b) April 2015, (c) July 2015, (d) October 2015.
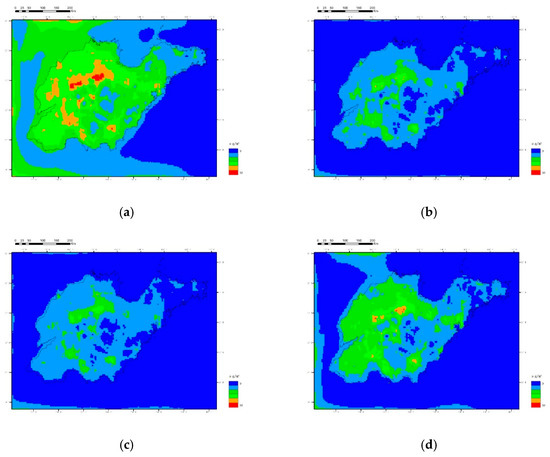
Figure 5.
Simulated concentration of NO2 (µg/m3) in (a) January 2015, (b) April 2015, (c) July 2015, (d) October 2015.
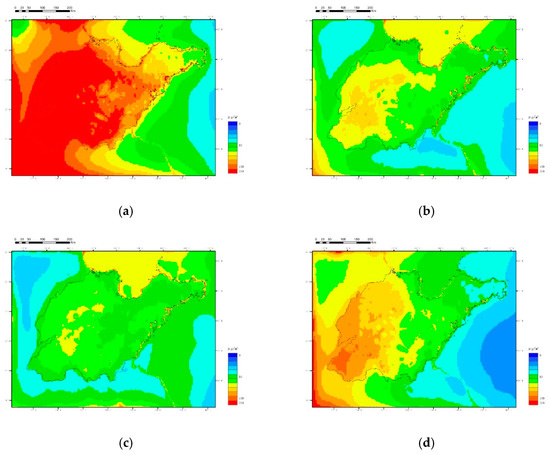
Figure 6.
Simulated concentration of PM10 (µg/m3) in (a) January 2015, (b) April 2015, (c) July 2015, (d) October 2015.
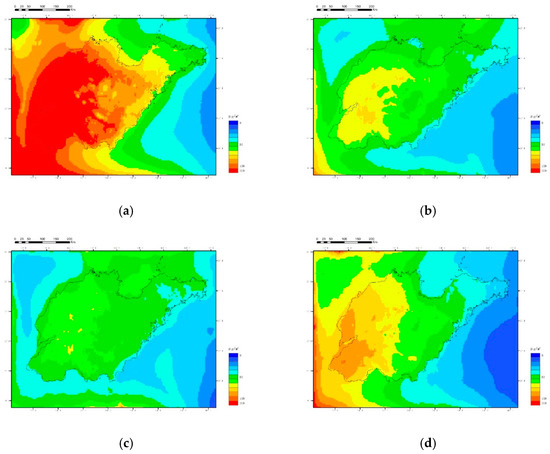
Figure 7.
Simulated concentration of PM2.5 (µg/m3) in (a) January 2015, (b) April 2015, (c) July 2015, (d) October 2015.
3.3.2. Sources Analysis of Fine Particulate Matter in Shandong Province
Table 9 shows the average contributions and the percentage of each sector contribution in January, April, July, and October. Overall, the major contributions were industry, residents, and transportation. Their average contributions were 34.7%, 26.3%, and 15.2%, respectively, and industry was the largest contributor. The average contribution of agriculture was 7.3%, revealing that ammonia emitted from agriculture can chemically react with gaseous pollutants, such as SO2 and NOX, to form ammonium sulfate and ammonium nitrate, which are important precursors of fine particulate matter (PM2.5) [80,81,82].
Table 9.
The average source contributions to PM2.5 concentration and the percentage of each sector contribution in January, April, July, and October in Shandong Province in the base year.
The contribution of various sources presented seasonal variations. The contribution of residents was the most highest in January, and other sector’s contributions were not the same. In April, July, and October, industry was the largest contributor, with 38.6%, 45.3%, and 31.4%, respectively. In January, the residents were the largest contributors, with 41.30%. Among them, the contribution of loose coal burning for winter heating was as high as 19.4%, indicating that loose coal burning was an important contributor to the fine particulate matter pollution in January. As of 2016, a quarter of rural areas in Shandong Province still used traditional methods, such as loose coal and wood burning, for activities such as cooking, heating, and water boiling [62,83]. The amount of pollutants emitted by loose coal burning was very large, and the emissions occur near the ground. The unit emission contribution to air pollution was much higher than that of high-altitude emission sources [84]. Therefore, loose coal combustion has been identified as an important contributor to severe particulate matter pollution [70,85,86,87,88,89]. It can be seen that the use of strong and comprehensive measures to control the burning of loose coal is also an important way to address air pollution in the study area [84,90].
Table 10 shows the average contributions and the percentage of each sector contribution in January, April, July, and October within the key energy-related industries’ contributions. Their cumulative average contribution reached 29.5%; they were the largest contributor among the industry.
Table 10.
The average contribution of key energy-related industries to PM2.5 concentration and the percentage of each sector contribution in January, April, July, and October in the base year.
Most of the key energy-related industries mainly rely on coal-fired power generation, and this is particularly true for the thermal power industry. The emission of fine particulate matter from the thermal power industry accounts for 14% of the total emission of fine particulate matter. The average contribution of the thermal power industry reached 20.4%, which indicated that the thermal power industry had a direct contribution to fine particulate matter [91]. Also, gaseous pollutants such as SO2 and NOX emitted by the thermal power industry can form secondary sulfates and nitrates through chemical reactions, which become an important component of the secondary fine particulate matter [92,93,94,95,96,97]. Therefore, the introduction of a more stringent thermal pollution control policy is an important aspect for improving the quality of the atmospheric environment in Shandong Province.
3.4. Source Analysis of Fine Particulate Matter in the 2020 Emission Reduction Scenario
Based on the simulation of the base year, the 2020 emission reduction scenario simulation was made. The temporal and spatial variation characteristics of pollutant concentration in the 2020 emission reduction scenario are consistent with that in 2015. Table 11 shows the average contributions and the percentage of each sector contribution in January, April, July, and October for the 2020 emission reduction scenario. Overall, the extraterritorial pollution source was the largest contributor, with values as high as 49.9%. This is related to the fact that the emission reduction of the extraterritorial pollution source was not considered in the scenario. This also indicates that even though Shandong Province implements relevant energy conservation and emission reduction policies and measures, if the atmospheric pollutant emissions from surrounding areas remain unchanged, the extraterritorial sources will become the primary pollution sources of fine particulate matter in Shandong Province. This also reflects, to a certain extent, that the control of environmental air pollution must be performed jointly by adjacent regions.
Table 11.
The average source contributions to PM2.5 concentration and the percentage of each sector contribution in January, April, July, and October in Shandong Province in the 2020 scenario.
In the 2020 scenario, industries have become the second largest contributor. Their average contribution was 17.18%, showing a decrease of 17.52% compared to 2015. This indicates that the emission reduction policies and measures of industries can be highly beneficial.
In the 2020 scenario, the average contribution of residents was 8.7%, showing a decrease of 17.6% compared to 2015. In January, the residents were no longer the largest contributors, with 13.19%. Among them, the contribution from winter loose coal burning in January was 6.03%, showing a decrease of 13.37% compared to 2015. This indicates that the implementation of emission reduction measures on residents have a significant effect on reducing the concentration of fine particulate matter. Particularly effective should be the emission reduction measures for loose coal burning in the heating seasons, such as promoting the “coal-to-gas” project, increasing the penetration rate of central heating, and others.
In the 2020 scenario, the average contribution of transportation was 8.11%, showing a decrease of 7.09% compared to 2015. On the other hand, the average contribution of agriculture is 16.1%, showing an increase of 8.8% compared to 2015. This could be due to the fact that the emission reduction policies and measures of agriculture are not considered in the 2020 scenario. In case where the emissions from industry reduce significantly, the contribution rate of agriculture to pollutant concentrations will show a relative increase.
Table 12 shows the average contributions and the percentage of each sector contribution in January, April, July, and October within the key energy-related industries’ contributions in the 2020 emission reduction scenario. Their average contribution was 14.28%, showing a decrease of 15.22% with respect to 2015. However, these industries were still the largest contributors among all the industries. On the other hand, in the 2020 scenario, the thermal power industry was no longer the largest contributor; its average contribution was only 1.75%, showing a decrease of 18.65% with respect to 2015. On the other hand, other key energy-related industries had become the largest pollution sources with their cumulative contribution being 8.7%, showing an increase of 8.1% with respect to 2015. This may be related to the fact that the 2020 scenario mainly focuses on energy conservation and emission reduction in the thermal power industry, which results in the relative increase in the emission proportion of atmospheric pollutants from the other key energy-related industries.
Table 12.
The average contribution of key energy-related industries to PM2.5 concentration and the percentage of each sector contribution in January, April, July, and October in the 2020 scenario.
3.5. The Improving Effect of Control Policies on the Air Pollution Situation in Shandong Province under the 2020 Emission Reduction Scenario
As can be seen from Table 13, the 2020 emission reduction scenario has been significantly reduced compared with the base year (2015) in terms of major gaseous pollutants (SO2, NOX, CO) and primary particulate matter (PM2.5, PM10), with a reduction rate of more than 30% while the reduction rates of VOC and NH3 are minimal. Under such a emission reduction scenario, the average concentrations of SO2, NOX, PM2.5, and PM10 decreased by 30%, 24%, 46%, and 46%, respectively (Table 14). The decrease rates of SO2 and NOX in October were the largest, reaching 42% and 29%, respectively; the decrease rate of PM2.5 and PM10 in July was the largest, reaching 49% and 48%, respectively. Thus it can be seen that under the background of heavy pollution in Shandong Province, the reduction of primary particulate matter emissions and SO2, NOX, and other gaseous pollutants have a direct and significant improvement on reducing particulate matter concentrations.
Table 13.
Emissions and reduction rates of major air pollutants comparing the 2020 emission reduction scenario with the base year in Shandong Province.
Table 14.
The major air pollutant concentration in January, April, July, and October, average concentrations of the above four months in 2015 and 2020, decrease rates of major air pollutants comparing the 2020 emission reduction scenario with the base year (2015) in Shandong Province.
The results show that the reduction rate of gaseous pollutants (SO2, NOX) emissions was slightly less than the decrease rate of the average concentration of gaseous pollutants. The reduction ratios of particulate matter emission are consistent with the decrease ratios of the average concentration of particulate matter.
3.5.1. Policies and Measures for Reducing the Emissions from Industry
In 2015, industry was the largest contributor of fine particulate matter in Shandong Province. Accelerating energy conservation and emission reduction in the industrial sector is an important way to reduce the pollution of atmospheric particulate matter in Shandong Province.
As can be seen from Table 5, in the 2020 emission reduction scenario, the emissions of SO2, NOX, PM2.5, and PM10 from industry are estimated to be approximately 561 kt, 444 kt, 190 kt, and 331.6 kt, respectively. Compared to the data in Table 4, the above-mentioned pollutants were reduced by 54%, 53%, 53%, and 45%. These are the type of pollution sources with the largest emission reduction in the 2020 emission reduction scenario. Especially for the key energy-related industries, the emissions of SO2, NOX, PM2.5, and PM10 are reduced by more than one-third compared to 2015. The reduction of SO2, NOX, PM2.5, and PM10 from key energy-related industries, respectively, accounted for 82%, 88%, 79%, and 78% of the total reduction of SO2, NOX, PM2.5, and PM10. The 2020 scenario also predicts a reduction by more than 20%, compared to 2015, of the average concentrations of SO2, NO2, PM10, and PM2.5. Among them, the average concentrations of PM2.5 and PM10 are both reduced by 46%. With respect to the PM2.5, the contribution from industry decreased by 17.52%, while the contribution from key energy-related industries decreased by 15.22% and the contribution from the thermal power industry decreased by 18.65%. This indicates that the strict implementation of control policies and measures, such as “energy conservation and emission reduction”, “increasing the establishment threshold of high energy consumption industrial project”, and “eliminating backward production capacity” by industry (especially the key energy-related industries) can significantly improve the air quality. In particular, the introduction of strict pollution control measures in the thermal power industry is an effective way to improve the quality of the atmospheric environment in Shandong. Examples of measures are as follows: “by 2020, the average coal consumption of active coal-fired generating units after renovation will be less than 310 g/kWh”; “raise the concentration emission standard of pollutant emissions (i.e., under the condition of reference oxygen content of 6%, the emission concentrations of smoke and dust, SO2, NOX are no higher than 10, 35, 50 mg/m3, respectively)”; “the proportion of coal in primary energy consumption drops to below 62%”; “new coal-fired power generation projects should use ultra-supercritical unit of 600,000 kilowatts and above”; “eliminate conventional small thermal power units with stand-alone capacity of 50,000 kilowatts or less, fuel boilers mainly for power generation, and generator sets”. In the foreseeable future, coal will continue to be the main energy source for industries in Shandong Province. Clean and efficient use of coal is an effective way to implement energy conservation and emission reduction policies in Shandong Province. For traditional coal-fired power plants, building large units to replace the original small ones is the policy with the best emission reduction effects. For existing coal-fired power plants, flue gas desulfurization equipment and the implementation of ultra-low emission technologies synergistically produce relatively good emission reduction effects [98].
3.5.2. Emission Reduction Policies and Measures for the Resident
In 2015, the resident contributed more than one-quarter to fine particulate matter in Shandong Province, and thus was a major contributor to particulate matter pollution. It can be seen that strengthening the energy conservation and emission reduction and control of resident are also important aspects of air pollution control, particularly that of fine particulate matter.
In the 2020 emission reduction scenario, the emission reduction potential of SO2, NOX, PM10, and PM2.5 from residents are only second to that of industry. In 2020, the emissions of SO2, NOX, PM2.5, and PM10 from residents are 39 kt, 19.9 kt, 53.7 kt, and 69.8 kt, respectively. The above-mentioned pollutants were reduced by 11%, 18%, 62%, and 51% compared to 2015. At the same time, the average contribution of residents decreased by 17.6% compared to 2015. Among them, the contribution of emissions from winter heating loose coal burning decreased by more than 10%. This indicates that strengthening the energy conservation and emission reduction for residents is important for improving the air quality in Shandong Province, especially via reducing the particulate matter pollution. The reduction in emissions from loose coal burning is also conducive to improving the particulate pollution situation in winter. In order to achieve the goal of “green water and blue sky” in Shandong Province, the cleanliness of the energy structure for future residents’ life should be continuously enhanced. The energy consumption pattern should be gradually transformed into “electricity-based, coal-supplemented” [99]. The winter clean heating project should be promoted, and coal-to-gas, coal to electricity, centralized heating, and other means to reduce dispersed and inefficient coal burning should be pursued [100].
4. Conclusions
The exploitation and use of fossil energy are closely related to the generation and emission of atmospheric pollutants. Therefore, the implementation of energy-related planning has a significant impact on the regional atmospheric environment. Taking the provincial-level energy development plan as an example, this study relied on a scenario analysis combined with an environmental air quality numerical model based on the “Medium- and Long-Term Energy Development Plan of Shandong Province” to investigate the atmospheric environmental effects of governmental energy conservation and emission reduction policies, programs, and plans.
Numerical simulations relative to the base year show that there were significant differences in spatial and seasonal variations in the main atmospheric pollutant concentrations in Shandong Province. The spatial distribution of SO2, NO2, PM2.5, and PM10 presented the characteristics of “high in the west and low in the east” (i.e., higher concentration in the central and western regions and lower concentration in the eastern coastal areas). In terms of seasonal variations, the concentration of the above pollutants is lower in spring and summer, and higher in fall and winter.
In the base year, industries were the largest contributors to the fine particulate matter pollution in Shandong Province, contributing 34.7%, while the key energy-related industries contributed 29.5%. Among them, the thermal power industry had the largest individual contribution (20.4%), which was higher than that of other key energy-related industries. Residents were the largest contributor in January (40%). In particular, the emissions from loose coal burning for winter heating contributed up to 19.4% in January.
According to the 2020 emission reduction scenario, the overall environmental air quality in Shandong Province is expected to improve significantly. The average concentration of PM2.5 should reduce from 74.15 μg/m3 in 2015 to 40 μg/m3 in 2020. It can be seen that energy conservation and emission reduction policies and measures implemented for industry and residents (particularly the emission reduction measures for key energy-related industries and loose coal burning for winter heating) can significantly reduce the emissions of SO2, NOX, PM2.5, and PM10 and have a significant effect on reducing the average concentrations of these pollutants, thereby improving the air pollution situation in Shandong Province. In general, the greater the emission reduction, the greater the decrease in pollutant concentrations.
Finally, this paper also shows that scenario analysis is an important and effective means to carry out energy-related planning and atmospheric environment prediction and evaluation. The emission inventory for the 2020 emission reduction scenario in this paper is based on the baseline inventory. The middle- and long-term macro-policies, planning, and micro-emission reduction policies are implemented in different industries and enterprises. The emission inventory was developed by fully integrating macro-planning, policies, and micro-measures, which effectively reduces the uncertainty of the scenario analysis and the corresponding emission inventory. Therefore, the beneficial effect on the atmospheric environment quality after the implementation of energy planning and various government energy conservation and emission reduction policies can be predicted more effectively.
Author Contributions
Conceptualization, R.L. and Q.Y.; Data curation, R.L. and C.H.; Methodology, R.L. and W.M.; Project administration, Y.Z. and W.M.; Software, R.L.; Validation, R.L. and L.H.; Writing—original draft, R.L; Writing—review and editing, R.L. and W.M.
Funding
This research received no external funding.
Conflicts of Interest
The authors declare no conflict of interest.
Appendix A


Figure A1.
The spatial distribution of major atmospheric pollutant emissions in Shandong Province in 2015: (a) SO2; (b) NOx; (c) PM2.5; (d) PM10 (e) VOCs; (f) NH3; (g) CO.
References
- Huang, H.; Jiang, Y.; Xu, X.; Cao, X. In vitro bioaccessibility and health risk assessment of heavy metals in atmospheric particulate matters from three different functional areas of Shanghai, China. Sci. Total Environ. 2018, 610–611, 546–554. [Google Scholar] [CrossRef]
- Nie, D.; Wu, Y.; Chen, M.; Liu, H.; Zhang, K.; Ge, P.; Yuan, Y.; Ge, X. Bioaccessibility and health risk of trace elements in fine particulate matter in different simulated body fluids. Atmos. Environ. 2018, 186, 1–8. [Google Scholar] [CrossRef]
- Wang, S.; Hao, J. Air quality management in China: Issues, challenges, and options. J. Environ. Sci. (China) 2012, 24, 2–13. [Google Scholar] [CrossRef]
- Hondroyiannis, G.; Lolos, S.; Papapetrou, E. Energy consumption and economic growth: Assessing the evidence from Greece. Energy Econ. 2002, 24, 319–336. [Google Scholar] [CrossRef]
- Poumanyvong, P.; Kaneko, S. Does urbanization lead to less energy use and lower CO2 emissions? A cross-country analysis. Ecol. Econ. 2010, 70, 434–444. [Google Scholar] [CrossRef]
- Leighty, W.; Ogden, J.M.; Yang, C. Modeling transitions in the California light-duty vehicles sector to achieve deep reductions in transportation greenhouse gas emissions. Energy Policy 2012, 44, 52–67. [Google Scholar] [CrossRef]
- Ates, S.A. Energy efficiency and CO2 mitigation potential of the Turkish iron and steel industry using the LEAP (long-range energy alternatives planning) system. Energy 2015, 90, 417–428. [Google Scholar] [CrossRef]
- Hao, H.; Geng, Y.; Li, W.; Guo, B. Energy consumption and GHG emissions from China’s freight transport sector: Scenarios through 2050. Energy Policy 2015, 85, 94–101. [Google Scholar] [CrossRef]
- Hong, S.; Chung, Y.; Kim, J.; Chun, D. Analysis on the level of contribution to the national greenhouse gas reduction target in Korean transportation sector using LEAP model. Renew. Sustain. Energy Rev. 2016, 60, 549–559. [Google Scholar] [CrossRef]
- An, W. Application of Scenario Analysis Method on Urban Air Pollutant Emission Total Prediction. Master’s Thesis, Xi’an University of Architectural Science and Technology, Xi’an, China, 2016. [Google Scholar]
- Cui, H.; Wei, P. Scenario study on energy saving and emission reduction policies in iron and steel industry-based on LEAP model. J. Beijing Univ. Technolog. (Soc. Sci. Ed.) 2016, 18, 1–9. [Google Scholar]
- Ajanovic, A.; Haas, R. The impact of energy policies in scenarios on GHG emission reduction in passenger car mobility in the EU-15. Renew. Sustain. Energy Rev. 2017, 68, 1088–1096. [Google Scholar] [CrossRef]
- Zhao, W.; Niu, D. Prediction of CO2 Emission in China’s Power Generation Industry with Gauss Optimized Cuckoo Search Algorithm and Wavelet Neural Network Based on STIRPAT model with Ridge Regression. Sustainability 2017, 9, 2377. [Google Scholar] [CrossRef]
- Zhang, M. Prediction of SO2 and NOX Emission Inventories in Mainland China in 2020 and 2050 under IPCC Scenario. Master’s Thesis, Xi’an University of Architecture and Technology, Xi’an, China, 2017. [Google Scholar]
- Bhuvanesh, A.; Jaya Christa, S.T.; Kannan, S.; Karuppasamy Pandiyan, M. Aiming towards pollution free future by high penetration of renewable energy sources in electricity generation expansion planning. Futures 2018, 104, 25–36. [Google Scholar] [CrossRef]
- Liya, C.; Jianfeng, G. Scenario analysis of CO2 emission abatement effect based on LEAP. Energy Procedia 2018, 152, 965–970. [Google Scholar] [CrossRef]
- Kadian, R.; Dahiya, R.P.; Garg, H.P. Energy-related emissions and mitigation opportunities from the household sector in Delhi. Energy Policy 2007, 35, 6195–6211. [Google Scholar] [CrossRef]
- Shabbir, R.; Ahmad, S.S. Monitoring urban transport air pollution and energy demand in Rawalpindi and Islamabad using leap model. Energy 2010, 35, 2323–2332. [Google Scholar] [CrossRef]
- Liu, L.; Wang, K.; Wang, S.; Zhang, R.; Tang, X. Assessing energy consumption, CO2 and pollutant emissions and health benefits from China’s transport sector through 2050. Energy Policy 2018, 116, 382–396. [Google Scholar] [CrossRef]
- Mengal, A.; Mirjat, N.H.; Das Walasai, G.; Khatri, S.A.; Harijan, K.; Uqaili, M.A. Modeling of Future Electricity Generation and Emissions Assessment for Pakistan. Processes 2019, 7, 212. [Google Scholar] [CrossRef]
- Ferreira, J.; Rodriguez, A.; Monteiro, A.; Miranda, A.I.; Dios, M.; Souto, J.A.; Yarwood, G.; Nopmongcol, U.; Borrego, C. Air quality simulations for North America—MM5–CAMx modelling performance for main gaseous pollutants. Atmos. Environ. 2012, 53, 212–224. [Google Scholar] [CrossRef]
- Tesche, T.W.; Morris, R.; Tonnesen, G.; McNally, D.; Boylan, J.; Brewer, P. CMAQ/CAMx annual 2002 performance evaluation over the eastern US. Atmos. Environ. 2006, 40, 4906–4919. [Google Scholar] [CrossRef]
- Wang, S.; Zhao, M.; Xing, J.; Wu, Y.; Zhou, Y.; Lei, Y.; He, K.; Fu, L.; Hao, J. Quantifying the Air Pollutants Emission Reduction during the 2008 Olympic Games in Beijing. Environ. Sci. Technol. 2010, 44, 2490–2496. [Google Scholar] [CrossRef] [PubMed]
- Zhang, H.; Chen, G.; Hu, J.; Chen, S.; Wiedinmyer, C.; Kleeman, M.; Ying, Q. Evaluation of a seven-year air quality simulation using the Weather Research and Forecasting (WRF)/Community Multiscale Air Quality (CMAQ) models in the eastern United States. Sci. Total Environ. 2014, 473–474, 275–285. [Google Scholar] [CrossRef] [PubMed]
- Li, L.; An, J.Y.; Zhou, M.; Yan, R.S.; Huang, C.; Lu, Q.; Lin, L.; Wang, Y.J.; Tao, S.K.; Qiao, L.P.; et al. Source apportionment of fine particles and its chemical components over the Yangtze River Delta, China during a heavy haze pollution episode. Atmos. Environ. 2015, 123, 415–429. [Google Scholar] [CrossRef]
- Hu, J.; Wu, L.; Zheng, B.; Zhang, Q.; He, K.; Chang, Q.; Li, X.; Yang, F.; Ying, Q.; Zhang, H. Source contributions and regional transport of primary particulate matter in China. Environ. Pollut. 2015, 207, 31–42. [Google Scholar] [CrossRef]
- Wang, Y.; Bao, S.; Wang, S.; Hu, Y.; Shi, X.; Wang, J.; Zhao, B.; Jiang, J.; Zheng, M.; Wu, M.; et al. Local and regional contributions to fine particulate matter in Beijing during heavy haze episodes. Sci. Total Environ. 2017, 580, 283–296. [Google Scholar] [CrossRef]
- Baykara, M.; Im, U.; Unal, A. Evaluation of impact of residential heating on air quality of megacity Istanbul by CMAQ. Sci. Total Environ. 2019, 651, 1688–1697. [Google Scholar] [CrossRef]
- Liu, H.; Zhang, M.; Han, X.; Li, J.; Chen, L. Episode analysis of regional contributions to tropospheric ozone in Beijing using a regional air quality model. Atmos. Environ. 2019, 199, 299–312. [Google Scholar] [CrossRef]
- Zheng, S.; Yi, H.; Li, H. The impacts of provincial energy and environmental policies on air pollution control in China. Renew. Sustain. Energy Rev. 2015, 49, 386–394. [Google Scholar] [CrossRef]
- Wang, L.; Jang, C.; Zhang, Y.; Wang, K.; Zhang, Q.; Streets, D.; Fu, J.; Lei, Y.; Schreifels, J.; He, K.; et al. Assessment of air quality benefits from national air pollution control policies in China. Part I: Background, emission scenarios and evaluation of meteorological predictions. Atmos. Environ. 2010, 44, 3442–3448. [Google Scholar] [CrossRef]
- Deng, T.; Huang, Y.; Li, Z.; Wang, N.; Wang, S.; Zou, Y.; Yin, C.; Fan, S. Numerical simulations for the sources apportionment and control strategies of PM 2.5 over Pearl River Delta, China, part II: Vertical distribution and emission reduction strategies. Sci. Total Environ. 2018, 634, 1645–1656. [Google Scholar] [CrossRef]
- Wang, S.; Xing, J.; Zhao, B.; Carey, J.; Hao, J. Effectiveness of national air pollution control policies on the air quality in metropolitan areas of China. J. Environ. Sci. 2014, 26, 13–22. [Google Scholar] [CrossRef]
- Zhao, B.; Wang, S.; Wang, J.; Fu, J.S.; Liu, T.; Xu, J.; Fu, X.; Hao, J. Impact of national NOX and SO2 control policies on particulate matter pollution in China. Atmos. Environ. 2013, 77, 453–463. [Google Scholar] [CrossRef]
- Che, W.; Zheng, J.; Wang, S.; Zhong, L.; Lau, A. Assessment of motor vehicle emission control policies using Model-3/CMAQ model for the Pearl River Delta region, China. Atmos. Environ. 2011, 45, 1740–1751. [Google Scholar] [CrossRef]
- Lu, X.; Chen, Y.; Huang, Y.; Lin, C.; Li, Z.; Fung, J.C.H.; Lau, A.K.H. Differences in concentration and source apportionment of PM2.5 between 2006 and 2015 over the PRD region in southern China. Sci Total Environ. 2019, 673, 708–718. [Google Scholar] [CrossRef] [PubMed]
- Yu, M.; Zhu, Y.; Lin, C.; Wang, S.; Xing, J.; Jang, C.; Huang, J.; Huang, J.; Jin, J.; Yu, L. Effects of air pollution control measures on air quality improvement in Guangzhou, China. J. Environ. Manag. 2019, 244, 127–137. [Google Scholar] [CrossRef]
- Wang, N.; Lyu, X.P.; Deng, X.J.; Guo, H.; Deng, T.; Li, Y.; Yin, C.Q.; Li, F.; Wang, S.Q. Assessment of regional air quality resulting from emission control in the Pearl River Delta region, southern China. Sci. Total Environ. 2016, 573, 1554–1565. [Google Scholar] [CrossRef]
- Wang, L.; Jang, C.; Zhang, Y.; Wang, K.; Zhang, Q.; Streets, D.; Fu, J.; Lei, Y.; Schreifels, J.; He, K.; et al. Assessment of air quality benefits from national air pollution control policies in China. Part II: Evaluation of air quality predictions and air quality benefits assessment. Atmos. Environ. 2010, 44, 3449–3457. [Google Scholar] [CrossRef]
- Wu, D.; Fung, J.C.H.; Yao, T.; Lau, A.K.H. A study of control policy in the Pearl River Delta region by using the particulate matter source apportionment method. Atmos. Environ. 2013, 76, 147–161. [Google Scholar] [CrossRef]
- Huang, Z.; Ou, J.; Zheng, J.; Yuan, Z.; Yin, S.; Chen, D.; Tan, H. Process Contributions to Secondary Inorganic Aerosols during Typical Pollution Episodes over the Pearl River Delta Region, China. Aerosol Air Qual. Res. 2016, 16, 2129–2144. [Google Scholar] [CrossRef]
- Allard, J.; Day, D.; Alleyne, M.; Griffin, R.; Pham, T.; Boonman, T.; Bonnet, S.; Garivait, S. Analysis of the Effects of the Thai Power Development Plan 2015 on Air Quality from 2016 to 2036. In Proceedings of the 2nd International Electronic Conference on Atmospheric Sciences, 16–31 July 2016; MDPI: Basel, Switzerland, 2016. [Google Scholar]
- Shahbazi, H.; Ganjiazad, R.; Hosseini, V.; Hamedi, M. Investigating the influence of traffic emission reduction plans on Tehran air quality using WRF/CAMx modeling tools. Transp. Res. Part D Transp. Environ. 2017, 57, 484–495. [Google Scholar] [CrossRef]
- Qiu, X.; Duan, L.; Cai, S.; Yu, Q.; Wang, S.; Chai, F.; Gao, J.; Li, Y.; Xu, Z. Effect of current emission abatement strategies on air quality improvement in China: A case study of Baotou, a typical industrial city in Inner Mongolia. J. Environ. Sci. China 2017, 57, 383–390. [Google Scholar] [CrossRef] [PubMed]
- Tan, J.; Fu, J.S.; Huang, K.; Yang, C.; Zhuang, G.; Sun, J. Effectiveness of SO2 emission control policy on power plants in the Yangtze River Delta, China—Post-assessment of the 11th Five-Year Plan. Environ. Sci. Pollut. Res. 2017, 24, 8243–8255. [Google Scholar] [CrossRef] [PubMed]
- Grabow, M.L.; Spak, S.N.; Holloway, T.; Stone, B.; Mednick, A.C.; Patz, J.A. Air quality and exercise-related health benefits from reduced car travel in the midwestern United States. Environ. Health Perspect. 2012, 120, 68–76. [Google Scholar] [CrossRef] [PubMed]
- Feng, R.; Wang, Q.; Huang, C.; Liang, J.; Luo, K.; Fan, J.; Cen, K. Investigation on air pollution control strategy in Hangzhou for post-G20/pre-Asian-games period (2018–2020). Atmos. Pollut. Res. 2019, 10, 197–208. [Google Scholar] [CrossRef]
- Guttikunda, S.K.; Jawahar, P. Atmospheric emissions and pollution from the coal-fired thermal power plants in India. Atmos. Environ. 2014, 92, 449–460. [Google Scholar] [CrossRef]
- Cheng, N.; Zhang, D.; Li, Y.; Xie, X.; Chen, Z.; Meng, F.; Gao, B.; He, B. Spatio-temporal variations of PM2.5 concentrations and the evaluation of emission reduction measures during two red air pollution alerts in Beijing. Sci. Rep. UK 2017, 7, 8220. [Google Scholar] [CrossRef]
- Cook, R.; Phillips, S.; Houyoux, M.; Dolwick, P.; Mason, R.; Yanca, C.; Zawacki, M.; Davidson, K.; Michaels, H.; Harvey, C.; et al. Air quality impacts of increased use of ethanol under the United States’ Energy Independence and Security Act. Atmos. Environ. 2011, 45, 7714–7724. [Google Scholar] [CrossRef]
- Tong, D.; Geng, G.; Jiang, K.; Cheng, J.; Zheng, Y.; Hong, C.; Yan, L.; Zhang, Y.; Chen, X.; Bo, Y.; et al. Energy and emission pathways towards PM2.5 air quality attainment in the Beijing-Tianjin-Hebei region by 2030. Sci. Total Environ. 2019, 692, 361–370. [Google Scholar] [CrossRef]
- Zhang, Y.; Liu, C.; Li, K.; Zhou, Y. Strategy on China’s regional coal consumption control: A case study of Shandong province. Energy Policy 2018, 112, 316–327. [Google Scholar] [CrossRef]
- Liu, J.; Kiesewetter, G.; Klimont, Z.; Cofala, J.; Heyes, C.; Schöpp, W.; Zhu, T.; Cao, G.; Gomez Sanabria, A.; Sander, R.; et al. Mitigation pathways of air pollution from residential emissions in the Beijing-Tianjin-Hebei region in China. Environ. Int. 2019, 125, 236–244. [Google Scholar] [CrossRef]
- Yao, Y.; He, C.; Li, S.; Ma, W.; Li, S.; Yu, Q.; Mi, N.; Yu, J.; Wang, W.; Yin, L.; et al. Properties of particulate matter and gaseous pollutants in Shandong, China: Daily fluctuation, influencing factors, and spatiotemporal distribution. Sci. Total Environ. 2019, 660, 384–394. [Google Scholar] [CrossRef] [PubMed]
- Ma, X.; Jia, H.; Sha, T.; An, J.; Tian, R. Spatial and seasonal characteristics of particulate matter and gaseous pollution in China: Implications for control policy. Environ. Pollut. 2019, 248, 421–428. [Google Scholar] [CrossRef] [PubMed]
- Shandong Statistical Bureau Statistical Yearbook in 2016. Available online: http://www.stats-sd.gov.cn/col/col6279/index.html (accessed on 16 April 2017).
- Wang, J.; Qiu, C.; Liu, H.; Cao, J.; Wang, D.; Dong, X. The relationship between air quality and meteorological factors in key cities of Shandong Province. J. Ecol. Environ. 2013, 22, 644–649. [Google Scholar]
- Wang, L.; Zhang, Q.; Hao, J.; He, K. Inventory of CO anthropogenic emissions from mainland China. J. Environ. Sci. 2005, 25, 8–13. [Google Scholar]
- Zhao, B.; Ma, J. Establishment of the Inventory of Atmospheric Pollution Sources in Tianjin. J. Environ. Sci. 2008, 28, 368–375. [Google Scholar]
- Huang, C.; Chen, C.; Li, L.; Chen, Z.; Wang, H.; Wang, Y.; Huang, H.; Zhang, G.; Chen, Y. Emission characteristics of atmospheric pollutants from anthropogenic sources in the Yangtze River Delta. J. Environ. Sci. 2011, 31, 1858–1871. [Google Scholar]
- Multi-Resolution Emission Inventory for China [Z/OL]. Available online: http://meicmodel.org/ (accessed on 29 October 2019).
- Yu, Z.; Zhang, S.; Huang, X.; Liu, J. Investigation on the Energy Status and Heating in Rural Areas of Shandong Province, China. Procedia Eng. 2017, 205, 1446–1453. [Google Scholar] [CrossRef]
- Kwok, R.H.F.; Baker, K.R.; Napelenok, S.L.; Tonnesen, G.S. Photochemical grid model implementation and application of VOC, NOX, and O3 source apportionment. Geosci. Model Dev. 2015, 8, 99–114. [Google Scholar] [CrossRef]
- Pan, X.; Ma, H. 2000–2016 Near-surface Atmospheric Driving Data of Heihe River Basin Based on WRF Model. Plateau Meteorol. 2019, 38, 206–216. [Google Scholar]
- Zhao, P.S.; Dong, F.; He, D.; Zhao, X.J.; Zhang, X.L.; Zhang, W.Z.; Yao, Q.; Liu, H.Y. Characteristics of concentrations and chemical compositions for PM2.5 in the region of Beijing, Tianjin, and Hebei, China. Atmos. Chem. Phys. 2013, 13, 4631–4644. [Google Scholar] [CrossRef]
- Xu, L.; Jiao, L.; Hong, Z.; Zhang, Y.; Du, W.; Wu, X.; Chen, Y.; Deng, J.; Hong, Y.; Chen, J. Source identification of PM 2.5 at a port and an adjacent urban site in a coastal city of China: Impact of ship emissions and port activities. Sci. Total Environ. 2018, 634, 1205–1213. [Google Scholar] [CrossRef] [PubMed]
- Li, R.; Cui, L.; Li, J.; Zhao, A.; Fu, H.; Wu, Y.; Zhang, L.; Kong, L.; Chen, J. Spatial and temporal variation of particulate matter and gaseous pollutants in China during 2014–2016. Atmos. Environ. 2017, 161, 235–246. [Google Scholar] [CrossRef]
- Ye, W.; Ma, Z.; Ha, X. Spatial-temporal patterns of PM2.5 concentrations for 338 Chinese cities. Sci. Total Environ. 2018, 631–632, 524–533. [Google Scholar] [CrossRef] [PubMed]
- Emery, C.; Tai, E.; Greg, Y. Enhanced Meteorological Modeling and Performance Evaluation for Two Texas Ozone Episodes; The Texas Natural Resource Conservation Commission, The Texas Natural Resource Conservation Commission: Austin, TX, USA, 2001.
- Liu, X. Analysis of Air Pollution Change Characteristics in Shandong Province from 2000 to 2005. Master’s Thesis, Shandong University, Jinan, China, 2008. [Google Scholar]
- Zhang, Y.; Xu, Y. 2005–2012 Analysis of Atmospheric Environmental Quality in Four Cities in South-central Shandong Province. J. Ludong Univ. (Nat. Sci. Ed.) 2014, 30, 73–77. [Google Scholar]
- Finardi, S.; Agrillo, G.; Baraldi, R.; Calori, G.; Carlucci, P.; Ciccioli, P.; D’Allura, A.; Gasbarra, D.; Gioli, B.; Magliulo, V.; et al. Atmospheric Dynamics and Ozone Cycle during Sea Breeze in a Mediterranean Complex Urbanized Coastal Site. J. Appl. Meteorol. Clim. 2018, 57, 1083–1099. [Google Scholar] [CrossRef]
- Li, H.; Wang, B.; Fang, X.; Zhu, W.; Fan, Q.; Liao, Z.; Liu, J.; Zhang, A.; Fan, S. Combined effect of boundary layer recirculation factor and stable energy on local air quality in the Pearl River Delta over southern China. J. Air Waste Manag. Assoc. 2018, 68, 685–699. [Google Scholar] [CrossRef]
- Wang, H.; Lyu, X.; Guo, H.; Wang, Y.; Zou, S.; Ling, Z.; Wang, X.; Jiang, F.; Zeren, Y.; Pan, W.; et al. Ozone pollution around a coastal region of South China Sea: Interaction between marine and continental air. Atmos. Chem. Phys. 2018, 18, 4277–4295. [Google Scholar] [CrossRef]
- Xu, L.; Chen, X.; Chen, J.; Zhang, F.; He, C.; Zhao, J.; Yin, L. Seasonal variations and chemical compositions of PM2.5 aerosol in the urban area of Fuzhou, China. Atmos. Res. 2012, 104–105, 264–272. [Google Scholar] [CrossRef]
- Betha, R.; Behera, S.N.; Balasubramanian, R. 2013 Southeast Asian Smoke Haze: Fractionation of Particulate-Bound Elements and Associated Health Risk. Environ. Sci. Technol. 2014, 48, 4327–4335. [Google Scholar] [CrossRef]
- Tao, J.; Zhang, L.; Ho, K.; Zhang, R.; Lin, Z.; Zhang, Z.; Lin, M.; Cao, J.; Liu, S.; Wang, G. Impact of PM2.5 chemical compositions on aerosol light scattering in Guangzhou—The largest megacity in South China. Atmos. Res. 2014, 135–136, 48–58. [Google Scholar] [CrossRef]
- Tao, J.; Gao, J.; Zhang, L.; Zhang, R.; Che, H.; Zhang, Z.; Lin, Z.; Jing, J.; Cao, J.; Hsu, S.C. PM2.5 pollution in a megacity of southwest China: Source apportionment and implication. Atmos. Chem. Phys. 2014, 14, 8679–8699. [Google Scholar] [CrossRef]
- Zhang, F.; Wang, Z.; Cheng, H.; Lv, X.; Gong, W.; Wang, X.; Zhang, G. Seasonal variations and chemical characteristics of PM2.5 in Wuhan, central China. Sci. Total. Environ. 2015, 518–519, 97–105. [Google Scholar] [CrossRef]
- Fu, X. Numerical Simulation of Secondary Inorganic Particulate Matter Pollution and Its Influence on Ammonia. Ph.D. Thesis, Tsinghua University, Beijing, China, 2016. [Google Scholar]
- Xausa, F. Study on the Impact of Ammonia Emissions on Fine Particulate Matter Pollution in China. Master’s Thesis, Tsinghua University, Beijing, China, 2014. [Google Scholar]
- Yin, S. Anthropogenic Source Ammonia Emission Inventory in the Pearl River Delta and Its Contribution to the Formation of Particulate Matter. Master’s Thesis, South China University of Technology, Guangzhou, China, 2011. [Google Scholar]
- Huang, X.; Fang, H.; Zhang, L.; Liu, J.; Zhang, L. Preliminary Analysis on the Different Heating Technologies in a Rural Area of Shandong Province, China. Procedia Eng. 2017, 205, 1461–1468. [Google Scholar] [CrossRef]
- Zhi, G.Z.; Yang, J.; Zhang, T.; Guan, J.; Du, J.; Xue, Z.; Meng, F. Investigation, emission estimation and policy implications of coal burning in rural areas in northern China. Environ. Sci. Res. 2015, 28, 1179–1185. [Google Scholar]
- Ge, H. Detection and Pollution Characteristic Analysis of Heavy Metals in PM2.5 of Tai’an City. Master’s Thesis, Shandong University, Jinan, China, 2016. [Google Scholar]
- Liu, Y.; Li, X.; Zhang, Y.; Lu, B.; Tang, G. Autumn and Winter Atmospheric Fine Particle Pollution Characteristics and Sources in Jinan City in Shandong Province. Environ. Chem. 2017, 36, 787–798. [Google Scholar]
- Zhang, J. Preliminary Study on Secondary Organic Aerosols in Winter Water Phase in Jinan City. Master’s Thesis, Shandong University, Jinan, China, 2018. [Google Scholar]
- Liu, Y.; Yin, B.; Wang, J.; Wang, X.; Hou, L.; Ma, Y.; Wang, J.; Zhao, X.; Jiang, Y. Changing Characteristics of Particulate Matter Components in Heavy Air Pollution Process of Jinan city in Shandong province in Winter. Environ. Chem. 2018, 37, 2749–2757. [Google Scholar]
- Yang, Y. Chemical Composition and Source Analysis of Atmospheric Particulates with Different Particle Sizes in Jinan City. Master’s Thesis, Shandong University, Jinan, China, 2017. [Google Scholar]
- Lu, Z.; Streets, D.G.; Zhang, Q.; Wang, S.; Carmichael, G.R.; Cheng, Y.F.; Wei, C.; Chin, M.; Diehl, T.; Tan, Q. Sulfur dioxide emissions in China and sulfur trends in East Asia since 2000. Atmos. Chem. Phys. 2010, 10, 6311–6331. [Google Scholar] [CrossRef]
- Yang, L. Characteristics and Sources of Atmospheric PM2.5 Pollution in Jinan City and Their Impact on Visibility. Ph.D. Thesis, Shandong University, Jinan, China, 2008. [Google Scholar]
- Xu, P.; Wang, W.; Yang, L.; Zhang, Q.; Gao, R.; Wang, X.; Nie, W.; Gao, X. Aerosol size distributions in urban Jinan: Seasonal characteristics and variations between weekdays and weekends in a heavily polluted atmosphere. Environ Monit. Assess 2011, 179, 443–456. [Google Scholar] [CrossRef]
- Gao, X.; Yang, L.; Cheng, S.; Gao, R.; Zhou, Y.; Xue, L.; Shou, Y.; Wang, J.; Wang, X.; Nie, W.; et al. Semi-continuous measurement of water-soluble ions in PM2.5 in Jinan, China: Temporal variations and source apportionments. Atmos. Environ. 2011, 45, 6048–6056. [Google Scholar] [CrossRef]
- Gu, J.; Du, S.; Han, D.; Hou, L.; Yi, J.; Xu, J.; Liu, G.; Han, B.; Yang, G.; Bai, Z. Major chemical compositions, possible sources, and mass closure analysis of PM2.5 in Jinan, China. Air Qual. Atmos. Health 2014, 7, 251–262. [Google Scholar] [CrossRef]
- Yao, L. Study on the Chemical Composition, Source and Secondary Generation of Atmospheric PM2.5 in Typical Areas of Shandong Province. Ph.D. Thesis, Shandong University, Jinan, China, 2016. [Google Scholar]
- Xue, W.; Xu, Y.; Wang, J.; Tang, X. The Impact of Atmospheric Pollutant Emissions from Thermal Power Industry on Air Quality. China Environ. Sci. 2016, 36, 1281–1288. [Google Scholar]
- Chen, B. Study on Emission Characteristics of Thermal Power Industry and Its Impact on Air Quality in Beijing-Tianjin-Hebei Region. Master’s Thesis, Zhejiang University, Hangzhou, China, 2016. [Google Scholar]
- Zhang, X. Research on Synchronous Emission Reduction of Atmospheric Particulate Matters and Greenhouse Gases in Tianjin Thermal Power Industry. Ph.D. Thesis, Nankai University, Tianjin, China, 2013. [Google Scholar]
- Chai, F.; Xue, Z.; Zhi, G.; Du, J.; Luo, Y.; Ren, Y.; Ye, J. Comprehensive Countermeasures for Combustion Pollution of Scattered Coal in Rural Residents. Environ. Prot. 2016, 44, 15–19. [Google Scholar]
- Li, Q.; Duan, L.; Jiang, J.; Wang, S.; Hao, J. Research on the emission reduction potential of primary coal-fired particulate matter in China. J. China Electr. Eng. 2016, 36, 4408–4414. [Google Scholar]
© 2019 by the authors. Licensee MDPI, Basel, Switzerland. This article is an open access article distributed under the terms and conditions of the Creative Commons Attribution (CC BY) license (http://creativecommons.org/licenses/by/4.0/).