Alteration of Hepatic Gene Expression along with the Inherited Phenotype of Acquired Fatty Liver in Chicken

Abstract
1. Introduction
2. Materials and Methods
2.1. Ethics Approval
2.2. Birds and Treatments
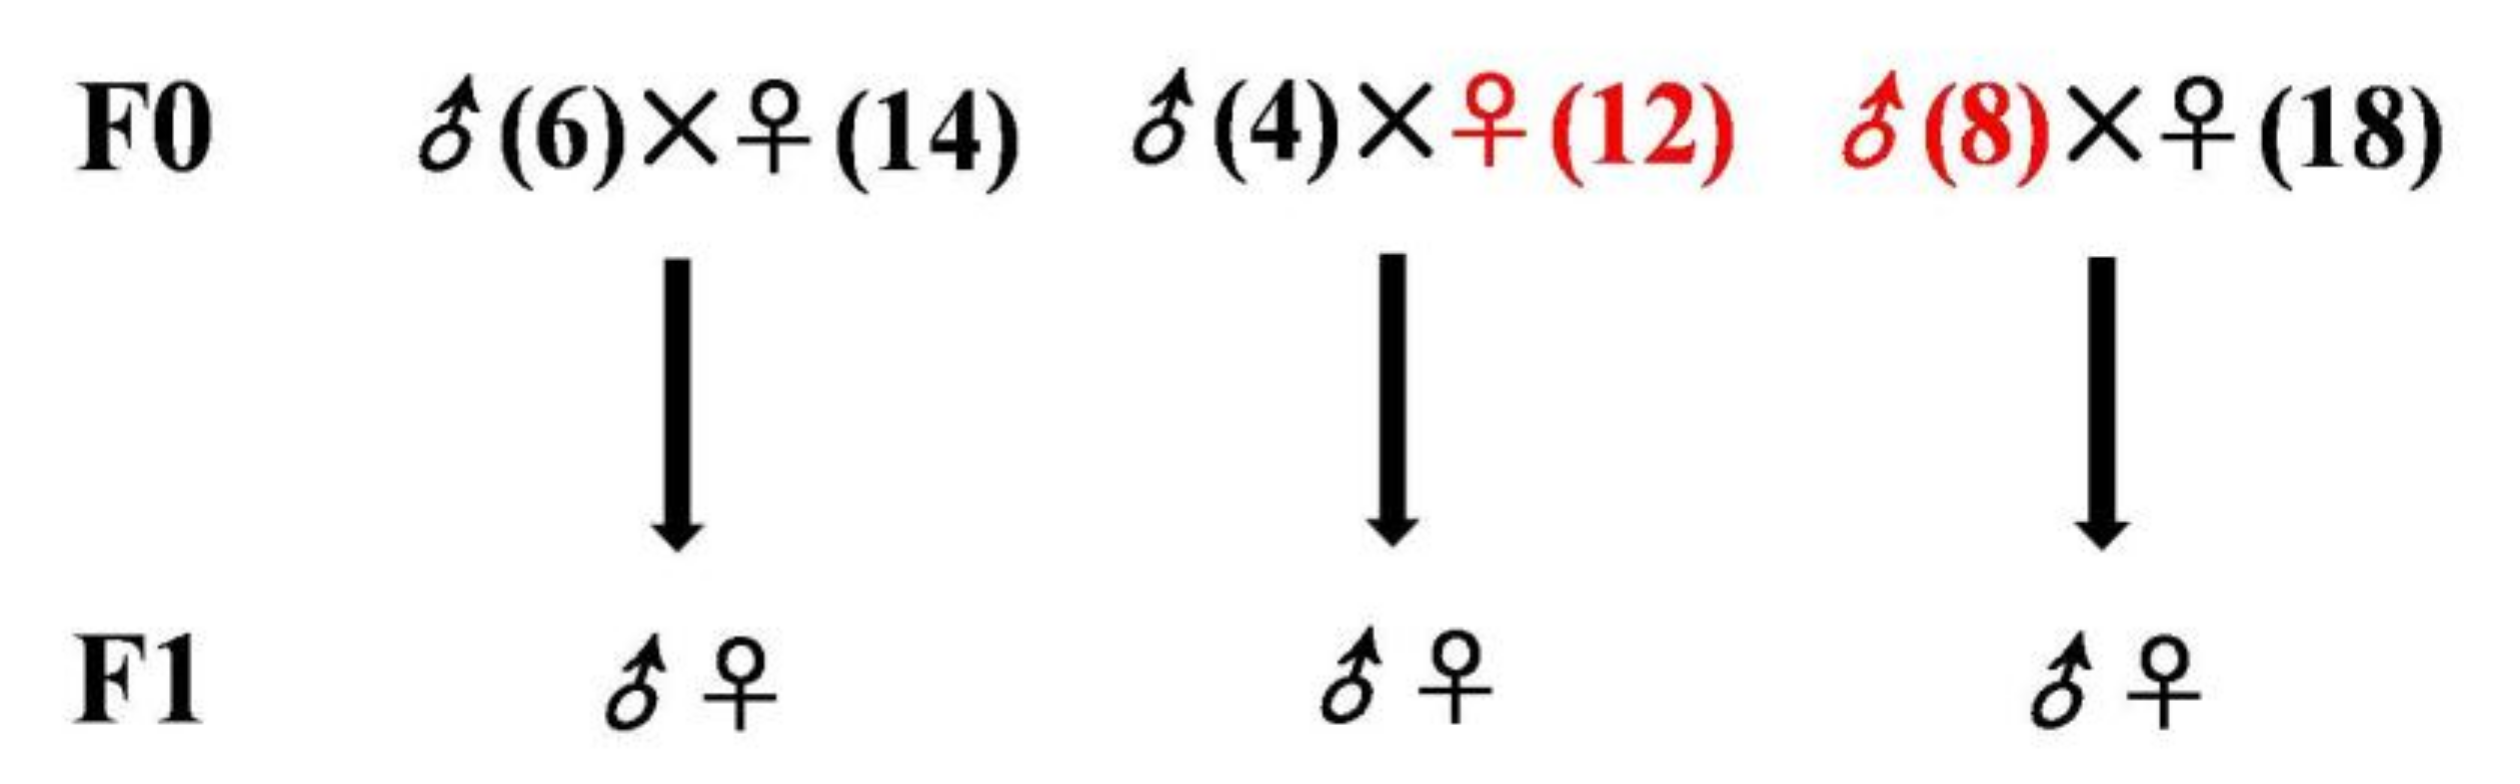
2.3. Birds for Analysis of the Fatty Liver Inheritance Pattern
2.4. Sample Collection
2.5. Serum Indices and Histology
2.6. Assessment of Fatty Liver
2.7. RNA Extraction and Sequencing
2.8. Differential Expression Analysis
2.9. Functional Enrichment Analysis of Differentially Expressed Genes
2.10. Quantitative Real-Time PCR
2.11. Statistical Analysis
3. Results
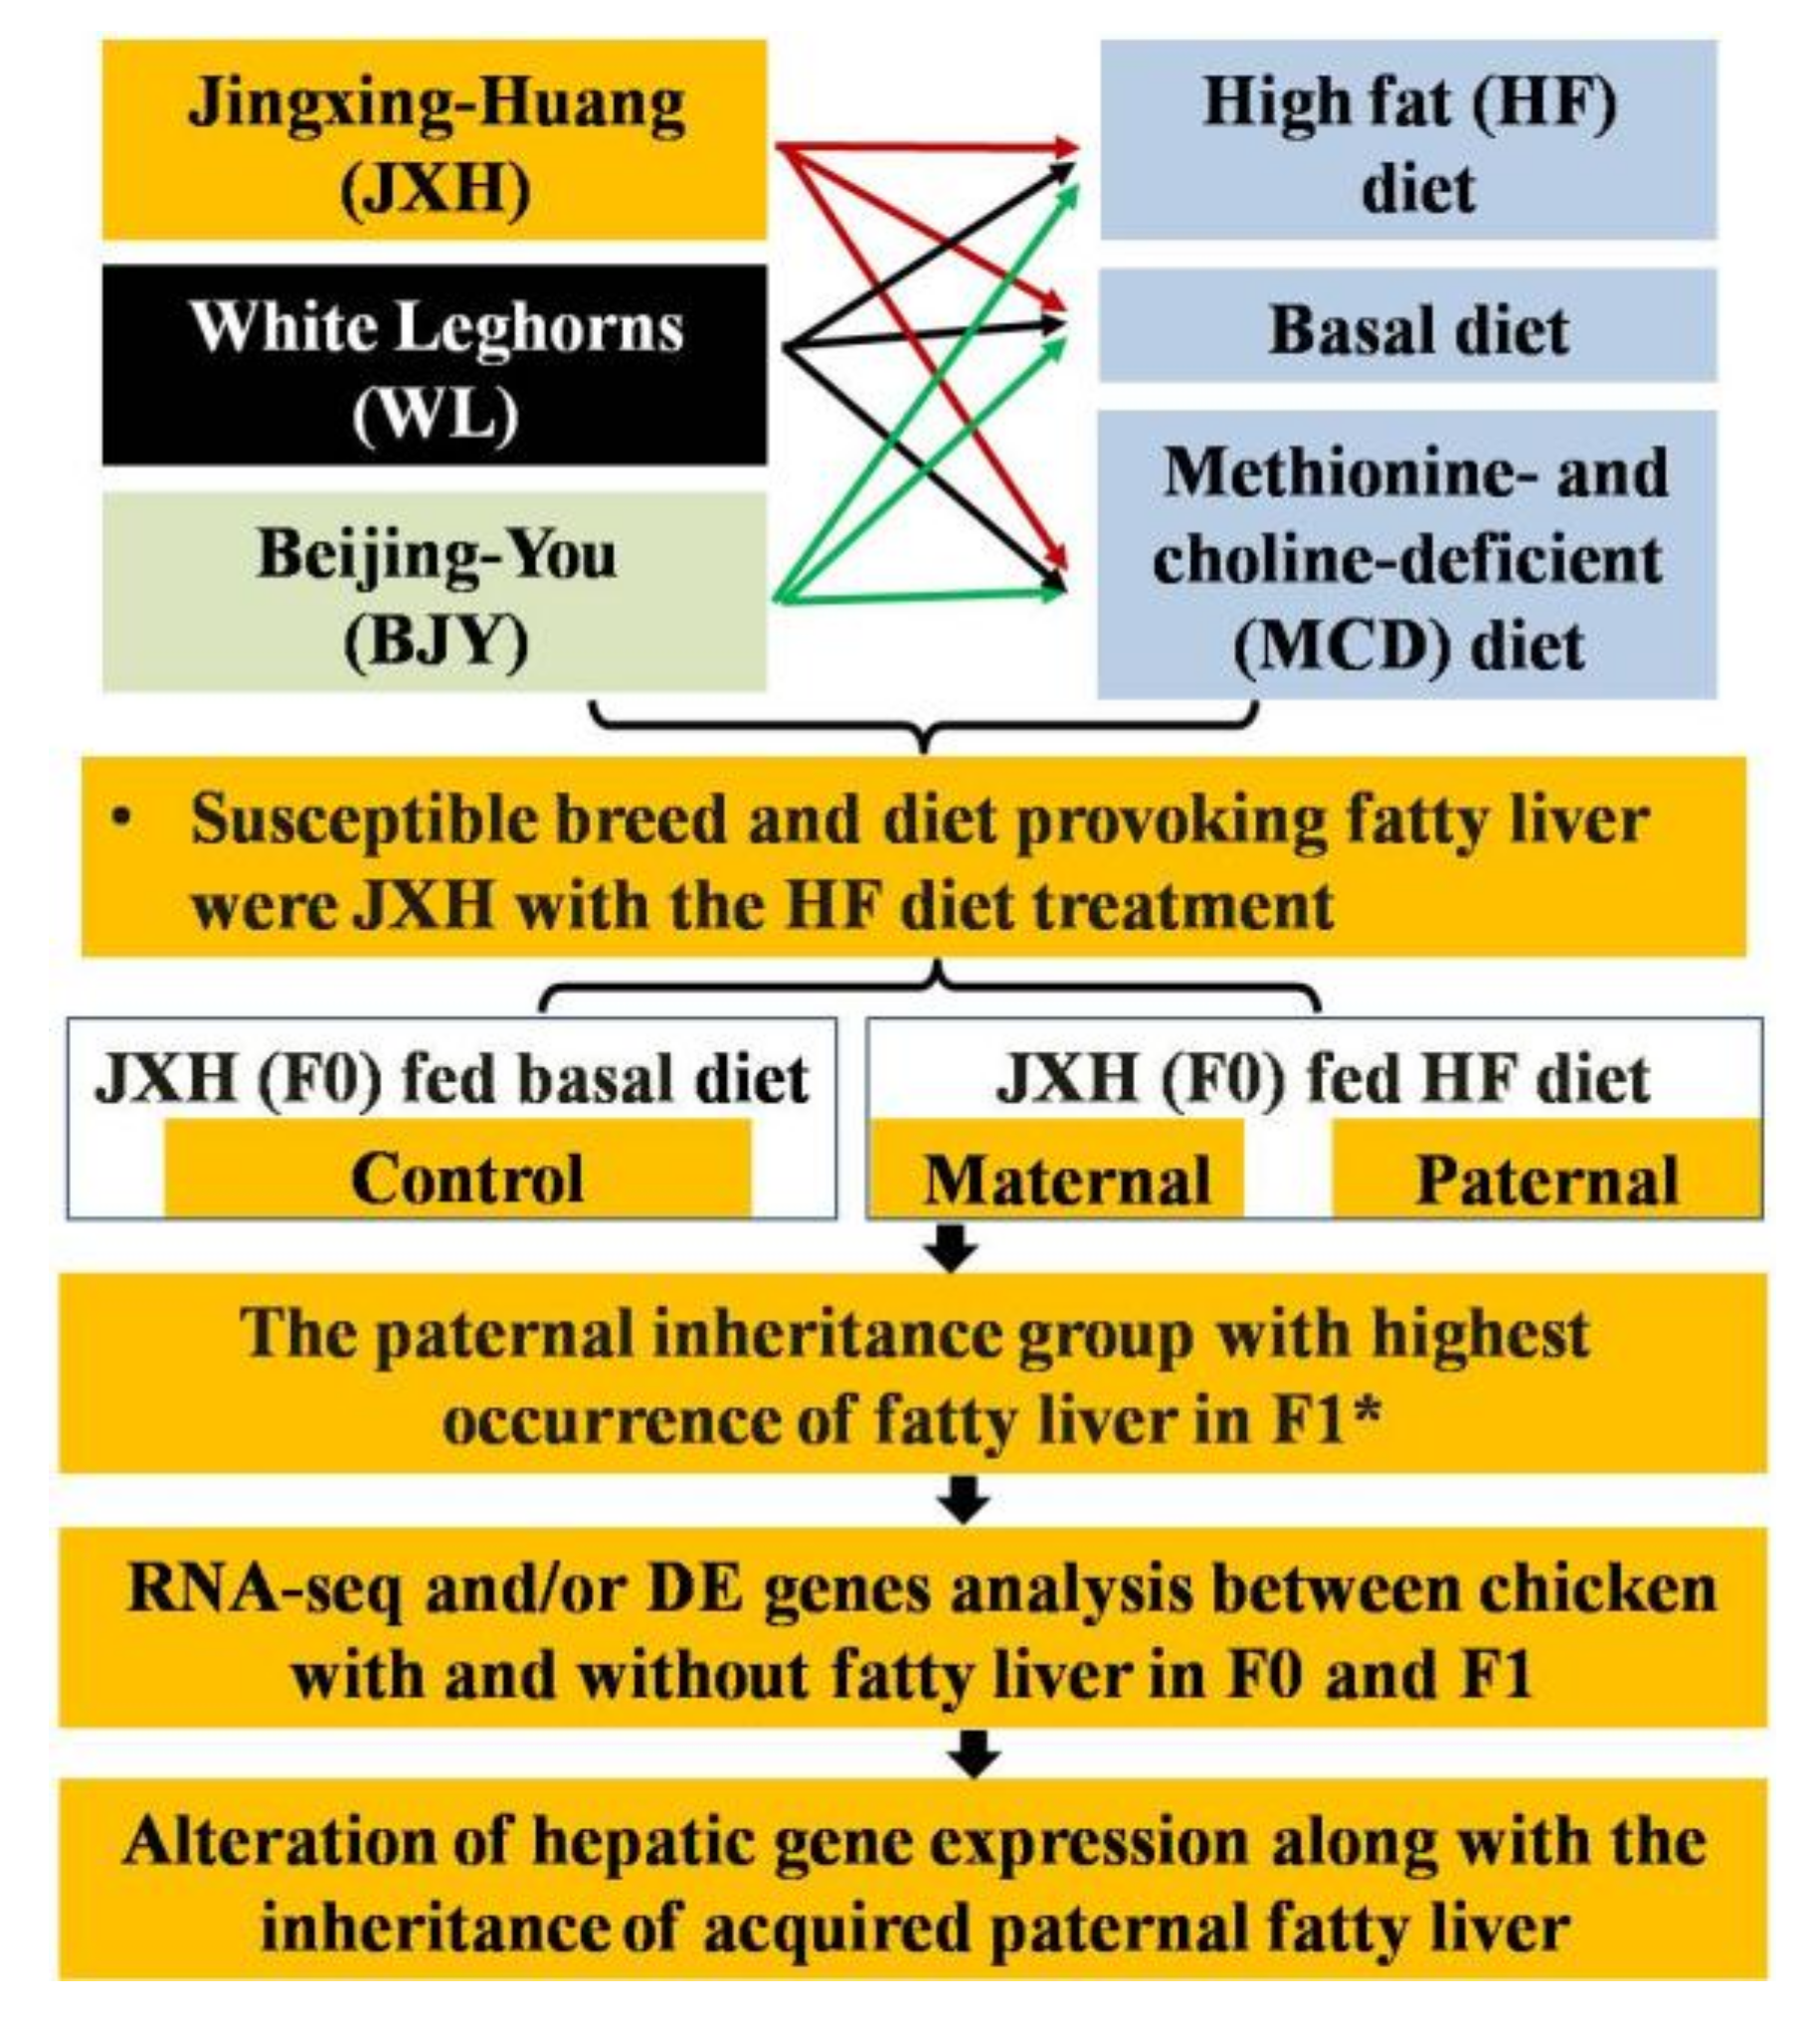
3.1. Identification of the Most Susceptible Breed and Diet Causing Fatty Liver
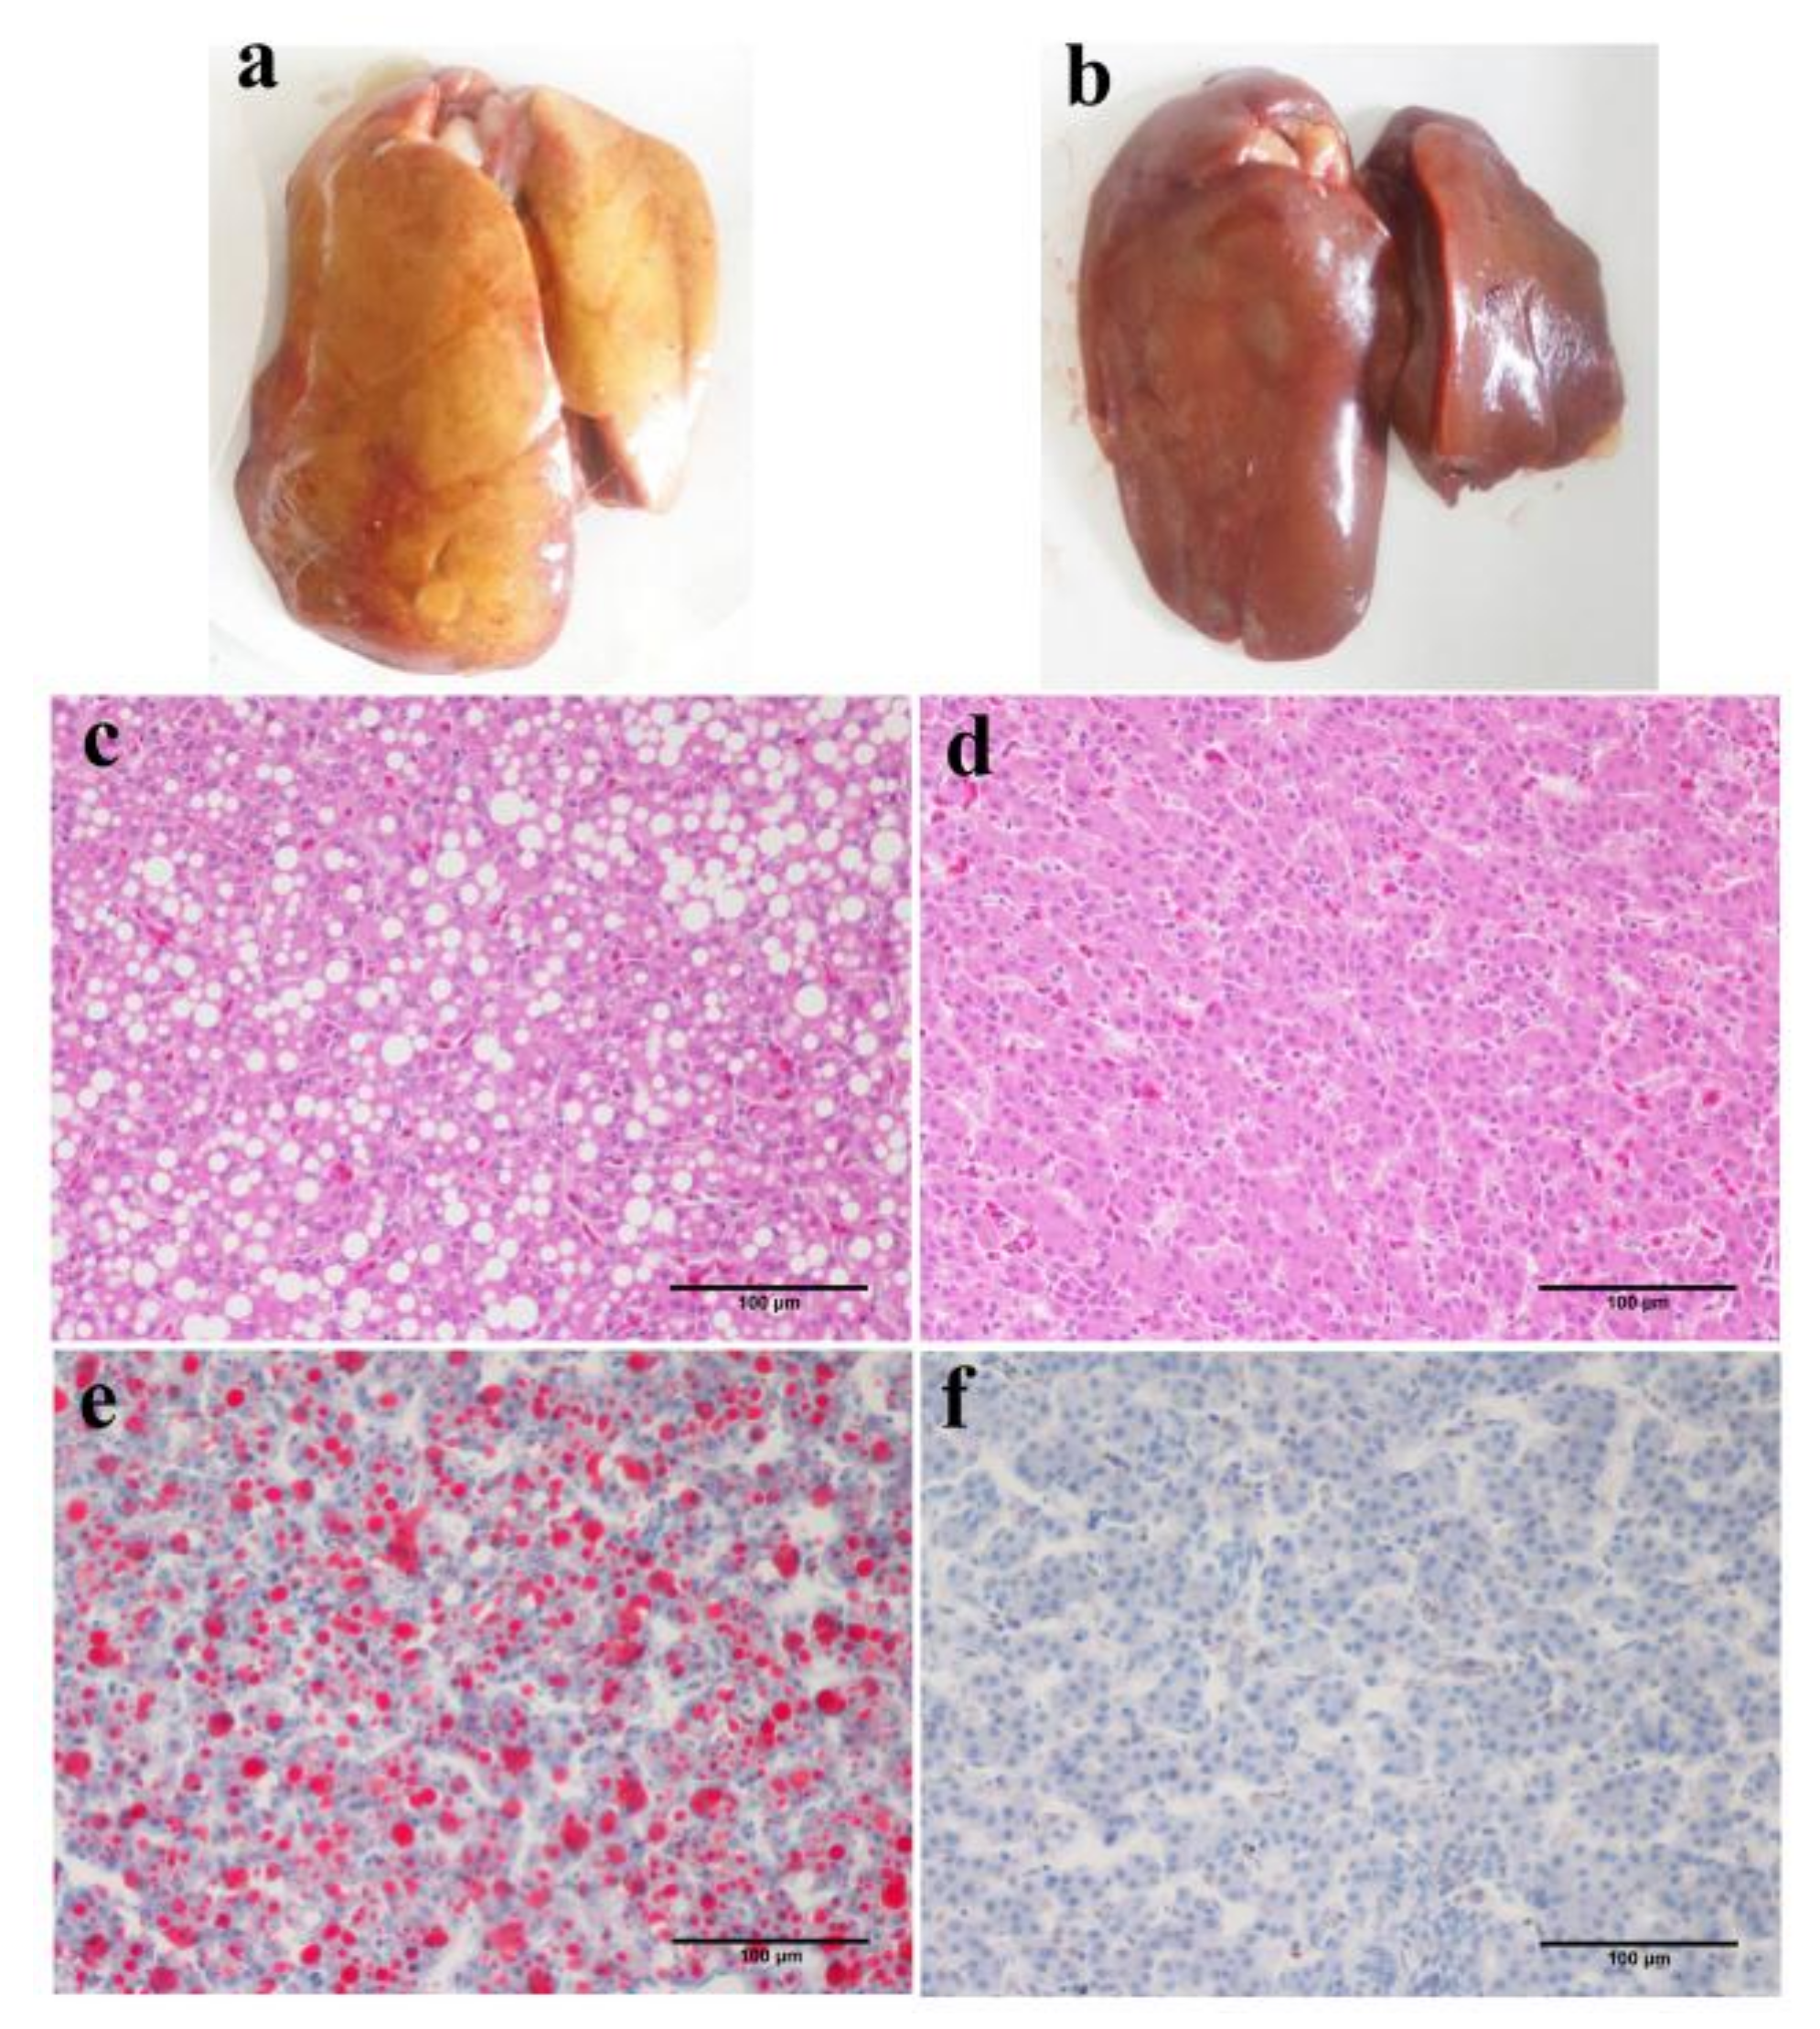
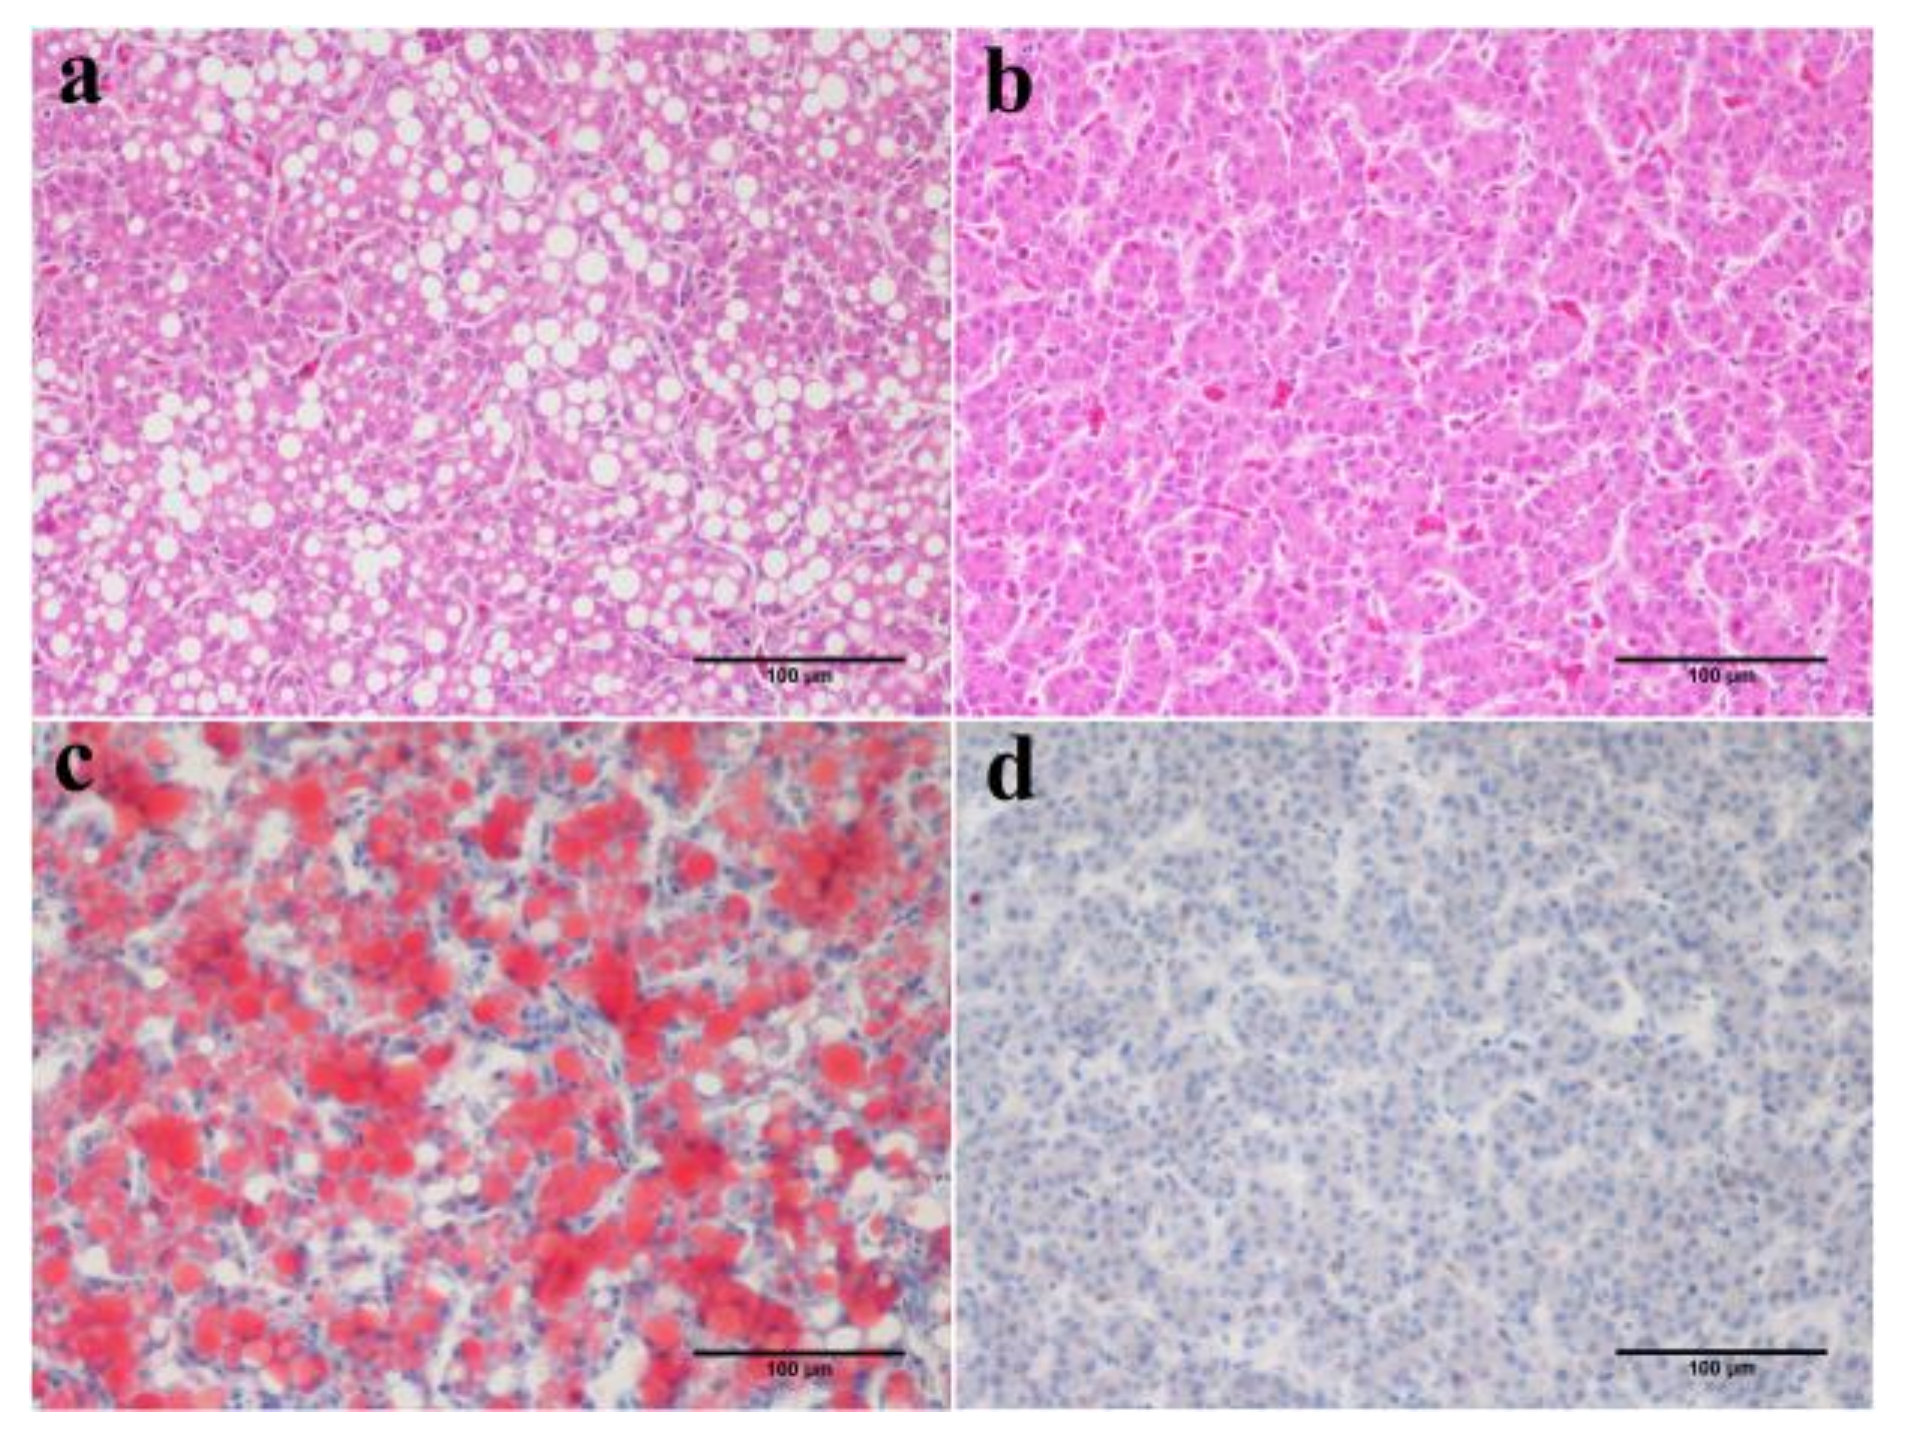
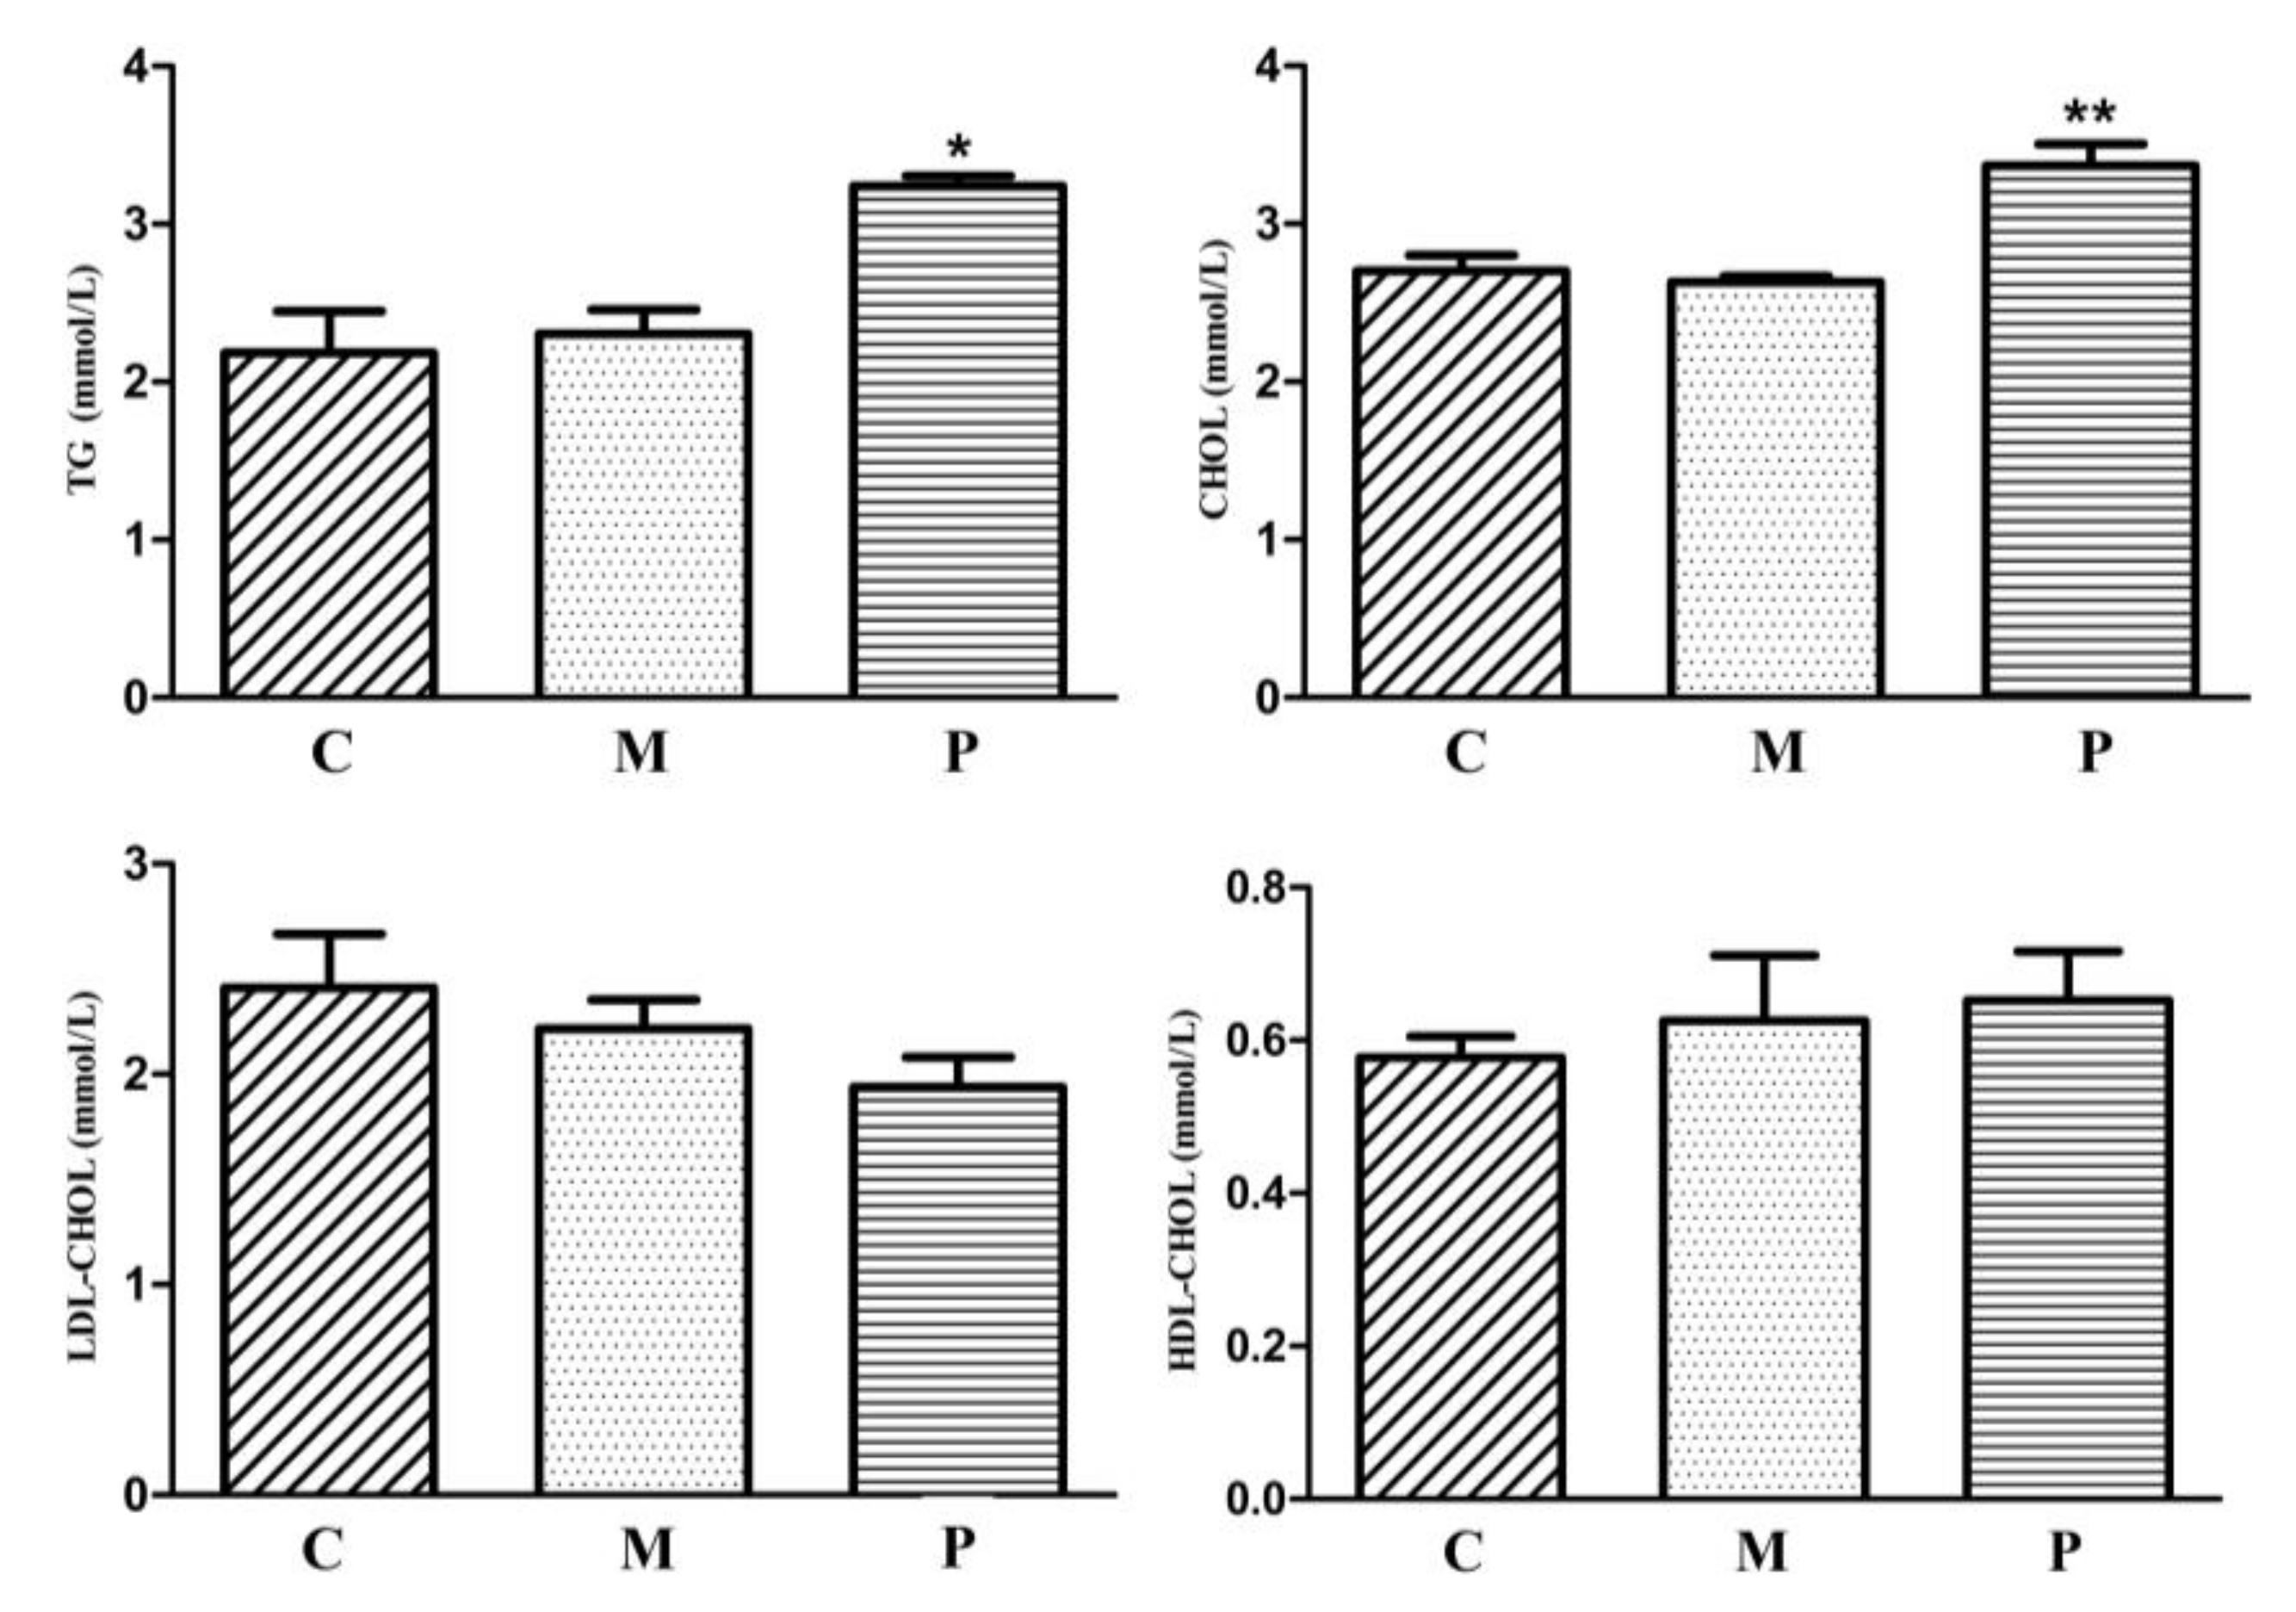
3.2. Characteristics of Inherited Phenotype of Acquired Fatty LiverInduced by High Fat Diet in Jingxing-Huang Chickens
3.3. Differencein Hepatic Gene Expression Profiles between F1 Chickens with and without Fatty Liver
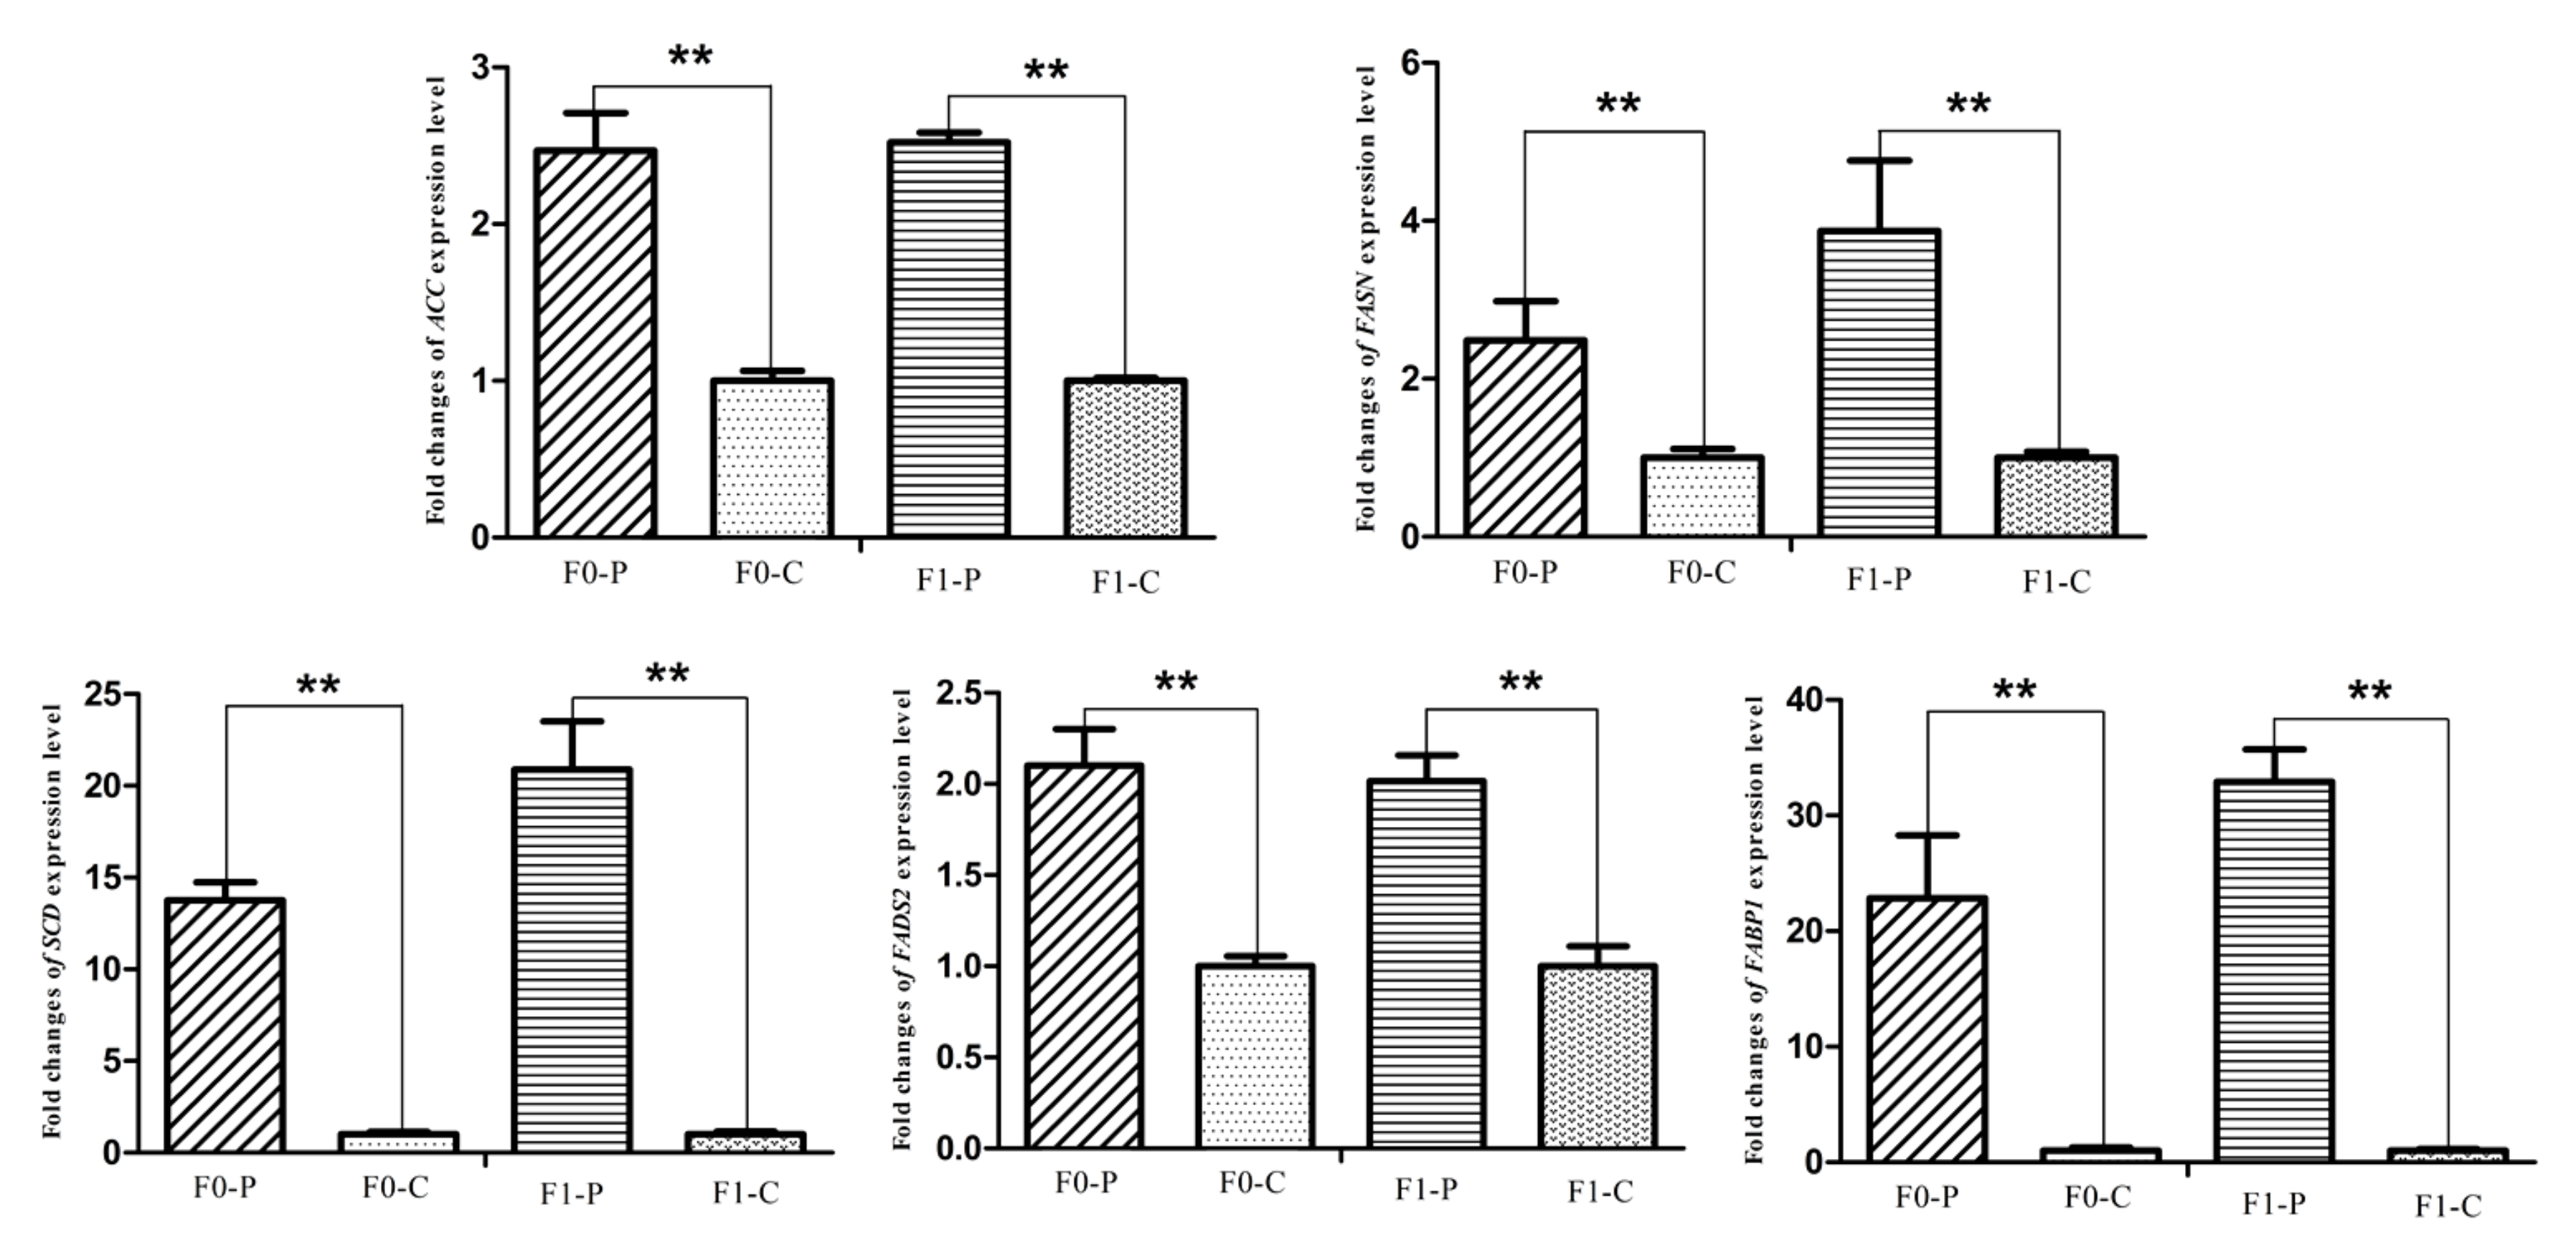
3.4. Alteration of the Key Gene Expression along with the Inherited Phenotype of Acquired Paternal Fatty Liver
4. Discussion and Conclusions
Supplementary Materials
Acknowledgments
Author Contributions
Conflicts of Interest
References
- Wolford, J.H.; Polin, D. Lipid accumulation and hemorrhage in livers of laying chickens. A study on fatty liver-hemorrhagic syndrome (FLHS). Poult. Sci. 1972, 51, 1707–1713. [Google Scholar] [CrossRef] [PubMed]
- Wolford, J.H.; Polin, D. Induced fatty liver-hemorrhagic syndrome (FLHS) and accumulation of hepatic lipid in force-fed laying chickens. Poult. Sci. 1974, 53, 65–74. [Google Scholar] [CrossRef] [PubMed]
- Polin, D.; Wolford, J.H. Role of estrogen as a cause of fatty liver hemorrhagic syndrome. J. Nutr. 1977, 107, 873–886. [Google Scholar] [CrossRef] [PubMed]
- Thomson, A.E.; Gentry, P.A.; Squires, E.J. Comparison of the coagulation profile of fatty liver haemorrhagic syndrome-susceptible laying hens and normal laying hens. Br. Poult. Sci. 2003, 44, 626–633. [Google Scholar] [CrossRef] [PubMed]
- Liu, Z.; Li, Q.H.; Liu, R.R.; Zhao, G.P.; Zhang, Y.H.; Zheng, M.Q.; Cui, H.X.; Li, P.; Cui, X.Y.; Liu, J.; et al. Expression and methylation of microsomal triglyceride transfer protein and acetyl-CoA carboxylase are associated with fatty liver syndrome in chicken. Poult. Sci. 2016, 95, 1387–1395. [Google Scholar] [CrossRef] [PubMed]
- Trott, K.A.; Giannitti, F.; Rimoldi, G.; Hill, A.; Woods, L.; Barr, B.; Anderson, M.; Mete, A. Fatty liver hemorrhagic syndrome in the backyard chicken: A retrospective histopathologic case series. Vet. Pathol. 2014, 51, 787–795. [Google Scholar] [CrossRef] [PubMed]
- Butler, E.J. Fatty liver diseases in the domestic fowl—A review. Avian Pathol. 1976, 5, 1–14. [Google Scholar] [CrossRef] [PubMed]
- Burdge, G.C.; Lillycrop, K.A. Fatty acids and epigenetics. Curr. Opin. Clin. Nutr. Metab. Care 2014, 17, 156–161. [Google Scholar] [CrossRef] [PubMed]
- Ferreira, D.M.; Simao, A.L.; Rodrigues, C.M.; Castro, R.E. Revisiting the metabolic syndrome and paving the way for microRNAs in non-alcoholic fatty liver disease. FEBS J. 2014, 281, 2503–2524. [Google Scholar] [CrossRef] [PubMed]
- McCarty, R. Cross-fostering: Elucidating the effects of gene × environment interactions on phenotypic development. Neurosci. Biobehav. Rev. 2017, 73, 219–254. [Google Scholar] [CrossRef] [PubMed]
- Huang, T.; Hu, F.B. Gene-environment interactions and obesity: Recent developments and future directions. BMC Med. Genom. 2015, 8 (Suppl. S1), S2. [Google Scholar] [CrossRef] [PubMed]
- Ansen-Wilson, L.J.; Lipinski, R.J. Gene-environment interactions in cortical interneuron development and dysfunction: A review of preclinical studies. Neurotoxicology 2017, 58, 120–129. [Google Scholar] [CrossRef]
- Rozenboim, I.; Mahato, J.; Cohen, N.A.; Tirosh, O. Low protein and high-energy diet: A possible natural cause of fatty liver hemorrhagic syndrome in caged White Leghorn laying hens. Poult. Sci. 2016, 95, 612–621. [Google Scholar] [CrossRef] [PubMed]
- Cooke, R.F.; Rio, N.S.D.; Caraviello, D.Z.; Bertics, S.J.; Ramos, M.H.; Grummer, R.R. Supplemental choline for prevention and alleviation of fatty liver in dairy cattle. J. Dairy Sci. 2007, 90, 2413–2418. [Google Scholar] [CrossRef] [PubMed]
- Whitehead, C.C.; Randall, C.J. Interrelationships between biotin; choline and other B-vitamins and the occurrence of fatty liver and kidney syndrome and sudden death syndrome in broiler chickens. Br. J. Nutr. 1982, 48, 177–184. [Google Scholar] [CrossRef] [PubMed]
- Pogribny, I.P.; Tryndyak, V.P.; Bagnyukova, T.V.; Melnyk, S.; Montgomery, B.; Ross, S.A.; Latendresse, J.R.; Rusyn, I.; Beland, F.A. Hepatic epigenetic phenotype predetermines individual susceptibility to hepatic steatosis in mice fed a lipogenic methyl-deficient diet. J. Hepatol. 2009, 51, 176–186. [Google Scholar] [CrossRef] [PubMed]
- Tsuchiya, M.; Ji, C.; Kosyk, O.; Shymonyak, S.; Melnyk, S.; Kono, H.; Tryndyak, V.; Muskhelishvili, L.; Pogribny, I.P.; Kaplowitz, N.; et al. Interstrain differences in liver injury and one-carbon metabolism in alcohol-fed mice. Hepatology 2012, 56, 130–139. [Google Scholar] [CrossRef] [PubMed]
- Tryndyak, V.; de Conti, A.; Kobets, T.; Kutanzi, K.; Koturbash, I.; Han, T.; Fuscoe, J.C.; Latendresse, J.R.; Melnyk, S.; Shymonyak, S.; et al. Interstrain differences in the severity of liver injury induced by a choline- and folate-deficient diet in mice are associated with dysregulation of genes involved in lipid metabolism. FASEB J. 2012, 26, 4592–4602. [Google Scholar] [CrossRef] [PubMed]
- Cropley, J.E.; Eaton, S.A.; Aiken, A.; Young, P.E.; Giannoulatou, E.; Ho, J.W.; Buckland, M.E.; Keam, S.P.; Hutvagner, G.; Humphreys, D.T.; et al. Male-lineage transmission of an acquired metabolic phenotype induced by grand-paternal obesity. Mol. Metab. 2016, 5, 699–708. [Google Scholar] [CrossRef] [PubMed]
- Choi, C.S.; Gonzales, E.L.; Kim, K.C.; Yang, S.M.; Kim, J.W.; Mabunga, D.F.; Cheong, J.H.; Han, S.H.; Bahn, G.H.; Shin, C.Y. The transgenerational inheritance of autism-like phenotypes in mice exposed to valproic acid during pregnancy. Sci. Rep. 2016, 6, 36250. [Google Scholar] [CrossRef] [PubMed]
- Yuan, T.F.; Li, A.; Sun, X.; Ouyang, H.; Campos, C.; Rocha, N.B.; Arias-Carrión, O.; Machado, S.; Hou, G.; So, K.F. Transgenerational inheritance of paternal neurobehavioral phenotypes, stress, addiction, ageing and metabolism. Mol. Neurobiol. 2016, 53, 6367–6376. [Google Scholar] [CrossRef] [PubMed]
- Feeney, A.; Nilsson, E.; Skinner, M.K. Epigenetics and transgenerational inheritance in domesticated farm animals. J. Anim. Sci. Biotechnol. 2014, 5, 48. [Google Scholar] [CrossRef] [PubMed]
- Wei, Y.; Yang, C.R.; Wei, Y.P.; Zhao, Z.A.; Hou, Y.; Schatten, H.; Sun, Q.Y. Paternally induced transgenerational inheritance of susceptibility to diabetes in mammals. Proc. Natl. Acad. Sci. USA 2014, 111, 1873–1878. [Google Scholar] [CrossRef] [PubMed]
- Bruce, K.D.; Cagampang, F.R.; Argenton, M.; Zhang, J.; Ethirajan, P.L.; Burdge, G.C.; Bateman, A.C.; Clough, G.F.; Poston, L.; Hanson, M.A.; et al. Maternal high-fat feeding primes steatohepatitis in adult mice offspring, involving mitochondrial dysfunction and altered lipogenesis gene expression. Hepatology 2009, 50, 1796–1808. [Google Scholar] [CrossRef] [PubMed]
- NRC. Nutrient Requirements of Poultry; National Academy Press: Washington, DC, USA, 1994. [Google Scholar]
- Wen, J.; Cai, H.Y.; Guo, Y.M.; Qi, G.H.; Chen, J.L.; Zhang, G.Z.; Liu, G.H.; Xiong, B.H.; Su, J.S.; Ji, C.; et al. Feeding Standard of Chicken; Ministry of Agriculture of the People’s Republic of China: Beijing, China, 2004.
- Joshi, N.A.; Fass, J.N. Sickle: A Sliding-Window, Adaptive, Quality-Based Trimming Tool for Fastq Files (Version 1.33). Available online: https://github.com/najoshi/sickle (accessed on 21 December 2017).
- GitHub. Available online: https://github.com/jstjohn/SeqPrep (accessed on 21 December 2017).
- KEGG: Kyoto Encyclopedia of Genes and Genomes. Available online: http://www.kegg.jp (accessed on 21 December 2017).
- Huang, D.W.; Sherman, B.T.; Lempicki, R.A. Bioinformatics enrichment tools: Paths toward the comprehensive functional analysis of large gene lists. Nucleic Acids Res. 2009, 37, 1–13. [Google Scholar] [CrossRef] [PubMed]
- Livak, K.J.; Schmittgen, T.D. Analysis of relative gene expression data using real-time quantitative PCR and 2−ΔΔCT method. Methods 2001, 25, 402–408. [Google Scholar] [CrossRef] [PubMed]
- Touchburn, S.P.; Guillaume, J.; Leclercq, B.; Blum, J.C. Lipid and energy metabolism in chicks affected by dwarfism (DW) and Naked-neck (NA). Poult. Sci. 1980, 59, 2189–2197. [Google Scholar] [CrossRef] [PubMed]
- Polin, D.; Wolford, J.H. Various types of diets; sources of energy; and positive energy balance in the production of fatty liver hemorrhagic syndrome. Poult. Sci. 1976, 55, 325–334. [Google Scholar] [CrossRef] [PubMed]
- Cui, H. Etiology and prevention of fatty liver hemorrhagic syndrome in egg laying hens. Chin. J. Anim. Sci. 2009, 45, 57–59. [Google Scholar]
- Kong, X.F.; Liu, B.; Wang, X.L. Fatty liver hemorrhagic syndrome in laying hens. Chin. J. Vet. Med. 2003, 39, 32–35. [Google Scholar]
- Dudley, K.J.; Sloboda, D.M.; Connor, K.L.; Beltrand, J.; Vickers, M.H. Offspring of mothers fed a high fat diet display hepatic cell cycle inhibition and associated changes in gene expression and DNA methylation. PLoS ONE 2011, 6, e21662. [Google Scholar] [CrossRef] [PubMed]
- Chen, Q.; Yan, M.; Cao, Z.; Li, X.; Zhang, Y.; Shi, J.; Feng, G.H.; Peng, H.; Zhang, X.; Zhang, Y.; et al. Sperm tsRNAs contribute to intergenerational inheritance of an acquired metabolic disorder. Science 2016, 351, 397–400. [Google Scholar] [CrossRef] [PubMed]
- Migicovsky, Z.; Kovalchuk, I. Epigenetic memory in mammals. Front. Genet. 2011, 2, 28. [Google Scholar] [CrossRef] [PubMed]
- Guibert, S.; Forné, T.; Weber, M. Global profiling of DNA methylation erasure in mouse primordial germ cells. Genome Res. 2012, 22, 633–641. [Google Scholar] [CrossRef] [PubMed]


| Items | Basal Diet | HF Diet | MCD Diet |
|---|---|---|---|
| Ingredients | |||
| Corn | 70.10 | 62.59 | 70.10 |
| Soybean meal | 22.60 | 20.11 | 22.60 |
| DL-methionion | 0.17 | 0.17 | 0 |
| L-lysine | 0.05 | 0.05 | 0.05 |
| CaHPO4·2H2O | 1.50 | 1.50 | 1.50 |
| NaCl | 0.28 | 0.28 | 0.28 |
| Limestone | 4.30 | 4.30 | 4.47 |
| 1% premix 1 | 1.00 | 1.00 | 1.00 |
| Sheep fat | 0 | 10 | 0 |
| Total | 100 | 100 | 100 |
| Nutrient levels 2 | |||
| GE 3, MJ/kg 4 | 18.29 | 20.32 | 18.09 |
| CP 5 | 15.93 | 14.59 | 15.43 |
| Lys | 0.79 | 0.74 | 0.80 |
| Met | 0.30 | 0.32 | 0.18 |
| Ca 6 | 7.24 | 5.76 | 8.79 |
| TP 7 | 0.47 | 0.40 | 0.44 |
| Choline, mg/kg | 1022 | 886 | 613 |
| Items | 1–17 Week | 18–36 Week | ||||
|---|---|---|---|---|---|---|
| Control | Maternal | Paternal | Control | Maternal | Paternal | |
| F0 | Basal diet | Basal diet | HF diet | HF diet | ||
| F1 | Basal diet | |||||
| Gene | Accession Number | Primer Sequence | Annealing Temperature, °C | Product Size (bp) |
|---|---|---|---|---|
| ACACA | NM_205505.1 | F:5′-AATGGCAGCTTTGGAGGTGT-3′ | 60 | 136 |
| R:5′-TCTGTTTGGGTGGGAGGTG-3′ | ||||
| FASN | NM_205155.2 | F:5′-CTATCGACACAGCCTGCTCCT-3′ | 62 | 107 |
| R:5′-CAGAATGTTGACCCCTCCTACC-3′ | ||||
| ISR4 | XM_003641084.3 | F:5′-GCAAGAAGGGAGTGGAAGGTA-3′ | 62 | 121 |
| R:5′-GCTGGAAGAAACGCTGATAGG-3′ | ||||
| ME1 | NM_204303.1 | F:5′-GCCAGCATTACGGTTTAGCAT-3′ | 58.5 | 90 |
| R:5′-CCATAACAGCCAAGGTCTCCA-3′ | ||||
| SCD | NM_204890.1 | F:5′-GGCTGACAAAGTGGTGATG-3′ | 60 | 137 |
| R:5′-GGATGGCTGGAATGAAGA-3′ | ||||
| ACSL5 | NM_001031237.1 | F:5′-TTCTCACCGCTCCCAACAC-3′ | 60 | 147 |
| F:5′-TCTTCTGGCTCCTCCCTCAA-3′ | ||||
| FADS2 | NM_001160428.2 | F:5′-CTGAGGAAGACAGCAGAGGACAT-3′ | 60 | 153 |
| R:5′-GCAGGCAAGGATTAGAGTTGTG-3′ | ||||
| FABP1 | NM_204192.3 | F:5′-GGGGAAGAGTGTGAGATGGA-3′ | 58 | 120 |
| R:5′-GTTGAGTTCGGTCACGGATT-3′ | ||||
| APOA4 | NM_204938.2 | F:5′-TCCTCTTGGTGCTCCTGGCTGTG-3′ | 61 | 197 |
| R:5′-GGCGTATGAGTTTGCGCTCTGC-3′ | ||||
| β-actin | NM_205518.1 | R:5′-GAGAAATTGTGCGTGACATCA-3′ | 60 | 152 |
| R:5′-CCTGAACCTCTCATTGCCA-3′ |
| Diet Type | Breed | ||
|---|---|---|---|
| JXH | WL | BJY | |
| Basal diet | 25.00%, 8/32 | 16.67%, 5/30 | 16.67%, 5/30 |
| HF diet | 41.94%, 13/31 | 33.33%, 10/30 | 33.33%, 10/30 |
| MCD diet | 38.71%, 12/31 | 16.67%, 5/30 | 33.33%, 10/30 |
| Items | Control | Maternal Inheritance | Paternal Inheritance |
|---|---|---|---|
| No. of chicken observed | 80 | 105 | 82 |
| Rate for the fatty liver incidence | 18.75% | 20.00% | 41.50% |
| Sample | Raw Reads | Clean Reads | Clean Bases, G | Q30, % |
|---|---|---|---|---|
| P_R1 | 28,754,076 | 27,836,516 | 4.18 | 92.40 |
| P_R2 | 27,305,304 | 26,376,696 | 3.96 | 91.81 |
| P_R3 | 27,879,606 | 27,252,200 | 4.09 | 93.24 |
| C_R1 | 28,237,546 | 27,601,240 | 4.14 | 93.23 |
| C_R2 | 26,136,280 | 25,521,394 | 3.83 | 92.95 |
| C_R3 | 24,399,658 | 23,784,022 | 3.57 | 92.47 |
© 2018 by the authors. Licensee MDPI, Basel, Switzerland. This article is an open access article distributed under the terms and conditions of the Creative Commons Attribution (CC BY) license (http://creativecommons.org/licenses/by/4.0/).
Share and Cite
Zhang, Y.; Liu, Z.; Liu, R.; Wang, J.; Zheng, M.; Li, Q.; Cui, H.; Zhao, G.; Wen, J. Alteration of Hepatic Gene Expression along with the Inherited Phenotype of Acquired Fatty Liver in Chicken. Genes 2018, 9, 199. https://doi.org/10.3390/genes9040199
Zhang Y, Liu Z, Liu R, Wang J, Zheng M, Li Q, Cui H, Zhao G, Wen J. Alteration of Hepatic Gene Expression along with the Inherited Phenotype of Acquired Fatty Liver in Chicken. Genes. 2018; 9(4):199. https://doi.org/10.3390/genes9040199
Chicago/Turabian StyleZhang, Yonghong, Zhen Liu, Ranran Liu, Jie Wang, Maiqing Zheng, Qinghe Li, Huanxian Cui, Guiping Zhao, and Jie Wen. 2018. "Alteration of Hepatic Gene Expression along with the Inherited Phenotype of Acquired Fatty Liver in Chicken" Genes 9, no. 4: 199. https://doi.org/10.3390/genes9040199
APA StyleZhang, Y., Liu, Z., Liu, R., Wang, J., Zheng, M., Li, Q., Cui, H., Zhao, G., & Wen, J. (2018). Alteration of Hepatic Gene Expression along with the Inherited Phenotype of Acquired Fatty Liver in Chicken. Genes, 9(4), 199. https://doi.org/10.3390/genes9040199