Article

Altered Transcriptional Regulation of Glycolysis in Circulating CD8+ T Cells of Rheumatoid Arthritis Patients

1
Institute of Bioinformatics and Applied Biotechnology, Bangalore 560100, Karnataka, India
2
Manipal Academy of Higher Education, Manipal 576104, Karnataka, India
3
The Edu Bio LLC, 2222 W. Grand River Ave, STE A, Okemos, MI 48864, USA
*
Author to whom correspondence should be addressed.
Genes 2022, 13(7), 1216; https://doi.org/10.3390/genes13071216
Submission received: 7 April 2022 / Revised: 1 July 2022 / Accepted: 4 July 2022 / Published: 7 July 2022
(This article belongs to the Special Issue Bioinformatic Analysis of NGS Data)

Abstract

:
Peripheral T lymphocytes of rheumatoid arthritis (RA) patients show pathological changes in their metabolic pathways, especially glycolysis. These changes may drive the increased proliferation and tissue invasiveness of RA T cells. In order to study the transcriptional regulation underlying these alterations, we analysed publicly available RNA sequencing data from circulating T lymphocyte subsets of healthy individuals, untreated RA patients, and patients undergoing treatment for RA. Differential co-expression networks were created using sample-wise edge weights from an analysis called “linear interpolation to obtain network estimates for single sample” (lionessR), and annotated using the Gene Transcription Regulation Database (GTRD). Genes with high centrality scores were identified. CD8+ effector memory cells (Tem) and CD8+CD45RA+ effector memory cells (Temra) showed large changes in the transcriptional regulation of glycolysis in untreated RA. PFKFB3 and GAPDH were differentially regulated and had high centrality scores in CD8+ Tem cells. PFKFB3 downregulation may be due to HIF1A post transcriptional inhibition. Tocilizumab treatment partially reversed the RA-associated differential expression of several metabolic and regulatory genes. MYC was upregulated and had high centrality scores in RA CD8+ Temra cells; however, its glycolysis targets were unaltered. The upregulation of the PI3K-AKT and mTOR pathways may explain MYC upregulation.

Graphical Abstract

1. Introduction

T lymphocytes are major players in the inflammatory autoimmune disease rheumatoid arthritis (RA). RA is characterised by painful inflammation of usually small joints, where the synovial tissue lining the joints becomes hyperplastic and invades the underlying cartilage. Patients with RA show manifestations in the blood several years before there are any symptoms in the joints [1]. This is known as the pre-clinical stage of RA.
The shift from pre-clinical stage with circulating auto-antibodies to clinical synovitis is marked by changes in T cell populations in the blood. The reduction in naive CD4+ T cells and regulatory T cells (T reg) and the appearance of an abnormal T cells subset named inflammation-related cells (IRC) are predictive of progression to synovial [2]. A defective differentiation process of naive CD4+ T cells results in the production of short-lived effector cells (SLEC) instead of long-lived memory precursor cells. The SLEC are highly proliferative and invade the synovial tissue, causing synovitis. This pathological differentiation is thought to be caused by defects in DNA repair and cellular metabolism in the naive CD4+ T cells of susceptible patients [3]. While effector cell populations increase, regulatory T cell populations decrease in the peripheral blood [4,5]. They also become less effective.
The defects in T cell DNA repair mechanisms result in reduced telomere stability and the accumulation of errors in mitochondrial DNA. Damaged mitochondria lead to several changes in the metabolism of circulating RA T cells. In healthy individuals, naive T cells (Tn) primarily depend on mitochondrial fatty acid (FA) oxidation for energy. Upon activation, T cells need to rapidly proliferate. This sets up a large demand for energy and substrates for DNA synthesis, protein synthesis and membrane formation. In order to satisfy this demand, activated T cells shift their main energy source to glycolysis and oxidative phosphorylation. Even though glycolysis produces less ATP than oxidative phosphorylation, glycolysis and linked pathways such as the tricarboxylic acid (TCA) cycle and the pentose phosphate pathway (PPP) produce metabolites to be used as precursors in nucleic acid synthesis. Activated cells differentiate into various forms of effector cells based on extracellular signals and the availability of metabolic substrates. The cells eventually die or turn into memory cells, which are no longer proliferative, and use FA oxidation for [6]. FA oxidation, TCA cycle and oxidative phosphorylation are all mitochondrial pathways. It is evident that mitochondria are essential for metabolism during every stage of T cell differentiation. Thus, the effect of mitochondrial damage on T cell function is profound.
In the place of glycolysis and oxidative phosphorylation, circulating RA T cells use the pentose phosphate pathway. This leads to reduced pyruvate production and an increased production of NADPH. This, combined with reduced reactive oxygen species (ROS) production due to impaired oxidative phosphorylation, sets up a reducing environment within the T cell. ROS are required for intracellular signalling, including for the activation of the repair enzyme Ataxia Telangiectasia Mutated (ATM). These changes to signalling create a pro-inflammatory phenotype for the T cell even before they enter the synovium [7].
The other change associated with reduced mitochondrial function is linked to the TCA cycle and FA oxidation, both of which occur in the mitochondria. TCA cycle utilises acetyl CoA. In the context of reduced TCA cycle, the acetyl CoA is diverted to fatty acid synthesis that occurs in the cytosol. At the same time, mitochondrial FA oxidation is reduced, and NADPH required for FA synthesis is generated by the upregulated pentose phosphate pathway. These three events give the cell an increased FA presence, which accumulates as lipid droplets. The excess lipids allow the cells to form extensive membrane structures, which enable them to invade tissues more easily. Thus, the disruption of mitochondrial function contributes to both the proliferative and tissue-invasive nature of SLECs present in the blood of RA [7].
These changes were demonstrated in CD4+ T cells in RA. CD8+ T cells appear to have a different program of metabolic regulation. Circulating CD8+ T cells in RA appear to have higher levels of aerobic glycolysis and lactate production than their healthy counterparts [8]. In contrast to CD4+ T cells, CD8+ T cells in RA had higher ROS production than healthy CD8+ T cells. The CD8+ T cells in RA peripheral blood were also more proliferative than their healthy counterparts and are able to induce a pro-inflammatory phenotype in B [8].
Therefore, it is evident that the aberrant metabolic program of CD4+ T cells contribute to the pathogenesis of RA. A similar relation between metabolism and increased synovitis may also exist for CD8+ T cells. This makes metabolism and the regulation of metabolism promising targets for therapy in RA.
The regulation underlying these altered metabolic patterns in CD4+ T cells is thought to be mediated by an increased ratio between the enzymes 6-Phosphofructo-2-Kinase/Fructose-2,6-Bisphosphatase 3 (PFKFB3) and glucose-6-phosphate-dehydrogenase (G6PD). PFKFB3 catalyses the synthesis of fructose 2,6 bisphosphate, an allosteric modulator of the glycolysis enzyme phosphofructokinase 1 (PFK1), while G6PD catalyses the first-rate limiting step of the pentose phosphate pathway, converting glucose 6-phosphate to 6-phosphogluconolactone. A decrease in the ratio between PFKFB3 and G6PD pushes the cells to the pentose phosphate pathway. In addition, the mechanistic target of the rapamycin complex 1 (mTORC1) pathway is activated due to reduced 5′ adenosine monophosphate-activated protein kinase (AMPK) signalling, resulting in increased anabolism. The roles of hypoxia-inducible factor 1-α (HIF1A) and MYC, which are responsible for the regulation of aerobic glycolysis in healthy T cells are not clear [3].
CD8+ T cells also showed increased mTORC1 activation due to reduced levels of the inhibitor Tuberous Sclerosis Complex 2 (TSC2) and PRKAA1(alpha1 sub unit of AMPK). They also have higher levels of the HIF1A mRNA as measured by a microarray, which is thought to be responsible for the increased expression of several glycolytic enzymes [8].
Although the metabolic pathways that affect circulating T cell function in RA have been explored, the transcriptional regulation of these genes are less understood. Since these cells show pathological changes outside of the affected synovial compartment, examination of the transcriptome of T cells isolated from the blood of RA patients may provide insights into the transcriptional regulation associated with metabolic changes. In order to do this, we planned to study any RNA sequencing data in peripheral blood T cells of RA patients submitted to open-source repositories. We studied the publicly available RNA sequencing data set GSE118829 from the Sequence Read Archive (SRA) [9]. The data set consisted of samples from seven T cell subsets of healthy, untreated and treated RA individuals. The details of the samples and T cell subsets are given in the methods section. Since glycolysis appears to be a major affected pathway in both CD4+ and CD8+ T cells, we decided to focus on the regulation of enzymes related to glycolysis. We identified differentially expressed genes (DEGs) in the glycolysis pathway and other pathways related to energy metabolism in the different T cell subsets of untreated RA individuals in comparison with healthy individuals. For the purpose of examining the relationship of these genes with transcription factors (TF), we annotated transcription factors in the data set using the database Gene Transcription Regulation Database (GTRD) [10] and glycolysis-related genes using the Kyoto Encyclopedia of Genes and Genomes (KEGG) pathway “Glycolysis/gluconeogenesis” [11]. We supplemented the KEGG pathway annotation with a literature search to identify transporters, enzymes controlling the concentration allosteric modifiers, post transcriptional modifiers and enzymes that affect the concentration of glycolysis metabolites. We finally created a list of genes which we called the “TF-glycolysis gene list”. We calculated single sample edge weights for gene pairs of this list using the R/Bioconductor package “lionessR” (linear interpolation to obtain network estimates for single samples), based on the correlation between their counts [12]. This method is described in detail in the Methods section.
For each T cell subset, we then identified those gene pairs that showed a significant difference in edge weights between the RA and healthy samples by performing a statistical test using a linear model in the “limma” package of R/Bioconductor [13]. Among the differentially co-expressed gene pairs, we retained those that were annotated by the GTRD database. We constructed a network of these genes for each T cell type and then performed a network analysis. In these networks, the nodes are genes, and the edges connect pairs of differentially co-expressed genes that are annotated by GTRD.
In each network, we finally chose those nodes that are common among the top ten nodes in each of the three centrality measures considered. The centrality measures and selection criteria are described in the Methods section. The DEGs were identified in these networks, and in the major metabolic pathways.
The target genes with high centrality measures can be considered as those genes whose transcriptional regulation changed in the RA condition. The TF neighbours of these genes are thus likely to be responsible for driving any RA-related change in the expression of glycolysis-related genes. Similarly, transcription factors with high centrality scores that also have links to important glycolysis-related genes may be central to these RA-related changes to the regulation of glycolysis.
Since the activity of metabolic pathways depends on several post transcriptional events such as localization, post-translational modifications, allosteric regulation, substrate availability, etc., this study was not able to measure these changes. However, to date, this is the most comprehensive study on the regulation of glycolysis in RA peripheral T lymphocytes at the level of transcription.
Our study shows that CD8+ T effector memory (Tem) cells and CD8+ CD45RA+ effector memory (Temra) cells have large numbers of DEGs. These cell types also show large numbers of significantly different gene pairs annotated by GTRD.
In the untreated RA CD8+ Tem cells, the enzymes catalysing the rate-limiting steps in glycolysis are not differentially expressed at level of transcription. Among the regulators of glycolysis, PFKFB3, is downregulated and has high target centrality scores in the GTRD-annotated differential co-expression network reported in this study. The downregulation of PFKFB3 is known to shift the CD8+ Tem from glycolysis to PPP. We propose a mechanism for the downregulation of PFKFB3 by the post transcriptional inhibition of HIF1A. One of the upregulated inhibitors of HIF1A, glyceraldehyde-3-phosphate dehydrogenase (GAPDH) also shows high target centrality scores in the network. The connection of GAPDH to multiple differentially expressed TFs in our network potentially indicates a wide range of functions beyond glycolysis for this gene in RA CD8+ Tem cells.
Our study shows that tocilizumab (TCZ) treatment partially reverses the RA associated differential expression of several metabolic and regulatory genes. This includes genes encoding mitochondrial complex I proteins, ATP synthase sub units and TCA cycle enzyme sub units in CD8+ Tem.
In untreated RA CD8+ Temra cells, the transcription factor MYC is upregulated and has a high centrality score in our network. However, the transcriptional target genes of MYC in glycolysis are not upregulated in this study. MYC upregulation is possibly caused by signalling via the phosphatidylinositol 3′-kinase (PI3K)-AKT and the mechanistic target of rapamycin (mTOR) pathways. Here, we report the upregulation of the activators of these pathways.
To summarize, RA causes changes to the transcriptional regulation of glycolysis in CD8+ Tem and Temra cells. We propose possible mechanisms for these changes. The RA associated alterations are partially reversed by the TCZ treatment.

2. Materials and Methods

The workflow used in this project is shown in Figure 1. RNA sequencing data of T cell subsets from healthy individuals, individuals with untreated RA and individuals treated with one of three therapies were subjected to differential expression analysis. The co-expression analysis of the transcription factors and glycolysis-related genes were performed using lionessR. The differentially co-expressed gene pairs were identified using limma and annotated with transcription factor–target gene interactions using the GTRD database. A network of annotated gene pairs was created, and network analysis was performed. From this analysis, the transcription factors and target genes playing important roles in changing the regulation of glycolysis under RA conditions were identified. The details of each step are described below.

2.1. RNA Sequencing Data

The data set GSE118829 was downloaded from the SRA database using the SRAtoolkit command fastq-dump [14]. A total of 336 samples were present in the data set, from the blood or synovial fluid of the following six groups:
  • Untreated RA (T cell subsets from blood);
  • Healthy control (T cell subsets from blood);
  • Infliximab and methotrexate combination therapy (T cell subsets from blood);
  • Methotrexate monotherapy (T cell subsets from blood);
  • Tocilizumab monotherapy (T cell subsets from blood);
  • RA synovial fluid samples (T cell subsets).
Infliximab and methotrexate combination therapy is referred to as infliximab-treated or IFX for the remainder of this article.
Each of the above six cohorts had samples for CD4+ and CD8+ T cell subsets defined using the following markers:
  • T naive (Tn): CD45RA+ CCR7+;
  • T central memory (Tcm): CD45RA CCR7+;
  • T effector memory (Tem): CD45RA CCR7;
  • T effector memory CD45RA+ (Temra): CD45RA+ CCR7.
The Temra samples contained only CD8+T cells, while Tn, Tcm and Tem samples had both CD4+ and CD8+ T cells.
A quality control (QC) was performed on the fastq files using R/Bioconductor libraries. The reads were mapped to GRCh38.p13 using STAR 2.7.7a [15]. Of the 336 single-end fastq files downloaded, 317 files passed the QC test with greater than 70% reads mapped to the genome. The details of each sample group are given in Table 1. The synovial fluid samples were not used in any of the analyses due to their small sample size.

2.2. Differential Expression Analysis

The aligned reads were counted using the R/Bioconductor package Rsubread (version 2.4.3) [16]. Differential expression analysis was performed using the DESeq2 (version 1.36.0) [17]. Genes with an FDR corrected p value ≤ 0.1 and a linear fold change of 1.5 were considered to be differentially expressed. The following comparisons between the sample groups were made for each T cell subset:
  • Untreated RA vs. healthy control;
  • Infliximab/methotrexate (IFX) treated vs. untreated RA;
  • Methotrexate (MTX) treated vs. untreated RA;
  • Tocilizumab (TCZ) treated vs. untreated RA.
  • The KEGG Mapper “color” tool was used to map the DEGs to KEGG [18].

2.3. Identification of Transcription Factors and Glycolysis-Related Genes

  • In order to study the differential co-expression of glycolysis-related genes and their transcription factors, we proceeded as follows. Among the genes in the RNA sequencing data, we identified those that were also present in the KEGG pathway “Glycolysis/gluconeogenesis”. Furthermore, a literature search was performed to identify any transporters or enzymes that directly affect the glycolysis pathway enzymes by post translational modification or changing the concentration of key intermediates in the glycolysis pathway.
  • Transcription factors were annotated using the database GTRD (v19). We finally created a list of genes which we called the “TF-glycolysis gene list”. This list included 1233 transcription factors and 74 glycolysis-related genes.

2.4. Single Sample Edge Weight Calculation

  • The raw counts generated from the aligned BAM files were transformed using the DESeq2 package function rlog before this analysis. From this counts matrix, genes belonging to the TF-glycolysis gene list were selected. The following analysis were performed on this subset matrix.
  • The R/Bioconductor package lionessR version (1.10.0) was used to calculate single-sample edge weights for each gene pair among the TF-glycolysis gene list. This package uses the method known as Linear Interpolation to Obtain Network Estimates for Single Samples (LIONESS).
  • The correlation matrix of gene expressions across samples is computed in lionessR.
  • Each element of the matrix represents the correlation coefficient between expressions of pairs of genes across all the samples. By computing this correlation matrix with and without a particular sample, an “edge weight” is assigned, which is an estimate of the contribution of that sample to the overall co expression between pairs of genes. Thus, every possible gene pair in the TF-glycolysis gene list has an edge weight in each sample.

2.5. Differential Edge Weight Calculation

  • In order to determine which gene pairs had a significantly different edge weight between the compared categories, a differential edge weight analysis was performed using limma package of Bioconductor (version 3.52.1).
  • The following groups of samples were compared with each other for each T cell subset:
  • Untreated RA vs. healthy control;
  • Infliximab/methotrexate (IFX) treated vs. untreated RA;
  • Methotrexate (MTX) treated vs. untreated RA;
  • Tocilizumab (TCZ) treated vs. untreated RA.
  • The significantly different gene pairs were chosen using an FDR-adjusted p value cutoff of ≤0.1.

2.6. Creation of GTRD-Annotated Differential Co-Expression Networks

The GTRD database contains transcription factor target gene interactions based on the presence of at least one binding site for a transcription factor in the region −1000 to +100 base pairs from the transcription start site of a given gene. GTRD does not contain data for lymphocytes from RA patients or for CD8+ Temra cells. Therefore, we decided to use the integrated data provided by GTRD, which included data from all human cell types present in the database [10]. The transcription factor—target gene interactions can be considered as a directed network with the transcription factor being the source node and the target gene being the target node. We used this information to annotate the significant gene pairs from the differential analysis of the edge weights from lionessR. Significant gene pairs which were also present in the GTRD database as transcription factor—target gene pairs were selected, and the direction assigned. This resulted in a network where an edge was present between two genes if:
  • The edge weight was significantly different between the two categories, and;
  • The edge was present in the GTRD database.
  • Such networks were constructed for every comparison made in each T cell subset using the R package “igraph” (version 1.3.1) [19]. This network is described in Figure 2.
The networks were visualised using Cytoscape (3.8.2) [20]. In the untreated RA vs. healthy control comparison of the edge weights, a positive log fold change value in the limma results table indicates higher edge weight in the untreated RA samples and is depicted as a purple edge in the Cytoscape network. A negative log fold change indicates higher edge weight in the healthy control samples and is indicated by a green edge in the Cytoscape network. In the treated RA vs. untreated RA samples, a positive log fold change shows a higher edge weight in the treated sample, indicated by a purple edge, and a negative log fold change shows a higher edge weight in the untreated RA sample, indicated by a green edge.

2.7. Network Analysis

  • The networks created had two types of nodes: transcription factors and target genes. None of the glycolysis-related genes chosen for this analysis were annotated as TFs in GTRD. On the other hand, any TF can also be a target gene, if another TF binds to its promoter region (−1000 to +100 from transcription start site). Therefore, in these networks, all glycolysis-related genes were target genes and only had incoming edges, while the TFs had both incoming and outgoing edges.
  • The networks with fewer than 20 glycolysis-related genes were not considered further.
  • Centrality measures were calculated for the nodes in each network using “igraph” package [19].
  • The following centrality measures were calculated for each network: in-degree centrality, out-degree centrality, betweenness centrality, hub score and authority score.

2.7.1. Degree Centrality

  • The degree of a node is the number of links associated with it. In a directed network, degree can be defined based on the direction of the edge. In-degree refers to the number of edges directed to a node, while out-degree refers to the number of edges directed out of a node [21].

2.7.2. Betweenness Centrality

  • This is a measure of how important a node is to the connectivity of the network. Betweenness centrality is the number of shortest paths that pass through a node, where the shortest path is defined as the shortest sequence of nodes and edges that connect two given nodes [22]. In our network, target genes do not have outgoing edges and cannot be part of the shortest path between any pair of genes. Therefore, their betweenness centrality will be zero. Thus, we consider betweenness centrality for transcription factors alone.

2.7.3. Hub and Authority Scores

  • Hub and authority scores are only defined in directed networks. Hub score depends on outgoing edges, and describes the outgoing connectivity of a node to other nodes with a large number of incoming edges. Authority score depends on incoming edges and describes the incoming connectivity of a node with other nodes that have a large number of outgoing edges. That is, nodes with high hub scores are those that have outgoing edges to a large number of high authority score nodes, while nodes with high authority scores are those that have incoming edges from a large number of high hub score nodes.
  • Hub and authority scores of the nodes in a network are defined as relative to each other. The authority score of a node is the sum of the hub scores of the nodes that link into it. The hub score of a node is the sum of authority scores of the nodes that it links out to. These measures are calculated by first assigning a uniform hub and authority score to all nodes and iteratively updating the scores [23].
  • Since only transcription factors have both outgoing and incoming edges, centrality measures that depend on outgoing edges, such as out-degree centrality, hub score and betweenness centrality were only considered for the transcription factors.
  • We then ranked the transcription factors by out-degree, hub score and betweenness centrality and the glycolysis-related genes by in-degree and authority score. The top ten genes in each centrality measure were taken. The common transcription factors across the out-degree, hub score and betweenness score lists and the common glycolysis-related genes across the in-degree and authority score lists were identified.
  • These genes were considered to be important in the difference in the TF–target gene interactions between the two compared groups, and thus central to the altered regulation of glycolysis between the two groups.

2.8. Annotation with GeneHancer Database

The expression of a gene may be influenced by the binding of transcription factors to enhancer regions. These regions may be several kilobases away from the location of a target gene [24]. Thus, the GTRD data that cover the −1000 to +100 region around the transcription start site may not adequately account for all the transcription factor–target interactions that are involved in the regulation of the expression of a given target gene. In order to account for transcription factor binding to enhancer regions, we annotated the differentially co-expressed edges between transcription factors and glycolysis target genes with information from the GeneHancer database (version 5.10).
GeneHancer links enhancers spread across the genome to target genes. It also provides information on the transcription factors that bind to the enhancers [25]. This allows us to create a transcription factor–target gene network using the number of enhancer binding sites of a given target gene for any given transcription factor. This network is used to annotate the differentially co-expressed edges. Since this network does not contain edges between transcription factors, the network analysis methods used for analysing the GTRD-annotated networks cannot be used. However, the in-degree of the glycolysis target genes remains comparable, since these only have incoming edges from transcription factors in both the networks. Therefore, we compared the in-degree of the glycolysis genes in GTRD-annotated and GeneHancer-annotated differential co-expression networks of untreated RA CD8+ Tem and Temra cells. We also compared the number of transcription factor binding sites in GTRD and GeneHancer for the selected target genes.

2.9. Color Pathway Tool of KEGG Mapper

The signalling pathways mTOR signalling and PI3K-AKT signalling are important regulators of glycolysis [26,27]. The mTORC1 pathway, which is part of the KEGG mTOR signalling pathway, was also shown to be upregulated in the GSE118829 data set [9]. The KEGG Mapper “color” tool was used to map the differentially expressed genes of RA CD8+ Tem and RA CD8+ Temra cells to the KEGG pathways mTOR signalling and PI3K-AKT signalling [18].
R scripts used for the analyses in this study are available at https://github.com/hshilpa/lionessR_RA_Tcell, accessed on 1 July 2022.

3. Results

3.1. Differential Expression of Genes

The number of DEGs between untreated RA and healthy individuals for T cell subsets are shown in Table 2. Genes with an FDR of less than 0.1 and a linear fold change greater than 1.5 were considered to be differentially regulated.
CD8+ Tem and CD8+ Temra cells show the largest number of differentially expressed genes.
Untreated RA samples were also compared with samples from individuals undergoing methotrexate, infliximab or tocilizumab therapy. The number of genes differentially expressed when comparing the treated and untreated RA samples is shown in Table 3.
CD8+ Temra cells from methotrexate (MTX)-treated individuals had the highest number of downregulated genes, followed by CD8+ naive cells. Similarly, IFX-treated individuals also had the highest number of downregulated genes in CD8+ Temra cells, followed by CD8+ Tn cells. TCZ-treated individuals showed a different pattern, with CD8+ Tem cells showing the largest number of downregulated genes. CD8+ Tn cells of the TCZ-treated individuals also showed a large number of downregulated genes. Overall, the number of upregulated genes was lower than or equal to that of the downregulated genes. The only exceptions were CD8+ Tem cells of MTX-treated individuals and CD4+ Tn cells of IFX-treated individuals.

3.2. Transcriptional Regulators Enriched in the Differentially Expressed Gene Lists

Differentially expressed genes from untreated RA CD8+ Tem and CD8+ Temra cells were analysed for enriched transcriptional regulators using Enrichr [28]. The gene set library used for performing enrichment was the consensus target genes for transcription factors from ENCODE and ChEA experiments. The upregulated gene list of CD8+ Tem and CD8+ Temra cells and the combined up and downregulated gene list of CD8+ Tem cells did not show significant enrichment for any transcription factor. The combined the up- and downregulated gene list of CD8+ Temra cells that showed RFX5 as significantly enriched.
The enriched transcription factors in the downregulated gene list for CD8+ Tem cells are shown in Table 4.
The enriched transcription factors in the downregulated gene list for CD8+ Temra cells are shown in Table 5.
CREB1, UBTF, ZNF384 and ATF2 were enriched in the downregulated lists of both CD8+ Tem and CD8+ Temra cells of untreated RA cells. CREB1 is involved in T cell cytotoxicity [29]. ATF2 is involved in the response of T cells to steroid therapy [30]. The roles of UBTF and ZNF384 in the RA T lymphocytes are not known.

3.3. Differential Regulation of Glycolysis/Gluconeogenesis Pathway Enzymes

Genes coding for enzymes in the glycolysis pathway showed differential regulation between untreated RA and healthy samples in two cell types, CD8+ Tem and CD8+ Temra cells. The genes showing differential expression are shown in Table 6.
Although HKDC1 and HK2 from CD8+ Temra cells showed significant differential regulation, their mean counts in the untreated RA samples and the healthy samples were low. GAPDH is known to be over-expressed in the hypoxic synovial tissue of inflammatory arthritis patients, along with PKM2 and SLC2A1 [31]. However, PKM2 and SLC2A1 mRNA levels did not change in any CD8+ T cell subsets in this study. To the best of our knowledge, the levels of GAPDH in circulating T cell subsets of RA patients have not been reported. LDHA mRNA was shown to be increased in the CD8+ T cell subsets of RA patients [8]. However, LDHA was not upregulated in CD8+ T cell subsets in this study. Since this study only measured mRNA levels, we cannot comment on the protein levels or activity of LDHA in these cells.
Glycolysis/gluconeogenesis pathway enzymes were differentially expressed in some of the treated T cell subtypes. Table 7 shows these genes.
The CD8+ Temra cells from MTX-treated samples showed a significant downregulation of HK2. However, the mean counts in the untreated RA and MTX-treated samples were very low.

3.4. Differential Regulation of Enzymes in Other Metabolic Pathways

3.4.1. Pentose Phosphate Pathway

Transaldolase 1 (TALDO1) and gluconokinase (IDNK) were the only genes to show differential regulation between RA and healthy samples. They were upregulated in CD8+ Tem cells from healthy samples to untreated RA samples.
IDNK was downregulated in TCZ-treated CD8+ Tem cells.

3.4.2. Tricarboxylic Acid Cycle

Among untreated RA versus healthy samples, CD8+ Tem cells and CD8+ Temra cells showed a differential regulation of genes involved in the TCA cycle. Table 8 lists the differentially expressed genes.
CD4+ T cells from the peripheral blood of RA patients are known to have reduced levels of DLD and SUCLG2 [32]. Their levels in CD8+ T cells have not been reported. Although DLD is downregulated in both CD8+ Tem and CD8+ Temra cells, the levels of SUCLG2 are unaltered (Supplementary Figure S9).

3.4.3. Oxidative Phosphorylation

Untreated RA CD8+ Tem cells showed a differential expression of 11 oxidative phosphorylation pathway genes. These are shown in Table 9. RA CD8+ T cells are known to have reduced ATP production and increased ROS production [8]. The upregulation of complex 1 genes and downregulation of the ATP synthase catalytic subunit ATP5F1C are concordant with these observations.
Genes from this pathway were downregulated in CD8+ Tem and CD8+ Tn cells from TCZ-treated individuals. Those genes are listed in Table 10.

3.4.4. Fatty Acid Metabolism

One gene in CD8+ Tem cells and two genes in CD8+ Temra cells were differentially regulated in untreated RA samples compared to healthy samples. These are listed in Table 11.
The differentially regulated genes of IFX-treated CD8+ Temra cells, TCZ-treated CD8+ Tem cells and TCZ-treated CD8+ Temra cells are shown in Table 12.
ACOT1, which is upregulated in CD8+ Temra cells of untreated RA individuals, is downregulated in IFX- and TCZ-treated CD8+ Temra cells.

3.5. Sample Specific Edge Weights

The counts of genes present in the TF-glycolysis gene list were extracted and single-sample edge weights were calculated for every possible gene pair using the R/Bioconductor package “lionessR”. Differential analysis was performed on these edge weights using limma and significantly different edges were identified using an FDR-corrected p value threshold of 0.1. The GTRD database contains directed transcription factor target interactions. Those significant edges from each comparison that were present in GTRD were then identified. Table 13 shows the number of significant gene pairs for each cell type.
CD8+ Temra cells from untreated RA samples, when compared to those from healthy samples, had the highest number of significantly different edge weights. Out of 128,318 significant edges, 75,606 were present in GTRD. Among the treated samples, TCZ-treated samples had more than 100 significantly different edge weights in all cell types except in CD8+ Tcm cells. IFX-treated samples had a similarly large number of significantly differentially expressed genes in cell types other than CD4+ Tcm cells. For MTX-treated samples, CD4+ Tn and CD4+ Tcm cells had few (less than 50) differentially expressed edges, while other cell types had comparatively higher numbers of differentially co-expressed edges.

3.6. Network Analysis

The GTRD-annotated transcription factor–target gene edges identified as significant were used to create a directed unweighted network using the R package “igraph”. In this network, the presence of an edge indicates that: (a) there is a significant difference in the mean edge weights between the two categories being compared and (b) the interaction is present in the GTRD database. The direction of the edge is taken from GTRD, and there are no edge weights. Table 14 shows the total number of nodes and edges as well as the number of transcription factors and target genes present in each network.
When comparing untreated RA samples with healthy samples, CD4+ Tn cells and CD4+ Tcm cells had four and zero glycolysis-related genes in their networks. Among the comparisons of the treatment samples with the untreated samples, CD4+ Tcm cells and CD8+ Tcm cells had fewer than 20 glycolysis-related genes in the network. CD4+ Tn cells also had only eight and zero glycolysis-related genes in the TCZ- and MTX-treated samples. Since these networks had low numbers of glycolysis-related genes with significantly altered edge weights, we did not consider them for further network analysis. The low number of glycolysis-related genes in these networks may indicate that glycolysis regulation is largely unchanged between the two conditions.
CD8+ Temra cells had the largest network of GTRD-annotated edges with significant difference in edge weights for all the comparisons.
The following centrality measures were calculated for each network: in-degree centrality, out-degree centrality, betweenness centrality, hub score and authority score. Since only transcription factors have both outgoing and incoming edges, centrality measures that depend on outgoing edges, such as out-degree centrality, hub score and betweenness centrality were considered only for the transcription factors. The centrality measures for the nodes in each network are provided in the Supplementary Files. We then identified the transcription factors that were present in the top ten out-degrees, hub scores and between centrality lists, as well as the target genes that were present in the top ten in-degree and authority score lists for each network. These are summarized in Table 15.
CD4+ Tem cells had several edges that showed a significant difference in edge weights in comparisons between both untreated RA vs. healthy samples and three treated vs. untreated RA samples. Among the transcription factors, SPI1, PADI2, ZNF366 and CBFA2T3 were in the top ten transcription factors for hub score, betweenness centrality and out-degrees for all the comparisons. Polymorphisms in the PADI2 genes are associated with RA [33,34]. Its role in circulating CD4+ T cells of RA patients is unknown. PPARG and VDR were only present in the top TFs for IFX-treated samples, and ETV1, NR2F2, NFE2 and RBBP4 were present only for TCZ-treated samples. No target genes were common to the top ten target genes of all the comparisons. These differences may indicate changes in the regulation of glycolysis under different conditions in this cell type. Among the three treatments, TCZ showed the largest number of significant edges annotated with GTRD, with 4205 interactions between 1035 genes. This was also greater than the number of edges in the untreated RA vs. healthy samples network.
In CD8+ Tn cells, FOXP1 was a top ten transcription factor across the transcription factor centralities in all the comparisons. FOXP1 is essential for maintaining quiescence in CD8+ Tn cells [35]. Its altered co-expression with glycolysis genes in RA CD8+ Tn cells may reflect changes in the metabolic repression associated with quiescence. ALDH3B1, PCK1, ACSS2 and ENO3 were the top ten target genes in authority score and in-degree for all the comparisons.
CD8+ Tcm cells had less than 20 target genes for all three treatment networks.
CD8+ Tem cells had MBL2 as a top transcription factor and GAPDH as a top target gene in all the comparisons. MBL2 polymorphisms are associated with RA in some ethnicities [36]. MTX had the largest number of significant GTRD-annotated edges among all three treatments, with 15,138 edges between 1248 genes. The size of the MTX vs. untreated RA network and the untreated RA vs. healthy network were very similar (Table 14), while the TCZ and IFX networks were smaller.
CD8+ Temra cells had the largest networks of differentially co-expressed genes among all the cell types. ZNF143 was a top transcription factor in all the networks. ENO1, G6PC3, ALDOC, ACSS2 and HK2 were common top target genes. TEAD1 was a top TF in all three treatments, but not in untreated RA.

3.7. GeneHancer Annotation of Transcription Factor–Target Gene Edges in Untreated RA CD8+ Tem Cells

The differentially co-expressed transcription factor–glycolysis gene edges in the untreated RA CD8+ Tem cells were annotated with enhancer binding site information from the database GeneHancer. This network had 281 nodes and 614 edges. Fifty-seven glycolysis-related genes were present in this network, eleven of which were not present in the GTRD-annotated network. Therefore, these genes had binding sites only in enhancer regions for the transcription factors in this study. The top ten glycolysis genes ranked by in-degree in the GeneHancer-annotated and GTRD-annotated differential co-expression networks for untreated RA CD8+ Tem cells are shown in Table 16.
The three differentially regulated genes—PFKFB3, DLD and GAPDH—show high centrality in both the networks. This indicates the potential for transcriptional regulation by a large number of transcription factors binding in both promoter and enhancer regions. The genes FBP2, ALDOB, G6PC2 and HKDC1 have a higher number of interactions in the GeneHancer network than in the GTRD network. However, the differential expression levels of these genes are low (Supplementary Figure S1). G6PD, SLC2A1 and G6PD are high-centrality genes in both networks, although they are not differentially expressed. BPGM, PDHA1, PGAM1 and AKR1A1 have high in-degrees in the GTRD network, but not in the GeneHancer network.
The three differentially regulated high-centrality genes PFKFB3, DLD and GAPDH shared a relatively high number of edges between the GTRD and GeneHancer networks. This means that the same set of transcription factors bind to sites in both promoter and enhancer regions of these genes. In order to compare the number of TF binding sites for specific TFs in the two databases, we plotted the number of binding sites for the common TF edges between the two. Figure 3 shows the bar plots of GTRD and GeneHancer binding sites for these TFs with PFKFB3, DLD and GAPDH.
In general, the number of binding sites in the GeneHancer were equal to or higher than the number of binding sites in GTRD. Table 17 shows the comparison of the numbers of binding sites in GTRD and GeneHancer. PFKFB3 especially has several transcription factors with a high number of enhancer binding sites in GeneHancer (Figure 3). This may indicate a greater potential for transcriptional regulation via transcription factor binding to enhancer regions for PFKFB3.

3.8. Glycolysis Regulators in Untreated RA CD8+ Tem Cells

The CD8+ Tem cells from untreated RA individuals show increased expression of the glycolysis enzyme GAPDH and reduced expression of DLD when compared to healthy samples. Two key regulatory enzymes, PFKFB3 and PFKFB4, show opposite differential expressions, with PFKFB3 being downregulated and PFKFB4 upregulated. PFKFB3, GAPDH and DLD are also genes with high target centrality scores, indicating that their correlation with transcription factors is significantly different in RA compared to healthy CD8+ Tem cells. Figure 4 shows the subgraph of GAPDH, DLD and PFKFB3 with differentially expressed transcription factors in the GTRD-annotated network. Figure 5 shows the same in the GeneHancer-annotated network.
The differentially expressed transcription factors—ZSCAN29, AEBP2, PHF20, IKZF5 and ZNF24—have edges with GAPDH in the GeneHancer network, which are not present in the GTRD network. DLD has an edge with RUNX3 that is not present in the GTRD-annotated network. PFKFB3 does not have any additional edges in the GeneHancer network compared to those present in the GTRD network.
The transcription factors that have significantly different edge weights with both PFKFB3 and PFKFB4 in the RA CD8+ Tem cells GTRD-annotated network and GeneHancer-annotated network are shown in Figure 6.
The transcription factors—ATF3, E2F7 and DTL—have edges with both PFKFB3 and PFKFB4 in the GTRD-annotated network. ATF3 and E2F7 are also transcription factors with high centrality scores. They have edges with both PFKFB3 and PFKFB4 in the GeneHancer-annotated network, indicating the presence of binding sites in promoter and enhancer regions. ATF3 and E2F7 are known to regulate glucose metabolism [37,38,39] All transcription factors in both the networks have higher edge weights with PFKFB4 in RA samples and higher edge weights with PFKFB3 in healthy samples.
The differential regulation of other glycolysis regulators is shown in Table 18.
CD8+ Tem cells from tocilizumab-treated individuals showed an over-expression of PCK2 and under-expression of GAPDH, two glycolysis-related genes. The gene MYC, an important regulator of glycolysis, is also upregulated in the samples, although it does not have high centrality scores. Figure 7 shows the subgraph of GAPDH and PCK2 with differentially expressed transcription factors in TCZ-treated CD8+ Tem cells.

3.9. GeneHancer Annotation of Transcription Factor–Target Gene Edges in Untreated RA CD8+ Temra Cells

The GeneHancer-annotated, RA-untreated CD8+ Temra differential co-expression network has 500 nodes and 3478 edges. Seventy-three glycolysis genes were present in this network, three of which were not present in the GTRD-annotated network. Table 19 shows the top ten target genes ranked by in-degree in the GTRD-annotated and GeneHancer-annotated networks of untreated RA CD8+ Temra cells.
The differentially regulated genes, ENO3 and HK2, show a high centrality in both the networks, while PDHA1 has a high centrality in the GTRD network, but not in the GeneHancer network. The genes G6PC2 and ADH7 have a higher number of interactions in the GeneHancer network than in the GTRD network. However, the differential expression levels of these genes are low (Supplementary Figure S7). ENO1, G6PC3, AKR1A1, SLC2A1, HK1 and ACSS2 are high-centrality genes in both networks, although they are not significantly differentially expressed. Some of these genes (AKR1A1 and HK1) show clear changes in the expression levels, although they fall below the fold change cutoff (Table 20).
AKR1A1 is not known to be associated with RA. However, it is known to be involved in nitric-oxide-based signalling, which is a major player in the lymphocytes of RA patients [40,41].

3.10. Glycolysis Regulators in CD8+ Temra Cells

CD8+ Temra cells of untreated RA samples showed the largest number of DEGs from the glycolysis pathway (Table 6). Among these genes, ENO3 and HK2 also show high target centrality scores. Among the transcription factors with high centrality scores, MYC was upregulated with a linear fold change of 3.14 and adjusted p value of 0.0004. Two other known regulators of glycolysis also show upregulation, but do not have high centrality scores:
  • Insulin receptor (INSR): linear fold change of 3.77 and adjusted p value of 0.09;
  • PPARG: linear fold change of 22.09 and adjusted p value of 0.01.
Figure 8 shows the interactions of MYC, INSR and PPARG with their target genes in the GTRD-annotated network.
The targets of MYC in this network include ENO3, HK2, DLD and PDHA1. ENO3, HK2 and PDHA1 have reduced edge weights with MYC in the RA samples compared to healthy CD8+ Temra cells, while DLD have higher edge weights in the RA samples.
PPARG and MYC have edges with HK2, ENO3 and PDHA1, which are differentially regulated. INSR does not have edges with target genes that are differentially expressed; however, it has an edge with MYC. MYC also interacts with PPARG, and the differentially expressed glycolysis gene DLD.
Figure 9 shows the target glycolysis target genes of MYC and PPARG in the GeneHancer-annotated network for the untreated RA CD8+ Temra cells.
The targets of MYC and PPARG in the GTRD and GeneHancer networks are largely similar, indicating binding sites for these transcription factors in the cis regulatory regions outside the GTRD interval. On the other hand, INSR does not have any target genes in the GeneHancer network.
The over-expression of MYC, its high centrality scores and interactions with glycolysis-related genes and regulatory proteins that show differential expression in both the GTRD and the GeneHancer-annotated networks point to the central role of MYC in the altered glycolysis regulation of RA CD8+ Temra cells.
Among other genes involved in the regulation of glycolysis in lymphocytes, those showing a differential expression in this cell type are shown in Table 21.

3.11. Comparison of Untreated RA and TCZ-Treated CD8+ Tem Cells

CD8+ Tem cells from TCZ-treated individuals showed a downregulation of GAPDH, which was upregulated in untreated RA CD8+ Tem cells. Most other genes that were DEGs in untreated RA CD8+ Tem cells did not show significant differential expression in TCZ CD8+ Tem cells. Figure 10 shows the normalized mean counts of these genes in healthy, untreated RA and TCZ-treated CD8+ Tem cells.
GAPDH, ATP5MG and COX8A were significantly differentially regulated in both untreated RA and TCZ-treated CD8+ Tem cells. For these genes, the expression was increased relative to controls in the untreated RA samples, while their expression was reduced to levels close to that of controls in the TCZ-treated samples. The genes PCK2 and MYC were significantly upregulated in TCZ-treated samples relative to untreated RA. Their differential regulation in untreated RA relative to healthy samples was not significant. All remaining genes showed a significant differential regulation only in untreated RA CD8+ Tem cells relative to healthy cells. ATP5F1C, ATP6V1G3, COX6A1, DLD, IDH3A, IDNK, EGLN3, ELOB, MT-CO1, NDUFA12, NDUFB10, NDUFB11, NDUFS2, OGDH, PFKFB4 and UQCRHL showed a non-significant return to healthy levels in the TCZ-treated CD8+ Tem cells. Four genes TALDO1, PFKFB3, IRS2 and RUNX3 show similar values in untreated RA and TCZ-treated CD8+ Tem cells. The expression levels of genes from glycolysis, the pentose phosphate pathway, TCA cycle and oxidative phosphorylation complexes 1, 4 and 5 in the healthy, untreated RA and TCZ-treated CD8+ Tem cells are shown in Supplementary Figures S1–S6.

3.12. Comparison of Untreated RA CD8+ Tem Cells and CD8+ Temra Cells

The cell types CD8+ Tem cells and CD8+ Temra show differential regulation of genes coding for metabolic enzymes and regulators of glycolysis. A different set of genes shows this alteration in each cell type. In Figure 11, the normalized counts of the genes that show differential regulation in either CD8+ Tem cells or CD8+ Temra cells of untreated RA are shown.
Table 6, Table 8, Table 9, Table 18 and Table 21 show the genes that are differentially regulated in CD8+ Tem and CD8+ Temra untreated RA cells relative to healthy cells. DLD and EGLN3 are significantly differentially regulated in both cell types. Among the genes that are upregulated in either one of the cell types, AKT1S1, ATP5F1C, ATP6V1G3, CAMKK2, COX6A1, COX8A, ELOB, ENO3, EP300, GAPDH, HIF1AN, HK2, IDH3A, IDNK, MT-CO1, NDUFA12, NDUFB10, NDUFB11, NDUFS2, NR1H2, OGDH, PDHA1, PFKFB3, PFKFB4, RUNX3 and UQCRHL all show similar trends in both cell types. ATP5MG, HKDC1, INSR, IRS2, MYC, PPARG, TALDO1 and RORC show either opposing trends or do not show much difference in one of the cell types. The expression levels of genes from glycolysis, the pentose phosphate pathway, TCA cycle and oxidative phosphorylation complexes 1, 4 and 5 in the healthy, untreated RA and TCZ-treated CD8+ Tem cells are shown in the Supplementary Figures S7–S12.

3.13. RA CD8+ Tem Differentially Expressed Genes in PI3K-AKT Signalling Pathway and mTOR Signalling Pathway

The DEGs of RA CD8+ Tem cells were mapped to KEGG pathways using the KEGG color pathway tool. Figure 12 shows the DEGs in the PI3K Akt signalling pathway.
In the chemokine signalling part of this pathway, GNG7 is downregulated. COL6A5, ITGA1, ITGB6 and PTK2 (FAK) are upregulated in the focal adhesion part of this pathway. IFNA1, IFNA5, IFNA13 and IL2RA in the cytokine–cytokine receptor interaction part of the pathway are upregulated. In the growth factor–receptor tyrosine kinase part of the pathway, EFNA1, EFNA4, VEGFC, ANGPT1, FLT1, KDR, RAS are upregulated, while FGF9 and FLT4 are downregulated. Signalling via these pathways leads to the activation of PI3 kinase, which produces the mediator PIP3. Among the direct targets of AKT kinases, eNOS is upregulated and CDKN1B is downregulated. Other DEGs downstream of these direct targets include CDK2 and CCND3, which are upregulated.
CD8+ T cells in RA patients are known to have activated mTOR [42]. The DEGs that are mapped to the mTOR signalling pathway are shown in Figure 13.
Wnt signalling leads to the inhibition of GSK3B and subsequent mTORC1 activation has four DEGs: WNT11 is downregulated, while WNT9A, WNT3A and FZD6 are upregulated. HRAS and RPS6KA1, which act downstream of the insulin signalling pathway, are upregulated. The mTOR activation in response to amino acids includes two upregulated genes: ATP6V1G3 and LAMTOR2.

3.14. RA CD8+ Temra Differentially Expressed Genes in PI3K-AKT Signalling Pathway and mTOR Signalling Pathway

The DEGs of RA CD8+ Temra cells were mapped to KEGG pathways using the KEGG color pathway tool. Figure 14 shows the DEGs in the PI3K Akt signalling pathway.
Among the genes that lead to activation of the phosphatidylinositol-4,5-bisphosphate 3-kinase (PI K) enzymes, IFNA21, IFNA10 and IL6R are activated in the cytokine–cytokine receptor interaction part of the pathway. This interaction leads to signalling via the JAK-STAT pathway resulting in the activation of PI3K. The receptor tyrosine kinases ERBB3, FLT1 and INSR are upregulated. These activate PI3K via the IRS1 protein. The integrin genes ITGA1 and ITGA3 are upregulated. They activate the FAK kinase, which in turn, activates the PI3 kinase. In the chemokine signalling branch of the pathway, LPAR3 and GNG3 are upregulated. PI3 kinase generates PIP3 (phosphatidylinositol 3,4,5-trisphosphate), which activates the AKT kinases. THEM4, an inhibitor of AKT kinases, is upregulated in RA CD8+ Temra cells.
Among the direct targets of the AKT kinases, eNOS is upregulated, while CREB3 is downregulated. The direct targets of the AKT kinases then activate or inhibit several downstream proteins. Among these, MYC and CCND3 are upregulated, while REL and RELA are downregulated.
Figure 15 shows the RA CD8+ Temra DEGs in the mTOR signalling pathway.
This pathway shows upregulation in the Wnt signalling that leads to inhibition of the mTORC1 inhibitor complex of TSC1/2 and TBC1D7. The upregulated genes include WNT7a and LRP5. RPS6KA1, which performs the same function downstream of the insulin receptor INSR, is also upregulated. At the same time, the inhibitor of mTOR, AKT1S1 is downregulated.

4. Discussion

In Table 2, we note that the CD8+ Tem and CD8+ Temra cells showed the greatest number of differentially expressed genes when comparing untreated RA and healthy samples.
Among the samples from treated RA individuals (Table 2 and Table 3), TCZ-treated samples showed a greater number of differentially expressed genes than MTX and IFX when compared with untreated RA individuals. CD8+ Tn and CD8+ Tem cells showed greater differential expression than CD8+ Temra cells in the TCZ-treated individuals. The reverse trend was experienced in the MTX- and IFX-treated individuals, where the CD8+ Temra cells showed the greatest number of differentially expressed genes among all the cell types.

4.1. Differential Expression of Metabolic Enzymes in CD8+ Tem Cells

Glycolysis/gluconeogenesis pathway enzymes were differentially expressed in CD8+ Tem and CD8+ Temra cells, when comparing untreated RA with healthy samples. The enzyme GAPDH was upregulated, while DLD was downregulated, in CD8+ Tem. DLD was also downregulated in CD8+ Temra cells. ENO3, HK2, HKDC1 and PDHA1 were upregulated in this cell type.
Figure 16 summarizes the differential expression of genes associated with metabolism in RA CD8+ Tem cells. Glycolysis, TCA cycle and oxidative phosphorylation have differentially expressed genes.
Based on the presence of genes and the functions of the genes in these pathways, we can conclude the following:
  • The level of glycolysis in RA CD8+ Tem cells may not be different from that in healthy CD8+ Tem cells.
  • The pentose phosphate pathway may be upregulated in the RA CD8+ Tem cells.
  • There are both upregulated and downregulated genes in the TCA cycle, hence the effect of RA on CD8+ Tem cells is ambiguous.
  • In oxidative phosphorylation, the genes of complex 1 are upregulated, while the catalytic component of the F0F1 ATP synthase is downregulated. Thus, there may be an increased activity of complex 1 and reduced ATP production.
Each pathway is discussed in more detail in the following sections.

4.2. CD8+ Tem Cells: Glycolysis

Glyceraldehyde-3-phosphate dehydrogenase (GAPDH) is a glycolysis pathway enzyme that converts glyceraldehyde-3-phosphate (GAP) to 1,3-bisphosphoglycerate utilizing NAD+ in the process. GAPDH is an important regulator of aerobic glycolysis in activated CD8+ Tem cells. On stimulation of the T cell receptor, the expression of cytoplasmic GAPDH increased, resulting in the switch to aerobic glycolysis [43]. GAPDH expression also increased in the hypoxic synovial lining of RA patients, and the response to TNF inhibitor treatment is accompanied by a reduction in GAPDH levels [31]. The inhibition of GAPDH by the immunomodulatory drug dimethyl fumarate has been shown to reduce the aerobic glycolysis of activated lymphoid cells [44].
GAPDH also has high centrality scores in the network of differentially co-expressed gene pairs, indicating a considerable change in its regulation in the RA CD8+ Tem cells compared to healthy cells.
However, it is not possible to infer an increase in aerobic glycolysis in RA CD8+ Tem cells compared to healthy cells purely based on the upregulation of GAPDH. The gene encoding the enzymes that catalyse the three rate limiting steps of glycolysis, namely, hexokinases (HK 1-3, GCK), phosphofructokinases (PFKM, PFKL, PFKL) and pyruvate kinases (PKLR, PKM) do not show any differential regulation in the RA CD8+ Tem cells. There is also no increase in the mRNA levels of glucose transporters which are required for the entry of glucose into the cells. Another indicator of aerobic glycolysis in T cells is the increased expression of lactate dehydrogenase A(LDHA). LDHA was previously found to be elevated at both mRNA and protein levels in all subsets of CD8+ T cells in RA patients compared to controls [8]. In this study, however, none of the T cell subsets showed differential expression of LDHA.
GAPDH becomes the rate limiting step in glycolysis only under the condition that its metabolites upstream in the glycolysis pathway are abundant and those downstream are scarce [45]. Since this study is only based on RNA seq data, we cannot comment on the levels of metabolites in the cells. GAPDH also has non-glycolytic functions, including the regulation of translation of genes, such as HIF1A, MYC, IFNG, IL2 and TNF-α [46]. Thus, the increased expression of GAPDH does not necessarily predict an increase in aerobic glycolysis in RA CD8+ Tem cells; instead, any of its several other functions may be affected.

4.3. CD8+ Tem Cells: TCA Cycle

Three TCA cycle enzymes show differential regulation in CD8+ Tem cells, DLD, IDH3A and OGDH. The enzyme dihydrolipoamide dehydrogenase (DLD), which catalyses the conversion of dihydrolipoamide to lipoamide in an NAD+-dependent manner, is downregulated. DLD forms the E3 component of three enzyme complexes, namely, the pyruvate dehydrogenase complex (PDC), the α-ketoglutarate dehydrogenase complex (OGDC) and the branched-chain α-ketoacid dehydrogenase complex (BCKDC). In addition, DLD also takes part in the glycine cleavage system, which causes the catabolism of glycine [47]. All these enzyme complexes are located in the mitochondrion.
The genes OGDH and PDHA1 transcribe enzymes that form part of the large complexes OGDC and PDC. The RA CD8+ Tem cells show an upregulation of OGDH. While PDHA1 upregulation is significant (FDR p value 0.01980018), the linear fold increase is only 1.43.
The OGDC catalyses the irreversible decarboxylation of α-ketoglutarate to succinyl CoA, generating NADH in the process. This reaction is a major point of regulation of the citric acid cycle and is tightly controlled by various means [48]. The OGDC consists of several copies of three enzymes: α-ketoacid decarboxylase (E1), dihydrolipoyl transacetylase (E2) and dihydrolipoamide dehydrogenase (E3). The upregulated OGDH gene codes for the E1 component, while DLD codes for the E3 subunit [49]. The product of OGDC, succinyl-CoA, is converted to succinate by the enzyme succinyl-CoA synthetase. This enzyme consists of two subunits, α encoded by SUCLG1 and β, encoded by SUCLG2 or SUCLA2. Activated CD4+ Tn cells from the peripheral blood of RA patients show reduced mRNA levels of SUCLG2 and DLD, as well as reduced protein levels and enzymatic activity of succinyl-CoA synthetase [32]. This leads to a reversal of the citric acid cycle, causing the accumulation of acetyl CoA, citrate and α-ketoglutarate. This is known as a “broken” TCA cycle.
The expression levels of SUCLG1, SUCLG2 and SUCLA2 are not altered in any cell type in this study. DLD expression is also seen to be reduced only in CD8+ Tem and CD8+ Temra cells.
IDH3A, which encodes the catalytic subunit of the NAD+-dependent isocitrate dehydrogenase enzyme, is mildly upregulated. This enzyme catalyses the conversion of isocitrate to α-ketoglutarate in the citric acid cycle [50]. This step precedes the OGDC catalysed reaction in the TCA cycle. IDH3 is found to be active in the RA CD4+T cells with a “broken” TCA cycle [32]. Therefore, the increased expression of OGDH and IDH3A by themselves do not necessarily indicate an intact TCA cycle in CD8+ Tem cells. However, the lack of downregulation of any TCA cycle enzyme except DLD may mean that any TCA change in the regulation of the TCA cycle in the CD8+ RA Tem cells does not occur at the transcription level.
The PDC is composed of three enzymes: pyruvate dehydrogenase (E1), dihydrolipoamide acetyltransferase (E2), and dihydrolipoamide dehydrogenase (E3) and a fourth component E3BP. The PDHA1 gene codes for the E1 component of the complex [51]. The PDC converts pyruvate into acetyl CoA, generating NADH from NAD+ in the process. Acetyl-CoA is then utilized in the citric acid cycle, and the NADH enters oxidative phosphorylation [52]. The PDC thus links glycolysis with the citric acid cycle and oxidative phosphorylation.
Aerobic glycolysis involves conversion of pyruvate to lactate rather than acetyl CoA. This leads to reduced availability of pyruvate for the citric acid cycle. In these conditions, pyruvate can be generated by glutamine to replenish the TCA cycle in T lymphocytes [53]. Thus, the presence of aerobic glycolysis does not preclude a functional TCA cycle.
It is not possible to comment on the increase or decrease in the activity of the PDC in RA CD8+ Tem cells based on the expression levels of PDHA1 and DLD, since they show discordant changes. Among the post translational regulators of the PDC, neither the pyruvate dehydrogenase kinases (PDK1-4), which inhibit PDC activity, nor the pyruvate dehydrogenase phosphates (PDP1/2, PDPR), which reactivate the PDC, show any differential regulation [52,54]. Therefore, although some TCA cycle enzymes show differential expression, it is not possible to conclusively state that the TCA cycle in RA CD8+ T cells is increased or decreased.

4.4. CD8+ Tem Cells: Oxidative Phosphorylation

Eleven genes coding for proteins in the oxidative phosphorylation pathway are differentially regulated, with all but one (ATP5F1C) being upregulated. ATP5F1C codes for the γ subunit of the catalytic F1 head of the mitochondrial F0F1 ATP synthase [55]. The downregulation of this gene is a clear indication of reduced ATP production by oxidative phosphorylation in RA CD8+Tem cells compared to healthy CD8+Tem cells.
However, genes coding for proteins in complex I (NDUSF2, NDUFA12, NDUFB10, NDUFB11) are upregulated. NDUFS2 is the core subunit of complex 1 and responsible for electron transfer from NADH to ubiquinone [56]. The counts of the other differentially expressed genes in this pathway are low and may be biologically insignificant. Thus, RA CD8+ Tem cells may have greater complex 1 activity than their healthy counterparts. Complex 1 activity is essential for the function of CD8+T cells [57].
CD8+ Tem cells from RA patients thus show increased expression of three TCA cycle enzymes and complex 1 enzymes. Among these, OGDC and complex 1 also generate reactive oxygen species [58,59]. The over-expression of genes coding for these enzymes may lead to increased ROS production in RA CD8+ T cells compared with healthy controls. This is in contrast to CD4+ T cells in RA, which are known to have a pathological reductive phenotype [60].

4.5. CD8+ Tem Cells: Regulation of Glycolysis and the Pentose Phosphate Pathway

Figure 17 describes the possible changes to the regulation of glycolysis in RA CD8+ Tem cells.
CD8+ Tem cells show decreased expression of PFKFB3 and increased expression of PFKFB4, two isozymes of the bifunctional enzyme that control the concentration of fructose 2,6-bisphosphate. Fructose 2,6-bisphosphate is an allosteric modulator of phosphofructokinase (PFK) that catalyses the commitment step of glycolysis. Although both PFKFB3 and PFKFB4 can catalyse the production and destruction of fructose 2,6–bisphosphate, PFKFB3 has greater kinase activity and favours glycolysis. PFKFB4, on the other hand, favours flux through the pentose phosphate pathway [61]. It has been shown that, for CD4+T cells in RA, PFKFB3 is under-expressed, causing the increased activity of the pentose phosphate pathway, which in turn leads to greater NADPH production. The NADPH is utilized for the generation of fatty acids and sets up a reductive environment in the cell [7]. CD8+ T cells also express less PFKFB3 than controls at the protein level [8]. Two pentose phosphate pathway enzymes are upregulated, TALDO1 and IDNK. The shift to the pentose phosphate pathway depends on the ratio of PFKFB3 to the enzyme G6PD, which catalyses the first step of the pentose phosphate pathway [7]. Thus, a reduction in PFKFB3 levels may be sufficient to drive this shift even in the absence of an increase in the expression of G6PD.
Among the known regulators of aerobic glycolysis in CD8+T cells, HIFA expression does not significantly change. However, two of the negative regulators of HIF1A in normoxia, EGLN3 and ELOB, are upregulated [62,63]. Since circulating CD8+ T cells in RA do not experience hypoxia, it can be assumed that HIF1A remains inhibited in these cells. In addition, GAPDH also binds to and represses the translation of the HIF1A mRNA. HIF1A induces the expression of several genes associated with glycolysis, including PFKFB3 [64]. The downregulation of PFKFB3 may be attributed to the inhibition of HIF1A in RA CD8+ Tem cells. Since the inhibition of HIF1A occurs post transcriptionally, the mRNA levels of HIF1A may remain unchanged, hence the edge weight between HIF1A and PFKFB3 need not be significantly altered between RA and healthy CD8+ Tem cells.
PFKFB4 expression is also induced by HIF1A [65]. The increased expression of PFKFB4 may lead to greater pentose phosphate pathway activity, but the cause of this increased expression cannot be explained by the proposed inhibition of HIF1A.
Based on the differential expression of these genes and the altered edge weights of the TF-glycolysis gene pairs, we suggest that HIF1 α does not mediate aerobic glycolysis in RA CD8+ Tem cells.
PFKFB3, GAPDH and DLD also have high centrality scores (Table 15). The altered regulation of these genes may represent the change in regulation of the glycolysis pathway. PATZ1 and RUNX3, the two transcription factors required for the differentiation and lineage integrity of CD8+T cells, are downregulated in the RA CD8+Tem cells [66]. Both genes also have reduced edge weights with PFKFB3 in RA. At the same time LEF1, which also plays a role in maintaining CD8+ T cell identity, is upregulated, and its association with PFKFB3 is increased in RA [67]. The change in the edge weights of PFKFB3 with these genes may indicate a possible link between T cell lineage maintenance and the regulation of glycolysis in these cells. PFKFB3, GAPDH and DLD also have a high degree centrality in the GeneHancer-annotated network, indicating the presence of enhancer binding sites for several transcription factors (Table 16). PFKFB3 also has a large number of binding sites for specific transcription factors with which it shows differential co-expression (Figure 3). Thus, transcription factors other than HIF1A may be involved in regulating PFKFB3 expression in RA CD8+ Tem cells. PFKFB3 is also known to increase cell proliferation by inhibiting CDKN1B [68]. However, both PFKFB3 and CDKN1B are downregulated in these cells. Thus, this potential mechanism of linking glycolysis with cell proliferation does not exist in the RA CD8+ Tem cells.

4.6. CD8+ Tem Cells: Transcriptional Regulation of GAPDH

Figure 18 shows the differentially expressed transcription factors which have edges with GAPDH in the RA CD8+ Tem cells. The functions of each transcription factor are also described.
Among the TFs that have edges with GAPDH, MXI1, CDKN1B and KDM3B are downregulated. MXI1 is an antagonist of MYC [69], and MYC is known to induce the transcription of glycolysis-related genes during the activation of T cells [70]. The downregulation of MXI1 may relieve the inhibition of MYC function in RA CD8+ Tem cells. CDKN1B inhibits cell proliferation in CD8+T lymphocytes [71]. KDM3B may play a tumour-suppressor role in acute myeloid leukemia [72]. Their reduced expression indicates greater proliferative abilities for the RA CD8+ Tem cells. KDM3B, MXI1 and CDKN1B have reduced edge weights with GAPDH in the RA CD8+ Tem cells, indicating a possible coordination of GAPDH levels with these processes.
The upregulated gene PTBP1 is known to drive aerobic glycolysis by promoting the expression of the PKM2 splice isoform of the pyruvate kinase enzyme [73]. However, its association with GAPDH is not understood. CTBP1, a transcriptional repressor that antagonizes tumour suppressors, is activated by NADH and in turn increases the levels of NADH in cells. This positive feedback loop involves the repression of the mitochondrial pyruvate carriers MPC1 and MPC2 [74]. The MPCs transport pyruvate from the cytosol into the mitochondria where it becomes the substrate of PDC, and the inhibition of this process is associated with increased lactate production and aerobic glycolysis. CTBP1 is upregulated in the RA CD8+ Tem cells; however, the targets of its repression, MPC1 and MPC2, do not show downregulation. Thus, it cannot be concluded that pyruvate transport to mitochondria by the MPC1/2 proteins is reduced. The GAPDH-catalysed reaction also generates NADH. The increased edge weight between GAPDH and CTBP1 in RA may indicate another mechanism by which CTBP1 increases NADH levels in the cells.
NOTCH1, which is a promoter of aerobic glycolysis, was upregulated in CD8+ Tem cells [75]. However, its target genes in glycolysis were not differentially regulated. NOTCH1 mRNA translation is repressed by GAPDH when GAPDH is modified by the metabolite methylglyoxal [76]. Methylglyoxal is generated from glyceraldehyde-3-phosphate, which is the substrate for GAPDH. This function of GAPDH occurs only when it is not taking part in glycolysis [43]. It is not possible to ascertain whether this inhibition of NOTCH1 translation by GAPDH occurs from transcriptome data alone.
TP63, which is upregulated, also has an increased edge weight with GAPDH in RA CD8+ Tem cells. ΔNp63α, a splice isoform of TP63, induces the expression of GAPDH in squamous cell carcinoma when phosphorylated [77]. On the other hand, another isoform, TAp63, may induce the pentose phosphate pathway as well as glycolysis [78,79]. Thus, the increased expression of the TP63 gene may lead to the over-expression of GAPDH, depending on the splice isoform that is dominant in RA CD8+ Tem cells. In summary, GAPDH may play a central role in RA CD8+Tem cell function, but its role in the regulation of glycolysis is unclear.

4.7. Differential Regulation in the PI3K-AKT and mTOR Signalling Pathways in CD8+ Tem Cells

Figure 12 and Figure 13 show the differentially regulated genes in the PI3K-AKT signalling and mTOR signalling pathway. However, due to the presence of both up and downregulated genes in these pathways, the KEGG pathway diagram does not show a clear picture of the expression states of the gene in the pathway. Figure 19 shows all the DEGs in these pathways.
As seen in Figure 19, some important proteins such as IRS2 are downregulated in the pathways. IRS2 activates PI3K activity in response to signalling from growth factor receptors, resulting in increased aerobic glycolysis [80]. This signalling cascade involves the activation of mTOR and cannot be fully compensated by IRS1 [80]. The differential regulation of WNT11, WNT9A, WNT3A, FZD6 and ATP6V1G3, though significant, may not have any biological importance due to their low counts in the RA CD8+ Tem samples. Therefore, we cannot say with certainty that mtorc1 is activated based on the differential regulation of these genes.
The possible regulation of glycolysis metabolism in RA CD8+ Tem cells is summarised in Figure 20.

4.8. Effect of Treatment on the Regulation of Glycolysis in CD8+ Tem Cells

Tocilizumab is an antagonist of the IL 6 receptor used to treat rheumatoid arthritis [81]. This drug is shown to reduce the ability of RA T cells to proliferate [9]. In tocilizumab-treated CD8+ Tem cells, GAPDH is downregulated and PCK2 is upregulated relative to untreated samples (Table 7). They also have high target centrality scores in the GTRD-annotated differential co-expression network of TCZ-treated RA CD8+ Tem cells (Table 15). PCK2 is a mitochondrial enzyme that catalyses the conversion of oxaloacetate to phosphoenolpyruvate, utilizing GTP. This reaction is the first step of the gluconeogenesis pathway [82]. PCK2 is not differentially expressed in untreated RA CD8+ Tem cells, although there is a non-significant decrease in the mean counts relative to healthy samples. As PCK2 can control the flux through the TCA cycle, its upregulation may indicate that changes in RA CD8+ Tem cell TCA cycle by TCZ treatment may involve a return to a healthier state.
GAPDH downregulation in response to TCZ therapy may have several consequences, due to the varied functions of the gene. The upregulated transcription factors STAT2, CRY1 and ZEB1 have increased edge weights with GAPDH in the TCZ-treated CD8+Tem cells. STAT2 causes transcriptional activation in response to interferon signalling [83]. It is also known to induce the secretion of IL 6 [84]. CRY1 is a circadian clock-related gene that also plays a part in arthritis. Mice lacking CRY1 and CRY2 have increased levels of activated T cells, and when arthritis was induced in these mice, serum IL6 levels were higher than in wild type mice with induced arthritis [85]. ZEB1 is involved in T cell development and is known to upregulate IL6 gene expression [86,87]. The relation between these genes and GAPDH is not clear.
Among the transcriptional regulators of glycolysis, MYC is upregulated, while HIF1A expression is unchanged. ELOB, an inhibitor of HIF1A that is upregulated in RA CD8+ Tem cells, is downregulated in TCZ-treated CD8+ Tem cells. EGLN3 expression is also reduced, though it is not statistically significant (Table 18 and Figure 10). These changes, along with the decreased expression of GAPDH, remove the inhibition of HIF1A proposed in Figure 16. However, the HIF1A and MYC target genes that are involved in glycolysis do not show any differential expressions. In addition to this, the removal of HIF1A inhibition also does not result in an increase in the expression of PFKFB3 caused by TCZ treatment (Figure 10). PFKFB3 does not have any differentially co-expressed edges in the TCZ CD8+ Tem network. This indicates that there is no change in the mRNA levels of any transcriptional regulators of PFKFB3 due to TCZ treatment. At the same time, the downregulation of the inhibitors of HIF1A function may point to the presence of other mechanisms for the continued downregulation of PFKFB3 in the TCZ-treated CD8+ Tem cells.
As shown in Figure 10, most genes that are differentially regulated in untreated RA CD8+ Tem cells show a return to levels close to healthy mean counts in TCZ-treated samples. The exceptions include TALDO1, PFKFB3, IRS2 and RUNX3. PFKFB3 and IRS2 are important regulatory genes for glycolysis. Thus, TCZ treatment does not bring the regulation of glycolysis in CD8+ Tem cells to a completely healthy state. Since PFKFB3 levels were not changed, and do not have high centrality scores, the balance between glycolysis and the pentose phosphate pathway may not have altered relative to untreated RA CD8+ Tem cells. On the other hand, oxidative phosphorylation may be more similar to a healthy state in the TCZ-treated CD8+ Tem cells as shown by the genes ATP5F1C, ATP6V1G3, COX6A1, MT-CO1, NDUFA12, NDUFB10, NDUFB11, NDUFS2, ATP5MG, COX8A and UQCRHL.

4.9. CD8+ Temra Cells: Glycolysis

CD8+ Temra cells, also known as CD8+ Temra cells, are increased in the blood of RA affected individuals whose samples were used in this study [9]. RA CD8+ Temra cells show the over-expression of four glycolysis genes—PDHA1, ENO3, HKDC1 and HK2. HKDC1 and HK2 counts in untreated RA and healthy cells are low, hence their over-expression may not have any biological effect. Similar to CD8+ Tem cells, RA CD8+ Temra cells also have high PDHA1 and low DLD.
ENO3 (or β enolase) is a subunit of enolase that converts 2-phosphoglycerate to phosphoenolpyruvate in a reversible reaction [88]. β enolase forms homodimers or heterodimers with α or γ enolase to create a functional enzyme, and is predominantly found in the muscle [89]. Its role in RA is unknown.

4.10. CD8+Temra Cells: Regulation of Glycolysis

There is no clear indication of an increase in the expression of key glycolysis enzymes, except for PDHA1 and ENO3. However, there is a large network of differentially co-expressed gene pairs, indicating changes in the regulation of glycolysis. Among the target genes with a high centrality, G6PC3, SLC2A1 and HK2 are important for regulating the glycolysis pathway.
G6PC3 codes for a catalytic component of the glucose 6 phosphatase system, which catalyses the conversion of glucose 6 phosphate to glucose. This is the final step in glycogenolysis and gluconeogenesis. The deficiency of G6PC3 is known to cause neutropenia; however, its role in lymphocytes is unclear [90]. SLC2A1 codes for the glucose transporter GLUT1, which is one of the proteins responsible for the increased aerobic glycolysis in several cancers [91]. However, the RA CD8+ Temra cells do not show an increase in the mRNA levels of SLC2A1. Another protein that shows increased expression during aerobic glycolysis is hexokinase2 (HK2) [92]. As discussed earlier, HK2 upregulation may not be biologically significant in RA CD8+ Temra cells. However, HK2 also has high target centrality scores, indicating changes in its transcriptional regulation. Thus, in spite of the changes in its transcriptional regulation, its upregulation may not have any relevance.
The transcription factors with high centrality scores include MYC, a known regulator of aerobic glycolysis in T cells [93]. MYC is known to increase the expression of HK2 and PDK1 [94]. PDK1 is an inhibitor of pyruvate dehydrogenase, which is also inducible by HIF1A during the process of aerobic glycolysis [95]. Both HK2 and PDK1 have reduced edge weights with MYC in the RA samples. The HK2 levels were low in RA CD8+Temra cells despite a statistically significant increase compared to the healthy samples, and PDK1 was not upregulated. PDHA1 and ENO3, which were upregulated, have lower edge weights with MYC in the RA samples. These changes suggest that the upregulation of PDHA1 and ENO3 was not due to MYC binding in the RA CD8+Temra cells. In addition, the upregulation of MYC did not cause an increase in the expression of glycolysis genes.
Among other known regulators of glycolysis, PPARG and INSR are upregulated. Neither have high centrality scores. PPARG upregulates HK2 in medulloblastoma, and an agonist of PPAR signalling increases the rate of glycolysis in CD8+ cells [96,97]. In RA CD8+Temra cells, the edge weights between PPARG and HK2, HK1, PFKP, LDHA, PDHA1 and ENO1 are reduced, whereas the edge weight between SLC2A1 and ENO3 are increased in the RA samples. These changes indicate that PPARG upregulation is unlikely to drive any increase in glycolysis in RA CD8+ Temra cells.
The insulin receptor INSR is also upregulated; however, its edge weight with MYC is greater in healthy CD8+ Temra cells.
HIF1A is not differentially regulated in RA CD8+Temra cells, and it does not have high centrality scores. It has edges with only two glycolysis genes, ALDOC and ADH7. In both cases, the edge weights are higher in healthy CD8+ Temra cells. These results indicate that HIF1A may not regulate increases in glycolysis in RA CD8+ Temra cells compared to healthy cells. In addition, two of the suppressors of HIF1A, EGLN3 and HIF1AN are upregulated in RA CD8+ Temra cells. The co-activator of HIF1A, EP300 is also downregulated [98]. Thus, as in the case of CD8+ Tem cells, RA CD8+ Temra cells also may have a function of suppressing HIF1A. However, this suppression of HIF1A activity only leads to a small, non-significant downregulation of PFKFB3 in RA CD8+ Temra cells (Figure 11).
Among the signalling pathways that control metabolism in T cells, PI3K-AKT signalling and mTOR signalling show differential regulation in CD8+ Temra cells. The signalling pathways upstream of the PI3 kinases show the upregulation of several genes, indicating a possible activation of the kinase and the generation of the second messenger PI3P (Figure 13). Only one of the inhibitors of the AKT kinases shows upregulation. Thus, the RA CD8+ Temra cells may have active signalling via the PI3K-AKT pathway. The downstream targets of AKT include TSC2, an inhibitor of the mTORC1 complex [26]. The mTORC1 complex is part of the mTOR signalling pathway, which also shows DEGs in the RA CD8+ Temra cells (Figure 15).
AKT phosphorylation activates important glycolysis-related genes, such as hexokinase, PFKFB2 and PDK1. In addition, it increases the plasma membrane localization of the GLUT1 and GLUT4 glucose transporters. In summary, AKT kinases increase the activity of the glycolysis pathway [26]. AKT signalling also leads to an increased transcription of HIF1A and MYC. However, HIF1A levels are unchanged in the RA CD8+ Temra cells. The glycolytic genes that are targets of MYC show upregulation; however, as discussed earlier, their edge weights with MYC are higher in the healthy controls, indicating that their upregulation may not be related to MYC levels.
The mTOR pathway shown in Figure 15 shows the upregulation of genes that cause the activation of the pathway and the downregulation of an inhibitor of the pathway. In addition to the genes shown in Figure 15, the PI3K-AKT pathway also leads to the activation of the mtorc1 complex. Figure 21 shows the relation between the two pathways, and the differential regulation in RA CD8+ Temra cells that may cause increased mtorc1 activity. The effect of mTOR signalling on glycolysis is mediated by HIF1A and MYC upregulation [27]. The activation of mTOR was demonstrated in the CD8+ T cells of RA patients [42].
In general, most of the considered genes that show significant differential expressions in RA CD8+ Tem cells show similar but non-significant differential expressions in the same direction in the RA CD8+ Temra cells (Figure 11). The exceptions to this trend include MYC, INSR and IRS2. Since these proteins are important regulators of glycolysis, the difference in their expression profiles may have profound effects on the regulation of glycolysis for both cell types. As discussed earlier, MYC does not have increased edge weights with its glycolysis targets genes in the RA samples, nor do any of these genes show large changes to their expression. However, the insulin receptor INSR and its substrate IRS2 exert their effects through post translational modifications of downstream proteins. Therefore, the effects of their altered differential regulation in the two cell types are not visible in the transcriptomic data. The changes in insulin signalling, as well as the PI3K-AKT and mTOR signalling pathways, indicate immediate changes in the glycolytic state of the RA CD8+ Tem and RA CD8+ Temra cells.
Figure 22 summarises the changes in glycolysis regulation in RA CD8+ Temra cells.

4.11. Limitations of This Study

This analysis is only based on gene expression data from the peripheral blood T lymphocyte subsets of healthy, untreated and treated RA individuals. Thus, information about activity levels of the glycolysis enzymes and concentration of metabolites cannot be included in this study. The signalling pathways discussed here use post transcriptional modifications and changes in localization to regulate glycolytic activity. This study cannot capture those changes. Transcription factors act as part of protein–protein interaction networks with other proteins, such as co-factors and chromatin remodellers, in order to initiate transcription [99]. Such interactions are also not part of the current analysis. However, this study is the most comprehensive analysis of the effect of RA on the transcriptional regulation of glycolysis in the T lymphocyte subsets present in circulation.

5. Conclusions

The differential expression of glycolysis-related genes and the differential co-expression of glycolysis-related genes with transcription factors were examined in healthy, untreated RA and treated RA T cell subsets. CD8+Tem and CD8+Temra cells showed the greatest number of differentially expressed genes and the largest networks of differentially co-expressed interactions, indicating changes in the transcriptional regulation of glycolysis. CD8+ Tem cells of untreated RA individuals a showed differential regulation and high centrality scores for GAPDH and PFKFB3. A model for the differential expression of PFKFB3 by post transcriptional inhibition of HIF1A has been proposed. GAPDH may play a role in several non-glycolytic processes in RA Tem cells based on its association with differentially regulated transcription factors. TCZ-treated CD8+ Tem cells showed a partial reversal of the differential expression of oxidative phosphorylation, TCA cycle, pentose phosphate pathway and glycolysis genes, as well as some of the glycolysis regulators. CD8+ Temra cells of untreated RA individuals showed upregulation of PI3K-AKT and mTOR pathways, possibly leading to MYC over-expression. High centrality scores of MYC indicated changes in its mediated transcriptional regulation.
The effect of these changes on the activity of glycolysis genes must be examined experimentally. The role of GAPDH in RA CD8+ Tem cells can also be explored using protein–protein interaction networks.

Supplementary Materials

The following supporting information can be downloaded at: https://www.mdpi.com/article/10.3390/genes13071216/s1, Table S1: CD8+ Tem untreated RA GTRD-annotated differential co-expression network centrality scores; Table S2: CD8+ Tem TCZ-treated GTRD-annotated differential co-expression network centrality scores; Table S3: CD8+ Temra untreated RA GTRD-annotated differential co-expression network centrality scores; File S1: CD8+ Tem untreated RA GTRD-annotated differential co-expression network Cytoscape file; File S2: CD8+ Tem TCZ-treated GTRD-annotated differential co-expression network Cytoscape file; File S3: CD8+ Temra untreated RA GTRD-annotated differential co-expression network Cytoscape file. Figure S1: Normalized counts of glycolysis genes in untreated RA CD8+ Tem cells and TCZ-treated RA CD8+ Tem cells. Figure S2. Normalized counts of pentose phosphate pathway genes in untreated RA CD8+ Tem cells and TCZ-treated RA CD8+ Tem cells. Figure S3. Normalized counts of TCA cycle genes in untreated RA CD8+ Tem cells and TCZ-treated RA CD8+ Tem cells. Figure S4. Normalized counts of oxidative phosphorylation complex 1 genes in untreated RA CD8+ Tem cells and TCZ-treated RA CD8+ Tem cells. Figure S5. Normalized counts of oxidative phosphorylation complex 4 genes in untreated RA CD8+ Tem cells and TCZ-treated RA CD8+ Tem cells. Figure S6. Normalized counts of oxidative phosphorylation complex 5 genes in untreated RA CD8+ Tem cells and TCZ-treated RA CD8+ Tem cells. Figure S7. Normalized counts of glycolysis genes in untreated RA CD8+ Tem cells or in untreated RA CD8+ Temra cells. Figure S8. Normalized counts of pentose phosphate pathway genes in untreated RA CD8+ Tem cells or in untreated RA CD8+ Temra cells. Figure S9. Normalized counts of TCA cycle genes in untreated RA CD8+ Tem cells or in untreated RA CD8+ Temra cells. Figure S10. Normalized counts of oxidative phosphorylation complex 1 genes in untreated RA CD8+ Tem cells or in untreated RA CD8+ Temra cells. Figure S11. Normalized counts of oxidative phosphorylation complex 4 genes in untreated RA CD8+ Tem cells or in untreated RA CD8+ Temra cells. Figure S12. Normalized counts of oxidative phosphorylation complex 45 genes in untreated RA CD8+ Tem cells or in untreated RA CD8+ Temra cells.

Author Contributions

Conceptualization, S.H. and S.R.; methodology, S.H.; software, S.H.; formal analysis, S.H.; investigation, S.H.; resources, S.R.; data curation, S.H. and S.R.; writing—original draft preparation, S.H, P.D. and S.R.; writing—review and editing, S.H, P.D. and S.R.; visualization, S.H. and P.D.; supervision, S.R.; project administration, S.R.; funding acquisition, S.R. All authors have read and agreed to the published version of the manuscript.

Funding

The authors Shilpa Harshan and Srivatsan Raghunathan were financially supported by the Institute of Bioinformatics and Applied Biotechnology (IBAB).

Institutional Review Board Statement

Not applicable.

Informed Consent Statement

Not applicable.

Data Availability Statement

A publicly available dataset was analysed in this study. These data can be found here: GSE118829. The networks generated in this study are available as Supplementary Files S1–S3.

Acknowledgments

We thank Konduru Somanadh Ravi Teja for performing quality control analysis of the downloaded fastq files during data curation. We thank Hosahalli Subramanya, the director of IBAB for his constant encouragement and support. We also thank DST-FIST (GoI) and the Department of IT, BT and S & T, GoK for the infrastructure support.

Conflicts of Interest

The authors declare no conflict of interest.

References

  1. Malmström, V.; Catrina, A.I.; Klareskog, L. The Immunopathogenesis of Seropositive Rheumatoid Arthritis: From Triggering to Targeting. Nat. Rev. Immunol. 2017, 17, 60–75. [Google Scholar] [CrossRef]
  2. Ponchel, F.; Burska, A.N.; Hunt, L.; Gul, H.; Rabin, T.; Parmar, R.; Buch, M.H.; Conaghan, P.G.; Emery, P. T-Cell Subset Abnormalities Predict Progression along the Inflammatory Arthritis Disease Continuum: Implications for Management. Sci. Rep. 2020, 10, 3669. [Google Scholar] [CrossRef] [PubMed] [Green Version]
  3. Weyand, C.M.; Goronzy, J.J. The Immunology of Rheumatoid Arthritis. Nat. Immunol. 2021, 22, 10–18. [Google Scholar] [CrossRef]
  4. Morita, T.; Shima, Y.; Wing, J.B.; Sakaguchi, S.; Ogata, A.; Kumanogoh, A. The Proportion of Regulatory T Cells in Patients with Rheumatoid Arthritis: A Meta-Analysis. PLoS ONE 2016, 11, e0162306. [Google Scholar] [CrossRef] [PubMed] [Green Version]
  5. Jiang, Q.; Yang, G.; Liu, Q.; Wang, S.; Cui, D. Function and Role of Regulatory T Cells in Rheumatoid Arthritis. Front. Immunol. 2021, 12, 626193. [Google Scholar] [CrossRef]
  6. Howie, D.; Ten Bokum, A.; Necula, A.S.; Cobbold, S.P.; Waldmann, H. The Role of Lipid Metabolism in T Lymphocyte Differentiation and Survival. Front. Immunol. 2017, 8, 1949. [Google Scholar] [CrossRef]
  7. Weyand, C.M.; Goronzy, J.J. Immunometabolism in the Development of Rheumatoid Arthritis. Immunol. Rev. 2020, 294, 177–187. [Google Scholar] [CrossRef]
  8. Souto-Carneiro, M.M.; Klika, K.D.; Abreu, M.T.; Meyer, A.P.; Saffrich, R.; Sandhoff, R.; Jennemann, R.; Kraus, F.V.; Tykocinski, L.; Eckstein, V.; et al. Effect of Increased Lactate Dehydrogenase A Activity and Aerobic Glycolysis on the Proinflammatory Profile of Autoimmune CD8+ T Cells in Rheumatoid Arthritis. Arthritis Rheumatol. 2020, 72, 2050–2064. [Google Scholar] [CrossRef] [PubMed]
  9. Takeshita, M.; Suzuki, K.; Kondo, Y.; Morita, R.; Okuzono, Y.; Koga, K.; Kassai, Y.; Gamo, K.; Takiguchi, M.; Kurisu, R.; et al. Multi-Dimensional Analysis Identified Rheumatoid Arthritis-Driving Pathway in Human T Cell. Ann. Rheum. Dis. 2019, 78, 1346–1356. [Google Scholar] [CrossRef]
  10. Yevshin, I.; Sharipov, R.; Kolmykov, S.; Kondrakhin, Y.; Kolpakov, F. GTRD: A Database on Gene Transcription Regulation—2019 Update. Nucleic Acids Res. 2019, 47, D100–D105. [Google Scholar] [CrossRef] [Green Version]
  11. Kanehisa, M.; Goto, S. KEGG: Kyoto Encyclopedia of Genes and Genomes. Nucleic Acids Res. 2000, 28, 27–30. [Google Scholar] [CrossRef] [PubMed]
  12. Kuijjer, M.L.; Hsieh, P.-H.; Quackenbush, J.; Glass, K. LionessR: Single Sample Network Inference in R. BMC Cancer 2019, 19, 1003. [Google Scholar] [CrossRef] [PubMed] [Green Version]
  13. Ritchie, M.E.; Phipson, B.; Wu, D.; Hu, Y.; Law, C.W.; Shi, W.; Smyth, G.K. Limma Powers Differential Expression Analyses for RNA-Sequencing and Microarray Studies. Nucleic Acids Res. 2015, 43, e47. [Google Scholar] [CrossRef] [PubMed]
  14. SRA Links for BioProject (Select 512670)—SRA–NCBI. Available online: https://www.ncbi.nlm.nih.gov/sra?LinkName=bioproject_sra_all&from_uid=512670 (accessed on 8 August 2019).
  15. Dobin, A.; Gingeras, T.R. Mapping RNA-Seq Reads with STAR. Curr. Protoc. Bioinform. 2015, 51, 11–14. [Google Scholar] [CrossRef] [PubMed] [Green Version]
  16. Liao, Y.; Smyth, G.K.; Shi, W. The R Package Rsubread Is Easier, Faster, Cheaper and Better for Alignment and Quantification of RNA Sequencing Reads. Nucleic Acids Res. 2019, 47, e47. [Google Scholar] [CrossRef] [Green Version]
  17. Love, M.I.; Huber, W.; Anders, S. Moderated Estimation of Fold Change and Dispersion for RNA-Seq Data with DESeq2. Genome Biol. 2014, 15, 550. [Google Scholar] [CrossRef] [Green Version]
  18. Kanehisa, M.; Sato, Y.; Kawashima, M. KEGG Mapping Tools for Uncovering Hidden Features in Biological Data. Protein Sci. 2022, 31, 47–53. [Google Scholar] [CrossRef]
  19. Nepusz, T.C.G. The Igraph Software Package for Complex Network Research. InterJ. Complex Syst. 2006, 1695, 1–9. [Google Scholar]
  20. Shannon, P.; Markiel, A.; Ozier, O.; Baliga, N.S.; Wang, J.T.; Ramage, D.; Amin, N.; Schwikowski, B.; Ideker, T. Cytoscape: A Software Environment for Integrated Models of Biomolecular Interaction Networks. Genome Res. 2003, 13, 2498–2504. [Google Scholar] [CrossRef]
  21. Sharma, D.; Surolia, A. Degree Centrality. In Encyclopedia of Systems Biology; Dubitzky, W., Wolkenhauer, O., Cho, K.-H., Yokota, H., Eds.; Springer: New York, NY, USA, 2013; p. 558. ISBN 978-1-4419-9863-7. [Google Scholar]
  22. Freeman, L.C. A Set of Measures of Centrality Based on Betweenness. Sociometry 1977, 40, 35. [Google Scholar] [CrossRef]
  23. Kleinberg, J.M. Authoritative Sources in a Hyperlinked Environment. J. ACM 1999, 46, 604–632. [Google Scholar] [CrossRef]
  24. Panigrahi, A.; O’Malley, B.W. Mechanisms of Enhancer Action: The Known and the Unknown. Genome Biol. 2021, 22, 108. [Google Scholar] [CrossRef]
  25. Fishilevich, S.; Nudel, R.; Rappaport, N.; Hadar, R.; Plaschkes, I.; Iny Stein, T.; Rosen, N.; Kohn, A.; Twik, M.; Safran, M.; et al. GeneHancer: Genome-Wide Integration of Enhancers and Target Genes in GeneCards. Database J. Biol. Databases Curation 2017, 2017, bax028. [Google Scholar] [CrossRef] [PubMed] [Green Version]
  26. Hoxhaj, G.; Manning, B.D. The PI3K-AKT Network at the Interface of Oncogenic Signalling and Cancer Metabolism. Nat. Rev. Cancer 2020, 20, 74–88. [Google Scholar] [CrossRef] [PubMed]
  27. Szwed, A.; Kim, E.; Jacinto, E. Regulation and Metabolic Functions of MTORC1 and MTORC2. Physiol. Rev. 2021, 101, 1371–1426. [Google Scholar] [CrossRef] [PubMed]
  28. Chen, E.Y.; Tan, C.M.; Kou, Y.; Duan, Q.; Wang, Z.; Meirelles, G.V.; Clark, N.R.; Ma’ayan, A. Enrichr: Interactive and Collaborative HTML5 Gene List Enrichment Analysis Tool. BMC Bioinform. 2013, 14, 128. [Google Scholar] [CrossRef] [PubMed] [Green Version]
  29. Maekawa, Y.; Minato, Y.; Ishifune, C.; Kurihara, T.; Kitamura, A.; Kojima, H.; Yagita, H.; Sakata-Yanagimoto, M.; Saito, T.; Taniuchi, I.; et al. Notch2 Integrates Signaling by the Transcription Factors RBP-J and CREB1 to Promote T Cell Cytotoxicity. Nat. Immunol. 2008, 9, 1140–1147. [Google Scholar] [CrossRef]
  30. Li, L.; Leung, D.Y.M.; Strand, M.J.; Goleva, E. ATF2 Impairs Glucocorticoid Receptor–Mediated Transactivation in Human CD8+ T Cells. Blood 2007, 110, 1570–1577. [Google Scholar] [CrossRef] [Green Version]
  31. Biniecka, M.; Canavan, M.; McGarry, T.; Gao, W.; McCormick, J.; Cregan, S.; Gallagher, L.; Smith, T.; Phelan, J.J.; Ryan, J.; et al. Dysregulated Bioenergetics: A Key Regulator of Joint Inflammation. Ann. Rheum. Dis. 2016, 75, 2192–2200. [Google Scholar] [CrossRef]
  32. Wu, B.; Qiu, J.; Zhao, T.V.; Wang, Y.; Maeda, T.; Goronzy, I.N.; Akiyama, M.; Ohtsuki, S.; Jin, K.; Tian, L.; et al. Succinyl-CoA Ligase Deficiency in Pro-Inflammatory and Tissue-Invasive T Cells. Cell Metab. 2020, 32, 967–980.e5. [Google Scholar] [CrossRef]
  33. Chang, X.; Xia, Y.; Pan, J.; Meng, Q.; Zhao, Y.; Yan, X. PADI2 Is Significantly Associated with Rheumatoid Arthritis. PLoS ONE 2013, 8, e81259. [Google Scholar] [CrossRef]
  34. Guzmán-Guzmán, I.P.; Ramírez-Vélez, C.I.; Falfán-Valencia, R.; Navarro-Zarza, J.E.; Gutiérrez-Pérez, I.A.; Zaragoza-García, O.; Ramírez, M.; Castro-Alarcón, N.; Parra-Rojas, I. PADI2 Polymorphisms Are Significantly Associated with Rheumatoid Arthritis, Autoantibodies Serologic Status and Joint Damage in Women from Southern Mexico. Front. Immunol. 2021, 12, 718246. [Google Scholar] [CrossRef] [PubMed]
  35. Wei, H.; Geng, J.; Shi, B.; Liu, Z.; Wang, Y.-H.; Stevens, A.C.; Sprout, S.L.; Yao, M.; Wang, H.; Hu, H. Foxp1 Controls Naive CD8+ T Cell Quiescence by Simultaneously Repressing Key Pathways in Cellular Metabolism and Cell Cycle Progression. J. Immunol. 2016, 196, 3537–3541. [Google Scholar] [CrossRef] [Green Version]
  36. Xu, J.; Chen, G.; Yan, Z.; Qiu, M.; Tong, W.; Zhang, X.; Zhang, L.; Zhu, Y.; Liu, K. Effect of Mannose-binding Lectin Gene Polymorphisms on the Risk of Rheumatoid Arthritis: Evidence from a Meta-analysis. Int. J. Rheum. Dis. 2021, 24, 300–313. [Google Scholar] [CrossRef]
  37. Ku, H.-C.; Cheng, C.-F. Master Regulator Activating Transcription Factor 3 (ATF3) in Metabolic Homeostasis and Cancer. Front. Endocrinol. 2020, 11, 556. [Google Scholar] [CrossRef]
  38. Liu, B.; Shats, I.; Angus, S.P.; Gatza, M.L.; Nevins, J.R. Interaction of E2F7 Transcription Factor with E2F1 and C-Terminal-Binding Protein (CtBP) Provides a Mechanism for E2F7-Dependent Transcription Repression. J. Biol. Chem. 2013, 288, 24581–24589. [Google Scholar] [CrossRef] [Green Version]
  39. Denechaud, P.-D.; Fajas, L.; Giralt, A. E2F1, a Novel Regulator of Metabolism. Front. Endocrinol. 2017, 8, 311. [Google Scholar] [CrossRef] [PubMed]
  40. Nagy, G.; Koncz, A.; Telarico, T.; Fernandez, D.; Érsek, B.; Buzás, E.; Perl, A. Central Role of Nitric Oxide in the Pathogenesis of Rheumatoid Arthritis and Sysemic Lupus Erythematosus. Arthritis Res. Ther. 2010, 12, 210. [Google Scholar] [CrossRef] [Green Version]
  41. Stomberski, C.T.; Anand, P.; Venetos, N.M.; Hausladen, A.; Zhou, H.-L.; Premont, R.T.; Stamler, J.S. AKR1A1 Is a Novel Mammalian S-Nitroso-Glutathione Reductase. J. Biol. Chem. 2019, 294, 18285–18293. [Google Scholar] [CrossRef]
  42. Zhang, M.; Iwata, S.; Sonomoto, K.; Ueno, M.; Fujita, Y.; Anan, J.; Miyazaki, Y.; Ohkubo, N.; Sumikawa, M.H.; Todoroki, Y.; et al. MTOR Activation in CD8+ Cells Contributes to Disease Activity of Rheumatoid Arthritis and Increases Therapeutic Response to TNF Inhibitors. Rheumatology 2021, 61, keab834. [Google Scholar] [CrossRef] [PubMed]
  43. Chang, C.-H.; Curtis, J.D.; Maggi, L.B.; Faubert, B.; Villarino, A.V.; O’Sullivan, D.; Huang, S.C.-C.; van der Windt, G.J.W.; Blagih, J.; Qiu, J.; et al. Posttranscriptional Control of T Cell Effector Function by Aerobic Glycolysis. Cell 2013, 153, 1239–1251. [Google Scholar] [CrossRef] [Green Version]
  44. Kornberg, M.D.; Bhargava, P.; Kim, P.M.; Putluri, V.; Snowman, A.M.; Putluri, N.; Calabresi, P.A.; Snyder, S.H. Dimethyl Fumarate Targets GAPDH and Aerobic Glycolysis to Modulate Immunity. Science 2018, 360, 449–453. [Google Scholar] [CrossRef] [Green Version]
  45. Shestov, A.A.; Liu, X.; Ser, Z.; Cluntun, A.A.; Hung, Y.P.; Huang, L.; Kim, D.; Le, A.; Yellen, G.; Albeck, J.G.; et al. Quantitative Determinants of Aerobic Glycolysis Identify Flux through the Enzyme GAPDH as a Limiting Step. eLife 2014, 3, e03342. [Google Scholar] [CrossRef]
  46. Garcin, E.D. GAPDH as a Model Non-Canonical AU-Rich RNA Binding Protein. Semin. Cell Dev. Biol. 2019, 86, 162–173. [Google Scholar] [CrossRef] [PubMed]
  47. Ambrus, A.; Adam-Vizi, V. Human Dihydrolipoamide Dehydrogenase (E3) Deficiency: Novel Insights into the Structural Basis and Molecular Pathomechanism. Neurochem. Int. 2018, 117, 5–14. [Google Scholar] [CrossRef] [Green Version]
  48. Chinopoulos, C. Which Way Does the Citric Acid Cycle Turn during Hypoxia? The Critical Role of α-Ketoglutarate Dehydrogenase Complex. J. Neurosci. Res. 2013, 91, 1030–1043. [Google Scholar] [CrossRef] [PubMed] [Green Version]
  49. McLain, A.L.; Szweda, P.A.; Szweda, L.I. α-Ketoglutarate Dehydrogenase: A Mitochondrial Redox Sensor. Free Radic. Res. 2011, 45, 29–36. [Google Scholar] [CrossRef] [Green Version]
  50. Ma, T.; Peng, Y.; Huang, W.; Ding, J. Molecular Mechanism of the Allosteric Regulation of the Aγ Heterodimer of Human NAD-Dependent Isocitrate Dehydrogenase. Sci. Rep. 2017, 7, 40921. [Google Scholar] [CrossRef] [PubMed] [Green Version]
  51. Patel, M.S.; Nemeria, N.S.; Furey, W.; Jordan, F. The Pyruvate Dehydrogenase Complexes: Structure-Based Function and Regulation. J. Biol. Chem. 2014, 289, 16615–16623. [Google Scholar] [CrossRef] [PubMed] [Green Version]
  52. Gray, L.R.; Tompkins, S.C.; Taylor, E.B. Regulation of Pyruvate Metabolism and Human Disease. Cell. Mol. Life Sci. 2014, 71, 2577–2604. [Google Scholar] [CrossRef] [PubMed] [Green Version]
  53. Blagih, J.; Coulombe, F.; Vincent, E.E.; Dupuy, F.; Galicia-Vázquez, G.; Yurchenko, E.; Raissi, T.C.; van der Windt, G.J.W.; Viollet, B.; Pearce, E.L.; et al. The Energy Sensor AMPK Regulates T Cell Metabolic Adaptation and Effector Responses in Vivo. Immunity 2015, 42, 41–54. [Google Scholar] [CrossRef] [PubMed] [Green Version]
  54. Holness, M.J.; Sugden, M.C. Regulation of Pyruvate Dehydrogenase Complex Activity by Reversible Phosphorylation. Biochem. Soc. Trans. 2003, 31, 1143–1151. [Google Scholar] [CrossRef] [PubMed]
  55. Kühlbrandt, W. Structure and Mechanisms of F-Type ATP Synthases. Annu. Rev. Biochem. 2019, 88, 515–549. [Google Scholar] [CrossRef] [PubMed]
  56. Dunham-Snary, K.J.; Wu, D.; Potus, F.; Sykes, E.A.; Mewburn, J.D.; Charles, R.L.; Eaton, P.; Sultanian, R.A.; Archer, S.L. Ndufs2, a Core Subunit of Mitochondrial Complex I, Is Essential for Acute Oxygen-Sensing and Hypoxic Pulmonary Vasoconstriction. Circ. Res. 2019, 124, 1727–1746. [Google Scholar] [CrossRef]
  57. Yi, J.S.; Holbrook, B.C.; Michalek, R.D.; Laniewski, N.G.; Grayson, J.M. Electron Transport Complex I Is Required for CD8+ T Cell Function. J. Immunol. 2006, 177, 852–862. [Google Scholar] [CrossRef] [Green Version]
  58. Yin, M.; O’Neill, L.A.J. The Role of the Electron Transport Chain in Immunity. FASEB J. Off. Publ. Fed. Am. Soc. Exp. Biol. 2021, 35, e21974. [Google Scholar] [CrossRef]
  59. Ambrus, A.; Nemeria, N.S.; Torocsik, B.; Tretter, L.; Nilsson, M.; Jordan, F.; Adam-Vizi, V. Formation of Reactive Oxygen Species by Human and Bacterial Pyruvate and 2-Oxoglutarate Dehydrogenase Multienzyme Complexes Reconstituted from Recombinant Components. Free Radic. Biol. Med. 2015, 89, 642–650. [Google Scholar] [CrossRef] [Green Version]
  60. Weyand, C.M.; Shen, Y.; Goronzy, J.J. Redox-Sensitive Signaling in Inflammatory T Cells and in Autoimmune Disease. Free Radic. Biol. Med. 2018, 125, 36–43. [Google Scholar] [CrossRef]
  61. Yi, M.; Ban, Y.; Tan, Y.; Xiong, W.; Li, G.; Xiang, B. 6-Phosphofructo-2-Kinase/Fructose-2,6-Biphosphatase 3 and 4: A Pair of Valves for Fine-Tuning of Glucose Metabolism in Human Cancer. Mol. Metab. 2018, 20, 1–13. [Google Scholar] [CrossRef]
  62. Jelkmann, W. Regulation of Erythropoietin Production. J. Physiol. 2011, 589, 1251–1258. [Google Scholar] [CrossRef]
  63. Kamura, T.; Sato, S.; Iwai, K.; Czyzyk-Krzeska, M.; Conaway, R.C.; Conaway, J.W. Activation of HIF1α Ubiquitination by a Reconstituted von Hippel-Lindau (VHL) Tumor Suppressor Complex. Proc. Natl. Acad. Sci. USA 2000, 97, 10430–10435. [Google Scholar] [CrossRef] [Green Version]
  64. Minchenko, O.H.; Tsuchihara, K.; Minchenko, D.O.; Bikfalvi, A.; Esumi, H. Mechanisms of Regulation of PFKFB Expression in Pancreatic and Gastric Cancer Cells. World J. Gastroenterol. 2014, 20, 13705–13717. [Google Scholar] [CrossRef] [PubMed]
  65. Minchenko, O.; Opentanova, I.; Minchenko, D.; Ogura, T.; Esumi, H. Hypoxia Induces Transcription of 6-Phosphofructo-2-Kinase/Fructose-2,6-Biphosphatase-4 Gene via Hypoxia-Inducible Factor-1α Activation. FEBS Lett. 2004, 576, 14–20. [Google Scholar] [CrossRef] [PubMed] [Green Version]
  66. Gülich, A.F.; Rica, R.; Tizian, C.; Viczenczova, C.; Khamina, K.; Faux, T.; Hainberger, D.; Penz, T.; Bosselut, R.; Bock, C.; et al. Complex Interplay Between MAZR and Runx3 Regulates the Generation of Cytotoxic T Lymphocyte and Memory T Cells. Front. Immunol. 2021, 12, 535039. [Google Scholar] [CrossRef]
  67. Shan, Q.; Li, X.; Chen, X.; Zeng, Z.; Zhu, S.; Gai, K.; Peng, W.; Xue, H.-H. Tcf1 and Lef1 Provide Constant Supervision to Mature CD8+ T Cell Identity and Function by Organizing Genomic Architecture. Nat. Commun. 2021, 12, 5863. [Google Scholar] [CrossRef]
  68. Yalcin, A.; Clem, B.F.; Imbert-Fernandez, Y.; Ozcan, S.C.; Peker, S.; O’Neal, J.; Klarer, A.C.; Clem, A.L.; Telang, S.; Chesney, J. 6-Phosphofructo-2-Kinase (PFKFB3) Promotes Cell Cycle Progression and Suppresses Apoptosis via Cdk1-Mediated Phosphorylation of P27. Cell Death Dis. 2014, 5, e1337. [Google Scholar] [CrossRef] [PubMed]
  69. Zhang, H.; Gao, P.; Fukuda, R.; Kumar, G.; Krishnamachary, B.; Zeller, K.I.; Dang, C.V.; Semenza, G.L. HIF-1 Inhibits Mitochondrial Biogenesis and Cellular Respiration in VHL-Deficient Renal Cell Carcinoma by Repression of C-MYC Activity. Cancer Cell 2007, 11, 407–420. [Google Scholar] [CrossRef] [Green Version]
  70. Hough, K.P.; Chisolm, D.A.; Weinmann, A.S. Transcriptional Regulation of T Cell Metabolism. Mol. Immunol. 2015, 68, 520–526. [Google Scholar] [CrossRef] [Green Version]
  71. Wolfraim, L.A.; Letterio, J.J. Cutting Edge: P27Kip1 Deficiency Reduces the Requirement for CD28-Mediated Costimulation in Naive CD8+ but Not CD4+ T Lymphocytes. J. Immunol. 2005, 174, 2481–2484. [Google Scholar] [CrossRef] [Green Version]
  72. Sui, Y.; Gu, R.; Janknecht, R. Crucial Functions of the JMJD1/KDM3 Epigenetic Regulators in Cancer. Mol. Cancer Res. MCR 2021, 19, 3–13. [Google Scholar] [CrossRef]
  73. Zhu, W.; Zhou, B.; Rong, L.; Ye, L.; Xu, H.; Zhou, Y.; Yan, X.; Liu, W.; Zhu, B.; Wang, L.; et al. Roles of PTBP1 in Alternative Splicing, Glycolysis, and Oncogensis. J. Zhejiang Univ. Sci. B 2020, 21, 122–136. [Google Scholar] [CrossRef]
  74. Deng, Y.; Li, H.; Yin, X.; Liu, H.; Liu, J.; Guo, D.; Shi, Z. C-Terminal Binding Protein 1 Modulates Cellular Redox via Feedback Regulation of MPC1 and MPC2 in Melanoma Cells. Med. Sci. Monit. Int. Med. J. Exp. Clin. Res. 2018, 24, 7614–7624. [Google Scholar] [CrossRef]
  75. Xie, M.; Fu, X.; Jiang, K. Notch1/TAZ Axis Promotes Aerobic Glycolysis and Immune Escape in Lung Cancer. Cell Death Dis. 2021, 12, 832. [Google Scholar] [CrossRef] [PubMed]
  76. Rodrigues, D.C.; Harvey, E.M.; Suraj, R.; Erickson, S.L.; Mohammad, L.; Ren, M.; Liu, H.; He, G.; Kaplan, D.R.; Ellis, J.; et al. Methylglyoxal Couples Metabolic and Translational Control of Notch Signalling in Mammalian Neural Stem Cells. Nat. Commun. 2020, 11, 2018. [Google Scholar] [CrossRef] [Green Version]
  77. Huang, Y.; Bell, L.N.; Okamura, J.; Kim, M.S.; Mohney, R.P.; Guerrero-Preston, R.; Ratovitski, E.A. Phospho-ΔNp63α/SREBF1 Protein Interactions. Cell Cycle 2012, 11, 3810–3827. [Google Scholar] [CrossRef] [PubMed] [Green Version]
  78. Itahana, Y.; Itahana, K. Emerging Roles of P53 Family Members in Glucose Metabolism. Int. J. Mol. Sci. 2018, 19, 776. [Google Scholar] [CrossRef] [Green Version]
  79. D’Alessandro, A.; Amelio, I.; Berkers, C.R.; Antonov, A.; Vousden, K.H.; Melino, G.; Zolla, L. Metabolic Effect of TAp63α: Enhanced Glycolysis and Pentose Phosphate Pathway, Resulting in Increased Antioxidant Defense. Oncotarget 2014, 5, 7722–7733. [Google Scholar] [CrossRef] [PubMed] [Green Version]
  80. Pankratz, S.L.; Tan, E.Y.; Fine, Y.; Mercurio, A.M.; Shaw, L.M. Insulin Receptor Substrate-2 Regulates Aerobic Glycolysis in Mouse Mammary Tumor Cells via Glucose Transporter 1. J. Biol. Chem. 2009, 284, 2031–2037. [Google Scholar] [CrossRef] [Green Version]
  81. Scott, L.J. Tocilizumab: A Review in Rheumatoid Arthritis. Drugs 2017, 77, 1865–1879. [Google Scholar] [CrossRef] [Green Version]
  82. Grasmann, G.; Smolle, E.; Olschewski, H.; Leithner, K. Gluconeogenesis in Cancer Cells—Repurposing of a Starvation-Induced Metabolic Pathway? Biochim. Biophys. Acta Rev. Cancer 2019, 1872, 24–36. [Google Scholar] [CrossRef]
  83. Steen, H.C.; Gamero, A.M. STAT2 Phosphorylation and Signaling. JAK-STAT 2013, 2, e25790. [Google Scholar] [CrossRef] [PubMed] [Green Version]
  84. Nan, J.; Wang, Y.; Yang, J.; Stark, G.R. IRF9 and Unphosphorylated STAT2 Cooperate with NF-ΚB to Drive IL6 Expression. Proc. Natl. Acad. Sci. USA 2018, 115, 3906–3911. [Google Scholar] [CrossRef] [PubMed] [Green Version]
  85. Hashiramoto, A.; Yamane, T.; Tsumiyama, K.; Yoshida, K.; Komai, K.; Yamada, H.; Yamazaki, F.; Doi, M.; Okamura, H.; Shiozawa, S. Mammalian Clock Gene Cryptochrome Regulates Arthritis via Proinflammatory Cytokine TNF-α. J. Immunol. 2010, 184, 1560–1565. [Google Scholar] [CrossRef] [Green Version]
  86. Zhang, J.; Wencker, M.; Marliac, Q.; Berton, A.; Hasan, U.; Schneider, R.; Laubreton, D.; Cherrier, D.E.; Mathieu, A.-L.; Rey, A.; et al. Zeb1 Represses TCR Signaling, Promotes the Proliferation of T Cell Progenitors and Is Essential for NK1.1+ T Cell Development. Cell. Mol. Immunol. 2021, 18, 2140–2152. [Google Scholar] [CrossRef]
  87. Han, X.; Liu, F.; Zhang, C.; Ren, Z.; Li, L.; Wang, G. SIAH1/ZEB1/IL-6 Axis Is Involved in Doxorubicin (Dox) Resistance of Osteosarcoma Cells. Biol. Chem. 2019, 400, 545–553. [Google Scholar] [CrossRef]
  88. Tarnopolsky, M.A. Myopathies Related to Glycogen Metabolism Disorders. Neurotherapeutics 2018, 15, 915–927. [Google Scholar] [CrossRef] [Green Version]
  89. Pancholi, V. Multifunctional Alpha-Enolase: Its Role in Diseases. Cell. Mol. Life Sci. CMLS 2001, 58, 902–920. [Google Scholar] [CrossRef]
  90. Hutton, J.C.; O’Brien, R.M. Glucose-6-Phosphatase Catalytic Subunit Gene Family. J. Biol. Chem. 2009, 284, 29241–29245. [Google Scholar] [CrossRef] [Green Version]
  91. Ancey, P.-B.; Contat, C.; Meylan, E. Glucose Transporters in Cancer—From Tumor Cells to the Tumor Microenvironment. FEBS J. 2018, 285, 2926–2943. [Google Scholar] [CrossRef]
  92. Vaupel, P.; Multhoff, G. Revisiting the Warburg Effect: Historical Dogma versus Current Understanding. J. Physiol. 2021, 599, 1745–1757. [Google Scholar] [CrossRef]
  93. Wang, R.; Dillon, C.P.; Shi, L.Z.; Milasta, S.; Carter, R.; Finkelstein, D.; McCormick, L.L.; Fitzgerald, P.; Chi, H.; Munger, J.; et al. The Transcription Factor Myc Controls Metabolic Reprogramming upon T Lymphocyte Activation. Immunity 2011, 35, 871–882. [Google Scholar] [CrossRef] [PubMed] [Green Version]
  94. Kim, J.; Gao, P.; Liu, Y.-C.; Semenza, G.L.; Dang, C.V. Hypoxia-Inducible Factor 1 and Dysregulated c-Myc Cooperatively Induce Vascular Endothelial Growth Factor and Metabolic Switches Hexokinase 2 and Pyruvate Dehydrogenase Kinase 1. Mol. Cell. Biol. 2007, 27, 7381–7393. [Google Scholar] [CrossRef] [PubMed] [Green Version]
  95. Kim, J.; Tchernyshyov, I.; Semenza, G.L.; Dang, C.V. HIF-1-Mediated Expression of Pyruvate Dehydrogenase Kinase: A Metabolic Switch Required for Cellular Adaptation to Hypoxia. Cell Metab. 2006, 3, 177–185. [Google Scholar] [CrossRef] [PubMed] [Green Version]
  96. Tech, K.; Deshmukh, M.; Gershon, T.R. Adaptations of Energy Metabolism during Cerebellar Neurogenesis Are Co-Opted in Medulloblastoma. Cancer Lett. 2015, 356, 268–272. [Google Scholar] [CrossRef] [Green Version]
  97. Chowdhury, P.S.; Chamoto, K.; Kumar, A.; Honjo, T. PPAR-Induced Fatty Acid Oxidation in T Cells Increases the Number of Tumor-Reactive CD8+ T Cells and Facilitates Anti-PD-1 Therapy. Cancer Immunol. Res. 2018, 6, 1375–1387. [Google Scholar] [CrossRef]
  98. Ke, Q.; Costa, M. Hypoxia-Inducible Factor-1 (HIF-1). Mol. Pharmacol. 2006, 70, 1469–1480. [Google Scholar] [CrossRef]
  99. Francois, M.; Donovan, P.; Fontaine, F. Modulating Transcription Factor Activity: Interfering with Protein-Protein Interaction Networks. Semin. Cell Dev. Biol. 2020, 99, 12–19. [Google Scholar] [CrossRef]
Figure 1. Overview of the workflow. TF—transcription factor; IFX—infliximab–methotrexate combination therapy; MTX—methotrexate monotherapy; TCZ—tocilizumab monotherapy.
Genes 13 01216 g001
Figure 2. Construction of the GTRD-annotated differential co-expression network. The GTRD database contains transcription factors (triangles) and target genes (circles). The presence of a binding site for the transcription factor in the promoter region of the target gene is shown by an arrow pointing from the transcription factor (TF) to the target gene. A TF–TF interaction is also shown. The differential co-expression network has gene pairs that show significantly increased edge weights (purple connector) or significantly decreased edge weights (green connector) in the comparison. The connections are not directed (connector without arrow) and may occur between any two genes. The GTRD-annotated differential co-expression network has TF–TF edges or TF–target gene edges if the edge is present in both GTRD and the differential co-expression network. The direction for the edge is annotated using GTRD. Purple arrows show a TF–target gene or TF–TF interaction where the edge weight is increased, and green arrows show one where the edge weight is decreased. There are no target gene–target gene edges in this network.
Genes 13 01216 g002
Figure 3. Number of transcription factor binding sites for transcription factors that interact with PFKFB3, DLD or GAPDH, as annotated by GTRD and GeneHancer. Grey bars represent the number of TF binding sites in the interval −1000 to +100 around the transcription start site of the target gene according to GTRD. Yellow bars represent the number of TF binding sites outside the interval −1000 to +100 around the transcription start site of the target gene according to GeneHancer. (A) The transcription factors binding sites for PFKFB3, (B) The binding sites for DLD, (C) The binding sites for GAPDH.
Genes 13 01216 g003
Figure 4. Subgraph of differentially expressed glycolysis-related enzymes with high centrality scores in the GTRD-annotated network of edges with significantly different edge weights between untreated RA and healthy control samples, in CD8+ Tem cells. The differentially expressed transcription factors that link to the enzymes are shown. Triangles indicate transcription factors, and circles indicate target genes. Node colour shows the direction of differential expression: red nodes are over-expressed and blue are under-expressed. The presence of an edge between a TF and a target gene refers to a significant difference in the edge weights of that gene pair between untreated RA samples and healthy samples. Purple edges show higher edge weight in RA, and green shows higher edge weight in healthy samples.
Genes 13 01216 g004
Figure 5. Subgraph of differentially expressed glycolysis-related enzymes with high degree centrality in the GeneHancer-annotated network of edges with significantly different edge weights between untreated RA and healthy control samples, in CD8+ Tem cells. The differentially expressed transcription factors that link to the enzymes are shown. Triangles indicate transcription factors and circles indicate target genes. Node colour shows the direction of differential expression: red nodes are over-expressed and blue nodes are under-expressed. The presence of an edge between a TF and a target gene refers to a significant difference in the edge weights of that gene pair between untreated RA samples and healthy samples. Purple edges show higher edge weight in RA, and green shows higher edge weight in healthy samples.
Genes 13 01216 g005
Figure 6. The transcription factors that have edges with both PFKFB3 and PFKFB4 in the RA CD8+ Tem cell GTRD and GeneHancer-annotated networks of differentially co-expressed edges. (A) The subgraph from the GTRD-annotated network (B) The subgraph from the GeneHancer-annotated network. Triangles indicate transcription factors and circles indicate target genes. Node colour shows the direction of differential expression: red nodes are over-expressed and blue nodes are under-expressed. The presence of an edge between a TF and a target gene refers to a significant difference in the edge weights of that gene pair between untreated RA samples and healthy samples. Purple edges show higher edge weight in RA, and green shows higher edge weight in healthy samples.
Genes 13 01216 g006
Figure 7. Subgraph of differentially expressed glycolysis-related enzymes with high centrality scores in the GTRD-annotated network of edges with significantly different edge weights between tocilizumab-treated RA and untreated RA samples, in CD8+ Tem cells. The differentially expressed transcription factors that link to the enzymes are shown. Triangles indicate transcription factors, and circles indicate target genes. Node colour shows the direction of differential expression: red nodes are over-expressed and blue nodes are under-expressed. The presence of an edge between a TF and a target gene refers to a significant difference in the edge weights of that gene pair between untreated RA samples and healthy samples. Purple edges show higher edge weight in RA, and green shows higher edge weight in healthy samples.
Genes 13 01216 g007
Figure 8. Subgraph of MYC, PPARG and INSR and their target genes in the GTRD-annotated network of edges with significantly different edge weights between untreated RA and healthy samples in CD8+ Temra cells. The differentially expressed transcription factors that link to the enzymes are shown. Triangles indicate transcription factors and circles indicate target genes. Node colour shows the direction of differential expression: red nodes are over-expressed, blue nodes are under-expressed and white nodes are not differentially expressed. The presence of an edge between a TF and a target gene refers to a significant difference in the edge weights of that gene pair between untreated RA samples and healthy samples. Purple edges show higher edge weight in RA, and green shows a higher edge weight in healthy samples.
Genes 13 01216 g008
Figure 9. Subgraph of MYC, PPARG and INSR and their target genes in the GeneHancer annotated network of edges with significantly different edge weights between untreated RA and healthy samples, in CD8+ Temra cells. The differentially expressed transcription factors that link to the enzymes are shown. Triangles indicate transcription factors and circles indicate target genes. Node color shows the direction of differential expression: red nodes are over-expressed, blue nodes are under-expressed and white nodes are not differentially expressed. The presence of an edge between a TF and a target gene refers to a significant difference in the edge weights of that gene pair between untreated RA samples and healthy samples. Purple edges show higher edge weight in RA, and green shows higher edge weight in healthy samples.
Genes 13 01216 g009
Figure 10. Normalized counts of genes associated with metabolic pathways or the regulation of glycolysis that show differential regulation in untreated RA CD8+ Tem cells or in TCZ-treated RA CD8+ Tem cells. Significant differential regulation is shown by asterisks (***).
Genes 13 01216 g010
Figure 11. Normalized counts of genes associated with metabolic pathways or the regulation of glycolysis that show differential regulation in untreated RA CD8+ Tem cells or in untreated RA CD8+ Temra cells. Significant differential regulation is shown by asterisks (***).
Genes 13 01216 g011
Figure 12. The differentially expressed genes of RA CD8+ Tem cells in the PI3K-AKT pathway. Red indicates upregulated genes and blue indicates downregulated genes.
Genes 13 01216 g012
Figure 13. The differentially expressed genes of RA CD8+ Tem cells in the mTOR signalling pathway. Red indicates upregulated genes and blue indicates downregulated genes.
Genes 13 01216 g013
Figure 14. The differentially expressed genes of RA CD8+ Temra cells in the PI3K-AKT pathway. Red indicates upregulated genes and blue indicates downregulated genes.
Genes 13 01216 g014
Figure 15. The differentially expressed genes of RA CD8+ Temra cells in the mTOR pathway. Red indicates upregulated genes and blue indicates downregulated genes.
Genes 13 01216 g015
Figure 16. Differential expression of enzymes involved in glycolysis, pentose phosphate pathway, TCA cycle and oxidative phosphorylation in RA CD8+ Tem cells. Solid red UP arrows indicate upregulation/increased activity. Solid blue down arrows indicate downregulation. Light red arrows indicate statistically significant upregulation with low read counts. Pathways where the overall effect of differential regulation on the activity of the pathway is ambiguous are marked by a question mark. PPP—pentose phosphate pathway; G6P—glucose-6-phosphate; F6P—fructose-6-phosphate; GA3P—glyceraldehyde-3-phosphate.
Genes 13 01216 g016
Figure 17. 
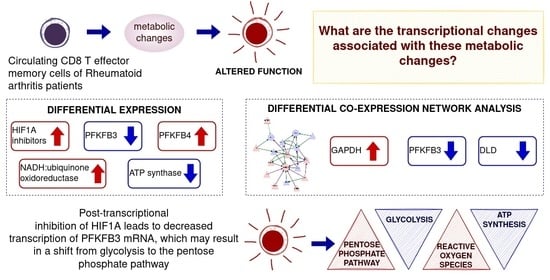
Proposed model for the regulation of glycolysis and pentose phosphate pathway in RA CD8+ Tem cells. EGLN3, ELOB and GAPDH are upregulated as indicated by the red up arrows. This leads to the inhibition of HIF1A (red T—shaped connector). HIF1A-mediated upregulation of PFKFB3 (black dotted arrow) is blocked (red X) leading to the downregulation of PFKFB3 (blue down arrow). The PFKFB3 catalysed increase in fructose 2, 6 bisphosphate (F 2,6 BP) is abolished, so F 2,6 BP-mediated allosteric activation of phosphofructokinase (PFK) is lost, and the commitment step of glycolysis does not occur. This leads to reduced glycolysis. PFKFB3 downregulation causes a reduction in the ratio of PFKFB3 with G6PD (glucose 6 phosphate dehydrogenase) leading to increased pentose phosphate pathway activity.
Genes 13 01216 g017
Figure 18. Differentially expressed transcription factors which show differential co-expression with GAPDH in RA CD8+ Tem cells. Red boxes show genes that are upregulated, and blue boxes show those that are downregulated. The transcription factors with increased edge weights are shown in the purple box and those with reduced edge weights with GAPDH in RA are shown in the green box. The functions of each transcription factor are also shown.
Genes 13 01216 g018
Figure 19. RA CD8+ Tem differentially expressed genes in the PI3K-AKT pathway and the mTOR pathway. Red up arrows indicate upregulation and blue down arrows indicate downregulation. Red connectors indicate the effect of the differentially regulated genes on their targets, whereas T shaped arrows indicate the inhibition and normal arrows indicate activation.
Genes 13 01216 g019
Figure 20. The differentially regulated genes involved in the regulation of glycolysis in RA CD8+ Tem cells. Post transcriptional inhibition of HIF1A by the upregulated ELOB, EGLN3 and GAPDH (red up arrow) inhibits HIF1A activity resulting in the downregulation of PFKFB3 (blue down arrow). This causes reduced activity of the glycolytic enzyme PFK (light blue down arrow) and increased activity of the pentose phosphate pathway enzyme G6PD (light red up arrow). The upregulated transcription factor TP63 (red up arrow) causes increased expression of GAPDH (red up arrow). IRS2 is downregulated (blue down arrow), while RPS6KA1, HRAS and LAMTOR2 are upregulated (red up arrow) upstream of mTOR. The effect of these changes in mTOR cannot be determined in this study (question mark). The pentose phosphate pathway genes, IDNK and TALDO1, are also upregulated (red up arrow).
Genes 13 01216 g020
Figure 21. RA CD8+ Temra differentially expressed genes in the PI3K-AKT pathway and the mTOR pathway. Red up arrows indicate upregulation. Red arrows indicate the effect of the differentially regulated genes on their targets, where T shaped arrows indicate inhibition and normal arrows indicate activation. Dotted arrows indicate the presence of intermediate steps between the two connected proteins. Red crosses show the interactions that are lost in the RA CD8+ Temra cells due to inhibition or downregulation of the upstream proteins.
Genes 13 01216 g021
Figure 22. The differentially regulated genes involved in the regulation of glycolysis in RA CD8+ Temra cells. Post transcriptional inhibition of HIF1A by the upregulated ELOB and EGLN3 (red up arrow) and the downregulation of HIF1A co-activator EP300 (blue down arrow) inhibit HIF1A activity. AKT1S1 is downregulated (blue down arrow), while RPS6KA1, IL6R, WNT7A and LRP5 are upregulated (red up arrow) upstream of mTOR. AKT and mTOR may be activated in RA CD8+ Temra cells (light red up arrow and question mark). This may be the cause of the upregulation of MYC (red up arrow). Glycolysis target genes of MYC and HIF1A do not show differential regulation (black = signs). AKT and mTOR activity may increase the activity of glycolysis genes HK, PDK1, PFKFB2 and GLUT1-4 (light red up arrow and question mark). ENO3 and PDHA1 are upregulated (red up arrow).
Genes 13 01216 g022
Table 1. Details of the samples in the data set GSE118829.
GroupCell TypeTotal SamplesGenderAge
Healthy controlCD4+ Tn97f, 2m45–77
CD4+ Tcm108f, 2m
CD4+ Tem108f, 2m
CD8+ Tn108f, 2m
CD8+ Tcm86f, 2m
CD8+ Tem108f, 2m
CD8+ Temra97f, 2m
Untreated RACD4+ Tn108f, 2m46–68
CD4+ Tcm108f, 2m
CD4+ Tem97f, 2m
CD8+ Tn97f, 2m
CD8+ Tcm75f, 2m
CD8+ Tem87f, 1m
CD8+ Temra86f, 2m
Infliximab-treatedCD4+ Tn98f, 1m44–66
CD4+ Tcm109f, 1m
CD4+ Tem98f, 1m
CD8+ Tn98f, 1m
CD8+ Tcm109f, 1m
CD8+ Tem65f, 1m
CD8+ Temra87f, 1m
Methotrexate-treatedCD4+ Tn109f, 1m28–76
CD4+ Tcm98f, 1m
CD4+ Tem87f, 1m
CD8+ Tn87f, 1m
CD8+ Tcm43f, 1m
CD8+ Tem98f, 1m
CD8+ Temra65f, 1m
Tocilizumab-treatedCD4+ Tn1010f44–73
CD4+ Tcm1010f
CD4+ Tem1010f
CD8+ Tn1010f
CD8+ Tcm88f
CD8+ Tem1010f
CD8+ Temra77f
Synovial fluidCD4+ Tn0 71
CD4+ Tcm43f, 1m
CD4+ Tem33f
CD8+ Tn0
CD8+ Tcm11m
CD8+ Tem11f
CD8+ Temra11f
Table 2. Upregulated and downregulated genes of untreated RA compared with healthy samples of T cell subsets.
Cell TypeUpregulated GenesDownregulated Genes
CD4+ Tn125
CD4+ Tcm1063
CD4+ Tem31
CD8+ Tn215
CD8+ Tcm37
CD8+ Tem1617164
CD8+ Temra843291
Table 3. Upregulated and downregulated genes of treated RA compared with untreated RA samples of T cell subsets.
Cell TypeMethotrexateInfliximabTocilizumab
UPDOWNUPDOWNUPDOWN
CD4+ Tn19124420
CD4+ Tcm111824
CD4+ Tem220346
CD8+ Tn165102619711
CD8+ Tcm362333
CD8+ Tem261347911047
CD8+ Temra 45266351301259
Table 4. Enriched transcription factor of the downregulated gene list from untreated RA CD8+ Tem cells.
TermOverlapp-ValueAdjusted p-ValueOdds Ratio
CREB1 CHEA30/14442.04 × 10−60.00012.92
UBTF ENCODE33/16311.02 × 10−60.00012.88
CREB1 ENCODE38/22389.19 × 10−60.00032.42
ZNF384 ENCODE17/7300.000110.00263.10
SUZ12 CHEA25/16840.00270.05251.97
PBX3 ENCODE20/12690.00380.06162.07
ATF2 ENCODE36/28520.0050.06891.69
BHLHE40 ENCODE8/3480.00810.09962.94
ZEB1 ENCODE4/1060.0110.10104.84
MAX ENCODE27/20730.0100.10101.71
Table 5. Enriched transcription factor of the downregulated gene list from untreated RA CD8+ Temra cells.
TermOverlapp-ValueAdjusted p-ValueOdds Ratio
TAF1 ENCODE95/33461.69 × 10−111.73 × 10−92.45
CREB1 CHEA51/14442.89 × 10−91.48 × 10−72.79
GABPA ENCODE64/20824.99 × 10−91.69 × 10−72.47
UBTF ENCODE53/16312.30 × 10−85.87 × 10−72.56
CREB1 ENCODE65/22383.34 × 10−86.82 × 10−72.32
BRCA1 ENCODE82/32181.14 × 10−71.95 × 10−62.073
ELF1 ENCODE68/24831.45 × 10−72.11 × 10−62.18
ZNF384 ENCODE30/7303.34 × 10−74.25 × 10−63.12
ATF2 ENCODE73/28526.29 × 10−77.13 × 10−62.04
YY1 ENCODE70/27531.48 × 10−61.51 × 10−52.01
Table 6. Glycolysis/gluconeogenesis pathway DEGs in untreated RA T cell subsets. Means are calculated from DESeq2 normalized counts.
Cell TypeGeneadj. PvalLog2FCLinear FCRA MeanControl Mean
CD8+ TemDLD0.071−0.6640.63126.84203.29
CD8+ TemGAPDH0.0520.6311.5512,014.377766.11
CD8+ Temra DLD0.046−0.8020.5796.47169.54
CD8+ TemraENO30.0620.7431.67195.64117.34
CD8+ TemraPDHA10.000160.8121.76220.72125.34
CD8+ TemraHKDC10.0172.4145.336.0951.14
CD8+ TemraHK20.0041.8943.729.492.58
Table 7. Glycolysis/gluconeogenesis pathway DEGs in MTX-, IFX- and TCZ-treated RA T cell subsets. Means are calculated from DESeq2 normalized counts.
TreatmentCell TypeGeneadj. PvalLog2FCLinear FCTreatment MeanRA Mean
TCZCD4+ TnLDHA0.0008−0.740.597572.38947.52
TCZCD8+ TemPCK20.0970.671.5682.2352.53
TCZCD8+ TemGAPDH0.055−0.660.637657.7812,014.37
MTXCD8+ TemraHK20.003−3.010.121.239.49
Table 8. Tricarboxylic acid cycle DEGs in untreated RA T cell subsets. Means are calculated from DESeq2 normalized counts.
Cell TypeGeneadj. PvalLog2FCLinear FCRA MeanControl Mean
CD8+ TemDLD0.07−0.660.63126.84203.29
CD8+ TemOGDH0.0880.671.591924.581212.56
CD8+ TemIDH3A0.0451.73.258.132.08
CD8+ Temra DLD0.046−0.8020.57496.47169.54
CD8+ TemraPDHA10.000160.811.76220.72125.34
Table 9. Oxidative phosphorylation DEGs in untreated RA CD8+ Tem cells. Means are calculated from DESeq2 normalized counts.
Geneadj. PvalLog2FCLinear FCRA MeanControl Mean
COX6A10.0951.0682.0978.673.86
NDUFB100.0741.0762.109247.30115.93
NDUFB110.0541.1262.182721.67327.37
ATP6V1G30.0515.09134.0727.590.06
NDUFS20.0770.6911.615380.8234.79
ATP5F1C0.093−0.890.539225.44425.32
ATP5MG0.051.5973.0266.821.89
COX8A0.0181.6853.21420.926.11
NDUFA120.0420.6021.518393.41256.95
MT-CO10.0362.887.366.40.86
UQCRHL0.0171.3312.51742.8116.45
Table 10. Oxidative phosphorylation DEGs in TCZ-treated RA T cell subsets. Means are calculated from DESeq2 normalized counts.
Cell TypeGeneadj. PvalLog2FCLinear FCTreatment MeanRA Mean
CD8+ TemATP5MG0.059−1.6520.3181.776.82
CD8+ TemCOX8A0.088−1.3340.3978.0320.93
CD8+ TnNDUFB60.088−1.5410.3441.945.88
CD8+ TnNDUFB80.005−2.2970.2033.217.97
CD8+ TnMT-CYB0.066−3.0580.1200.928.42
CD8+ TnMT-ND50.067−2.5550.1702.4814.81
CD8+ TnMT-CO10.071−2.7570.1481.007.01
Table 11. Fatty acid metabolism DEGs in untreated RA T cell subsets. Means are calculated from DESeq2 normalized counts.
Cell TypeGeneadj. PvalLog2FCLinear FCRA MeanControl Mean
CD8+ TemACAA20.0993.1658.9726.40.65
CD8+ Temra PECR0.0280.6661.58785.2753.35
CD8+ Temra ACOT11.0196 × 10−52.3555.11535.826.09
Table 12. Fatty acid metabolism DEGs in treated RA T cell subsets. Means are calculated from DESeq2 normalized counts.
TreatmentCell TypeGeneadj. PvalLog2FCLinear FCTreatment MeanRA Mean
IFXCD8+ TemraACOT16.64 × 10−5−2.4440.1845.6635.82
TCZCD8+ TemACACB0.0220.7261.654145.9989.00
TCZCD8+ TemraACOT10.0014−2.4070.1895.8335.82
TCZCD8+ TemraACOT20.029−0.8320.56254.80101.98
Table 13. Number of significant edges and GTRD-annotated significant edges in T cell subsets.
Cell TypeRA Untreated vs. HealthyIFX Treated vs. RA UntreatedMTX Treated vs. RA UntreatedTCZ Treated vs. RA Untreated
Total No: Significant Edges Significant Edges Present in GTRDTotal No: Significant Edges Significant Edges Present in GTRDTotal No: Significant Edges Significant Edges Present in GTRDTotal No: Significant Edges Significant Edges Present in GTRD
CD4+ Tn 185127270411604124404196
CD4+ Tcm1550010753257
CD4+ Tem2039124425211767155197863084205
CD8+ Tn22,83412,32911,596647519,24112,32115,0368528
CD8+ Tcm17,4147874331234192914703832
CD8+ Tem27,35515,41113,678819728,65315,13817,1519149
CD8+ Temra128,31875,60696,72953,94584,90648,87982,59745,443
Table 14. Number of nodes and edges in the GTRD-annotated transcription factor–target gene network of untreated RA and treated RA T cell subsets.
Cell TypeRA Untreated vs. HealthyIFX Treated vs. RA UntreatedMTX Treated vs. RA UntreatedTCZ Treated vs. RA Untreated
Total Nodes, TFs, Target GenesTotal EdgesTotal Nodes, TFs, Target GenesTotal EdgesTotal Nodes, TFs, Target GenesTotal EdgesTotal Nodes, TFs, Target GenesTotal Edges
CD4+ Tn92, 88, 4127650, 624, 26116023, 23, 024131, 123, 8196
CD4+ Tcm7, 7, 050000207, 202, 5257
CD4+ Tem627, 592, 351244766, 728, 381767588, 560, 289781035, 984, 514205
CD8+ Tn1173, 1115, 5812,3291074, 1020, 5464751136, 1076, 6012,3211183, 1123, 608528
CD8+ Tcm1072, 1018, 547874182, 176, 6234438, 420, 18147031, 31, 032
CD8+ Tem1211, 1149, 6215,4111136, 1077, 5981971248, 1183, 6515,1381146, 1092, 549149
CD8+ Temra1285, 1214, 7175,6061279, 1211, 6853,9451281, 1211, 7048,8791284, 1215, 6945,443
Table 15. Top transcription factors and target genes in GTRD-annotated transcription factor–target gene network of untreated RA and treated RA T cell subsets.
Cell TypeRA Untreated v HealthyIFX-treated v RA UntreatedMTX Treated v RA UntreatedTCZ Treated v RA Untreated
Top Ten TFTop Ten Target GenesTop Ten TFTop Ten Target GenesTop Ten TFTop Ten Target GenesTop Ten TFTop Ten Target Genes
CD4+ Tn--FOXA1, HOXA6, MITF, SMAD5, DNMT3B, RAD21, GATAD2BPFKP, DLD, GAPDHS, PDK1, PGM2, ACSS1----
CD4+ Tcm--------
CD4+ TemSPI1, PADI2, ZNF366, TP63, EHF, TWIST1, CBFA2T3, PRDM6PDK4, GAPDH, PFKP, HK1, ALDH3B1, PGAM1SPI1, PADI2, EHF, ZNF366, CBFA2T3, TP63, TWIST1, PPARG, VDRALDH3B2, PFKP, PGM2, ADPGK, ADH5PADI2, ZNF366, SPI1, TP63, TWIST1, CBFA2T3, EHFENO3, PDK4, PGM1, GCKPADI2, CBFA2T3, ETV1, SPI1, RBBP4, ZNF366, NR2F2, NFE2ALDH3B2, ENO3, DLAT, PGM1, ACLY
CD8+ TnAHR, SALL3, FOXP1, KLF1, L3MBTL2ALDH3B1, PCK1, ACSS2, KHK, ALDH7A1, PKM, ALDH3B2, AKR1A1, ENO3MYOD1, AHR, RAD21, JUN, FOXP1, L3MBTL2ALDH3B1, PCK1, ALDH7A1, KHK, ENO3, ACSS2, AKR1A1, GPINELFA, FOXP1, PHF8, HIF1A, RAD21, RING1GPI, ALDH3B1, PCK1, PFKL, ADPGK, LDHA, ENO3, ACSS2, PFKFB3TAL1, AHR, FOXP1, NR5A2ALDH3B1, ALDH7A1, PCK1, KHK, ACSS2, PDK4, ENO3, AKR1A1
CD8+ TcmTEAD4, EGR2, SMC1A, FEZF1PFKM, PDK2, ALDH3A1, ALDH3B1, PFKL, ALDH3A2, HK3, ADPGK------
CD8+ TemMBL2, E2F8, ME1, ATF3, E2F7PFKFB3, GAPDH, BPGM, DLD, G6PD, SLC2A1, PDHA1, PGAM1E2F8, ME1, MBL2, E2F7, BRCA1, RBBP4, ATF3, GLIS1, CEBPDGAPDH, ENO1, PGM1, PGK1, DLD, ENO3, PKMMBL2, FOXP1, TCF7L1, EGR1, EGR2, ATF3ENO2, ALDH2, GAPDH, ALDH9A1, ENO1, PGAM1, GCKMBL2, E2F8, SMAD1, ME1GAPDH, G6PD, ENO2, SLC2A1, G6PC, BPGM, PCK2
CD8+ TemraMYC, ZNF143, TP53BP1, SP5, CDK7ENO1, G6PC3, ALDOC, SLC2A1, ENO3, ACSS2, HK2, AKR1A1, HK1ZNF143, TP53BP1, TEAD1, CREB1ALDOC, ACSS2, ENO1, HK2, ENO3, G6PD, G6PC3, PFKFB2, AKR1A1, PGM2RUNX1T1, MYC, ZNF143, INTS12, TEAD1ALDOA, AKR1A1, ACSS2, ENO1, HK2, ALDOC, G6PC3, KHKBRD3, TP53BP1, TEAD1, GRHL2, ZNF143, INTS12ALDOA, ALDOC, G6PC3, ACSS2, ENO1, ENO3, HK2, PFKFB2
Table 16. Top ten target genes in GTRD- and GeneHancer-annotated transcription factor–target gene network of untreated RA CD8+ Tem cells.
RankTop Ten GTRD-Annotated Glycolysis Genes by In-DegreeTop Ten GeneHancer-Annotated Glycolysis Genes by In-Degree
GeneDEIn-Degree in GTRDIn-Degree in GeneHancerCommon Edges *GeneDEIn-Degree in GTRDIn-Degree in GeneHancerCommon Edges *
1PFKFB3DOWN1037953FBP2-111035
2GAPDHUP603621PFKFB3DOWN1037953
3BPGM-40189DLDDOWN393620
4DLDDOWN393620GAPDHUP603621
5G6PD-382217ALDOB-4332
6SLC2A1-312414G6PC2-3241
7PDHA1-251310SLC2A1-312414
8PGAM1-18117G6PC-12229
9AKR1A1-14108G6PD-382217
10G6PC-12229HKDC1-6194
* Common edges refer to the number of TF—target edges for a particular glycolysis gene that is annotated by both databases.
Table 17. Number of binding sites in GTRD and GeneHancer for PFKFB3, DLD and GAPDH in untreated RA CD8+ Tem cell differential co-expression networks.
GeneNumber of Common Transcription Factors in GeneHancer and GTRDNumber of TFs with More Binding Sites in GeneHancer Number of TFs with More Binding Sites in GTRDNumber of TFs with the Same Number of Binding Sites in GTRD and GeneHancer
PFKFB3534823
GAPDH211641
DLD201244
Table 18. Differential expression of regulators of glycolysis in untreated RA CD8+ Tem cells. Means are calculated from DESeq2 normalized counts.
Geneadj. PvalLog2FCLinear FCRA MeanControl Mean
IRS20.072−1.2680.41540.3897.49
RUNX30.063−0.6170.6522925.1924511.98
ELOB0.0031.7663.4012695.83785.48
EGLN30.0731.6163.06427.068.55
PFKFB30.00097−1.4620.363112.33310.92
PFKFB40.0421.6113.05418.225.88
CD8+ Tem cells from infliximab-treated individuals and methotrexate-treated individuals did not have any differentially expressed glycolysis-related genes when compared with untreated RA individuals. None of the transcription factors with high centrality scores were differentially expressed in either network.
Table 19. Top ten target genes in GTRD- and GeneHancer-annotated transcription factor–target gene network of untreated RA CD8+ Tem cells.
RankTop Ten GTRD-Annotated Glycolysis Genes by In-DegreeTop Ten GeneHancer-Annotated Nodes by In-Degree
GeneDEIn-Degree in GTRDIn-Degree in GeneHancerCommon EdgesGeneDEIn-Degree in GTRDIn-Degree in GeneHancerCommon Edges
1ENO1-18913588ENO1-18913588
2G6PC3-18212488G6PC3-18212488
3ALDOC-1735928G6PC2-111204
4SLC2A1-15511877AKR1A1-12911965
5ENO3UP15010676SLC2A1-15511877
6PDHA1UP1477243ADH7-6010917
7ACSS2-14610471HK2UP14410957
8HK2UP14410957ENO3UP15010676
9AKR1A1-12911965HK1-12410662
10HK1-12410662ACSS2-14610471
Table 20. Expression levels of AKR1A1 and HK1 in untreated RA CD8+ Temra cells. Means are calculated from DESeq2 normalized counts.
Geneadj. PvalLog2FCLinear FCRA MeanControl Mean
AKR1A10.050.561.4892.0860.7
HK10.2032790.5331651.46414.55288.62
Table 21. The differentially expressed genes in RA CD8+ Temra cells that are involved in the regulation of glycolysis. Means are calculated from DESeq2 normalized counts.
Geneadj. PvalLog2FCLinear FCRA MeanControl Mean
INSR0.0901.923.7712.1912.947
PPARG0.0104.4722.094.4970.136
MYC0.000451.6573.14153.61845.369
AKT1S10.086−0.780.5829.08750.460
EGLN31.968 × 10−54.3920.9220.0320.863
HIF1AN0.006790.711.64577.231355.911
EP3000.03461.122.18137.036301.163
Publisher’s Note: MDPI stays neutral with regard to jurisdictional claims in published maps and institutional affiliations.

