Abstract
The world population is genetically predisposed to metabolic syndrome (MetS) and its components, also known as cardiometabolic risk phenotypes, which can cause severe health complications including coronary heart disease (CHD). Genetic variants in the 9p21 locus have been associated with CHD in a number of populations including Pakistan. However, the role of the 9p21 locus in MetS and cardiometabolic risk phenotypes (such as obesity, hypertension, hyperglycemia, and dyslipidemia) in populations with CHD or no established CHD has not been explored. Therefore, the present study was designed to explore the association of the minor/risk allele (C) of 9p21 locus SNP rs1333049 with MetS or its risk phenotypes regardless of an established CHD, in Pakistani subjects. Genotyping of rs1333049 (G/C) was performed on subjects under a case-control study design; healthy controls and cases, MetS with CHD (MetS-CHD+) and MetS with no CHD (MetS-CHD−), respectively. Genotype and allele frequencies were calculated in all study groups. Anthropometric and clinical variables (Means ± SD) were compared among study groups (i.e., controls, MetS + CHD and MetS-CHD) and minor/risk C allele carriers (GC + CC) vs. non-carriers (Normal GG genotype). Associations of the risk allele of rs1333049 SNP with disease and individual metabolic risk components were explored using adjusted multivariate logistic regression models (OR at 95% CI) with a threshold p-value of ≤0.05. Our results have shown that the minor allele frequency (MAF) was significantly high in the MAF cases (combined = 0.63, MetS-CHD+ = 0.57 and MetS-CHD− = 0.57) compared with controls (MAF = 0.39). The rs1333049 SNP significantly increased the risk of MetS, irrespective of CHD (MetS-CHD+ OR = 2.36, p < 0.05 and MetS-CHD− OR = 4.04, p < 0.05), and cardiometabolic risk phenotypes; general obesity, central obesity, hypertension, and dyslipidemia (OR = 1.56–3.25, p < 0.05) except hyperglycemia, which lacked any significant association (OR = 0.19, p = 0.29) in the present study group. The 9p21 genetic locus/rs1333049 SNP is strongly associated with, and can be a genetic predictor of, MetS and cardiometabolic risks, irrespective of cardiovascular diseases in the Pakistani population.
1. Introduction
The cardiometabolic risk phenotypes/dysregulations such as obesity, hypertension, dyslipidemia, and hyperglycemia (collectively known as metabolic syndrome (MetS)), are the highest non-communicable health risks faced by the world population [1]. Depending upon worldwide population variabilities like sex, age, race/ethnicity, and lifestyle-related factors, MetS prevalence ranges from 10 to 84% [2], while in the South Asian population it ranges from 11.9 to 49%, with the highest rate of 54.9% in Pakistan [3,4]. Cardiometabolic dysregulations and MetS lead to a number of health-threatening issues including coronary heart disease (CHD) [5,6,7,8]. MetS is predicted to increase the risk of CHD episodes by two-fold and mortality by one-and-a-half-fold in the next 5 to 10 years [9,10,11], regardless of gender and age [12]. However, South Asian ethnicities (Bangladesh, Bhutan, India, Maldives, Pakistan, Nepal, and Sri Lanka) are considered to be highly susceptible to cardiometabolic disorders and CHD [12,13,14,15]. In Pakistan, CHD shares the highest incidence rate (21%) compared with other non-communicable diseases with an annual increase of 0.85% [4,16,17].
CHD is a major health complication and impediment to achieving global health goals with a 28% rate of total disease-related deaths, an annual rate of 0.36% [17]. It is a multifactorial and multi-genic disorder involving abnormalities in both the myocardial and vascular processes aggravated by ischemia, inflammation, and apoptosis [18]. Both GWAS and candidate gene studies over the years have reported a number of genetic loci contributing to the development of CHD in different populations [19,20]. Among many genetic loci, the 9p21 locus was the first genetic risk factor having a high effect size and the most replicated one as well [20,21,22,23,24]. 9p21 SNPs have been analyzed to forecast ischemic events e.g., MI amongst CAD patients [19,20].
Among various SNPs on CHR 9p21, rs1333049 (CDKN2A/B gene) has been reported to be linked to the incidence and development of coronary artery disease (CAD) and myocardial infarction (MI) [22,25,26,27,28,29,30,31]. However, it still needs to be explored whether the rs1333049 variant of the 9p21 locus has a direct role in the development of heart diseases or its effect is triggered by existing cardiometabolic dysregulations, including the well-established MetS [20]. With a focus on the South Asian ethnicity with a high prevalence of MetS/components and CHD, the present study was designed to explore the association of the minor C allele of the rs1333049 variant in Pakistani individuals having MetS with or without CHD.
2. Materials and Methods
2.1. Characteristics of Study Subjects
The study consisted of 400 subjects, 109 healthy controls and 291 cases (208 MetS with CHD (Mets-CHD+) and 83 MetS without CHD (Mets-CHD−). For MetS, the International Diabetes Federation (IDF) criteria were used [32]. The CHD status of study subjects was confirmed by a cardiologist with at least one cardiac episode during the last year and with/without common cardiometabolic risk phenotypes; general/central obesity, hypertension, hyperglycemia, and dyslipidemia. The CHD patients were sampled from cardiology departments in local hospitals of Rawalpindi, Islamabad and Lahore, Pakistan. Prior approval from the ethics committee for the use of human subjects, PMAS-AAUR, was obtained (protocol number: PMAS-AAUR/IEC-18/2018 and dated 27 September 2018). The study subjects agreed to the sampling by signing the written informed consent. A questionnaire was used for the collection of anthropometric data, clinical and genetic data. The sample size was calculated using the online OpenEpi calculator (http://www.openepi.com) accessed on 12 March 2020.
2.2. Anthropometric and Clinical Data Collection
The distribution of individuals in three study groups was as follows: healthy controls 33% (with no history of MetS or CHD), MetS-CHD+ 46% and MetS-CHD− 21%. Anthropometric parameters included age, weight, height, waist circumference (WC), hip circumference (HC), and blood pressure (systolic SBP mmHg and diastolic DBP mmHg). The body adiposity indices; body mass index (BMI Kg/m2), WC, waist-to-hip ratio (WHR), visceral adiposity index (VAI), and body adiposity index (BAI) were calculated using standard formulas [33].
The clinical test profiles; lipid profile (triglycerides (TG), total cholesterol (TC), low-density lipoprotein (LDL), high-density lipoprotein (HDL), and fasting blood glucose (FBG) were determined using standard laboratory protocols. Cardiometabolic risk phenotypes were calculated using the above data sets; general obesity or GO (BMI ≥ 30 Kg/m2), central obesity or CO (WHR > 0.90 for male and 0.85 for females), hypertension (SBP > 139 mmHg and DBP > 89 mmHg) [34], hyperglycemia (FBG > 100 mg/dL) [35], dyslipidemia (LDL > 100 mg/dL, HDL < 40 mg/dL and TG > 150 mg/dL) [36].
2.3. DNA Isolation and Genotyping
For genetic analysis, 3 mL of venous blood was collected in EDTA-coated tubes. DNA was isolated using the organic solvent extraction method [37]. The DNA was quantified using NanoDrop1000 and its purity was examined for genetic analysis. For genotyping, allele-specific primers were used for the amplification of C/G alleles of rs1333049 SNP and its flanking regions. For the amplification of C allele, an inner reverse allele-specific (5′-CTTACCTCTGCGAGTGGCTGCTTATG-3′) and outer forward (5′-CGAAGTAGAGCTGCAAAGATATTTGGAA-3′) primers were used, while for G allele an inner forward allele-specific (5′-CCTCATACTAACCATATGATCAACAGATG-3′) and outer reverse (5′-GGGCTCATAATTGCTGAATAAAACAGAA-3′) primers were used. The thermal profile used for PCR was: initial denaturation at 95 °C for 5 min, 34 cycles of denaturation at 95 °C for 45 s, primer annealing at 60 °C for the G allele, and 54.7 °C for the C allele for 60 s, and extension at 72 °C for 45 s. Final extension was executed at 72 °C for 5 min. The PCR amplified products of 263 bp corresponded to the homozygous CC genotype and 214 bp to the homozygous GG genotype, respectively, on 2% agarose gel. The CG heterozygous genotype resulted in two DNA bands of 263 bp and 214 bp.
2.4. Statistical Analysis
Genotype and allele frequencies were calculated in all study groups and evaluated for the Hardy Weinberg Equilibrium (HWE) using the chi-square test. The minor C allele frequency was compared between controls and cases using the chi-square test. The association of the minor allele C with age, gender, and disease status; MetS-CHD+ or MetS-CHD−; and individual cardiometabolic risk phenotypes (GO, CO, hypertension, dyslipidemia, hyperglycemia) was calculated using the dominant genetic model (CC + GC vs. GG). The odds ratios (OR) and 95% confidence intervals (95% CI) were estimated using logistic regression after adjustments for age, sex, BMI, WC, WHR, hypertension, dyslipidemia, and hyperglycemia. A significance level of p ≤ 0.05 was used in all statistical analyses. To find the levels of all continuously measured study variables in C allele carriers, the standard deviation (SD) change of each variable and adiposity index from their population means were computed for C (CC + GC) and G (GG) allele carriers. Descriptive statistics (Mean ± SD) were used to summarize the collected data using one-way analysis of variance (ANOVA). Data analysis was carried out using SPSS version 22.0 (SPSS Inc., Chicago, IL, USA).
3. Results
3.1. Anthropometric Parameters
All study variables were compared (Mean ± SD) among healthy controls and cases (combined). The anthropometric parameters (age, weight, HC, SBP and DBP), adiposity indices (BMI, WC, WHR, VAI, BAI), and clinical test values (FBG, TG, TC, LDL) in all the case groups were in risk ranges and significantly higher (p < 0.05) compared with the healthy controls. Whereas HDL levels were significantly lower (p < 0.05) in the case groups as compared with controls (Table 1). The frequency distribution (%) of individual cardiometabolic risk phenotypes (dyslipidemia, hypertension, hyperglycemia, CO, GO) was also calculated in all cases. The highest frequency was dyslipidemia (76.7%) followed by GO (56.2%), hypertension (54.8 (53.4%), and CO (44.5%) (Figure 1).

Table 1.
Comparison of study variables among cases and controls.
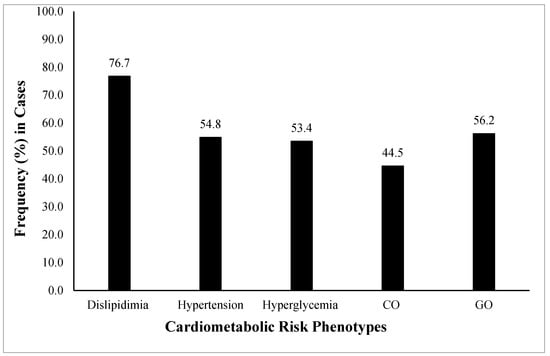
Figure 1.
Frequency (%) of cardiometabolic risk phenotypes among the studied population. The cardiometabolic risk phenotypes presented are general obesity or GO (BMI ≥ 30 Kg/m2), central obesity or CO (WHR > 0.90 for males and 0.85 for females), hypertension (SBP > 139 mmHg and DBP > 89 mmHg) (34), hyperglycemia (FBG > 100 mg/dL), and dyslipidemia (LDL > 100 mg/dL, HDL < 40 mg/dL and TG > 150 mg/dL). The highest observed frequency was of dyslipidemia followed by GO, hypertension, hyperglycemia, and CO. GO, general obesity; CO, central obesity; BMI, body mass index; WHR, waist-to-hip ratio; SBP, systolic blood pressure; DBP, diastolic blood pressure; FBG, fasting blood glucose; LDL, low-density lipoprotein; HDL, high-density lipoprotein; TG, triglycerides.
3.2. Minor Allele Frequency (MAF) Distribution
The minor allele frequency (MAF) distribution of rs1333049 between the case and control groups was compared to explore the genetic susceptibility of the variant toward disease in a Pakistani population. The frequency of the minor and risk C allele of the rs1333049 variant was higher in individuals from the case groups (combined MAF = 0.63, MetS-CHD− and MetS-CHD+ MAF = 0.57, respectively) as compared with the control group (MAF = 0.39, p-value < 0.0001). Compared with the controls, the significantly high frequency of minor C allele in the cases clearly indicated it was a risk allele (Figure 2).
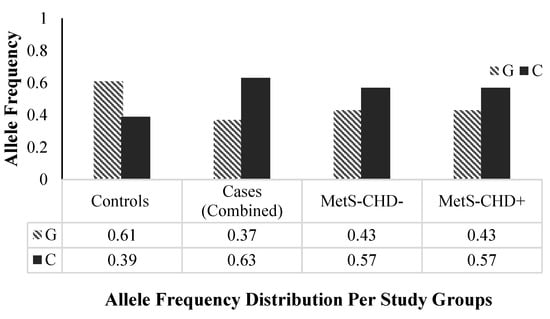
Figure 2.
rs1333049 SNP allele frequencies distribution per study groups. The frequencies of the major “G” and minor “C” alleles of rs1333049 SNP in three study groups; healthy controls, cases (combined: MetS and CHD), Mets-CHD− (MetS without CHD) and MetS-CHD+ (MetS with CHD) are shown. The minor “C” allele frequency is higher in cases (combined), MetS-CHD− and MetS-CHD+ and lower in the control group. MetS, metabolic syndrome; CHD, coronary heart disease.
3.3. Association Analysis
The association analysis of the rs1333049 genetic variant with disease groups MetS-CHD− and MetS-CHD+ and individual cardiometabolic risk phenotypes; dyslipidemia, hypertension, hyperglycemia, CO, GO are presented in Table 2. Per the analysis results, individuals carrying minor/risk C allele (GC + CC) had a 4 times higher risk of MetS-CHD− (OR = 4.04, 95% CI = 1.62–10.07) and 2.7 times higher risk of MetS-CHD+ (OR = 2.24–2.70, 95% CI = 1.16–6.28) compared with non-carriers (GG). The C allele is also significantly associated with individual cardiometabolic risk phenotypes. The C allele carriers had almost a 3-fold risk of dyslipidemia (OR = 3.25, 95% CI = 2.28–6.07), 2.4-fold GO (OR = 2.39, 95% CI = 1.15–5.00), 2-fold hypertension (OR = 2.24, 95% CI = 1.11–4.53), and 1.6-fold CO (OR = 1.56, 95% CI = 1.26–3.68). The rs1333049 variant also showed an association with gender; the C allele carrier male individuals were at 1.8 times higher risk of disease/cardiometabolic risk phenotypes as compared with females (OR = 1.79, 95% CI = 1.13–3.44). Whereas the hyperglycemia lacked any association with rs1333049 (OR = 0.19, 95% CI = 0.01–4.64).
Table 2.
Genetic association of rs1333049 SNP with cardiometabolic risk phenotypes.
All study variables (Mean ± SD) were also compared among minor/risk C allele carriers (GC + CC) versus non-carriers (GG) of the rs1333049 variant. The C allele carriers had significantly higher (p ≤ 0.05) risk ranges of anthropometric (weight, SBP and DBP) and clinical variables (FBG, TG, TC, HDL, LDL) except HDL, which were significantly lower (p ≤ 0.05) in carriers compared to non-carriers (Figure 3). The value (higher or lower) of continuous covariates in risk allele carriers showed that C allele carriers were 2.3 years older and 0.1 Kg heavier in body weight as compared with the G allele carriers. The SBP was 8.4 mm/Hg lower while DBP was 2.2 mm/Hg higher in risk allele carriers.
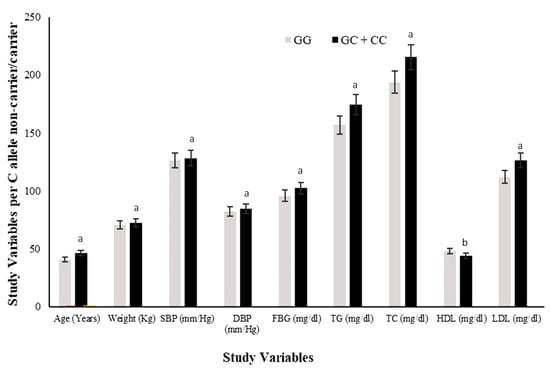
Figure 3.
Comparison of study variables in rs1333049 SNP minor/risk (C) allele and major (G) allele carriers. Comparison of the levels of all study variables among G allele carrier (GG homozygotes) and C allele carrier (GC heterozygotes and CC homozygotes combined) study subjects. The levels of all study variables were raised in C allele carriers while HDL was lower compared with that of G allele carriers. The superscript “a” on bars for variables shows significantly higher levels in C allele carriers versus G allele carriers. Whereas superscript “b” on bars shows significantly lower levels in C allele carriers vs. G allele carriers.
The FBG, TG, and LDL levels were raised by 2.1 mg/dL, 2.3 mg/dL, and 1.0 mg/dL, respectively; while the TC and HDL were 2.6 mg/dL and 1.7 mg/dL lower, respectively, in risk allele carriers as compared with non-carriers (Figure 4). The combined datasets of Figure 3 and Figure 4 have been included as a supplementary file (Table S1). Additionally, the adiposity indices BMI, WC, WHR, VAI, and BAI were all raised in the C allele carriers as compared with the G allele carriers (Figure 5). Per SD change, BMI was 0.4 Kg/m2, WC 3.9 cm, and VAI 0.1 and BAI 1.4 raised while WHR was 0.009 lower in C allele carriers (Figure 6). The combined datasets of Figure 5 and Figure 6 have been included as a supplementary file (Table S2).
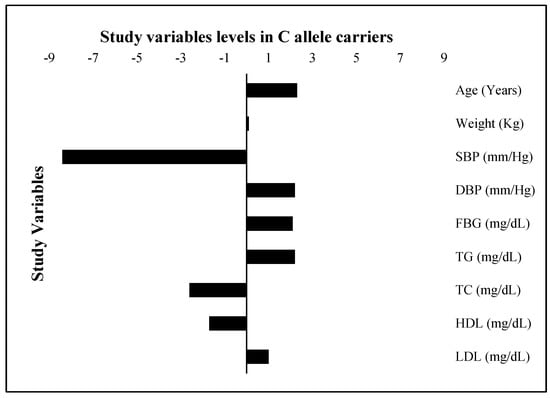
Figure 4.
Study variable levels (SD change from population means) in C allele carriers. The levels of all study variables are presented as a standard deviation (SD) change from the population means in C allele carrier (GC heterozygotes and CC homozygotes combined) study subjects. The bars with +ive (>0) values represent higher/raised levels while those with −ive (<0) values show lower levels of individual variables in C allele carriers as compared with the G allele carriers.
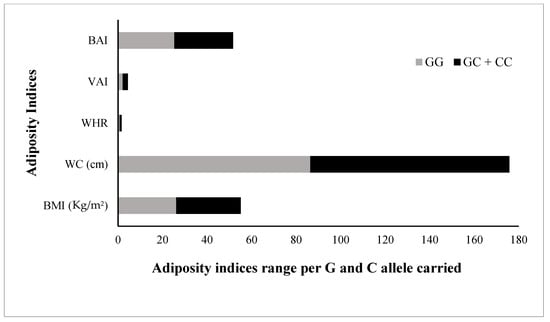
Figure 5.
Comparison of adiposity indices in rs1333049 SNP minor/risk © allele and major (G) allele carriers. Comparison of the levels of all adiposity indices (BMI, body mass index; WC, waist circumference; WHR, waist-hip ratio; VAI, visceral adiposity index; and BAI, body adiposity index, among G allele carrier (GG homozygotes) and C allele carrier (GC heterozygotes and CC homozygotes combined) study subjects. All adiposity indices were raised in C allele carriers compared with G allele carriers.
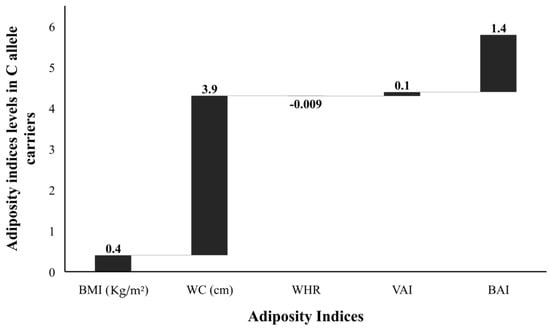
Figure 6.
Adiposity indices levels (SD change from population means) in C allele carriers. The levels of all adiposity indices (BMI, body mass index; WC, waist circumference; WHR, waist-hip ratio; VAI, visceral adiposity index; and BAI, body adiposity index presented as standard deviation (SD) change from the population means in C allele carrier (GC heterozygotes and CC homozygotes combined) from that of G allele carrier (GG homozygotes) study subjects. The bars with +ive (>0) values represent higher/raised levels while those with −ive (<0) values show lower levels of individual variables in C allele carriers as compared with the G allele carriers.
4. Discussion
In the present study, we found that the minor/risk allele (C) of the 9p21 locus SNP rs1333049 showed a strong association with MetS as a whole, as well as with its individual cardiometabolic risk components, irrespective of established CHD in subjects from Pakistan. The minor allele frequency distribution of the rs1333049 SNP was compared between the controls and case groups as MetS+ CHD and MetS− CHD. The C allele frequency was significantly higher in all disease groups as compared with controls.
The prevalence of MetS and cardiometabolic risk phenotypes abdominal obesity, dyslipidemia, hypertension, and hyperglycemia are on the rise in adult populations of most countries around the globe [1]; however, children and adolescents are also becoming its victims [20,33,38,39,40]. The major risk factors leading to increasing rates of disease are sedentary and stressful lifestyles coupled with excessive consumption of caloric-rich foods and obesity [5,11,40,41]. MetS and its components have been associated with CAD [4,5,6]. All case subjects of the present study had MetS regardless of CHD; the anthropometric and clinical variables in these groups were in risk ranges and higher compared to the individuals from the control group.
It is worth mentioning here that individuals from the MetS-CHD+ group had slightly higher values of all anthropometric and clinical variables except HDL as compared with subjects from the MetS-CHD− group. Moreover, individuals from the case group had lower total cholesterol, LDL, HDL, and triglycerides compared with those from the control group. Our result is in support of previous reports that individuals with MetS have persistently higher risk levels of common anthropometric and clinical disease markers, which could lead to health-threatening disease conditions like CHD [5,6].
The frequency of all individual cardiometabolic risk phenotypes was very high in the combined case group. The highest frequency (76.7%) was of dyslipidemia in the disease group individuals followed by GO (56.2%), hypertension (53.4%), and CO (44.5%). The high frequency of cardiometabolic risks in Pakistani subjects also supports the previous finding that the clustering of cardiometabolic dysregulations could lead to MetS and further complications, especially CHD [4,5,6]. Genetic relationships between metabolic dysregulations and the development/severity of cardiovascular diseases have also been reported [7,8], especially the rs1333049 SNP of the 9p21 locus [29,30,42]. Several studies have also explored genetic relationships between the rs1333049 polymorphism with cardiometabolic risk components and CHD [43,44,45,46,47].
We report a significantly higher frequency of the minor C allele of the rs1333049 variant in both the MetS-CHD+ and MetS-CHD− disease groups as compared with the healthy controls (p ≤ 0.0001). The association of the minor C allele was examined with MetS with or without established CHD and also with individual metabolic risk phenotypes; GO, CO, dyslipidemia, hypertension, and hyperglycemia (Table 2). The genetic association results showed that individuals from all disease phenotype groups carrying minor/risk C allele had higher disease risk ranging from OR = 2.24–4.04. Among all disease groups, a highly significant association (p = 0.0003) of the rs1333049 variant was found with MetS/MetS-CHD− showing C allele carriers at a 4.04 times higher risk of MetS compared with non-carriers (OR = 4.04, 95% CI = 1.62–10.07). The rs1333049 SNP also showed a significant association with the CHD group (MetS-CHD+) but was 1.34 times lower (OR = 2.70, 95% CI = 1.16–6.28) compared with the MetS group (OR = 4.04). The contribution of the C allele towards disease risk was clearly identified from the comparison of study variables (mean ± SD) among C allele carriers versus non-carriers of the rs1333049 variant (Figure 3). The anthropometric variables (age, weight, SBP and DBP), adiposity indices (BMI, WC, WHR, VAI, BAI), and clinical test values (FBG, TG, TC, HDL, LDL) showed HDL levels were within risk ranges in C allele carriers (GC + CC) as compared with non-carriers (GG).
The genetic association of rs1333049 has been largely explored with cardiovascular diseases and complications of the heart in different world populations including Pakistan [29,30,42]. Since cardiovascular complications strongly correlate with MetS or individual cardiometabolic complications [43,44,45,46], establishing a direct association of the rs1333049 polymorphism with an already prevailing metabolic hub could uncover the exact role of the risk allele of the rs1333049genetic variant of the 9p21 locus. The present study also confirms that the minor C allele of the rs1333049 variant is a risk allele more abundant in Pakistani subjects with MetS. Our study also showed that minor C allele carriers of the rs1333049 variant had a 4 times higher risk of MetS (CHD−) while MetS-CHD+ individuals had a two-fold higher disease risk. Overall, this study reports the rs1333049 9p21 locus SNP as a strong risk predictor of MetS and individual cardiometabolic dysregulations in a Pakistani study cohort independent of CHD status.
5. Conclusions
The 9p21 genetic locus/rs1333049 SNP is strongly associated with, and can be a genetic predictor of, MetS and cardiometabolic risks regardless of CHD in the Pakistani population.
Supplementary Materials
The following supporting information can be downloaded at: https://www.mdpi.com/article/10.3390/genes13122226/s1, Table S1: Comparison of study variables in rs1333049 SNP minor/risk (C) allele and major (G) allele carriers and SD change from population means in C allele carriers; Table S2: Comparison of adiposity traits in rs1333049 SNP minor/risk (C) allele and major (G) allele carriers and SD change from population means in C allele carriers
Author Contributions
Conceptualization, G.K.R., P.A.S. and M.M.Z.; methodology, M.M.Z., A.M.R., M.S. and P.A.S.; software, G.K.R., P.A.S. and M.M.Z.; validation, G.K.R., M.M.Z. and M.N.; formal analysis, G.K.R., M.K.N.S., M.M.Z., M.S. and M.N.; investigation, G.K.R., M.J.A., M.M.Z. and M.N.; resources, G.K.R. and M.N.; data curation, M.K.N.S., M.M.Z., M.S. and A.M.R.; writing—original draft preparation, G.K.R. and M.M.Z.; writing—review and editing, M.S., A.M.R., P.A.S., M.J.A., M.K.N.S., F.F., H.V., M.N. and G.K.R.; visualization, G.K.R. and M.N.; supervision, G.K.R. and M.N.; project administration, G.K.R.; funding acquisition, G.K.R. All authors have read and agreed to the published version of the manuscript.
Funding
Research grant 10019/Punjab/NRPU/R&D/HEC/2017NRPU from Higher Education Commission, Pakistan to Raja GK. Nawaz M. acknowledges the support from the Adlerbertska Research Foundation, Sweden (2019).
Institutional Review Board Statement
Prior approval from the ethics committee for the use of human subjects, PMAS-AAUR, was obtained (protocol number: PMAS-AAUR/IEC-18/2018 and dated 27 September 2018).
Informed Consent Statement
Informed consent was obtained from all subjects involved in the study. The study subjects agreed to sampling by signing the written informed consent. The questionnaire was used for the collection of anthropometric, clinical, and genetic data.
Data Availability Statement
All the relevant data is presented within this publication.
Conflicts of Interest
The authors declare no conflict of interest. The funders had no role in the design of the study; collection, analyses, or interpretation of data; writing of the manuscript; or decision to publish the results.
References
- Noubiap, J.J.; Nansseu, J.R.; Lontchi-Yimagou, E.; Nkeck, J.R.; Nyaga, U.F.; Ngouo, A.T.; Tounouga, D.N.; Tianyi, F.L.; Foka, A.J.; Ndoadoumgue, A.L. Geographic distribution of metabolic syndrome and its components in the general adult population: A meta-analysis of global data from 28 million individuals. Diabetes Res. Clin. Pract. 2022, 188, 109924. [Google Scholar] [CrossRef] [PubMed]
- Annani-Akollor, M.E.; Laing, E.F.; Osei, H.; Mensah, E.; Owiredu, E.-W.; Afranie, B.O.; Anto, E.O. Prevalence of metabolic syndrome and the comparison of fasting plasma glucose and HbA1c as the glycemic criterion for MetS definition in non-diabetic population in Ghana. Diabetol. Metab. Syndr. 2019, 11, 26. [Google Scholar] [CrossRef] [PubMed]
- Ranasinghe, P.; Mathangasinghe, Y.; Jayawardena, R.; Hills, A.; Misra, A. Prevalence and trends of metabolic syndrome among adults in the asia-pacific region: A systematic review. BMC Public Health 2017, 17, 101. [Google Scholar] [CrossRef] [PubMed]
- Fiaz, M.; Rani, F.; Saqlain, M.; Mahmood, A.; Shaiq, P.A.; Naqvi, S.; Qazi, R.A.; Raja, G.K. Identification of Population Specific Risk Phenotypes Contributing Towards Development of Metabolic Syndrome. Pak. J. Zool. 2016, 48, 945–955. [Google Scholar]
- Saklayen, M.G. The global epidemic of the metabolic syndrome. Curr. Hypertens. Rep. 2018, 20, 12. [Google Scholar] [CrossRef]
- Mahalle, N.; Garg, M.; Naik, S.S.; Kulkarni, M.V. Association of metabolic syndrome with severity of coronary artery disease. Indian J. Endocrinol. Metab. 2014, 18, 708. [Google Scholar] [CrossRef]
- Reinhard, W.; Holmer, S.R.; Fischer, M.; Gloeckner, C.; Hubauer, U.; Baessler, A.; Mayer, B.; Schunkert, H.; Riegger, G.A.; Hengstenberg, C. Association of the metabolic syndrome with early coronary disease in families with frequent myocardial infarction. Am. J. Cardiol. 2006, 97, 964–967. [Google Scholar] [CrossRef]
- Lu, H.; Chen, Y.; Li, L. Metabolic pathway genes associated with susceptibility genes to coronary artery disease. Int. J. Genom. 2018, 2018, 9025841. [Google Scholar] [CrossRef]
- Alberti, K.; Eckel, R.H.; Grundy, S.M.; Zimmet, P.Z.; Cleeman, J.I.; Donato, K.A.; Fruchart, J.-C.; James, W.P.T.; Loria, C.M.; Smith, S.C., Jr. Harmonizing the metabolic syndrome: A joint interim statement of the international diabetes federation task force on epidemiology and prevention; national heart, lung, and blood institute; American heart association; world heart federation; international atherosclerosis society; and international association for the study of obesity. Circulation 2009, 120, 1640–1645. [Google Scholar]
- Mottillo, S.; Filion, K.B.; Genest, J.; Joseph, L.; Pilote, L.; Poirier, P.; Rinfret, S.; Schiffrin, E.L.; Eisenberg, M.J. The metabolic syndrome and cardiovascular risk: A systematic review and meta-analysis. J. Am. Coll. Cardiol. 2010, 56, 1113–1132. [Google Scholar] [CrossRef]
- O’Neill, S.; O’Driscoll, L. Metabolic syndrome: A closer look at the growing epidemic and its associated pathologies. Obes. Rev. 2015, 16, 1–12. [Google Scholar] [CrossRef] [PubMed]
- Liu, Y.; Chen, S.; Zühlke, L.; Black, G.C.; Choy, M.-k.; Li, N.; Keavney, B.D. Global birth prevalence of congenital heart defects 1970–2017: Updated systematic review and meta-analysis of 260 studies. Int. J. Epidemiol. 2019, 48, 455–463. [Google Scholar] [CrossRef] [PubMed]
- Praveen, P.; Kumar, S.R.; Tandon, N. Type 2 diabetes in youth in South Asia. Curr. Diabetes Rep. 2015, 15, 3. [Google Scholar] [CrossRef] [PubMed]
- Vikram, N.K.; Pandey, R.M.; Misra, A.; Sharma, R.; Devi, J.R.; Khanna, N. Non-obese (body mass index < 25 kg/m2) Asian Indians with normal waist circumference have high cardiovascular risk. Nutrition 2003, 19, 503–509. [Google Scholar] [PubMed]
- Volgman, A.S.; Palaniappan, L.S.; Aggarwal, N.T.; Gupta, M.; Khandelwal, A.; Krishnan, A.V.; Lichtman, J.H.; Mehta, L.S.; Patel, H.N.; Shah, K.S. Atherosclerotic cardiovascular disease in South Asians in the United States: Epidemiology, risk factors, and treatments: A scientific statement from the American Heart Association. Circulation 2018, 138, e1–e34. [Google Scholar] [CrossRef]
- Ahmed, A.; Akhter, J.; Iqbal, R.; Jabbar, A.; Mawani, M.; Awan, S.; Samad, Z.; Shaikh, P.A.; Salik, M.; Tuomilehto, J. Prevalence and Associations of Metabolic Syndrome in an Urban High Diabetes Risk Population in a Low/Middle-Income Country. Metab. Syndr. Relat. Disord. 2020, 18, 234–242. [Google Scholar] [CrossRef]
- Vos, T.; Lim, S.S.; Abbafati, C.; Abbas, K.M.; Abbasi, M.; Abbasifard, M.; Abbasi-Kangevari, M.; Abbastabar, H.; Abd-Allah, F.; Abdelalim, A. Global burden of 369 diseases and injuries in 204 countries and territories, 1990–2019: A systematic analysis for the Global Burden of Disease Study 2019. Lancet 2020, 396, 1204–1222. [Google Scholar] [CrossRef]
- Dong, Y.; Chen, H.; Gao, J.; Liu, Y.; Li, J.; Wang, J. Molecular machinery and interplay of apoptosis and autophagy in coronary heart disease. J. Mol. Cell. Cardiol. 2019, 136, 27–41. [Google Scholar] [CrossRef]
- Doria, A.; Wojcik, J.; Xu, R.; Gervino, E.V.; Hauser, T.H.; Johnstone, M.T.; Nolan, D.; Hu, F.B.; Warram, J.H. Interaction between poor glycemic control and 9p21 locus on risk of coronary artery disease in type 2 diabetes. JAMA 2008, 300, 2389–2397. [Google Scholar] [CrossRef]
- Zarkasi, K.A.; Abdul Murad, N.A.; Ahmad, N.; Jamal, R.; Abdullah, N. Coronary Heart Disease in Type 2 Diabetes Mellitus: Genetic Factors and Their Mechanisms, Gene-Gene, and Gene-Environment Interactions in the Asian Populations. Int. J. Environ. Res. Public Health 2022, 19, 647. [Google Scholar] [CrossRef]
- McPherson, R.; Pertsemlidis, A.; Kavaslar, N.; Stewart, A.; Roberts, R.; Cox, D.R.; Hinds, D.A.; Pennacchio, L.A.; Tybjaerg-Hansen, A.; Folsom, A.R. A common allele on chromosome 9 associated with coronary heart disease. Science 2007, 316, 1488–1491. [Google Scholar] [CrossRef] [PubMed]
- Samani, N.; Erdmann, J.; Hall, A.; Hengstenberg, C.; Mangino, M.; Mayer, B.; Dixon, R.; Meitinger, T.; Braund, P.; Wichmann, H. Analysis of two genome-wide association studies identifies and validates novel gene loci for myocardial infarction. N. Engl. J. Med. 2007, 357, 443–453. [Google Scholar] [CrossRef] [PubMed]
- Patel, R.S.; Schmidt, A.F.; Tragante, V.; McCubrey, R.O.; Holmes, M.V.; Howe, L.J.; Direk, K.; Åkerblom, A.; Leander, K.; Virani, S.S. Association of Chromosome 9p21 with subsequent coronary heart disease events: A GENIUS-CHD study of individual participant data. Circ. Genom. Precis. Med. 2019, 12, e002471. [Google Scholar] [CrossRef] [PubMed]
- Palomaki, G.E.; Melillo, S.; Bradley, L.A. Association between 9p21 genomic markers and heart disease: A meta-analysis. JAMA 2010, 303, 648–656. [Google Scholar] [CrossRef]
- Li, Y.; Wang, D.W.; Chen, Y.; Chen, C.; Guo, J.; Zhang, S.; Sun, Z.; Ding, H.; Yao, Y.; Zhou, L. Genome-wide association and functional studies identify SCML4 and THSD7A as novel susceptibility genes for coronary artery disease. Arterioscler. Thromb. Vasc. Biol. 2018, 38, 964–975. [Google Scholar] [CrossRef]
- O’Donnell, C.J.; Kavousi, M.; Smith, A.V.; Kardia, S.L.; Feitosa, M.F.; Hwang, S.-J.; Sun, Y.V.; Province, M.A.; Aspelund, T.; Dehghan, A. Genome-wide association study for coronary artery calcification with follow-up in myocardial infarction. Circulation 2011, 124, 2855–2864. [Google Scholar] [CrossRef]
- van der Harst, P.; Verweij, N. Identification of 64 novel genetic loci provides an expanded view on the genetic architecture of coronary artery disease. Circ. Res. 2018, 122, 433–443. [Google Scholar] [CrossRef]
- Yan, H.; Li, Y.; Tian, X. GW29-e1899 Genome-Wide Association and Functional Studies Identify SCML4 and THSD7A as Novel Susceptibility Genes for Coronary Artery Disease. J. Am. Coll. Cardiol. 2018, 72 (Suppl. S16), C65. [Google Scholar] [CrossRef]
- Arooj, I.; Hasnain, S. Association of Loci 6q25. 1/rs6922269 and 9p21. 3/rs1333049 with Risk of Coronary Heart Disease in Patients Visiting Hospitals of Gujranwala and Lahore Divisions. Pak. J. Zool. 2018, 50, 2295–2300. [Google Scholar] [CrossRef]
- Kaur, N.; Singh, J.; Reddy, S. ANRIL rs1333049 C/G polymorphism and coronary artery disease in a North Indian population-Gender and age specific associations. Genet. Mol. Biol. 2020, 43, e20190024. [Google Scholar] [CrossRef]
- Saleheen, D.; Alexander, M.; Rasheed, A.; Wormser, D.; Soranzo, N.; Hammond, N.; Butterworth, A.; Zaidi, M.; Haycock, P.; Bumpstead, S. Association of the 9p21. 3 locus with risk of first-ever myocardial infarction in Pakistanis: Case-control study in South Asia and updated meta-analysis of Europeans. Arterioscler. Thromb. Vasc. Biol. 2010, 30, 1467–1473. [Google Scholar] [CrossRef] [PubMed]
- Alberti, K.G.M.M.; Zimmet, P.; Shaw, J. Metabolic syndrome—A new world-wide definition. A Consensus Statement from the International Diabetes Federation. Diabet. Med. 2006, 23, 469–480. [Google Scholar] [CrossRef] [PubMed]
- Saqlain, M.; Akhtar, Z.; Karamat, R.; Munawar, S.; Iqbal, M.; Muhammad, F.; Zafar, M.M.; Saeed, S.; Nasir, M.F.; Naqvi, S.S. Body Mass Index versus Other Adiposity Traits: Best Predictor of Cardiometabolic Risk. Iran. J. Public Health 2019, 48, 2224. [Google Scholar] [CrossRef] [PubMed]
- Mills, K.T.; Stefanescu, A.; He, J. The global epidemiology of hypertension. Nat. Rev. Nephrol. 2020, 16, 223–237. [Google Scholar] [CrossRef] [PubMed]
- Mouri, M.; Badireddy, M. Hyperglycemia. In StatPearls [Internet]; StatPearls Publishing: Tampa, FL, USA, 2021. [Google Scholar]
- Pappan, N.; Rehman, A. Dyslipidemia. In StatPearls [Internet]; StatPearls Publishing: Tampa, FL, USA, 2021. [Google Scholar]
- Green, M.R.; Sambrook, J. Isolation and quantification of DNA. Cold Spring Harb. Protoc. 2018, 2018, pdb-top093336. [Google Scholar] [CrossRef] [PubMed]
- Saqlain, M.; Saeed, S.; Fiaz, M.; Mahmood, A.; Ghani, R.A.; Jabeen, S.; Wattoo, F.H.; Minhas, N.M.; Naqvi, S.M.S.; Raja, G.K. Screening of cardiometabolic risks clustering in young Pakistani adults classified by anthropometric traits. J. Pak. Med. Assoc. 2017, 67, 1825–1832. [Google Scholar]
- Noubiap, J.J.; Nansseu, J.R.; Lontchi-Yimagou, E.; Nkeck, J.R.; Nyaga, U.F.; Ngouo, A.T.; Tounouga, D.N.; Tianyi, F.L.; Foka, A.J.; Ndoadoumgue, A.L. Global, regional, and country estimates of metabolic syndrome burden in children and adolescents in 2020: A systematic review and modelling analysis. Lancet Child Adolesc. Health 2022, 6, 158–170. [Google Scholar] [CrossRef]
- Loos, R.J.F.; Yeo, G.S.H. The genetics of obesity: From discovery to biology. Nat. Rev. Genet. 2022, 23, 120–133. [Google Scholar] [CrossRef]
- Pigeyre, M.; Saqlain, M.; Turcotte, M.; Raja, G.; Meyre, D. Obesity genetics: Insights from the Pakistani population. Obes. Rev. 2018, 19, 364–380. [Google Scholar] [CrossRef]
- Çakmak, H.A.; Bayoğlu, B.; Durmaz, E.; Can, G.; Karadağ, B.; Cengiz, M.; Vural, V.A.; Yüksel, H. Evaluation of association between common genetic variants on chromosome 9p21 and coronary artery disease in Turkish population. Anatol. J. Cardiol. 2015, 15, 196. [Google Scholar] [CrossRef]
- Shakhtshneider, E.; Orlov, P.; Semaev, S.; Ivanoshchuk, D.; Malyutina, S.; Gafarov, V.; Ragino, Y.; Voevoda, M. Analysis of polymorphism rs1333049 (Located at 9P21. 3) in the white population of Western Siberia and associations with clinical and biochemical markers. Biomolecules 2019, 9, 290. [Google Scholar] [CrossRef] [PubMed]
- Jiménez-Osorio, A.S.; Musalem-Younes, C.; Cárdenas-Hernández, H.; Solares-Tlapechco, J.; Costa-Urrutia, P.; Medina-Contreras, O.; Granados, J.; López-Saucedo, C.; Estrada-Garcia, T.; Rodríguez-Arellano, M.E. Common polymorphisms linked to obesity and cardiovascular disease in Europeans and Asians are associated with type 2 diabetes in Mexican Mestizos. Medicina 2019, 55, 40. [Google Scholar] [CrossRef] [PubMed]
- Wu, Z.; Sheng, H.; Su, X.; Gao, X.; Lu, L.; Jin, W. Mediating effect of diabetes mellitus on the association between chromosome 9p21. 3 locus and myocardial infarction risk: A case-control study in Shanghai, China. Front. Endocrinol. 2018, 9, 362. [Google Scholar] [CrossRef]
- Phababpha, S.; Kukongviriyapan, U.; Pakdeechote, P.; Senggunprai, L.; Kukongviriyapan, V.; Settasatian, C.; Tatsanavivat, P.; Intharaphet, P.; Senthong, V.; Komanasin, N. Association of arterial stiffness with single nucleotide polymorphism rs1333049 and metabolic risk factors. Cardiovasc. Diabetol. 2013, 12, 93. [Google Scholar] [CrossRef] [PubMed]
- Bayoglu, B.; Cakmak, H.A.; Yuksel, H.; Can, G.; Karadag, B.; Ulutin, T.; Vural, V.A.; Cengiz, M. Chromosome 9p21 rs10757278 polymorphism is associated with the risk of metabolic syndrome. Mol. Cell Biochem. 2013, 379, 77–85. [Google Scholar] [CrossRef] [PubMed]


Publisher’s Note: MDPI stays neutral with regard to jurisdictional claims in published maps and institutional affiliations. |
© 2022 by the authors. Licensee MDPI, Basel, Switzerland. This article is an open access article distributed under the terms and conditions of the Creative Commons Attribution (CC BY) license (https://creativecommons.org/licenses/by/4.0/).