Evidence for Adaptive Selection in the Mitogenome of a Mesoparasitic Monogenean Flatworm Enterogyrus malmbergi

 , ,
, ,
Abstract
1. Background
2. Materials and Methods
2.1. Specimen Collection and Identification
2.2. DNA Extraction, Amplification, and Sequencing
2.3. Sequence Annotation and Analyses
2.4. Phylogenetic Analyses
2.5. Selection Analyses
3. Results
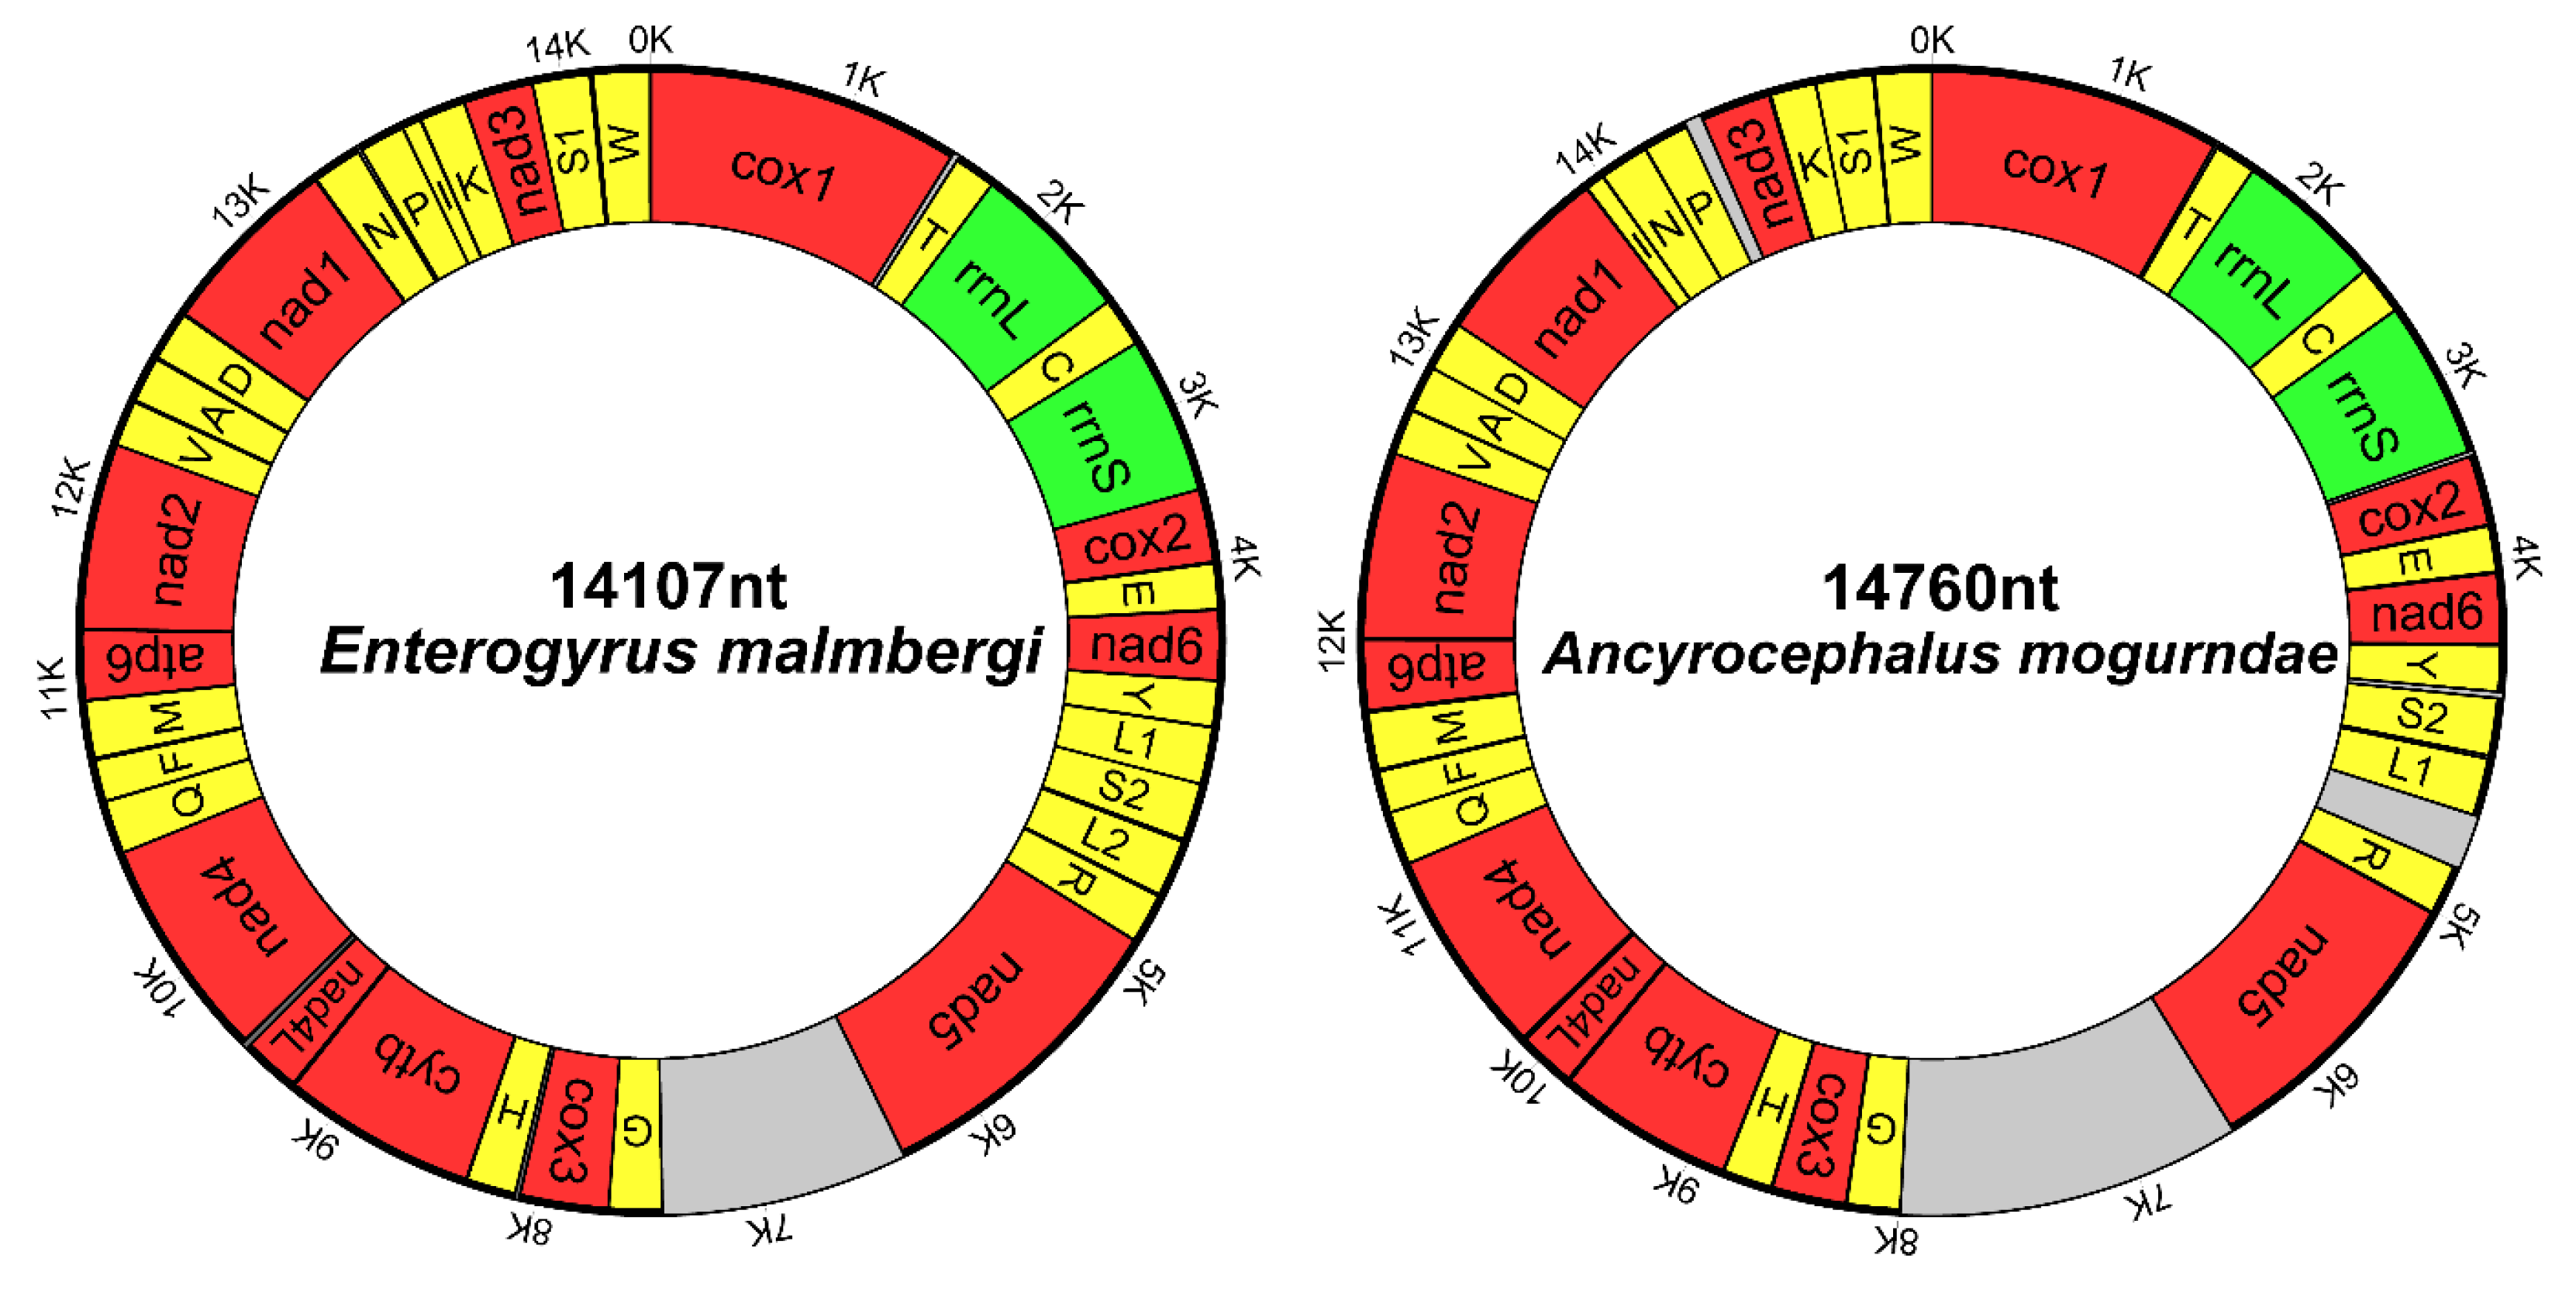
3.1. Genome Organization and Base Composition
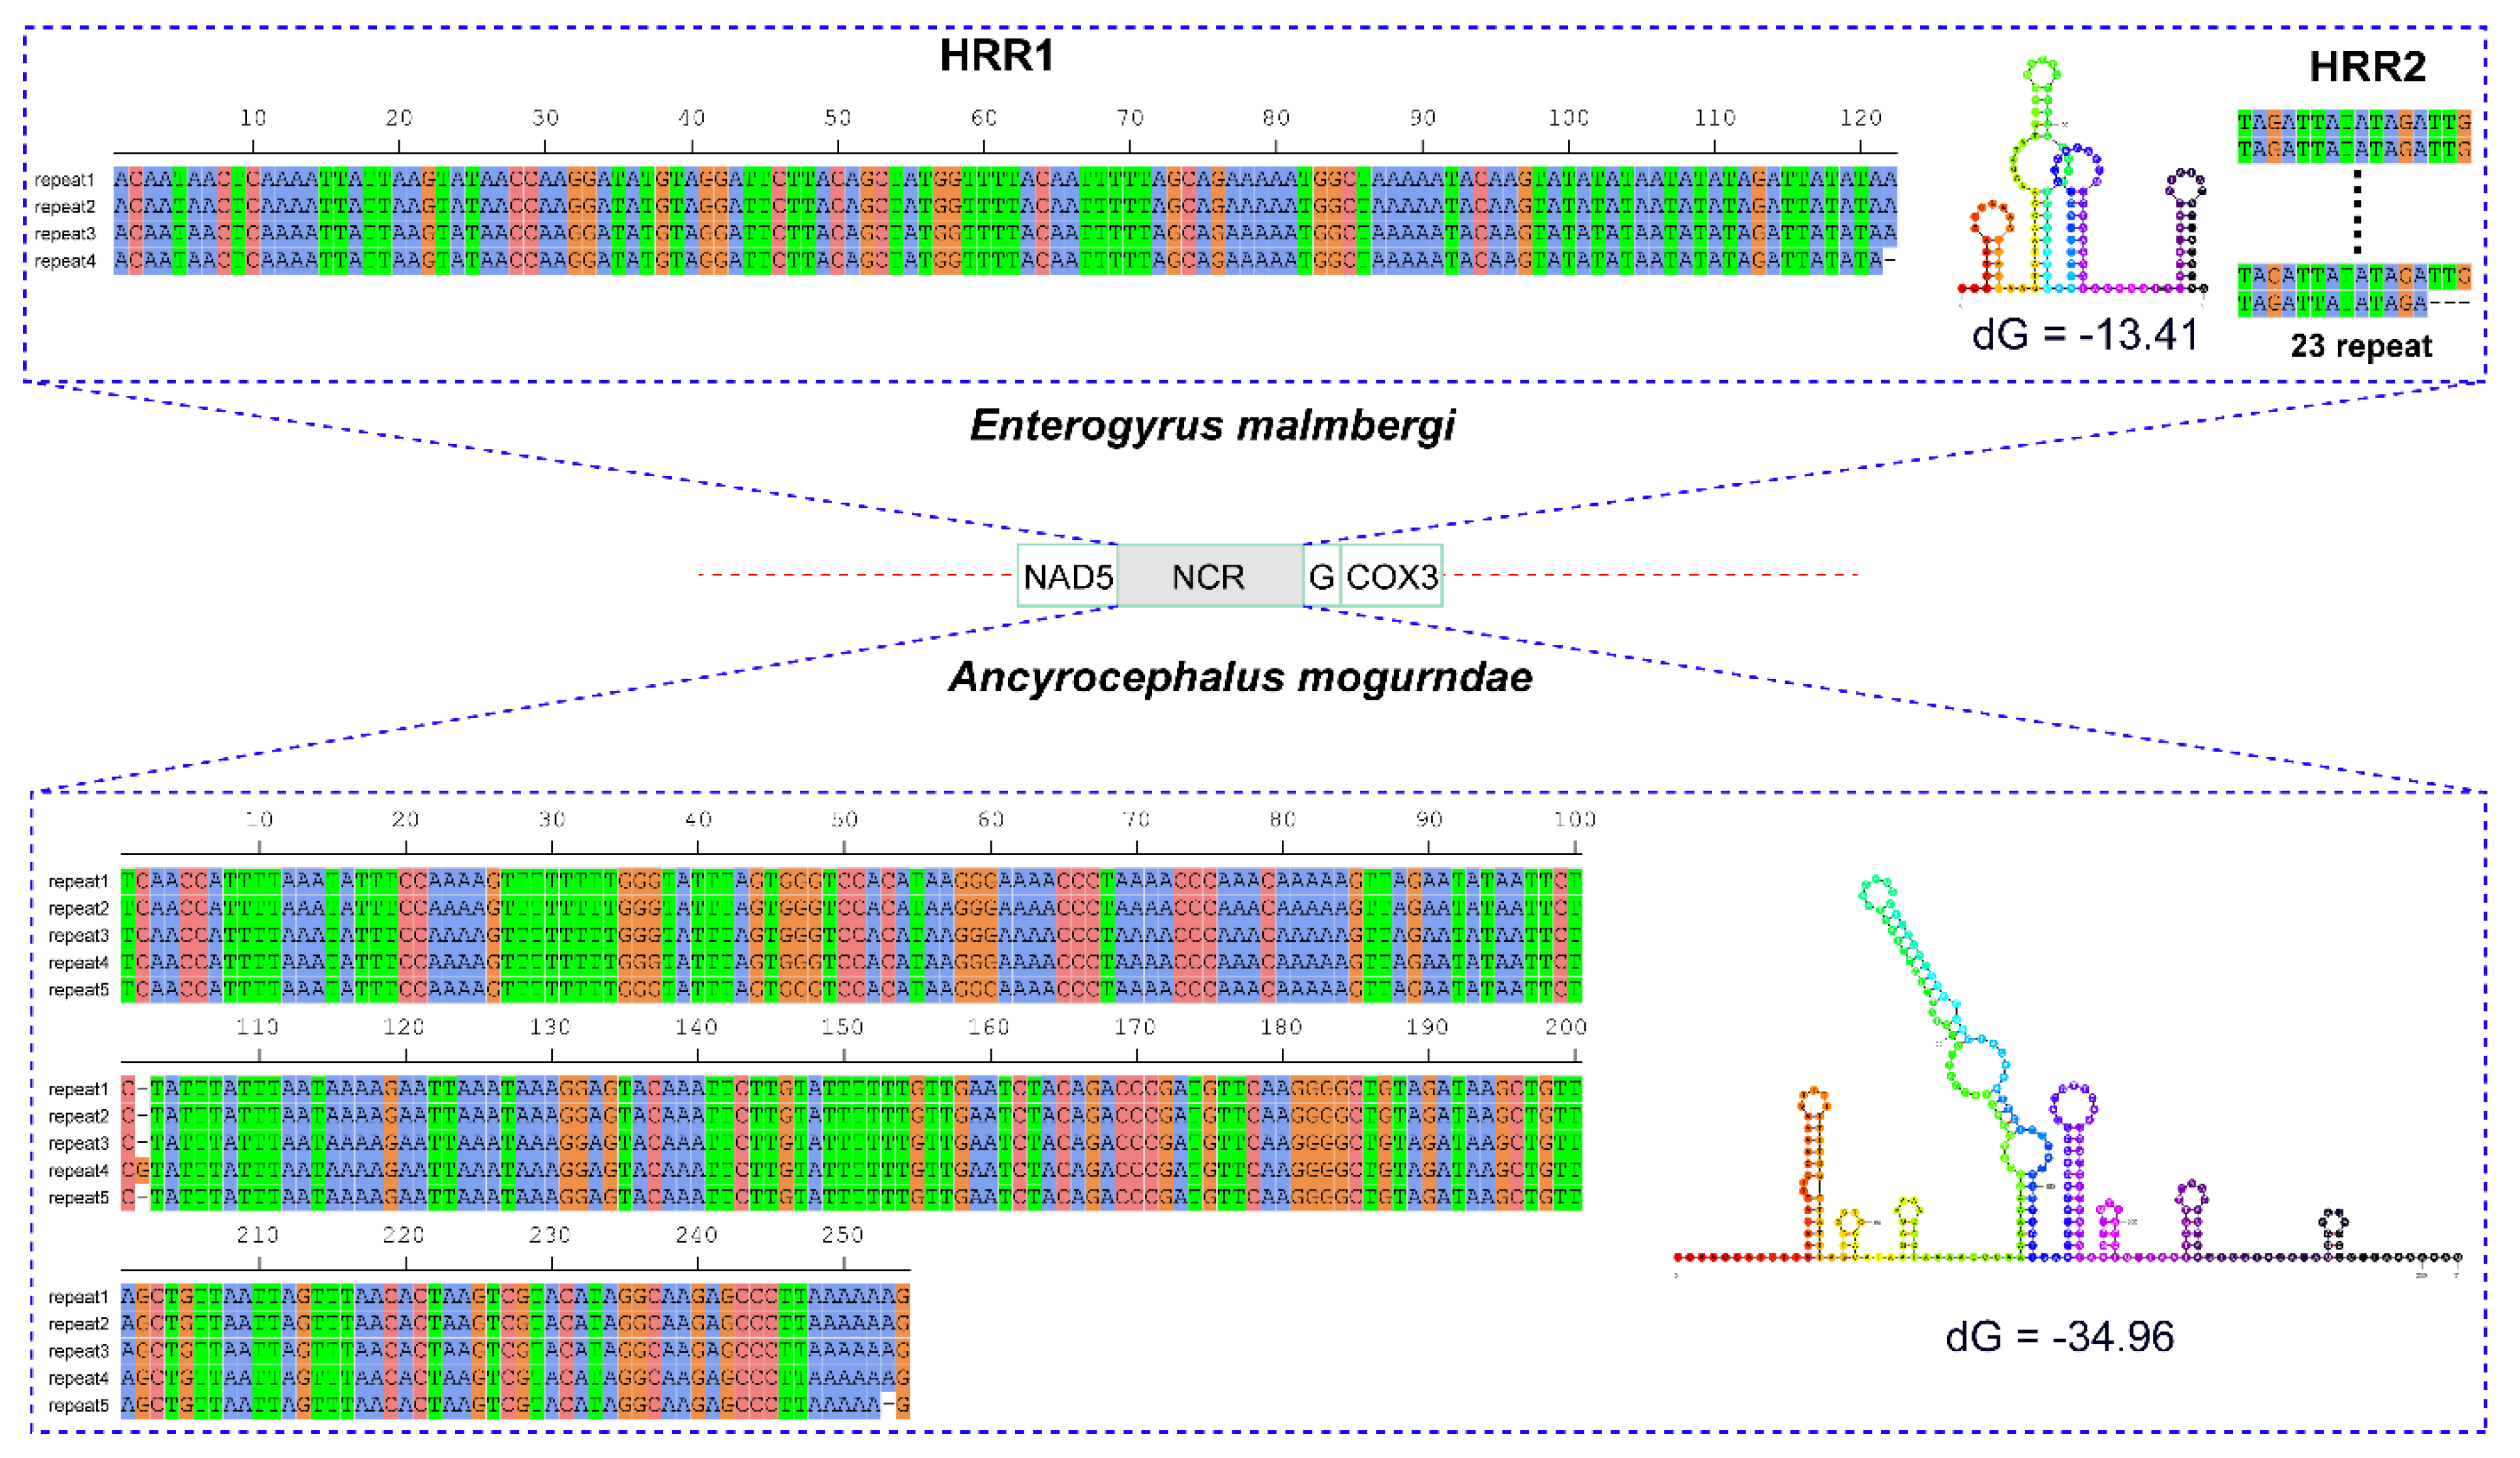
3.2. Non-Coding Regions
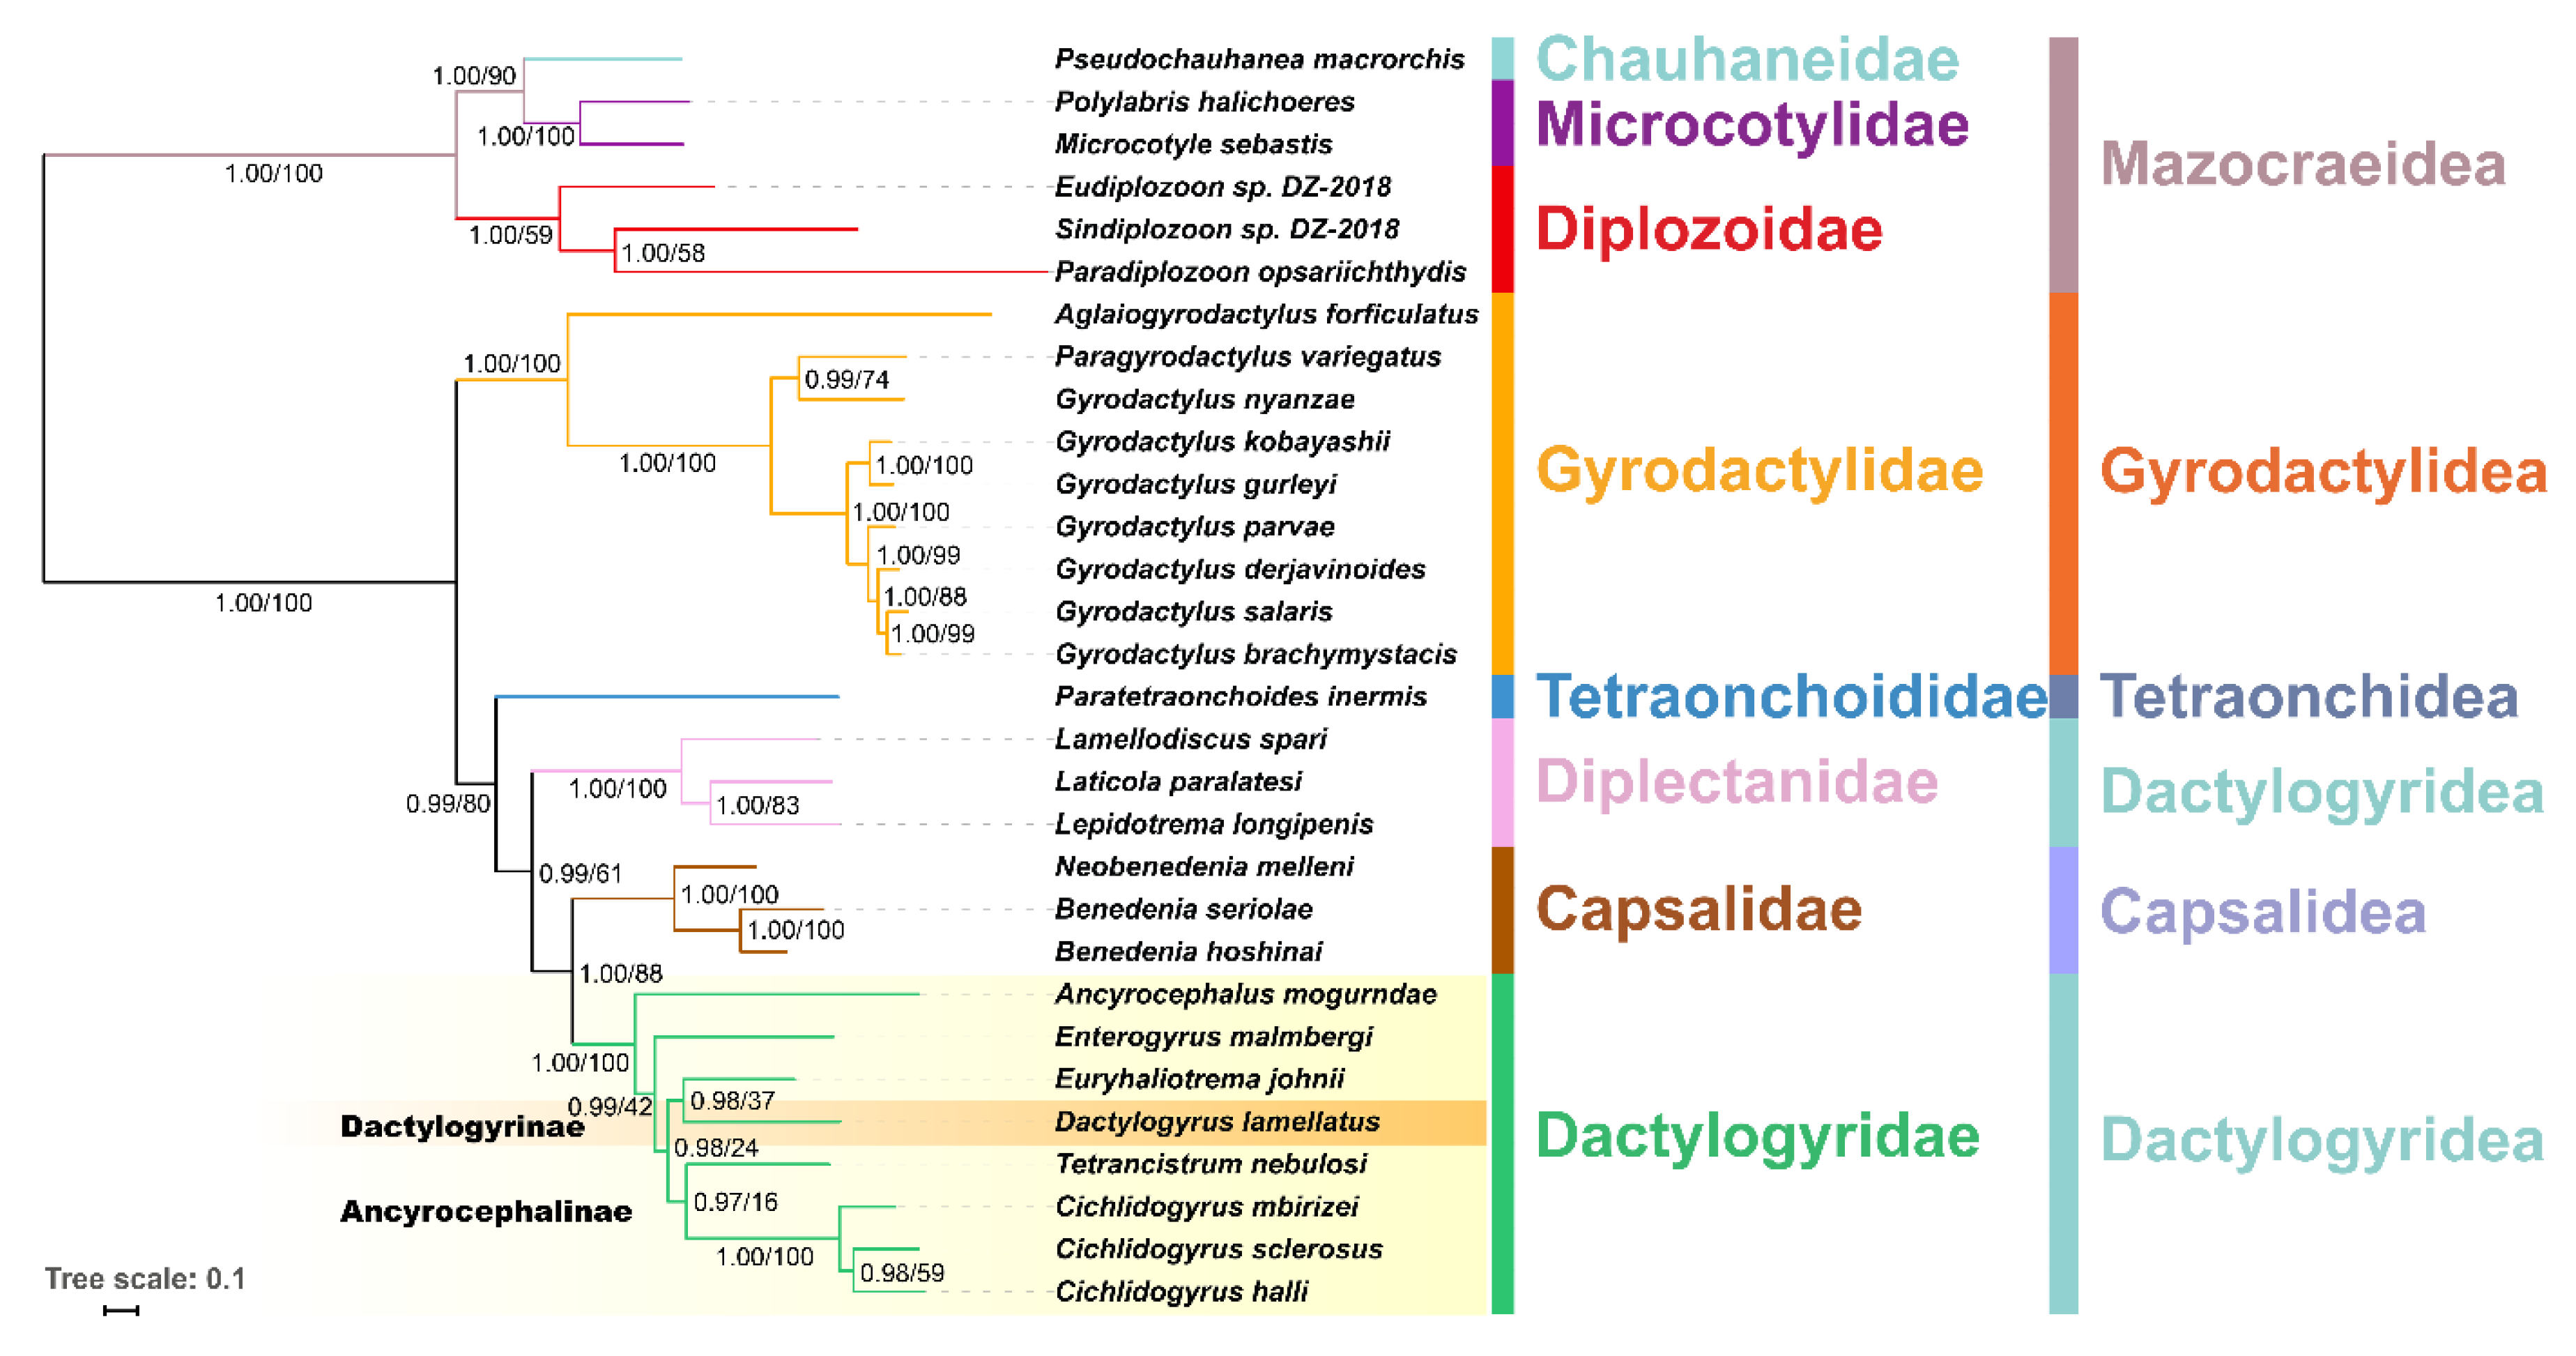
3.3. Phylogeny and Selection Analyses
4. Discussion
5. Conclusions
Supplementary Materials
Author Contributions
Funding
Acknowledgments
Conflicts of Interest
References
- Euzet, L.; Combes, C. The selection of habitats among the Monogenea. Int. J. Parasitol. 1998, 28, 1645–1652. [Google Scholar] [CrossRef]
- Paperna, I. Enterogyrus cichlidarum n gen. n. sp. a Monogenetic Trematode parasitic in the intestine of a fish. Bull. Res. Counc. Israel 1963, 11, 183–187. [Google Scholar]
- Zhang, S.; Zhi, T.; Xu, X.; Zheng, Y.; Bilong Bilong, C.F.; Pariselle, A.; Yang, T. Monogenean fauna of alien tilapias (Cichlidae) in south China. Parasite 2019, 26, 4. [Google Scholar] [CrossRef]
- Madanire-Moyo, G.; Avenant-Oldewage, A. A new locality and host record for Enterogyrus coronatus (Pariselle Lambert & Euzet (1991) in South Africa and a review of the morphology and distribution of Enterogyrus (Ancyrocephalidae) species. Helminthologia 2014, 51, 13–22. [Google Scholar]
- Madanire-Moyo, G.N.; Avenant-Oldewage, A. The histopathology of Enterogyrus coronatus Pariselle, Lambert & Euzet, 1991 (Monogenoidea) in the stomach of the southern mouthbrooder Pseudocrenilabrus philander (Weber, 1897) (Cichlidae). Afr. Zool. 2015, 50, 175–180. [Google Scholar]
- Pariselle, A.; Boeger, W.A.; Snoeks, J.; Bilong Bilong, C.F.; Morand, S.; Vanhove, M.P. The monogenean parasite fauna of cichlids: A potential tool for host biogeography. Int. J. Evol. Biol. 2011, 2011, 471480. [Google Scholar] [CrossRef] [PubMed]
- Vanhove, M.P.M.; Hablutzel, P.I.; Pariselle, A.; Simkova, A.; Huyse, T.; Raeymaekers, J.A.M. Cichlids: A host of opportunities for evolutionary parasitology. Trends Parasitol. 2016, 32, 820–832. [Google Scholar] [CrossRef]
- Bychowsky, B.E. Monogenetic Trematodes, Their Systematics and Phylogeny; Academy of Sciences: Moscow/Leningrad, Russia, 1957; p. 509. (In Russian) [Google Scholar]
- Almeida, D.; Maldonado, E.; Vasconcelos, V.; Antunes, A. Adaptation of the mitochondrial genome in cephalopods: Enhancing proton translocation channels and the subunit interactions. PLoS ONE 2015, 10, e0135405. [Google Scholar] [CrossRef]
- Shao, R.; Barker, S. Mitochondrial genomes of parasitic arthropods: Implications for studies of population genetics and evolution. Parasitology 2007, 134, 153–167. [Google Scholar] [CrossRef]
- Perkins, E.M.; Donnellan, S.C.; Bertozzi, T.; Whittington, I.D. Closing the mitochondrial circle on paraphyly of the Monogenea (Platyhelminthes) infers evolution in the diet of parasitic flatworms. Int. J. Parasitol. 2010, 40, 1237–1245. [Google Scholar] [CrossRef]
- Park, J.K.; Kim, K.H.; Kang, S.; Kim, W.; Eom, K.S.; Littlewood, D.T. A common origin of complex life cycles in parasitic flatworms: Evidence from the complete mitochondrial genome of Microcotyle sebastis (Monogenea: Platyhelminthes). BMC Evol. Biol. 2007, 7, 11. [Google Scholar] [CrossRef] [PubMed]
- Huyse, T.; Buchmann, K.; Littlewood, D.T. The mitochondrial genome of Gyrodactylus derjavinoides (Platyhelminthes: Monogenea)—A mitogenomic approach for Gyrodactylus species and strain identification. Gene 2008, 417, 27–34. [Google Scholar] [CrossRef] [PubMed]
- Avise, J.C.; Ellis, D.; Clarke, B.C.; Robertson, A.; Jeffreys, A.J. Mitochondrial DNA and the evolutionary genetics of higher animals. Philos. Trans. R. Soc. B Biol. Sci. 1986, 312, 325–342. [Google Scholar] [CrossRef] [PubMed]
- Ballard, J.W.O.; Kreitman, M. Is mitochondrial DNA a strictly neutral marker? Trends Ecol. Evol. 1995, 10, 485–488. [Google Scholar] [CrossRef]
- Ballard, J.W.O.; Pichaud, N.; Fox, C. Mitochondrial DNA: More than an evolutionary bystander. Funct. Ecol. 2014, 28, 218–231. [Google Scholar] [CrossRef]
- Botero-Castro, F.; Tilak, M.K.; Justy, F.; Catzeflis, F.; Delsuc, F.; Douzery, E.J.P. In cold blood: Compositional bias and positive selection drive the high evolutionary rate of vampire bats mitochondrial genomes. Genome Biol. Evol. 2018, 10, 2218–2239. [Google Scholar] [CrossRef]
- McNab, B.K. Energy constraints on carnivore diet. Nature 2000, 407, 584. [Google Scholar] [CrossRef]
- Scott, G.R.; Schulte, P.M.; Egginton, S.; Scott, A.L.; Richards, J.G.; Milsom, W.K. Molecular evolution of cytochrome C oxidase underlies high-altitude adaptation in the bar-headed goose. Mol. Biol. Evol. 2011, 28, 351–363. [Google Scholar] [CrossRef]
- Guo, H.; Yang, H.; Tao, Y.; Tang, D.; Wu, Q.; Wang, Z.; Tang, B. Mitochondrial OXPHOS genes provides insights into genetics basis of hypoxia adaptation in anchialine cave shrimps. Genes Genom. 2018, 40, 1169–1180. [Google Scholar] [CrossRef]
- Yu, L.; Wang, X.; Ting, N.; Zhang, Y. Mitogenomic analysis of Chinese snub-nosed monkeys: Evidence of positive selection in NADH dehydrogenase genes in high-altitude adaptation. Mitochondrion 2011, 11, 497–503. [Google Scholar] [CrossRef]
- Speakman, J.R. Body size, energy metabolism and lifespan. J. Exp. Biol. 2005, 208, 1717–1730. [Google Scholar] [CrossRef] [PubMed]
- Siddiqi, A.H.; Nizami, W.A. Gas content of swim bladder of Wallago attu and oxygen consumption in Isoparorchis hypselobagri (Trematoda). Z. Parasitenkd. 1975, 47, 263–268. [Google Scholar] [CrossRef] [PubMed]
- Stairs, C.W.; Leger, M.M.; Roger, A.J. Diversity and origins of anaerobic metabolism in mitochondria and related organelles. Philos. Trans. R. Soc. Lond. B Biol. Sci. 2015, 370, 20140326. [Google Scholar] [CrossRef] [PubMed]
- Kita, K.; Hirawake, H.; Miyadera, H.; Amino, H.; Takeo, S. Role of complex II in anaerobic respiration of the parasite mitochondria from Ascaris suum and Plasmodium falciparum. Biochim. Biophys. Acta Bioenerg. 2002, 1553, 123–139. [Google Scholar] [CrossRef]
- Wu, B.h.; Lang, S.; Wang, W.J. Fauna Sinica: Platyhelminthes: Monogenea; Science Press: Beijing, China, 2000. [Google Scholar]
- Hassouna, N.; Mithot, B.; Bachellerie, J.-P. The complete nucleotide sequence of mouse 28S rRNA gene. Implications for the process of size increase of the large subunit rRNA in higher eukaryotes. Nucleic Acids Res. 1984, 12, 3563–3583. [Google Scholar] [CrossRef]
- Thompson, J.D.; Gibson, T.J.; Higgins, D.G. Multiple sequence alignment using ClustalW and ClustalX. Curr. Protoc. Bioinform. 2002. [Google Scholar] [CrossRef]
- Lalitha, S. Primer Premier 5. Biot. Soft. Int. Rep. 2000, 1, 270–272. [Google Scholar] [CrossRef]
- Altschul, S.F.; Gish, W.; Miller, W.; Myers, E.W.; Lipman, D.J. Basic local alignment search tool. J. Mol. Biol. 1990, 215, 403–410. [Google Scholar] [CrossRef]
- Zhang, D.; Zou, H.; Wu, S.G.; Li, M.; Jakovlić, I.; Zhang, J.; Chen, R.; Wang, G.T.; Li, W.X. Sequencing of the complete mitochondrial genome of a fish-parasitic flatworm Paratetraonchoides inermis (Platyhelminthes: Monogenea): tRNA gene arrangement reshuffling and implications for phylogeny. Parasit. Vectors 2017, 10, 462. [Google Scholar] [CrossRef]
- Zhang, D.; Zou, H.; Wu, S.G.; Li, M.; Jakovlic, I.; Zhang, J.; Chen, R.; Wang, G.T.; Li, W.X. Sequencing, characterization and phylogenomics of the complete mitochondrial genome of Dactylogyrus lamellatus (Monogenea: Dactylogyridae). J. Helminthol. 2017, 92, 455–466. [Google Scholar] [CrossRef]
- Li, W.X.; Zhang, D.; Boyce, K.; Xi, B.W.; Zou, H.; Wu, S.G.; Li, M.; Wang, G.T. The complete mitochondrial DNA of three monozoic tapeworms in the Caryophyllidea: A mitogenomic perspective on the phylogeny of eucestodes. Parasit. Vectors 2017, 10, 314. [Google Scholar] [CrossRef] [PubMed]
- Zou, H.; Jakovlic, I.; Chen, R.; Zhang, D.; Zhang, J.; Li, W.X.; Wang, G.T. The complete mitochondrial genome of parasitic nematode Camallanus cotti: Extreme discontinuity in the rate of mitogenomic architecture evolution within the Chromadorea class. BMC Genom. 2017, 18, 840. [Google Scholar] [CrossRef] [PubMed]
- Burland, T.G. DNASTAR’s Lasergene sequence analysis software. Methods Mol. Biol. 2000, 132, 71–91. [Google Scholar] [PubMed]
- Bernt, M.; Donath, A.; Juhling, F.; Externbrink, F.; Florentz, C.; Fritzsch, G.; Putz, J.; Middendorf, M.; Stadler, P.F. MITOS: Improved de novo metazoan mitochondrial genome annotation. Mol. Phylogenet. Evol. 2013, 69, 313–319. [Google Scholar] [CrossRef] [PubMed]
- Laslett, D.; Canback, B. ARWEN: A program to detect tRNA genes in metazoan mitochondrial nucleotide sequences. Bioinformatics 2008, 24, 172–175. [Google Scholar] [CrossRef] [PubMed]
- Zhang, D.; Gao, F.; Jakovlić, I.; Zou, H.; Zhang, J.; Li, W.X.; Wang, G.T. PhyloSuite: An integrated and scalable desktop platform for streamlined molecular sequence data management and evolutionary phylogenetics studies. Mol. Ecol. Resour. 2019. [Google Scholar] [CrossRef]
- Benson, G. Tandem repeats finder: A program to analyze DNA sequences. Nucleic Acids Res. 1999, 27, 573. [Google Scholar] [CrossRef]
- Zuker, M. Mfold web server for nucleic acid folding and hybridization prediction. Nucleic Acids Res. 2003, 31, 3406–3415. [Google Scholar] [CrossRef]
- Kalyaanamoorthy, S.; Minh, B.Q.; Wong, T.K.F.; von Haeseler, A.; Jermiin, L.S. ModelFinder: Fast model selection for accurate phylogenetic estimates. Nat. Methods 2017, 14, 587–589. [Google Scholar] [CrossRef]
- Stamatakis, A. RAxML version 8: A tool for phylogenetic analysis and post-analysis of large phylogenies. Bioinformatics 2014, 30, 1312–1313. [Google Scholar] [CrossRef]
- Lartillot, N.; Rodrigue, N.; Stubbs, D.; Richer, J. PhyloBayes MPI: Phylogenetic reconstruction with infinite mixtures of profiles in a parallel environment. Syst. Biol. 2013, 62, 611–615. [Google Scholar] [CrossRef] [PubMed]
- Letunic, I.; Bork, P. Interactive tree of life (iTOL) v3: An online tool for the display and annotation of phylogenetic and other trees. Nucleic Acids Res. 2016, 44, W242–W245. [Google Scholar] [CrossRef] [PubMed]
- Yang, Z. PAML 4: Phylogenetic analysis by maximum likelihood. Mol. Biol. Evol. 2007, 24, 1586–1591. [Google Scholar] [CrossRef] [PubMed]
- Pond, S.L.; Frost, S.D.; Muse, S.V. HyPhy: Hypothesis testing using phylogenies. Bioinformatics 2005, 21, 676–679. [Google Scholar] [CrossRef] [PubMed]
- Zhang, Y. I-TASSER server for protein 3D structure prediction. BMC Bioinform. 2008, 9, 40. [Google Scholar] [CrossRef] [PubMed]
- DeLano, W.L. PyMOL: An open-source molecular graphics tool. Ccp4 Newslett. Protein Crystallogr. 2002, 40, 82–92. [Google Scholar]
- Rost, B.; Yachdav, G.; Liu, J. The PredictProtein server. Nucleic Acids Res. 2004, 32, W321–W326. [Google Scholar] [CrossRef]
- Wey-Fabrizius, A.R.; Podsiadlowski, L.; Herlyn, H.; Hankeln, T. Platyzoan mitochondrial genomes. Mol. Phylogenet. Evol. 2013, 69, 365–375. [Google Scholar] [CrossRef]
- Morales, H.E.; Pavlova, A.; Joseph, L.; Sunnucks, P. Positive and purifying selection in mitochondrial genomes of a bird with mitonuclear discordance. Mol. Ecol. 2015, 24, 2820–2837. [Google Scholar] [CrossRef]
- Pavlova, A.; Gan, H.M.; Lee, Y.P.; Austin, C.M.; Gilligan, D.M.; Lintermans, M.; Sunnucks, P. Purifying selection and genetic drift shaped Pleistocene evolution of the mitochondrial genome in an endangered Australian freshwater fish. Heredity 2017, 118, 466–476. [Google Scholar] [CrossRef]
- Kang, S.; Kim, J.; Lee, J.; Kim, S.; Min, G.S.; Park, J.K. The complete mitochondrial genome of an ectoparasitic monopisthocotylean fluke Benedenia hoshinai (Monogenea: Platyhelminthes). Mitochondrial DNA 2012, 23, 176–178. [Google Scholar] [CrossRef] [PubMed]
- Zhang, D.; Li, W.X.; Zou, H.; Wu, S.G.; Li, M.; Jakovlić, I.; Zhang, J.; Chen, R.; Wang, G.T. Homoplasy or plesiomorphy? Reconstruction of the evolutionary history of mitochondrial gene order rearrangements in the subphylum Neodermata. Int. J. Parasitol. 2019, 49, 819–829. [Google Scholar] [CrossRef] [PubMed]
- Boore, J.L.; Fuerstenberg, S.I. Beyond linear sequence comparisons: The use of genome-level characters for phylogenetic reconstruction. Philos. Trans. R. Soc. Lond. B Biol. Sci. 2008, 363, 1445–1451. [Google Scholar] [CrossRef] [PubMed]
- Zhang, D.; Li, W.X.; Zou, H.; Wu, S.G.; Li, M.; Jakovlic, I.; Zhang, J.; Chen, R.; Wang, G.T. Mitochondrial genomes of two diplectanids (Platyhelminthes: Monogenea) expose paraphyly of the order Dactylogyridea and extensive tRNA gene rearrangements. Parasit. Vectors 2018, 11, 601. [Google Scholar] [CrossRef]
- Zhang, J.; Wu, X.; Xie, M.; Li, A. The complete mitochondrial genome of Pseudochauhanea macrorchis (Monogenea: Chauhaneidae) revealed a highly repetitive region and a gene rearrangement hot spot in Polyopisthocotylea. Mol. Biol. Rep. 2012, 39, 8115–8125. [Google Scholar] [CrossRef]
- Le, T.H.; Blair, D.; McManus, D.P. Mitochondrial genomes of parasitic flatworms. Trends Parasitol. 2002, 18, 206–213. [Google Scholar] [CrossRef]
- Fumagalli, L.; Taberlet, P.; Favre, L.; Hausser, J. Origin and evolution of homologous repeated sequences in the mitochondrial DNA control region of shrews. Mol. Biol. Evol. 1996, 13, 31–46. [Google Scholar] [CrossRef]
- Simkova, A.; Plaisance, L.; Matejusova, I.; Morand, S.; Verneau, O. Phylogenetic relationships of the Dactylogyridae Bychowsky, 1933 (Monogenea: Dactylogyridea): The need for the systematic revision of the Ancyrocephalinae Bychowsky, 1937. Syst. Parasitol. 2003, 54, 1–11. [Google Scholar] [CrossRef]
- Plaisance, L.; Littlewood, D.T.J.; Olson, P.D.; Morand, S. Molecular phylogeny of gill monogeneans (Platyhelminthes, Monogenea, Dactylogyridae) and colonization of Indo-West Pacific butterflyfish hosts (Perciformes, Chaetodontidae). Zool. Scr. 2005, 34, 425–436. [Google Scholar] [CrossRef]
- Blasco-Costa, I.; Miguez-Lozano, R.; Sarabeev, V.; Balbuena, J.A. Molecular phylogeny of species of Ligophorus (Monogenea: Dactylogyridae) and their affinities within the Dactylogyridae. Parasitol. Int. 2012, 61, 619–627. [Google Scholar] [CrossRef]
- Mendoza-Palmero, C.A.; Blasco-Costa, I.; Scholz, T. Molecular phylogeny of Neotropical monogeneans (Platyhelminthes: Monogenea) from catfishes (Siluriformes). Parasit. Vectors 2015, 8, 164. [Google Scholar] [CrossRef] [PubMed]
- Kritsky, D.C.; Boeger, W.A. The phylogenetic status of the Ancyrocephalidae Bychowsky, 1937 (Monogenea: Dactylogyroidea). J. Parasitol. 1989, 75, 207–211. [Google Scholar] [CrossRef] [PubMed]
- Ferguson-Miller, S.; Hiser, C.; Liu, J. Gating and regulation of the cytochrome c oxidase proton pump. Biochim. Biophys. Acta 2012, 1817, 489–494. [Google Scholar] [CrossRef] [PubMed]
- Dowling, D.K.; Friberg, U.; Lindell, J. Evolutionary implications of non-neutral mitochondrial genetic variation. Trends Ecol. Evol. 2008, 23, 546–554. [Google Scholar] [CrossRef]
- The Editors of Encyclopaedia Britannica. Intestinal Gas. Available online: https://www.britannica.com/science/intestinal-gas (accessed on 20 October 2019).
- Smith, M.W. The in vitro absorption of water and solutes from the intestine of goldfish, Carassius auratus. J. Physiol. 1964, 175, 38–49. [Google Scholar] [CrossRef]
- Ern, R.; Huong, D.T.T.; Cong, N.V.; Bayley, M.; Wang, T. Effect of salinity on oxygen consumption in fishes: A review. J. Fish Biol. 2014, 84, 1210–1220. [Google Scholar] [CrossRef]
- Yamaguchi, Y.; Breves, J.P.; Haws, M.C.; Lerner, D.T.; Grau, E.G.; Seale, A.P. Acute salinity tolerance and the control of two prolactins and their receptors in the Nile tilapia (Oreochromis niloticus) and Mozambique tilapia (O. mossambicus): A comparative study. Gen. Comp. Endocrinol. 2018, 257, 168–176. [Google Scholar] [CrossRef]
- Potts, W.; Foster, M.; Rudy, P.; Howells, G.P. Sodium and water balance in the cichlid teleost, Tilapia mossambica. J. Exp. Biol. 1967, 47, 461–470. [Google Scholar]


| Gene | Position | Size | Intergenic Nucleotides | Codon | Anti-codon | Identity | ||
|---|---|---|---|---|---|---|---|---|
| From | To | Start | Stop | |||||
| E. malmbergi/A. mogurndae | ||||||||
| cox1 | 1/1 | 1551/1572 | 1551/1572 | ATG/GTG | TAG/TAG | 66.54 | ||
| trnT | 1579/1558 | 1646/1627 | 68/70 | 27/−15 | TGT/TGT | 57.14 | ||
| rrnL | 1647/1628 | 2599/2571 | 953/944 | 66.07 | ||||
| trnC | 2600/2572 | 2665/2638 | 66/67 | GCA/GCA | 50 | |||
| rrnS | 2666/2639 | 3408/3357 | 743/719 | 60.64 | ||||
| cox2 | 3409/3379 | 4005/3951 | 597/573 | 0/21 | ATG/ATG | TAA/TAA | 55.02 | |
| trnE | 4001/3947 | 4067/4014 | 67/68 | −5/−5 | TTC/TTC | 47.89 | ||
| nad6 | 4071/4022 | 4517/4468 | 447/447 | 3/7 | ATG/GTG | TAA/TAG | 50.56 | |
| trnY | 4519/4476 | 4586/4542 | 68/67 | 1/7 | GTA/GTA | 47.83 | ||
| trnL1 | 4585/4649 | 4650/4709 | 66/61 | −2/14 | TAG/TAG | 44.93 | ||
| trnS2 | 4651/4570 | 4716/4634 | 66/65 | 0/27 | TGA/TGA | 67.16 | ||
| trnL2 | 4727/- | 4794/- | 68/- | 10/0 | TAA/- | |||
| trnR | 4802/4939 | 4865/5003 | 64/65 | 7/229 | TCG/TCG | 64.62 | ||
| nad5 | 4867/5009 | 6420/6568 | 1554/1560 | 1/5 | ATG/ATG | TAG/TAG | 50.35 | |
| trnG | 7404/7999 | 7469/8065 | 66/67 | 983/1430 | TCC/TCC | 56.72 | ||
| cox3 | 7470/8070 | 8144/8723 | 675/654 | 0/4 | ATG/ATG | TAA/TAG | 50.81 | |
| trnH | 8125/8719 | 8189/8782 | 65/64 | −20/−5 | GTG/GTG | 69.23 | ||
| cytb | 8193/8786 | 9269/9871 | 1077/1086 | 3/3 | ATG/ATG | TAA/TAG | 66.57 | |
| nad4L | 9278/9862 | 9529/10107 | 252/246 | 8/−10 | ATG/ATG | TAG/TAG | 43.14 | |
| nad4 | 9502/10095 | 10716/11309 | 1215/1215 | −28/−13 | ATG/ATG | TAG/TAG | 51.18 | |
| trnQ | 10717/11311 | 10783/11372 | 67/62 | 0/1 | TTG/TTG | 64.71 | ||
| trnF | 10782/11372 | 10846/11437 | 65/66 | −2/−1 | GAA/GAA | 68.66 | ||
| trnM | 10839/11430 | 10904/11495 | 66/66 | −8/−8 | CAT/CAT | 62.69 | ||
| atp6 | 10908/11505 | 11417/12017 | 510/513 | 3/9 | ATG/ATG | TAA/TAG | 56.48 | |
| nad2 | 11422/12025 | 12243/12850 | 822/826 | 4/7 | ATG/ATA | TAG/T | 47.32 | |
| trnV | 12244/12851 | 12308/12916 | 65/66 | TAC/TAC | 65.15 | |||
| trnA | 12316/12921 | 12377/12982 | 62/62 | 7/4 | TGC/TGC | 74.19 | ||
| trnD | 12385/12983 | 12447/13048 | 63/66 | 7/0 | GTC/GTC | 43.94 | ||
| nad1 | 12453/13049 | 13340/13933 | 888/885 | 5/0 | ATG/ATG | TAG/TAG | 63.18 | |
| trnN | 13346/14006 | 13405/14073 | 60/68 | 5/2 | GTT/GTT | 60 | ||
| trnP | 13421/14076 | 13487/14141 | 67/66 | 15/2 | TGG/TGG | 62.69 | ||
| trnI | 13487/13937 | 13554/14003 | 68/67 | −1/3 | GAT/GAT | 82.35 | ||
| trnK | 13558/14568 | 13622/14634 | 65/67 | 3/7 | CTT/CTT | 54.41 | ||
| nad3 | 13624/14216 | 13971/14560 | 348/345 | 1/74 | ATG/ATG | TAG/TAG | 51.13 | |
| trnS1 | 13971/14634 | 14029/14691 | 59/58 | −1/−1 | GCT/TCT | 67.8 | ||
| trnW | 14042/14699 | 14104/14760 | 63/62 | 12/7 | TCA/TCA | 61.9 | ||
| GENES | AA Positions | PAML Branch-Site Model (p-Value < 0.05, Posterior Probabilities ≥ 95%) | HYPHY | PredictProtein (https://www.predictprotein.org//) | |
|---|---|---|---|---|---|
| FEL p < 0.05 | MEME p < 0.05 & β+ > α | ||||
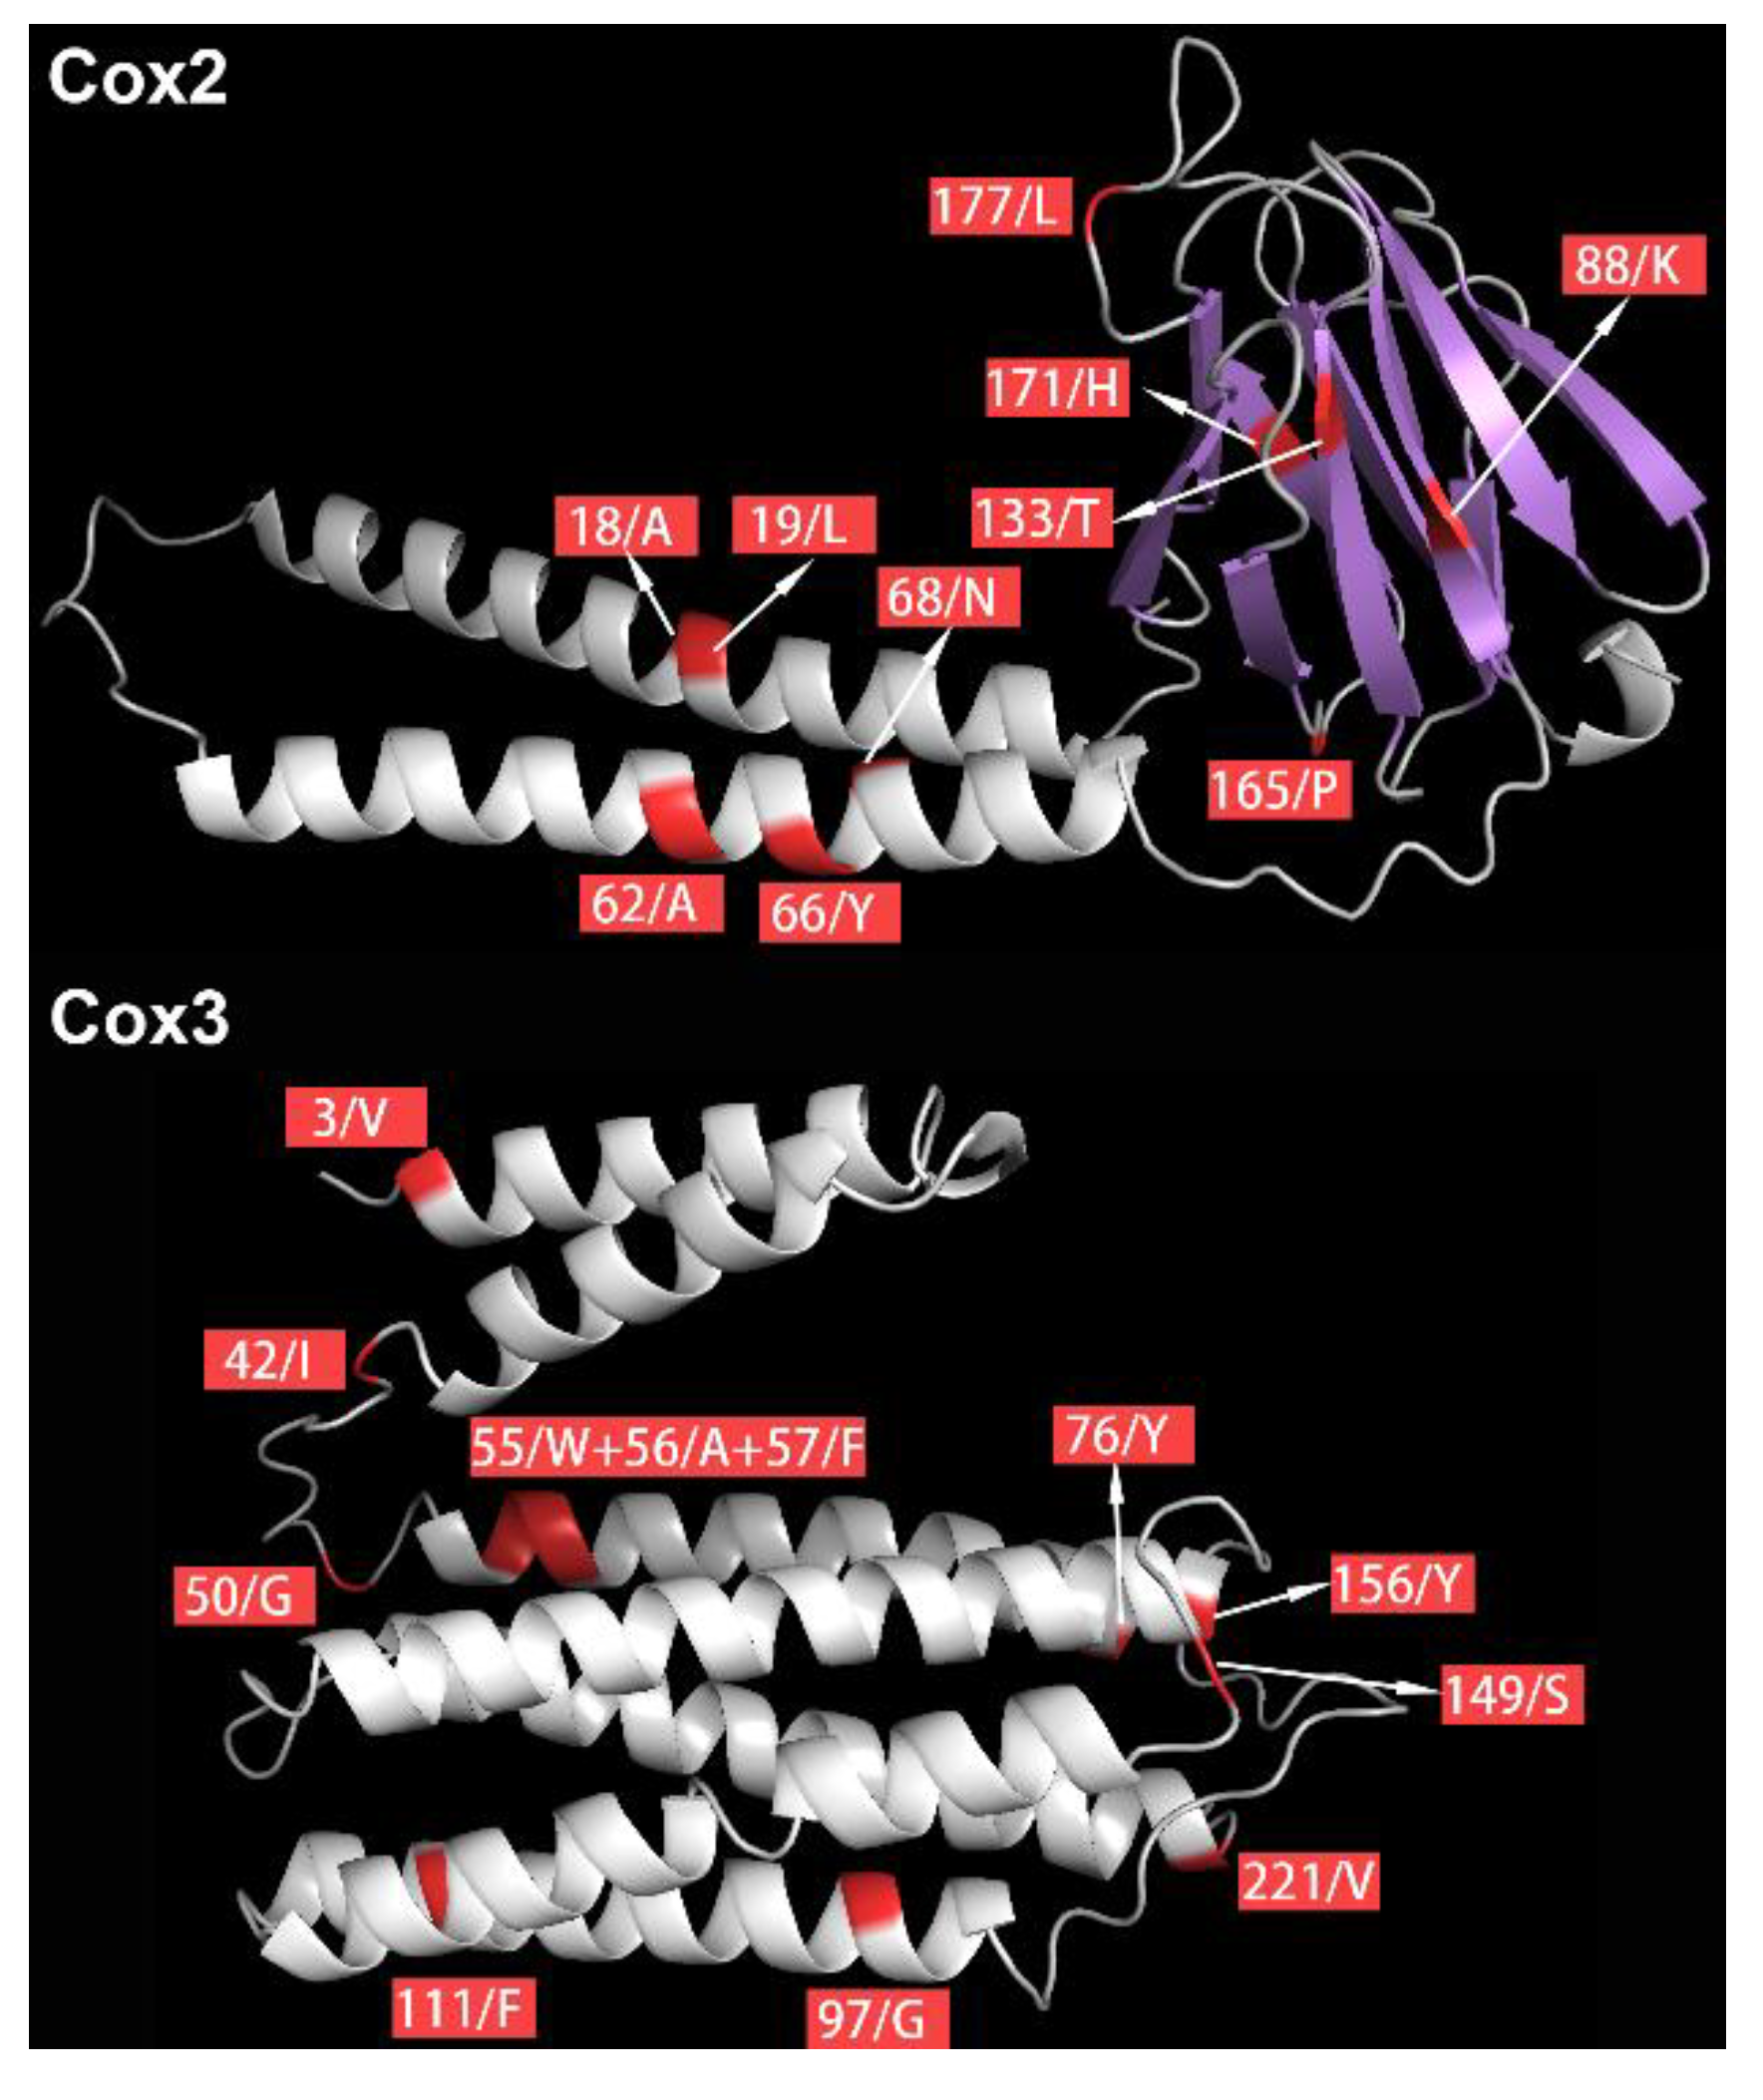
| cox2 | 2 | ✓ | ✓ | ||
| 5 | ✓ | ✓ | Protein binding region | ||
| 6 | ✓ | ✓ | Protein binding region | ||
| 7 | ✓ | ||||
| 8 | ✓ | Protein binding region | |||
| 9 | ✓ | ✓ | Protein binding region | ||
| 11 | ✓ | Helical transmembrane region | |||
| 15 | ✓ | ✓ | Helical transmembrane region | ||
| 18 | ✓ | ✓ | ✓ | Helical transmembrane region | |
| 19 | ✓ | ✓ | ✓ | Helical transmembrane region | |
| 20 | ✓ | ✓ | Helical transmembrane region | ||
| 28 | ✓ | Helical transmembrane region | |||
| 31 | ✓ | ✓ | Helical transmembrane region | ||
| 32 | ✓ | Helical transmembrane region | |||
| 39 | ✓ | ✓ | |||
| 44 | ✓ | ✓ | |||
| 45 | ✓ | ✓ | Protein binding region | ||
| 46 | ✓ | ||||
| 47 | ✓ | ✓ | |||
| 49 | ✓ | Helical transmembrane region | |||
| 51 | ✓ | Helical transmembrane region | |||
| 53 | ✓ | ✓ | Helical transmembrane region | ||
| 54 | ✓ | Helical transmembrane region | |||
| 57 | ✓ | Helical transmembrane region | |||
| 60 | ✓ | ✓ | Helical transmembrane region | ||
| 61 | ✓ | Helical transmembrane region | |||
| 62 | ✓ | ✓ | ✓ | Helical transmembrane region | |
| 64 | ✓ | ✓ | Helical transmembrane region | ||
| 66 | ✓ | ✓ | ✓ | Helical transmembrane region | |
| 68 | ✓ | ✓ | ✓ | Helical transmembrane region | |
| 69 | ✓ | Helical transmembrane region | |||
| 71 | ✓ | ||||
| 72 | ✓ | ✓ | |||
| 73 | ✓ | ✓ | |||
| 74 | ✓ | ✓ | |||
| 79 | ✓ | ✓ | Protein binding region | ||
| 80 | ✓ | ✓ | Protein binding region | ||
| 81 | ✓ | Protein binding region | |||
| 82 | ✓ | ✓ | |||
| 88 | ✓ | ✓ | ✓ | ||
| 91 | ✓ | ||||
| 99 | ✓ | ||||
| 117 | ✓ | ||||
| 118 | ✓ | ||||
| 119 | ✓ | ||||
| 126 | ✓ | ✓ | |||
| 128 | ✓ | ||||
| 129 | ✓ | ||||
| 133 | ✓ | ✓ | ✓ | ||
| 136 | ✓ | ||||
| 148 | ✓ | ✓ | |||
| 152 | ✓ | ||||
| 154 | ✓ | ||||
| 165 | ✓ | ✓ | ✓ | ||
| 170 | ✓ | ||||
| 171 | ✓ | ✓ | ✓ | Protein binding region | |
| 177 | ✓ | ✓ | ✓ | ||
| cox3 | 2 | ✓ | ✓ | Helical transmembrane region | |
| 3 | ✓ | ✓ | ✓ | Helical transmembrane region | |
| 8 | ✓ | ✓ | Helical transmembrane region | ||
| 11 | ✓ | Helical transmembrane region | |||
| 15 | ✓ | ✓ | Helical transmembrane region | ||
| 21 | ✓ | ||||
| 25 | ✓ | Helical transmembrane region | |||
| 40 | ✓ | ✓ | Helical transmembrane region | ||
| 42 | ✓ | ✓ | ✓ | ||
| 44 | ✓ | ✓ | |||
| 47 | ✓ | ✓ | |||
| 49 | ✓ | ||||
| 50 | ✓ | ✓ | ✓ | ||
| 52 | ✓ | Protein binding region; Polynucelotide-binding region | |||
| 53 | ✓ | ✓ | |||
| 55 | ✓ | ✓ | ✓ | Helical transmembrane region | |
| 56 | ✓ | ✓ | ✓ | Helical transmembrane region | |
| 57 | ✓ | ✓ | ✓ | Helical transmembrane region | |
| 60 | ✓ | Helical transmembrane region | |||
| 66 | ✓ | ✓ | Helical transmembrane region | ||
| 71 | ✓ | Helical transmembrane region | |||
| 73 | ✓ | ✓ | Helical transmembrane region | ||
| 74 | ✓ | Helical transmembrane region | |||
| 76 | ✓ | ✓ | ✓ | Helical transmembrane region | |
| 77 | ✓ | ✓ | Protein binding region | ||
| 82 | ✓ | ✓ | |||
| 83 | ✓ | ||||
| 85 | ✓ | ||||
| 90 | ✓ | ||||
| 91 | ✓ | ||||
| 94 | ✓ | ✓ | Helical transmembrane region | ||
| 96 | ✓ | Helical transmembrane region | |||
| 97 | ✓ | ✓ | ✓ | Helical transmembrane region | |
| 101 | ✓ | ✓ | Helical transmembrane region | ||
| 104 | ✓ | ✓ | Helical transmembrane region | ||
| 111 | ✓ | ✓ | ✓ | Helical transmembrane region | |
| 112 | ✓ | ✓ | Helical transmembrane region | ||
| 115 | ✓ | ✓ | |||
| 130 | ✓ | ✓ | Helical transmembrane region | ||
| 131 | ✓ | Helical transmembrane region | |||
| 132 | ✓ | ✓ | Helical transmembrane region | ||
| 139 | ✓ | ✓ | Helical transmembrane region | ||
| 147 | ✓ | ||||
| 149 | ✓ | ✓ | ✓ | ||
| 150 | ✓ | ||||
| 154 | ✓ | ||||
| 155 | ✓ | ||||
| 156 | ✓ | ✓ | ✓ | ||
| 157 | ✓ | ✓ | |||
| 160 | ✓ | ✓ | Helical transmembrane region | ||
| 163 | ✓ | ✓ | Helical transmembrane region | ||
| 164 | ✓ | Helical transmembrane region | |||
| 165 | ✓ | ✓ | Helical transmembrane region | ||
| 171 | ✓ | ✓ | Helical transmembrane region | ||
| 175 | ✓ | ✓ | Helical transmembrane region | ||
| 179 | ✓ | ✓ | Helical transmembrane region | ||
| 180 | ✓ | ✓ | Helical transmembrane region | ||
| 184 | ✓ | ✓ | |||
| 185 | ✓ | ✓ | |||
| 187 | ✓ | ✓ | Protein binding region | ||
| 189 | ✓ | Protein binding region | |||
| 191 | ✓ | ||||
| 195 | ✓ | ✓ | |||
| 196 | ✓ | ✓ | |||
| 197 | ✓ | ✓ | |||
| 199 | ✓ | ✓ | Helical transmembrane region | ||
| 216 | ✓ | Helical transmembrane region | |||
| 217 | ✓ | ✓ | Helical transmembrane region | ||
| 218 | ✓ | ✓ | Helical transmembrane region | ||
| 220 | ✓ | ✓ | Helical transmembrane region; Protein binding region | ||
| 221 | ✓ | ✓ | ✓ | Helical transmembrane region | |
© 2019 by the authors. Licensee MDPI, Basel, Switzerland. This article is an open access article distributed under the terms and conditions of the Creative Commons Attribution (CC BY) license (http://creativecommons.org/licenses/by/4.0/).
Share and Cite
Zhang, D.; Zou, H.; Wu, S.G.; Li, M.; Jakovlić, I.; Zhang, J.; Chen, R.; Li, W.X.; Wang, G.T. Evidence for Adaptive Selection in the Mitogenome of a Mesoparasitic Monogenean Flatworm Enterogyrus malmbergi. Genes 2019, 10, 863. https://doi.org/10.3390/genes10110863
Zhang D, Zou H, Wu SG, Li M, Jakovlić I, Zhang J, Chen R, Li WX, Wang GT. Evidence for Adaptive Selection in the Mitogenome of a Mesoparasitic Monogenean Flatworm Enterogyrus malmbergi. Genes. 2019; 10(11):863. https://doi.org/10.3390/genes10110863
Chicago/Turabian StyleZhang, Dong, Hong Zou, Shan G. Wu, Ming Li, Ivan Jakovlić, Jin Zhang, Rong Chen, Wen X. Li, and Gui T. Wang. 2019. "Evidence for Adaptive Selection in the Mitogenome of a Mesoparasitic Monogenean Flatworm Enterogyrus malmbergi" Genes 10, no. 11: 863. https://doi.org/10.3390/genes10110863
APA StyleZhang, D., Zou, H., Wu, S. G., Li, M., Jakovlić, I., Zhang, J., Chen, R., Li, W. X., & Wang, G. T. (2019). Evidence for Adaptive Selection in the Mitogenome of a Mesoparasitic Monogenean Flatworm Enterogyrus malmbergi. Genes, 10(11), 863. https://doi.org/10.3390/genes10110863