Abstract
Human skin dermis contains fibroblast subpopulations in which characterization is crucial due to their roles in extracellular matrix (ECM) biology. This study investigates the properties of fibroblasts localized at the frontier of deep dermis and hypodermis, i.e., dermo-hypodermal junction fibroblasts (F-DHJ), which were compared to intermediate reticular dermis (Fr) and superficial papillary dermis (Fp) fibroblasts. F-DHJ differed from Fr and Fp cells in their wider potential for differentiation into mesodermal lineages and in their absence of contractility when integrated in a three-dimensional dermal equivalent. The transcriptomic profile of F-DHJ exhibited specificities in the expression of genes involved in ECM synthesis-processing and “tissue skeleton” organization. In accordance with transcriptome data, ECM proteins, notably Tenascin C, distributions differed between the reticular dermis and the dermo-hypodermal junction areas, which was documented in normal adult skin. Finally, genome-wide transcriptome profiling was used to evaluate the molecular proximity of F-DHJ with the two dermal fibroblast populations (Fp and Fr) and with the mesenchymal stem cells (MSCs) corresponding to five tissue origins (bone marrow, fat, amnion, chorion, and cord). This comparative analysis classified the three skin fibroblast types, including F-DHJ, as a clearly distinct group from the five MSC sample origins.
1. Introduction
In human skin, interfollicular dermis is a heterogeneous tissue compartment, considering its fibroblast content and extracellular matrix (ECM) structure. Its segmentation into two biologically distinct territories (i.e., superficial papillary dermis and deeper reticular dermis) occurs during the embryonic development at 12 weeks of gestation in humans [1,2]. Major structural specificities of these dermal territories concern collagen reticulation and organization of the elastin network, which are dynamic characteristics in constant evolution during the intra-uterine and postnatal life (for review, see [3]).
Specificities of the different dermal territories also concern their fibroblast contents, in which characterization drives an increasing interest considering their widely expected functions in skin physiology. The existence of two dermal fibroblast populations, named papillary (Fp) and reticular (Fr) fibroblasts according to their dermal localization, was reported in human skin in the late seventies [4]. Since then, studies have been conducted to further explore their cellular properties [5] and molecular profiles [6,7]. Biological aspects that are attracting attention are the cellular and molecular changes that affect Fp and Fr cells through skin ageing [8,9].
Other fibroblast or fibroblast-like mesenchymal cell populations are present within the dermis, such as pericytes and telocytes. Pericytes appear in the fetal dermis at eight weeks of gestation in humans and acquire their mature characteristics at 21 weeks of gestation [10]. These cells contribute to the maintenance of capillary vessel integrity and may play a role in the maintenance of mesenchymal tissues in the contexts of homeostasis and/or wound healing [11]. In addition, pericytes may contribute to the niche that regulates the symmetrical versus asymmetrical division choice of epidermal keratinocyte precursors [12]. Telocytes possess an atypical fibroblast morphology characterized by long and slender moniliform cellular prolongations termed telopodes [13]. These cells serve as connecting devices, constructing homocellular junctions and connections with other cells types [14]. Telocytes are usually present at a low density (around 10 cells/mm2) [15]. These cells may participate in the stem cell niche, as shown in the intestine crypts [16]. Another described function of telocytes is the transmission of signals via atypical junctions [17] or extracellular vesicles [18], as reported in the heart. In the dermis, telocyte density augments with depth, together with the quantity of telopodes found in connection with endothelial cells, nerve endings, and hair follicle bulges [19]. Implications of telocytes in regeneration and wound healing is expected in skin but not fully demonstrated [19].
In the present study, we investigated the cellular and molecular properties of fibroblasts localized at the frontier of deep dermis and hypodermis, i.e., dermo-hypodermal junction fibroblasts (F-DHJ). Using parameters such as contractility, differentiation potential, and the supportive effect on epidermis reconstruction, we documented marked functional differences between F-DHJ and dermal (Fp and Fr) fibroblasts. At a molecular level, the study identified specific signatures in F-DHJ concerning the expression of genes involved in ECM synthesis-processing and “tissue skeleton” organization, which could explain structural properties of their tissue compartment. Finally, genome-wide transcriptome profiling was used to evaluate the molecular proximity of F-DHJ with the two dermal fibroblast populations (Fp and Fr) and the with mesenchymal stem cells (MSCs) corresponding to five tissue origins (bone marrow, fat, amnion, chorion, and cord). This approach identified skin fibroblasts and MSCs as distinct groups and will certainly contribute to the knowledge of the hierarchical clustering within the mesenchymal lineages.
2. Materials and Methods
2.1. Fibroblast Isolation and Culture
2.1.1. Human Skin Biopsy Collection
Full-thickness biopsies of human breasts and abdominal skin, collected from healthy subjects undergoing reconstructive or aesthetical surgery, were obtained from Icelltis (Toulouse, France); Alphenyx (Marseille, France); and Biopredic (Saint-Grégoire, France) under the authorizations delivered by the French Ministry of Research with the approval of the French Ethical Committee. The written informed consent was obtained from all individuals. The tissue collection used in this study included 10 biopsies of breast skin (mammoplasties) with ages ranging between 18 and 65 years and 6 biopsies of abdominal skin (abdominoplasties) with ages between 42 and 51 years. A typical skin section showing the papillary, reticular, and dermo-hypodermal dermis regions is shown in Figure 1A.
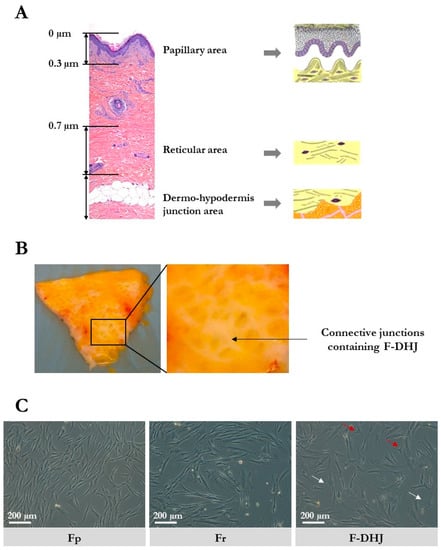
Figure 1.
Skin localization and cellular morphology of papillary dermis fibroblasts (Fp), reticular dermis fibroblasts (Fr), and dermo-hypodermal junction (DHJ) fibroblasts. (A) Representation of the papillary dermis, reticular dermis, and dermo-hypodermis junction areas. A typical full-thickness skin section is shown, as well as schemes of the three areas of interest. (B) Photographs of skin pieces taken from the below side after fat tissue removal, showing the macroscopic aspect of the conjunctival junctions that connect the dermis to the hypodermis. (C) Cellular morphology of cultured Fp, Fr, and DHJ fibroblasts. In F-DHJ cultures, red arrows point to small tricuspid cells and white arrows to large cells with a visible trabecular cytoplasmic network.
F-DHJ hypodermis was gently removed from skin biopsies by dissection using clamps and scissors to preserve the junction between hypodermis and dermis. Then, the tissue area containing the conjunctival junctions that connect the dermis to the hypodermis (Figure 1B) was harvested by dissection for extraction of fibroblasts from the demo-hypodermal junction (DHJ). Dissected pieces were checked under binocular loupe and selected according to the presence of both adipose tissue and conjunctival structures, validating their DHJ localization. F-DHJ were then extracted by tissue digestion with type II collagenase 0.2% (Gibco, France) for 2 h at 37 °C. Tissue dissociation was facilitated by 30 s of vortexing every 30 min.
2.1.2. Fp and Fr
After removing the epidermis by treatment with 2.4 U/mL dispase (Roche, Boulogne-Billancourt, France) for 16 h at 4°C and then mechanical dissection, papillary fibroblasts (Fp) were extracted by digestion of the tissue in type II collagenase 0.2% (Gibco, France) for 3 h at 37 °C. Tissue dissociation was facilitated by 30 s of vortexing every 30 min. Then, a second cut was performed on the noncut remaining part of the sample at a depth of 700 µm. This intermediate region of the dermis (depth between 300 and 700 µm) was not used for fibroblast extraction to avoid mixing papillary and reticular material. The deepest dermis slice (700 µm depth from skin surface and below) corresponded strictly to the reticular dermis and was used to extract the Fr fibroblast fraction by tissue digestion in type II collagenase 0.2% (Gibco, France) for 5 h at 37 °C. Tissue dissociation was facilitated by 30 s of vortexing every 30 min.
2.1.3. Bidimensional Mass Culture
Fp, Fr, and F-DHJ cells were cultured in similar conditions. Seeding density was 3800 cells/cm², and culture medium was composed of MEM supplemented with 10% FBS (PAN Biotech GmbH, Aidenbach, Germany); penicillin-streptomycin (20 U/mL) (Biochrom Ltd., Cambridge, UK); sodium pyruvate (Gibco, France); nonessential amino acids (Gibco, France); and glutamine (2 mM) (Invitrogen, Carlsbad, CA, USA). Cultures were incubated at 37 °C in a 90% humidified atmosphere containing 5% CO2.
2.2. Mesenchymal Stem Cell (MSC) Isolation and Culture
All human samples were collected and handled in full respect of the Declaration of Helsinki.
2.2.1. BM-MSCs
Human bone marrow MSCs (BM-MSCs) were obtained from patients undergoing routine total hip replacement surgery in Percy Hospital (Clamart, France) after written informed consent. As previously reported [20], spongious bone fragments were mixed in phosphate-buffered saline (PBS, PAN-Dominique Dutscher, Issy-les-Moulineaux, France); 1 mM EDTA (Prolabo-VWR, Paris, France); ACD-A; and 0.5% human serum-albumin (HAS, LFB). After 20 min of settling, the supernatant was collected, centrifuged at 480 g for 10 min, and filtered (70 µm). Bone marrow mononuclear cells (BM-MNCs) were counted using an automated cell analyzer (Sysmex, Villepinte, France)
2.2.2. Ad-MSCs
Human adipose tissue MSCs (Ad-MSCs) were isolated from fat obtained after liposuction surgery in Percy Hospital (Clamart, France) after written informed consent. Fat was washed by an addition of PBS supplemented with 1 µg/mL ciprofloxacin (Panpharma, Luitré, France). After centrifugation at 815 g for 2 min, the washing solution (containing blood, lipids, and adrenalin added before surgery) was discarded. This operation was repeated until washing solution was clear. Fat tissue was then enzymatically digested in 0.075% type I collagenase (75 mg/100 mL fat) for 45 min at 37 °C with agitation each 15 min. Digested fat was then centrifuged at 200 g for 5 min. The supernatant that contained lipids and adipocytes was discarded. The pellet that contained the stoma-vascular fraction was washed three times with α-MEM (Cliniscience, Nanterre, France) and filtered (70 µm). Cell numeration was performed after sample treatment with Zap Oglobin lytic reagent (Beckman Coulter, Villepinte, France).
2.2.3. Amnion, Chorion, and Umbilical Cord MSCs
Perinatal tissues were obtained from full-term deliveries after maternal written informed consent (Hôpital d’Instruction des Armées Bégin, Saint-Mandé). As previously reported [20], samples of placental membranes (amnion and chorion) and umbilical cords were incubated in an antibiotic and antifungal solution for 90 min at room temperature and then cut into pieces. Amnion and chorion 2 cm2 pieces were digested in PBS containing 0.1% type IV collagenase (Thermo-Fisher for Life Technologies, Waltham, MA, USA) and 2.4 U/mL grade II dispase (Roche, Boulogne-Billancourt, France) for 90 min at 37 °C and then in PBS containing 0.025% trypsin-EDTA (Thermo-Fisher for Life Technologies, Waltham, MA, USA) for 30 min at 37 °C. Umbilical cord 2 cm-long pieces were cut into smaller formats (around 1–2 mm3) for digestion in PBS containing 300 U/mL type I collagenase (Thermo-Fisher for Life Technologies, Waltham, MA, USA) and 1 mg/mL hyaluronidase (Calbiochem-Merck, Fontenay sous Bois, France) for 60 min at 37 °C and then in PBS containing 0.025% trypsin-EDTA (Thermo-Fisher for Life Technologies, Waltham, MA, USA) for 30 min at 37 °C. Cell samples were filtered through a 100 µm cell strainer (BD Biosciences, Le Pont de Claix, France) and then centrifuged at 200 g for 10 min. Cells were counted in a Malassez chamber using the trypan blue exclusion method.
2.2.4. Bidimensional Mass Cultures
Samples from the different tissue origins were cultured in the same conditions. Freshly-extracted cells were seeded at a density of 30000 cells/cm2 in a medium composed of α-MEM (Clinisciences, Nanterre, France) supplemented with 0.01 mg/mL ciprofloxacin; 2 U/mL heparin (Choay-Sanofi Aventis); and 5% platelet lysate (obtained from a platelet apheresis collection performed at the ‘Centre de Transfusion Sanguine des Armées’, Clamart). The medium was renewed 3 times a week. Cultures were trypsinized when reaching the stage of 80% confluence (trypsin-EDTA, Thermo-Fisher for Life Technologies, Waltham, MA, USA). Then, MSC subcultures were initiated at a density of 4,000 cells/cm2. For storage, MSC samples were frozen in α-MEM (Clinisciences, Nanterre, France) supplemented with 10% human serum-albumin and 10% DMSO (Sigma-Aldrich, St Louis, MO, USA).
2.3. Colony Assay
Cells were plated at low densities in 10 cm diameter culture-treated plastic petri dishes (400 cells/dish for Fp and 800 cells/dish for Fr and F-DHJ) and cultured during 3 weeks in a medium of similar composition to that used for mass cultures, which was renewed 3 times a week. Cultures were then fixed in 70% ethanol and stained with blue RAL. Colonies were counted manually.
2.4. Three-Dimensional Fibroblast Contractility Assay
Dermal equivalents (lattices) were produced by mixing 100000 fibroblasts in MEM containing 10% FBS and 26% (w/v) bovine type I collagen (Symatèse, Chaponost, France) in a total volume of 5 mL (3.4 mm diameter petri dishes). Spontaneous collagen polymerization occurred within a few hours of culture. Lattices were then detached from the plastic surface of petri dishes 48 h after culture initiation, enabling a contraction process that led to progressive reduction of the lattice diameter. Kinetics of contraction was characterized by measurement of the lattice diameter (millimeter scale) after 1 h, 3 h, 6 h, and 24 h. Full description of the assay principle is provided in [8].
2.5. Three-Dimensional Skin Reconstruction
Reconstructed skins were prepared as previously described [21]. Briefly, fibroblasts (1 × 10⁶ cells per sample of reconstructed dermis) were embedded into a bovine type I collagen gel (Symatese, Chaponost, France). Thereafter, keratinocytes (50,000 cells per sample) were seeded onto the lattices and stuck to the bottom of 60 mm diameter petri dishes. The keratinocytes used in this study were frozen banked samples from a single donor amplified in a serum-containing medium in the presence of a feeder-layer of growth-arrested murine 3T3 fibroblasts [5] according to the principle described by Rheinwald and Green [22]. Developing skin reconstructs were maintained for 1 week immersed in a medium composed of MEM (Invitrogen, Carlsbad, CA, USA) supplemented with 10% FBS (Sigma, St Louis, MO, USA); epidermal growth factor (EGF) (10 ng/mL) (BD Biosciences, San Jose, CA, USA); hydrocortisone (0.4 mg/mL) (Sigma, St Louis, MO, USA); and cholera toxin (0.1 nM) (Biomol Int., Plymouth, PA, USA). Complete epidermal stratification and full differentiation was obtained 1 week after raising the system at the air-liquid interface. During the whole process of skin reconstruction, cultures were maintained at 37 °C in a fully humidified atmosphere containing 5% CO2. Reconstructed skin samples were embedded in a paraffin and used to prepare hematoxylin eosin saffron-stained sections.
2.6. Neosynthetized ECM Samples
Protocol was adapted from [23]. Fibroblasts were seeded on glass slides and cultured till postconfluence. After an additional 48 h, slides were washed twice in PBS, and cells were then lysed using a solution containing 0.5% Triton X-100 and 20 mM of NH4OH. Cell debris were washed in PBS. Slides coated with ECM components synthesized by fibroblasts were stored in PBS at 4 °C until characterization.
2.7. Mesodermal Differentiation Assays
2.7.1. Adipocyte Lineage
Fibroblasts were seeded at a density of 1400 cells/cm2 and cultured in the medium used for mass expansion and colony assay till confluency. After an additional 48 h, the fibroblast cultures medium was substituted by an adipocyte differentiation medium composed of DMEM/20% fetal calf serum (PAN Biotech GmbH, Aidenbach, Germany); 60 µM indometacin (Dr. Ehrenstorfer GmbH, Germany); 0.5 mM 3-isobutyl-1-methylxanthine (IBMX) (Sigma, St Louis, MO, USA); and 10−6 M dexamethasone (Sigma, St Louis, MO, USA). After 3 weeks of cultures in the adipocyte differentiation medium, cultures were fixed in 4% paraformaldehyde. Cells differentiated into adipocytes were visualized and quantified under microscope according to the presence of refringent lipid droplets in the cytoplasm.
2.7.2. Osteoblast Lineage
As for adipocyte differentiation, the fibroblast culture medium was substituted 48 h postconfluency by an osteoblast differentiation medium composed of MEM/10% fetal calf serum (PAN Biotech GmbH, Aidenbach, Germany); 2 mM β-glycerophosphate (Sigma, St Louis, MO, USA); and 10−7 M dexamethasone (Sigma, St Louis, MO, USA). After 3 weeks of cultures in the osteoblast differentiation medium, cultures were fixed in 4% paraformaldehyde. Cells differentiated into osteoblasts were visualized and counted after alizarin-red staining of the calcified extracellular matrix.
2.7.3. Chondrocyte Lineage
For each sample, 105 cells were centrifuged and kept as pellets for 24 h to initiate formation of spheroid structures. The fibroblast culture medium was then substituted by a chondrocyte differentiation medium composed of MEM; 0.5 µg/mL insulin (Gibco, France); 0.5 µg/mL transferrin (Sigma, St Louis, MO, USA); 0.5 ng/mL sodium selenite (Gibco, France); 6.25 µg/mL linoleic acid (Gibco, France); 6.25 µg/mL oleic acid (Gibco, France); 1.25 mg/mL bovine serum-albumin (Sigma, St Louis, MO, USA); 1 mM of sodium pyruvate (Gibco, France); 0.17 mM ascorbic acid 2-phosphate (Sigma, St Louis, MO, USA); 0.1 µM dexamethasone (Sigma, St Louis, MO, USA); 0.35 mM proline; and 0.01 µg/mL of TGF-β1 (RnD System, France). After 3 weeks of cultures in the chondrocyte differentiation medium, spheroids were included in OCT for cryosectioning. Chondrocyte differentiation was revealed by toluidine blue (Sigma, St Louis, MO, USA) and safranin O (Thermo-Fisher, France) staining and immunostaining of aggrecan (ACAN) and collagen XIα1 (ColXIα1).
2.8. Transcriptome Analysis
2.8.1. RNA Extraction
Total RNA was extracted using the RNeasy kit (QIAgen, Courtaboeuf, France), using cultured fibroblasts at the stage of 7 to 10 population doublings. To limit the impact of experimental variations on gene expression profiles, culture conditions were standardized as follows: RNA extraction was systematically performed at 80% culture confluency and 24 h after a full medium renewal. Extracted RNA samples were split into aliquots in the perspective of microarray and qRT-PCR analyses.
2.8.2. Microarray Transcriptome Profiling
Human full-genome Affymetrix GeneChip HG-U133 Plus 2.0 (PartnerChip, Evry, France) were used following the manufacturer’s recommendations. These microarrays contain 55000 probe sets (25 nucleotides per set) covering 30000 transcripts. Briefly, RNA quality and quantity were estimated using the Nanodrop (ND-1000) and BioAnalyzer 2100 systems (Agilent, Les Ulis, France). When too-high concentrations of salts or solvents were detected, RNA precipitation and washing were performed before sample processing. Quantification of array fluorescence signals was carried out using a GeneChip 3000 scanner. Then, array data were analyzed using the Affymetrix Command Console software. Quality control and statistical analyses were performed using the Affymetrix Expression Console and GeneSpring GX11 softwares.
2.8.3. qRT-PCR
RNA samples were reverse-transcribed using the random primer and Superscript II Reverse transcriptase system following the manufacturer’s instructions (Invitrogen, France). Amplifications were performed using a MyiQTM LightCycler (Biorad, Marnes-la-Coquette, France). Real-time quantitative PCR was performed using a MyiQTM LightCycler (Biorad, Marnes-la-Coquette, France) and analyzed using the iQTM 5 software. Gene expression (primers listed in Table 1) was normalized according to GAPDH and TBP transcript levels.

Table 1.
qRT-PCR primers. Primer list and references are provided.
2.9. Immunofluorescence
2.9.1. Tissue Section Staining
Skin samples were fixed in neutral formalin and then embedded in a paraffin. Tissue sections of 5 µm thickness were prepared. For antibody staining, sections were permeabilized in 0.1% SDS after deparaffinization and epitope retrieval in a citrate buffer (pH = 6). To limit background signals, unspecific antibody fixation sites were saturated by sample incubation in 5% BSA. Sections were incubated with primary and secondary Alexa Fluor-coupled antibodies (see Table 2 for antibody references and working dilutions). Stained skin sections were mounted in ProLong Gold supplemented with DAPI (Thermo for Molecular Probes, Waltham, MA, USA, and images were acquired using a Leica microscope coupled with a QIMAGINE RETIGA 2000R Fast 1394 camera. Signal quantification was performed using ImageJ software. Quantification of cells positive for KLF9 expression was performed by visual counting on skin samples from 4 donors. Percentages of KLF9+ cells were determined in a total of 806 cells for Fr, 289 cells for Fr, and 246 cells for F-DHJ fibroblasts.
Table 2.
Antibodies. Antibody references and working dilutions are provided.
2.9.2. Cell Staining
Cultured cells were fixed in 4% paraformaldehyde, permeabilized in 0.1% SDS, and incubated in 5% BSA for saturation of unspecific antibody binding sites and then with primary and secondary Alexa Fluor-coupled antibodies (see Table 2). Labeled cells were mounted in ProLong Gold supplemented with DAPI (Thermo - Molecular Probes, Waltham, MA, USA). Immunofluorescence images were acquired using a Leica microscope coupled with a QIMAGINE RETIGA 2000R Fast 1394 camera (QImageing, Canada). Signal quantification was performed using ImageJ software.
2.9.3. ECM Staining
ECM slides were incubated in 5% BSA for saturation of unspecific antibody binding sites. Incubation with Alexa Fluor-coupled antibodies (Zenon technology – Thermo – Molecular Probes, Waltham, MA, USA) was performed during 30 min at room temperature (see Table 2). Immunofluorescence images were acquired using a Leica microscope coupled with a QIMAGINE RETIGA 2000R Fast 1394 camera (QImageing, Surrey, BC, Canada). Signal quantification was performed using ImageJ software.
2.10. Western Blot Analysis
Expression of KLF9 was assessed by western blot analysis on total protein extracts from cell cultures. Protein extracts were prepared using a radioimmunoprecipitation assay (RIPA) buffer. Proteins (40 μg) were separated by 15% sodium dodecyl sulphate-polyacrylamide gel electrophoresis (PAGE) and electrotransferred onto a 0.45 µm nitrocellulose membrane. The membrane was incubated with the primary antibody, washed, and probed with the peroxidase-labeled secondary antibody. Detection was achieved by enhanced chemiluminescence (West Femto HRP substrates, ThermoFisher Scientific, France). After dehybridization, control loading was achieved by anti-glyceraldehyde-3-phosphate dehydrogenase antibodies. Densitometric analyses were performed using ImageJ.
2.11. Statistics
Error bars represent SEM. The Wilcoxon-Mann-Whitney test and the Friedman test were applied to determine p-values. Data with p < 0.05 (*) or p < 0.01 (**) were considered as statistically significant.
3. Results
3.1. Cellular Characteristics and Growth Potential Distinguish F-DHJ from Fp and Fr
The cellular morphology of the three fibroblast populations were isolated based on their skin localization, i.e., papillary dermis fibroblasts (Fp), reticular dermis fibroblasts (Fr), and dermo-hypodermal junction fibroblasts (F-DHJ) were examined in cultures and compared (Figure 1C). As previously described [4], Fp cells exhibited a thin morphology, with bi or tricuspid shapes, whereas Fr had spread morphologies and stellate shapes. F-DHJ were more heterogeneous, from small tricuspids (red arrow) to larger cells with stellate shapes (white arrow) with visible trabecular networks.
Analysis of the four markers proposed in Gabbiani’s classification [24] (Figure 2A,B) confirmed the fibroblast statuses of the Fp, Fr, and F-DHJ cellular material, as all cell types expressed almost homogenously actin (ACT) and vimentin (VIM) but expressed neither desmin (DES) nor α-smooth muscle actin (α‑SMA): ACT+/VIM+/DES−/α‑SMA− phenotype. In each population, only a minority of cells exhibited the myofibroblast ACT+/VIM+/DES−/α‑SMA+ phenotype, probably due to the cultures’ environments. Few cells corresponding to the ACT+/VIM−/DES+/α‑SMA+ vascular smooth muscle cell phenotype were also detected. In addition, the Fr population contained few ACT+/VIM−/DES−/α‑SMA+ cells, corresponding to smooth muscle cells probably originating from arrector pili muscles.
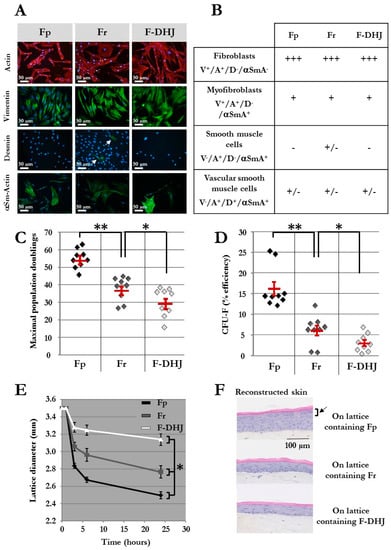
Figure 2.
Phenotypic and functional properties of Fp, Fr, and F-DHJ fibroblasts. (A) Detection of actin (ACT) and vimentin (VIM), desmin (DES), and α-smooth muscle actin (α‑SMA) by immunochemistry in cultured Fp, Fr, and F-DHJ fibroblasts in the perspective of scoring according to Gabbiani’s classification [24]. White arrow points to rare DES+ cells present within the Fr population. (B) Scoring of Fp, Fr, and F‑DHJ fibroblasts according to ACT, VIM, DES, and α‑SMA detection: (−) = not present, (+/−) = low representation, (++) = frequent representation, and (+++) = major representation. (C) Long-term growth capacity of Fp, Fr, and F‑DHJ cells. Maximal cumulative population doubling values obtained with samples from independent donors are shown. Means ± SEM are indicated (* p < 0.05, ** p < 0.01; Wilcoxon test). (D) Colony-forming unit efficiency of Fp, Fr, and F‑DHJ cells. Fibroblast colony-forming unit (CFU-F) efficiency values (% of plated cells) obtained with samples from independent donors are shown. Means ± SEM are indicated (* p < 0.05, ** p < 0.01; Wilcoxon test). (E) Contractile capacity of Fp, Fr, and F‑DHJ cells in the 3D context of collagen lattices. Kinetics of lattice diameter evolutions. Means ± SEM are indicated (values obtained with samples from 9 independent donors) (* p < 0.05, Friedman’s test). (F) Efficiency of Fp, Fr, and F‑DHJ cells in promoting epidermis organogenesis by keratinocytes in a 3D reconstructed skin model. Representative reconstructed skin sections are shown (3 independent donors, each fibroblast sample tested in triplicates). The black arrow points to the epidermal granular layer that was obtained only in the presence of Fp fibroblasts.
The proliferative capacity of Fp, Fr, and F-DHJ cells was assessed in mass long-term cultures (Figure 2C) and using a colony assay (Figure 2D) (cell samples from n = 9 individuals were studied). As previously described [4,5], the proliferative capacity of Fr was lower than that of Fp, according to both criteria. Indeed, the maximum population doublings (PD) reached by Fp was 54 ± 2 versus 37 ± 2 for Fr (p < 0.01), and colony-forming efficiency was 16.2% ± 1.7 for Fp and 6.1% ± 1.2 for Fr (p < 0.01). F-DHJ exhibited the lowest growth capacity of the three fibroblast types, with a maximum PD reaching only 29 ± 3 and colony-forming efficiency 3% ± 0.7 (p < 0.05, calculated versus Fr).
Taken together, these data show that Fp, Fr, and F-DHJ fibroblasts exhibit different cellular characteristics.
3.2. Behavior in 3D Tissue and Differentiation Potential Distinguish F-DHJ from Fp and Fr
A functional assay was designed to assess fibroblast contractile capacity in a three-dimensional environment based on a follow-up of collagen lattice contractions. Fp, Fr, and F-DHJ integrated in collagen lattices exhibited nonequivalent contraction behaviors (Figure 2E) (cell samples from n = 9 individuals were tested). Reduction of the lattice diameter was more rapid and marked with Fp than with Fr cells. In contrast, a more moderate lattice diameter reduction was observed with F-DHJ cells, indicating a lower contractile capacity for this fibroblast population. The three lattice contraction curves showed statistically significant differences (p < 0.05).
The next functional property of Fp, Fr, and F-DHJ that was investigated and compared was their efficiency in promoting epidermis organogenesis by keratinocytes in a model of in vitro three-dimensional skin reconstruction. Lattices containing either Fp, Fr, or F-DHJ cells were produced and used as dermal equivalents. On top of which, keratinocytes were then plated in order to obtain epidermis development (Figure 2F) (fibroblasts samples from n = 3 individuals were tested, in association with keratinocytes from a single donor). Fp cells were the most efficient fibroblast population for promoting the development of a correctly differentiated epidermis comprising a regular basal layer, as well as fully differentiated granular and horny layers. Epidermis reconstructs were of a lower quality with dermal lattices containing Fr fibroblasts; basal keratinocytes were of bigger sizes and less regular, and differentiation of the granular layer was incomplete. Dermal lattices populated with F-DHJ promoted poor epidermis stratification and differentiation.
Finally, Fp, Fr, and F-DHJ were studied for their differentiation capacity into three mesodermal cell lineages: adipocytes (presence of cytoplasmic lipid droplets); osteoblasts (alizarin-red staining); and chondrocytes (toluidine blue and safranin O staining, aggrecan (ACAN) and collagen XIα1 (ColXIα1) expression). This functionality was documented using cells obtained from skin biopsies corresponding to ages ranging between 20 and 31 years (Figure 3). Interestingly, F‑DHJ exhibited a wider differentiation potential than that of Fp and Fr fibroblasts, as these cells efficiently responded to the three lineage-oriented differentiation conditions. Fp fibroblasts gave rise to fewer quantities of adipocytes and chondrocytes and did not differentiate into osteoblasts. Fr fibroblasts could give rise to differentiated cells of the three lineages but with a much lower efficiency than F-DHJ cells.
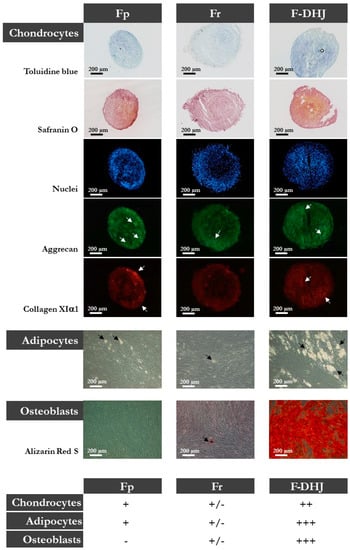
Figure 3.
Differentiation capacities of Fp, Fr, and F-DHJ fibroblasts into mesodermal lineages. Samples from 5 independent “young” donors (20, 22, 25, 28, and 31 years old) were tested for their capacity to differentiate into chondrocytes (toluidine blue and safranin O staining, aggrecan (ACAN) and collagen XIα1 (ColXIα1) expression, white arrows); adipocytes (presence of cytoplasmic lipid droplets, black arrows); and osteoblasts (alizarin-red staining). Scoring of differentiation capabilities are presented: (−) = not present, (+/−) = low representation, (++) = frequent representation, and (+++) = major representation.
Taken together, these data show that Fp, Fr, and F-DHJ fibroblasts exhibit different functional characteristics.
3.3. Molecular Profiles Distinguish the Fp, Fr, and F-DHJ Fibroblast Populations
The molecular profiles of Fp, Fr, and F-DHJ cells were characterized and compared by microarray genome-wide transcriptome profiling (Figure 4 and Figure 5A). In the perspective of identifying molecular signatures distinguishing the Fp, Fr, and F-DHJ fibroblast populations whatever the donor’s age, the selected donor cohort covered both young and older ages: 22, 25, 28, 55, 61, and 65 y.o. As a first screen, a fold-change threshold value of three, together with a p-value of 0.05, were used to identify differential signals. According to these filters, a hierarchical clustering was built based on expression levels of 1078 transcripts, identifying signatures that validated at the transcriptome level of the distinct natures of Fp, Fr, and F-DHJ (Figure 4A). Next, transcriptome data were reanalyzed considering only the statistical significance threshold (p-value < 0.05) independently of fold-change values (Figure 4B). This analysis identified 3420, 2073, and 2929 probe sets, which could be used to define signatures of Fp, Fr, and F-DHJ cells, respectively. Fr cells shared the highest level of commonalities with the other fibroblast populations, probably due to their intermediate tissue localization: 3270 probe sets in common with Fp (not detected in F-DHJ) and 2284 probe sets in common with F-DHJ (not detected in Fp).
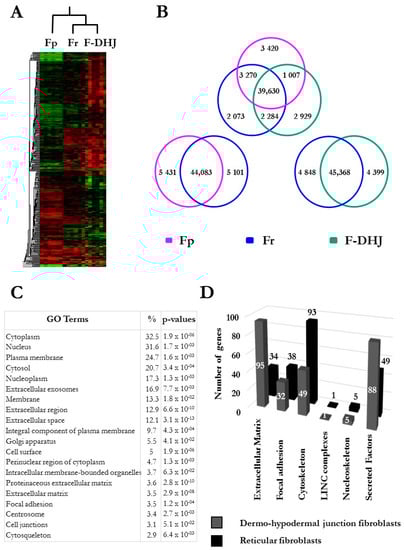
Figure 4.
Microarray analysis of the transcriptome profiles of Fp, Fr, and F-DHJ fibroblasts (donors’ ages: 22, 25, 28, 55, 61, and 65 y.o.). (A) Hierarchical clustering based on 1078 differentially expressed transcripts (fold-change cutoff at 3 and p < 0.05). (B) Venn Diagrams summarizing Fp, Fr, and F-DHJ-enriched transcriptional signatures (p < 0.05). (C) List of the 20 most significant gene ontology (GO) terms differentiating F-DHJ from Fr cells, based on 2540 probe sets (1647 transcripts) exhibiting differential signals (fold-change >1.5 and p < 0.05). (D) Signatures identifying Fr fibroblasts (black bars) and F-DHJ fibroblasts (grey bars) among transcripts related to the tissue skeleton biology (fold-change >1.5 and p < 0.05).
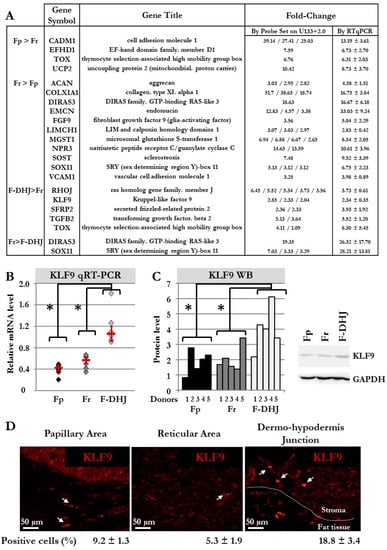
Figure 5.
Biomarker validations at mRNA and protein levels. (A) Selection of transcripts in which differential expression was confirmed by qRT-PCR in cell samples from 6 donors (donors’ ages: 22, 25, 28, 55, 61, and 65 y.o). (B) Detailed qRT-PCR comparative analysis of the KLF9 transcript in cells from the 6 donors (donors’ ages: 22, 25, 28, 55, 61, and 65 y.o). Means ± SEM are indicated (* p < 0.05, Wilcoxon test). (C) Western blot comparative analysis of the KLF9 protein in cells from the 5 donors (* p < 0.05, Wilcoxon test). A histogram detailing quantifications and a representative western blot gel is shown. (D) Immunofluorescence detection of the KLF9 protein in skin sections (breast). The percentage of KLF9+ cells was determined by observation under a fluorescence microscope of a total of 806 cells for Fp, 289 cells for Fr, and 246 cells for F-DHJ fibroblasts (skin sections from 4 donors were included in the analysis).
F-DHJ were then compared more specifically with Fr cells, which are in spatial proximity in the tissue. A gene ontology (GO) term analysis was performed based on 2540 probe sets (1647 genes) exhibiting differential signals between the two populations (parameters: fold-change >1.5 and p-value < 0.05) (Figure 4C). Notably, this analysis revealed marked differences between Fr and F‑DHJ concerning the expression of transcripts related to the tissue skeleton (see [9]), as 26% of the transcripts differentially expressed were linked to the structuration of this network (Figure 4D and Table 3). In particular, differentially expressed probe sets were enriched in transcripts related to ECM components, cytoskeleton, and secreted factors.
Table 3.
Transcripts related to the tissue skeleton differentially expressed in reticular dermis fibroblasts (Fr) and dermo-hypodermal junction fibroblasts (F-DHJ). This transcript list was extracted from microarray data using a fold-change >1.5 and p < 0.05 as inclusion parameters. The transcript signature with predominant expression in Fr cells concerned 297 probe sets corresponding to transcripts directly involved in the tissue skeleton structure, comprising 33 transcripts related to the extracellular matrix (ECM), 125 focal adhesion point transcripts, 60 cytoskeleton transcripts, 1 LINC complex transcript, and 8 nucleoskeleton transcripts. The transcript signature with predominant expression in F-DHJ cells concerned 359 probe sets corresponding to transcripts directly involved in the tissue skeleton structure, comprising 94 transcripts related to ECM, 76 focal adhesion point transcripts, 50 cytoskeleton transcripts, 1 LINC complex transcript, and 7 nucleoskeleton transcripts. In addition, transcripts encoding soluble factors were found in both signatures, respectively 70 and 131 for Fr and F-DHJ cells.
For validation of our microarray data, 19 genes were selected from the signatures that distinguished Fp, Fr, and F-DHJ identities, and transcript levels were analyzed by qRT-PCR in cell samples from the six donors (Figure 5A,B). Validation of microarray data was obtained for the 19 selected transcripts. As an attempt to identify a biomarker of F-DHJ cells, a focus was made on KLF9, which the transcript was detected as overexpressed in F-DHJ versus Fr by both technics in the six tested donors. The transcription factor KLF9 regulates the early phases of adipocyte differentiation [25], and thus, attracted attention due to the proximity of F-DHJ cells with hypodermis adipose tissue. Expression of KLF9 was analyzed at the protein level by western blot in cultured cells from six donors (Figure 5C) and by immune-fluorescence in skin biopsies from four individuals (Figure 5D). As expected from transcriptome data, the KLF9 protein was expressed at a higher level in cultured F-DHJ than in cultured Fp and Fr (p < 0.05). In skin sections, the percentage of cells expressing KLF9 was higher in F-DHJ than in Fp and Fr regions, respectively 18.8 ± 3.4% versus 9.2 ± 1.3% and 5.3 ± 1.9%.
3.4. The Dermo-Hypodermal Junction and Reticular Dermis Differ in Their Matrix Architectural Meshwork
From the lists of transcripts differentially expressed between F-DHJ and Fr, our attention was attracted by tenascin C (TNC), considering its major role in the organization of collagen fibril anchoring points. Indeed, TNC forms a typical disulfide-linked hexamer, called the hexabrachion, in which six flexible arms emanate from a central globular particle, which possibly catches and stabilizes a bifurcation of the ECM fibrils composed of FN1 and type I collagen to underlie the extracellular meshwork architecture (for review, see [26]). Our transcriptome analysis indicated a 2.61-fold lower expression of TNC in F-DHJ versus Fr cells (Table 3). To explore this property at the protein level, immunostaining of TNC was performed on samples of ECM synthesized by F-DHJ and Fr cells in vitro (Figure 6A,B) (cells from n = 3 individuals were tested). Notably, reticulation of TNC was more marked in ECM samples synthesized by Fr than in ECM secreted by F-DHJ (Figure 6A). Moreover, signal quantification indicated TNC levels lower in ECM produced by F-DHJ versus Fr (p < 0.01) (Figure 6B).
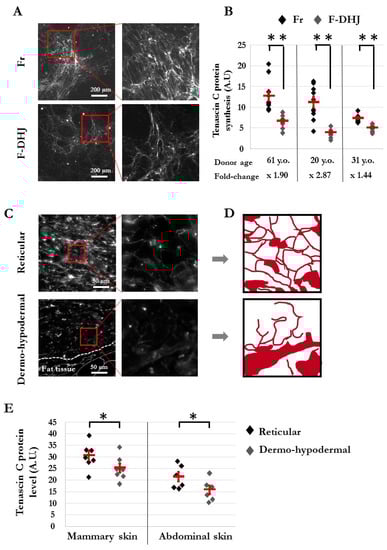
Figure 6.
Architecture of the tenascin C (TNC) meshwork produced in vitro by Fr and F-DHJ fibroblasts in skin sections. (A) Immunostaining pictures of the TNC meshwork produced by Fr and F-DHJ cells in 2D cultures. (B) Quantification of TNC secreted in 2D cultures. Cell samples from 3 donors were used. Values corresponding to 10 replicate analyses for each cell sample are shown. Means ± SEM are indicated (** p < 0.01, Wilcoxon test) A.U. for arbitrary units. (C) Photographs of TNC immunostaining in skin sections, illustrating the structural differences between reticular dermis and the dermo-hypodermal junction area (representative from 13 analyzed donors). (D) Image reconstitution of TNC meshwork architectures based on the immunostaining photographs shown in panel (C). (E) Quantification of TNC in the skin reticular and dermo-hypodermal areas. Values obtained from the analysis of skin samples from 13 donors are shown. Samples from two anatomical localizations: breast skin (7 donors of ages between 18 and 65 years) and abdominal skin (6 donors of ages between 42 and 51 years). No age-related changes in TNC synthesis/meshwork were observed. Means ± SEM are indicated (* p < 0.05, Wilcoxon test) A.U. for arbitrary units.
Architectural differences between the DHJ and reticular areas were confirmed in skin sections (Figure 6C–E). In the reticular area, TNC protein-staining revealed a thin mesh structuration around collagen bundles in agreement with the alveolar organization of this dermal territory, whereas this structuration was not present in the DHJ area (Figure 6C,D). In addition, quantification of the TNC immunostaining signals performed in sections of mammary skin (biopsies from seven individuals) and abdominal skin (six individuals) indicated a higher level of TNC in the reticular dermis area than in the HDJ area for both skin anatomical origins (p < 0.05) (Figure 6E).
3.5. F-DHJ Fibroblasts and Adipose-Derived MSCs Exhibit Distinct Transcriptome Profiles
Given the anatomical proximity between F-DHJ and MSCs derived from hypodermal adipose tissues, their molecular characteristics were explored at the level of the global transcriptome to determine whether these two cell populations have a distinct identity or not. To widen this question, the three fibroblast types (Fp, Fr, and F-DHJ) were analyzed together with MSC samples corresponding to five sources (bone marrow aspirates, adipose tissue, amnion, chorion, and umbilical cord jelly) (Figure 7). A hierarchical clustering based on 380 discriminant probe sets revealed a clear segmentation between the “fibroblast” group and the “MSC” group (Figure 7A), which confirmed the distinct identities of F-DHJ and adipose MSCs. Within the “fibroblast” group, F-DHJ appeared more similar with Fr than they were with Fp cells. Within the “MSC” group, cells from the three fetal origins (amnion, chorion, and cord) were more similar to each other than they were with the two adult origins (marrow and adipose). This clustering was confirmed when a full transcriptome analysis was considered (Pearson correlation coefficients) (Figure 7B). To document biological characteristics distinguishing the fibroblast and MSC groups, a gene ontology (GO) term analysis was performed based on 2974 probe sets (1984 genes) distinguishing the two sample groups (parameters: fold-change >2 and p-value <0.05). Among the twenty most significant GO terms, transcripts related to structuration of the tissue skeleton were largely represented, including numerous ECM, focal adhesion, cytoskeleton, LINC complexes, nucleoskeleton, and secreted factor transcripts, in which their levels distinguish fibroblasts from MSCs (Figure 7C,D and Table 4). In particular, a signature of 42 transcripts directly related to ECM structure and composition was identified (Figure 7E), constituting a pool of candidates to further explore the biological differences between F-DHJ and adipose MSCs.
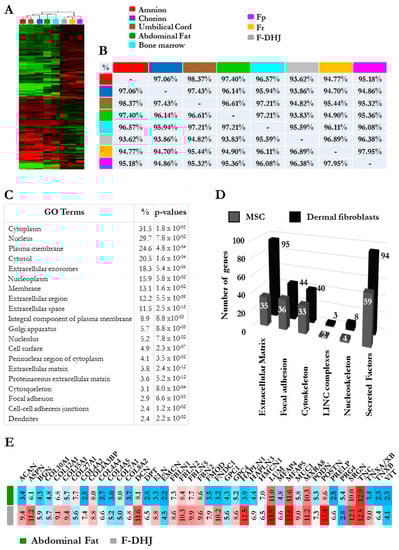
Figure 7.
Comparative microarray transcriptome profiling of the three fibroblasts populations (Fp, Fr, and F-DHJ) and mesenchymal stem cell (MSC) samples corresponding to five sources (bone marrow aspirates, adipose tissue, amnion, chorion, and umbilical cord jelly). (A) Hierarchical clustering of fibroblast and MSC samples based on the 380 most discriminant probe sets showing a marked distinction between the “fibroblast” and “MSC” groups. (B) Pearson correlation coefficients evaluating sample-to-sample proximity based on comparisons of global transcriptome profiles. Notably, this analysis showed the low proximity between F-DHJ with adipose tissue MSCs (93.83% similarity) and high proximity with Fr fibroblasts (96.89% similarity). (C) List of the 20 most significant gene ontology (GO) terms differentiating the “fibroblast” and “MSC” groups based on 2974 probe sets (1984 transcripts) exhibiting differential signals (fold-change > 2 and p < 0.05). (D) Signatures identifying the “fibroblast” group (black bars) and the “MSC” group (grey bars) among transcripts related to the tissue skeleton biology (fold-change >2 and p < 0.05). (E) Focus on 42 transcripts directly involved in the structuration and composition of the ECM network and identified within the signature that distinguishes the “fibroblast” and “MSC” groups. Values were obtained by GCRMA microarray signals and corresponded to an indication of transcript levels (arbitrary units) in F-DHJ and adipose MSCs.
Table 4.
Transcripts related to the tissue skeleton, in which differential expressions distinguish the “fibroblast” and mesenchymal stem cell or “MSC” groups. This transcript list was extracted from microarray data using fold-change >2 and p < 0.05 as inclusion parameters. The transcript signature with predominant expression in the “fibroblast” group concerned 424 probe sets corresponding to transcripts directly involved in the tissue skeleton structure, comprising 145 transcripts related to ECM, 63 focal adhesion point transcripts, 68 cytoskeleton transcripts, 4 LINC complex transcripts, and 12 nucleoskeleton transcripts. The transcript signature with predominant expression in the “MSC” group concerned 241 probe sets corresponding to transcripts directly involved in the tissue skeleton structure, comprising 53 transcripts related to ECM, 63 focal adhesion point transcripts, 52 cytoskeleton transcripts, 2 LINC complex transcripts, and 7 nucleoskeleton transcripts. In addition, transcripts encoding soluble factors were found in both signatures, respectively 132 and 79 for the “fibroblast” and “MSC” groups.
3.6. Differentiation Capacity is Reduced in F-DHJ from Aged Skin
Finally, the capacity for differentiation into the adipocyte, osteoblast, and chondrocyte lineages was compared in F-DHJ samples from “young” (between 20 and 31 years, n = five donors) and “older” (between 55 and 65 years, n = four donors) ages (Figure 8). The three-lineage mesenchymal differentiation potential of F-DHJ described in Figure 3 appeared altered in cell samples from older skin biopsies (Figure 8A–D). Although chondrocyte differentiation was maintained (Figure 8A–D), the capacity for differentiation into osteoblasts was reduced (Figure 8B,D) and differentiation into the adipocyte lineage was almost lost (Figure 8C,D). A comparative analysis of the differentiation potential of Fp, Fr, and F-DHJ from old donors indicated functional differences (data not shown). The capacity for differentiation into adipocytes persisted with a low efficiency in old Fp and Fr, although it was lost with age in F-DHJ. In contrast, differentiation into osteoblasts was not obtained with old Fp or Fr, whereas this capacity was present in old F-DHJ. Finally, we observed that the capacity for differentiation into chondrocytes was increased with age in the three cell types but remained more efficient in F-DHJ, as compared with Fp and Fr cells. In addition to these age-related changes in the F-DHJ differentiation potential, the extracellular deposition of ColXIα1 and ACAN were respectively 3.6-fold and 2.5-fold higher in skin biopsies from the older than in the young donor group (p < 0.05) (Figure 8E,F). These observations pinpoint the interest of considering F-DHJ cells in future studies on skin ageing.
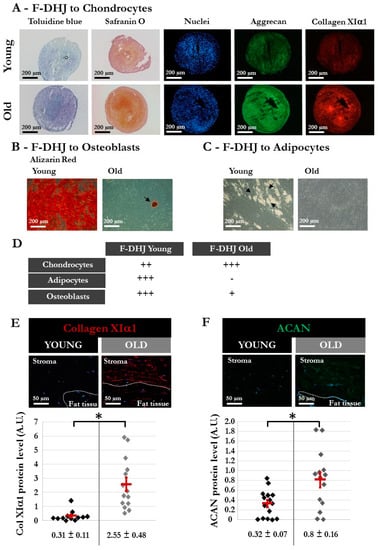
Figure 8.
Different characteristics of DHJ components in skin from “young” and “old” donors. The “young” group comprised 5 donors (20, 22, 25, 28, and 31 years old) (same donors as in Figure 3), and the “old” group comprised 4 donors (55, 61, 65, and 65 years old). (A–C) Capacity of “young” and “old” F-DHJ cells to differentiate in vitro into three mesenchymal lineages: (A) chondrocytes (toluidine blue and safranin O staining, aggrecan (ACAN) and collagen XIα1 (ColXIα1) expression); (B) adipocytes (presence of cytoplasmic lipid droplets, black arrows); and (C) osteoblasts (alizarin-red staining). For panels (A–C), representative photographs are shown. (D) Summary of the differentiation capacity into chondrocytes, adipocytes, and osteoblasts of F-DHJ from “young” and “old” skin. Scoring of differentiation capabilities are presented: (−) = not present, (+) = low representation, (++) = frequent representation, and (+++) = major representation. (E,F) Immunofluorescence detection of ColXIα1 (E) and ACAN (F) in skin biopsies from “young” and “old” donors. Representative photographs are shown, in association with quantification values corresponding to a total of 12 (E) and 15 (F) regions of interest (ROI) for the 3 analyzed “young” donors (20, 22, and 28 years old) and a total of 14 (E) and 15 (F) ROI for the 3 analyzed “old” donors (57, 61, and 65 years old). Means ± SEM are indicated (* p < 0.05, Wilcoxon test).
4. Discussion
The present work investigates the properties of a fibroblast compartment localized within the conjunctival junctions that connects the dermis to the hypodermis, i.e., dermo-hypodermal junction fibroblasts (F-DHJ), which were compared to intermediate reticular dermis (Fr) and superficial papillary dermis (Fp) fibroblasts. Cellular functional assays, combined with transcriptome profiling, indicated that F-DHJ had distinct characteristics from those of Fp and Fr cells. F-DHJ had the lowest proliferation and clonogenic capacity of the three fibroblast populations in bidimensional culture conditions. Moreover, when integrated within the dermal component of an in vitro three-dimensional reconstructed skin model, F-DHJ showed a low capacity for collagen lattice contractions and had a poor capacity for promoting epidermis organogenesis by keratinocytes. Inefficient dialog with keratinocytes observed here in vitro is in agreement with F-DHJ natural deep localizations, which are not in proximity with the epidermis, unlike the superficial Fp population. The lattice contraction assay provided the opportunity to assess the contractile capacity of specific cell types in a three-dimensional matrix environment. The contraction of the lattice is proportional to the force exerted by the cells in the matrix. Parameters that impact lattice contractions include characteristics of cell matrix anchoring structures, cytoskeleton organization, and the capacity of cells to coordinate and exert unidirectional forces. These parameters are governed by components of the “tissue skeleton” network [8,9] and may participate in vivo to confer specific biophysical characteristics to the different dermal tissue compartments. Extrapolation of the in vitro observations to the specific in vivo functions of Fp, Fr, and F-DHJ will require further studies, considering the high matrix complexity of the dermis.
We observed that F-DHJ exhibited an efficient capacity for three-lineage mesenchymal differentiation (i.e., adipocyte, osteoblast, and chondrocyte lineages), which could be interpreted as an MSC-like cellular identity, considering their anatomical proximity with the hypodermis, a tissue that contains adipose MSCs. Interestingly, the hierarchical clustering built on the basis of the transcriptome profiles of the three skin fibroblast populations (Fp, Fr, and F-DHJ) and five MSC origins (bone marrow, adipose, amnion, chorion, and cord) indicated a clear “fibroblast” molecular identity of F-DHJ, which did not segregate together with the MSC group.
The molecular signature that identified F-DHJ cells comprised transcripts involved in the stabilization of monomeric proteoglycan aggregates associated with hyaluronic acid molecules, such as HAPLN1 and HAPLN3 [27], which were found overexpressed in F‑DHJ in comparison with all MSC types. Transcripts overexpressed in F-DHJ also included ACAN, which is involved in conferring tissue biomechanical resistance [28]. In addition, the overexpressed F-DHJ signature also comprised transcripts related to the collagen meshwork, such as FMOD and TNX, which are involved in collagen processing [29]; transcripts related to collagen fibril anchorage points, such as POSTN and FNDC1 [26]; and transcripts related to the elastic network, such as ELN; DCN; MFAP4 and 5; FBN2; and FBLN1, 2, and 5 [30]. On the contrary, the comparison of F-DHJ and Fr molecular profiles identified a signature of transcripts underexpressed in the F-DHJ population, which could be interpreted in accordance with the reduced ECM mesh structuration within the DHJ area, in comparison with the reticular dermis. Notably, this character was documented by lower levels of the TNC transcript in F-DHJ than in Fr cells, which is associated with a lower accumulation of the TNC protein and loss of the TNC network in the DHJ area. Thus, the molecular specificities that distinguish F-DHJ and Fr cells may contribute to the different ECM characteristics of the reticular dermis and DHJ areas.
The existence of a fibroblast population exhibiting adipocyte-like molecular characteristics within the deep reticular dermis has been reported both in mouse [31,32] and human skin [33,34]. In human skin, the capacity for adipocyte differentiation was reported to be low for FAP+/CD90- papillary fibroblasts, intermediate for FAP+/CD90+ fibroblasts from the superior reticular dermis, and high for FAP-/CD90+ deep reticular dermis fibroblasts [33]. This gradation is consistent with the data shown in the present study, showing a correlation between the capacity for adipocyte differentiation and the depth of fibroblast dermal localization. The study by Korosec et al., which used cells from skin donors of ages ranging between 26 and 61 years, did not report an age-related reduction of the adipocyte differentiation capacity [33], as documented here for F-DHJ cells, although this phenomenon has been previously described for dermal fibroblast cells [35]. In the present study, “F-DHJ” is used to name the fibroblast population that we isolated according to its junctional localization between the deep reticular dermis and the hypodermis. This terminology distinguishes the deepest dermal part from the reticular dermis compartment, which is in agreement with their particular molecular and functional characteristics that may be critical for modeling their local ECM environment.
Interestingly, data were obtained pointing to age-related changes in the DHJ region characteristics, such as augmented levels of the ECM proteins ColXIα1 and ACAN and a reduced adipocyte differentiation potential of F-DHJ in old skin. Data from the literature concerning the evolution of the dermal fibroblast capacity for differentiation into adipocytes can appear contradictory, with regard to our observation of a decreased adipogenic potential. Indeed, a study performed on mice has, on the contrary, reported the acquisition of proadipogenic traits in dermal fibroblasts from aged animals [32], in which the difference may result from physiological species-related specificities. In a recent study, a single-cell RNA-sequencing analysis of 15,000 dermal fibroblasts isolated from human skin samples from young and old donors did not detect an up-modulation of adipogenic genes associated with ageing [36]. Of note, in humans, subcutaneous fat tissue masses tend to reduce with ageing, in particular in the face (for review, see [37]).
As we performed here using collagen lattices as a dermal matrix model, human fibroblasts isolated from the deep dermis were used to populate acellular dead desepidermized dermis (DED) pieces and analyzed for their capacity to support epidermis reconstruction by keratinocytes [34]. The two studies converged to show that fibroblasts from the deep dermis do not promote the formation of a correctly differentiated multilayered epithelium, which is consistent with their distant skin localization. Interestingly, deep dermis fibroblasts spontaneously populated the deepest part of the DED [34], in which homing may be due to the recognition of specific ECM characteristics.
Fibroblast-ECM interrelations are crucial for the maintenance of dermal integrity. In a mouse model, dermal fibroblasts were studied by intravital time-lapse, which revealed active membrane dynamics characterized by protrusions that rapidly grow and shrink from a more stable cell body [38]. By this process, fibroblasts may dialog with their cellular and ECM neighbors, and thus, adapt their behaviors and fate. Accordingly, the development of membrane extensions in living cells has been proposed to compensate for the appearance of cell-free volumes due to fibroblast deaths in the dermis of aged skin [38]. These observations may be explored at a molecular level considering genes related to the network termed as “tissue skeleton” that connects the cells with their tissue environment (comprising the nucleoskeleton, the cytoskeleton, linker complexes, ECM components, and focal adhesion points), in which their expressions differ in fibroblasts according to their dermal localization and evolve with ageing (present study and [8,9]. Disruption of this multiparametric network of interactions may result in changes that affect aged dermis, including the loss of contact surfaces between fibroblasts and their surrounding ECM [39] and modification of the deposition of ECM components, such as ColXIα1 and ACAN, as shown here.
5. Patent
V.H. and D.A. are the inventors on the filed patent application numbered 1759023 (28th September 2017) entitled “Molecular signatures of aging of 3 subpopulations of dermal fibroblasts (papillary, reticular, dermo-hypodermic junction) and dermal equivalents comprising aged fibroblasts”.
V.H is the inventor on the filed patent application numbered 1855987 (June 29th 2018) entitled “Modèle de peau comprenant des fibroblastes de la jonction dermo-hypodermique pour l’identification d’actif pro-différenciant vers des lignages adipocytaire, chondroblastique et ostéoblastique”.
Author Contributions
V.H.: conceptualization, investigation, methodology, resources, formal analysis, validation, visualization, and writing—original draft preparation; V.N. and P.P.: investigation and methodology; É.B.: investigation, methodology, and resources; J.-J.L.: conceptualization, methodology, resources, validation, and writing—review and editing; D.A.: conceptualization, validation, and writing—review and editing; N.O.F.: conceptualization, methodology, formal analysis, visualization, validation, and writing—review and editing. All authors have read and agreed to the published version of the manuscript.
Funding
This experimental work was financed by L’Oréal.
Conflicts of Interest
Authors declare no conflicts of interest. V.H., V.N., P.P. and D.A. are L’Oréal employees. N.O.F. is a CEA employee and acts as the L’Oréal scientific consultant, free of charge. J.-J.L. and E.B. are external scientific collaborators from DGA.
References
- Smith, L.T.; Holbrook, K.A. Development of dermal connective tissue in human embryonic and fetal skin. Scan Electron Microsc. 1982, 4, 1745–1751. [Google Scholar]
- Smith, L.T.; Holbrook, K.A.; Byers, P.H. Structure of the dermal matrix during development and in the adult. J. Investig. Dermatol. 1982, 79 (Suppl. 1), 93s–104s. [Google Scholar] [CrossRef]
- Haydont, V.; Bernard, B.A.; Fortunel, N.O. Age-related evolutions of the dermis: Clinical signs, fibroblast and extracellular matrix dynamics. Mech. Ageing Dev. 2019, 177, 150–156. [Google Scholar] [CrossRef] [PubMed]
- Harper, R.A.; Grove, G. Human skin fibroblasts derived from papillary and reticular dermis: Differences in growth potential in vitro. Science 1979, 204, 526–527. [Google Scholar] [CrossRef] [PubMed]
- Mine, S.; Fortunel, N.O.; Pageon, H.; Asselineau, D. Aging alters functionally human dermal papillary fibroblasts but not reticular fibroblasts: A new view of skin morphogenesis and aging. PLoS ONE 2008, 3, e4066. [Google Scholar] [CrossRef] [PubMed]
- Janson, D.G.; Saintigny, G.; van Adrichem, A.; Mahé, C.; El Ghalbzouri, A. Different gene expression patterns in human papillary and reticular fibroblasts. J. Investig. Dermatol. 2012, 132, 2565–2572. [Google Scholar] [CrossRef] [PubMed]
- Nauroy, P.; Barruche, V.; Marchand, L.; Nindorera-Badara, S.; Bordes, S.; Closs, B.; Ruggiero, F. Human Dermal Fibroblast Subpopulations Display Distinct Gene Signatures Related to Cell Behaviors and Matrisome. J. Investig. Dermatol. 2017, 137, 1787–1789. [Google Scholar] [CrossRef]
- Haydont, V.; Neiveyans, V.; Zucchi, H.; Fortunel, N.O.; Asselineau, D. Genome-wide profiling of adult human papillary and reticular fibroblasts identifies ACAN, Col XI α1, and PSG1 as general biomarkers of dermis ageing, and KANK4 as an exemplary effector of papillary fibroblast ageing, related to contractility. Mech. Ageing Dev. 2019, 177, 157–181. [Google Scholar] [CrossRef]
- Haydont, V.; Neiveyans, V.; Fortunel, N.O.; Asselineau, D. Transcriptome profiling of human papillary and reticular fibroblasts from adult interfollicular dermis pinpoints the ‘tissue skeleton’ gene network as a component of skin chrono-ageing. Mech. Ageing Dev. 2019, 179, 60–77. [Google Scholar] [CrossRef]
- Breathnach, A.S. Development and differentiation of dermal cells in man. J. Investig. Dermatol. 1978, 71, 2–8. [Google Scholar] [CrossRef]
- Mills, S.J.; Cowin, A.J.; Kaur, P. Pericytes, mesenchymal stem cells and the wound healing process. Cells 2013, 2, 621–634. [Google Scholar] [CrossRef] [PubMed]
- Zhuang, L.; Lawlor, K.T.; Schlueter, H.; Pieterse, Z.; Yu, Y.; Kaur, P. Pericytes promote skin regeneration by inducing epidermal cell polarity and planar cell divisions. Life Sci. Alliance 2018, 1, e201700009. [Google Scholar] [CrossRef] [PubMed]
- Rusu, M.C.; Mirancea, N.; Mănoiu, V.S.; Vâlcu, M.; Nicolescu, M.I.; Păduraru, D. Skin telocytes. Ann. Anat. 2012, 194, 359–367. [Google Scholar] [CrossRef] [PubMed]
- Ceafalan, L.; Gherghiceanu, M.; Popescu, L.M.; Simionescu, O. Telocytes in human skin--are they involved in skin regeneration? J. Cell Mol. Med. 2012, 16, 1405–1420. [Google Scholar] [CrossRef]
- Manole, C.G.; Gherghiceanu, M.; Simionescu, O. Telocyte dynamics in psoriasis. J. Cell Mol. Med. 2015, 19, 1504–1519. [Google Scholar] [CrossRef]
- Shoshkes-Carmel, M.; Wang, Y.J.; Wangensteen, K.J.; Tóth, B.; Kondo, A.; Massasa, E.E.; Itzkovitz, S.; Kaestner, K.H. Subepithelial telocytes are an important source of Wnts that supports intestinal crypts. Nature 2018, 557, 242–246. [Google Scholar] [CrossRef]
- Gherghiceanu, M.; Popescu, L.M. Cardiac telocytes—Their junctions and functional implications. Cell Tissue Res. 2012, 348, 265–279. [Google Scholar] [CrossRef]
- Fertig, E.T.; Gherghiceanu, M.; Popescu, L.M. Extracellular vesicles release by cardiac telocytes: Electron microscopy and electron tomography. J. Cell Mol. Med. 2014, 18, 1938–1943. [Google Scholar] [CrossRef]
- Manole, C.G.; Simionescu, O. The Cutaneous Telocytes. Adv. Exp. Med. Biol. 2016, 913, 303–323. [Google Scholar]
- Peltzer, J.; Montespan, F.; Thepenier, C.; Boutin, L.; Uzan, G.; Rouas-Freiss, N.; Lataillade, J.J. Heterogeneous functions of perinatal mesenchymal stromal cells require a preselection before their banking for clinical use. Stem Cells Dev. 2015, 24, 329–344. [Google Scholar] [CrossRef]
- Asselineau, D.; Bernhard, B.; Bailly, C.; Darmon, M. Epidermal morphogenesis and induction of the 67 kD keratin polypeptide by culture of human keratinocytes at the liquid-air interface. Exp. Cell Res. 1985, 159, 536–539. [Google Scholar] [CrossRef]
- Rheinwald, J.G.; Green, H. Serial cultivation of strains of human epidermal keratinocytes: The formation of keratinizing colonies from single cells. Cell 1975, 6, 331–343. [Google Scholar] [CrossRef]
- Beacham, D.A.; Amatangelo, M.D.; Cukierman, E. Preparation of extracellular matrices produced by cultured and primary fibroblasts. Curr. Protoc. Cell Biol. 2007, 33. [Google Scholar] [CrossRef] [PubMed]
- Gabbiani, G. Modulation of fibroblastic cytoskeletal features during wound healing and fibrosis. Pathol. Res. Pract. 1994, 190, 851–853. [Google Scholar] [CrossRef]
- Pei, H.; Yao, Y.; Yang, Y.; Liao, K.; Wu, J.R. Krüppel-like factor KLF9 regulates PPARγ transactivation at the middle stage of adipogenesis. Cell Death Differ. 2011, 18, 315–327. [Google Scholar] [CrossRef] [PubMed]
- Kudo, A. Periostin in fibrillogenesis for tissue regeneration: Periostin actions inside and outside the cell. Cell Mol. Life Sci. 2011, 68, 3201–3207. [Google Scholar] [CrossRef]
- Spicer, A.P.; Joo, A.; Bowling, R.A., Jr. A hyaluronan binding link protein gene family whose members are physically linked adjacent to chondroitin sulfate proteoglycan core protein genes: The missing links. J. Biol. Chem. 2003, 278, 21083–21091. [Google Scholar] [CrossRef]
- Kiani, C.; Chen, L.; Wu, Y.J.; Yee, A.J.; Yang, B.B. Structure and function of aggrecan. Cell Res. 2002, 12, 19–32. [Google Scholar] [CrossRef]
- Kadler, K.E.; Hill, A.; Canty-Laird, E.G. Collagen fibrillogenesis: Fibronectin, integrins, and minor collagens as organizers and nucleators. Curr. Opin. Cell Biol. 2008, 20, 495–501. [Google Scholar] [CrossRef]
- Kielty, C.M.; Sherratt, M.J.; Shuttleworth, C.A. Elastic fibres. J. Cell Sci. 2002, 115, 2817–2828. [Google Scholar]
- Driskell, R.R.; Lichtenberger, B.M.; Hoste, E.; Kretzschmar, K.; Simons, B.D.; Charalambous, M.; Ferron, S.R.; Herault, Y.; Pavlovic, G.; Ferguson-Smith, A.C.; et al. Distinct fibroblast lineages determine dermal architecture in skin development and repair. Nature 2013, 504, 277–281. [Google Scholar] [CrossRef] [PubMed]
- Salzer, M.C.; Lafzi, A.; Berenguer-Llergo, A.; Youssif, C.; Castellanos, A.; Solanas, G.; Peixoto, F.O.; Stephan-Otto Attolini, C.; Prats, N.; Aguilera, M.; et al. Identity Noise and Adipogenic Traits Characterize Dermal Fibroblast Aging. Cell 2018, 175, 1575–1590. [Google Scholar] [CrossRef] [PubMed]
- Korosec, A.; Frech, S.; Gesslbauer, B.; Vierhapper, M.; Radtke, C.; Petzelbauer, P.; Lichtenberger, B.M. Lineage Identity and Location within the Dermis Determine the Function of Papillary and Reticular Fibroblasts in Human Skin. J. Investig. Dermatol. 2019, 139, 342–351. [Google Scholar] [CrossRef] [PubMed]
- Philippeos, C.; Telerman, S.B.; Oulès, B.; Pisco, A.O.; Shaw, T.J.; Elgueta, R.; Lombardi, G.; Driskell, R.R.; Soldin, M.; Lynch, M.D.; et al. Spatial and Single-Cell Transcriptional Profiling Identifies Functionally Distinct Human Dermal Fibroblast Subpopulations. J. Investig. Dermatol. 2018, 138, 811–825. [Google Scholar] [CrossRef] [PubMed]
- Brun, C.; Ly Ka So, S.; Maginiot, F.; Bensussan, A.; Michel, L.; Larghero, J.; Wong, H.; Oddos, T.; Cras, A. Intrinsically aged dermal fibroblasts fail to differentiate into adipogenic lineage. Exp. Dermatol. 2016, 25, 906–909. [Google Scholar] [CrossRef] [PubMed]
- Solé-Boldo, L.; Raddatz, G.; Schütz, S.; Mallm, J.P.; Rippe, K.; Lonsdorf, A.S.; Rodríguez-Paredes, M.; Lyko, F. Single-cell transcriptomes of the aging human skin reveal loss of fibroblast priming. BioRxiv. 2019, 633131. [Google Scholar] [CrossRef]
- Wollina, U.; Wetzker, R.; Abdel-Naser, M.B.; Kruglikov, I.L. Role of adipose tissue in facial aging. Clin. Interv. Aging 2017, 12, 2069–2076. [Google Scholar] [CrossRef]
- Marsh, E.; Gonzalez, D.G.; Lathrop, E.A.; Boucher, J.; Greco, V. Positional Stability and Membrane Occupancy Define Skin Fibroblast Homeostasis In Vivo. Cell 2018, 175, 1620–1633.e13. [Google Scholar] [CrossRef]
- Varani, J.; Dame, M.K.; Rittie, L.; Fligiel, S.E.; Kang, S.; Fisher, G.J.; Voorhees, J.J. Decreased collagen production in chronologically aged skin: Roles of age-dependent alteration in fibroblast function and defective mechanical stimulation. Am. J. Pathol. 2006, 168, 1861–1888. [Google Scholar] [CrossRef]
© 2020 by the authors. Licensee MDPI, Basel, Switzerland. This article is an open access article distributed under the terms and conditions of the Creative Commons Attribution (CC BY) license (http://creativecommons.org/licenses/by/4.0/).