Article

Perilipin 5 Protects against Cellular Oxidative Stress by Enhancing Mitochondrial Function in HepG2 Cells

1
Key Laboratory of Agriculture Animal Genetics, Breeding and Reproduction of the Ministry of Education, College of Animal Science, Huazhong Agricultural University, Wuhan 430070, Hubei, China
2
The Cooperative Innovation Center for Sustainable Pig Production, Huazhong Agricultural University, Wuhan 430070, Hubei, China
*
Author to whom correspondence should be addressed.
These two authors contributed equally to this work.
Cells 2019, 8(10), 1241; https://doi.org/10.3390/cells8101241
Submission received: 12 July 2019 / Revised: 29 September 2019 / Accepted: 8 October 2019 / Published: 11 October 2019
(This article belongs to the Section Intracellular and Plasma Membranes)

Abstract

:
Non-alcoholic fatty liver disease (NAFLD) is one of the most common liver diseases worldwide. Reactive oxygen species (ROS), as potent oxidants in cells, have been shown to promote the development of NAFLD. Previous studies reported that for ROS-induced cellular oxidative stress, promoting lipid droplet (LD) accumulation is associated with the cellular antioxidation process. However, the regulatory role of LDs in relieving cellular oxidative stress is poorly understood. Here, we showed that Perilipin 5 (PLIN5), a key LD protein related to mitochondria–LD contact, reduced ROS levels and improved mitochondrial function in HepG2 cells. Both mRNA and protein levels of PLIN5 were significantly increased in cells with hydrogen peroxide or lipopolysaccharide (LPS) treatment (p < 0.05). Additionally, the overexpression of PLIN5 promoted LD formation and mitochondria–LD contact, reduced cellular ROS levels and up-regulated mitochondrial function-related genes such as COX and CS. Knockdown PLIN5, meanwhile, showed opposite effects. Furthermore, we identified that cellular oxidative stress up-regulated PLIN5 expression via the JNK-p38-ATF pathway. This study shows that the up-regulation of PLIN5 is a kind of survival strategy for cells in response to stress. PLIN5 can be a potential therapeutic target in NAFLD.

1. Introduction

There are a large number of patients suffering from non-alcoholic fatty liver disease (NAFLD) all over the world. This disease increases the risk of non-alcoholic hepatitis (NASH), chronic interstitial hepatitis, hepatic failure, and even hepatocellular carcinoma [1,2,3]. One of the characterizations of NAFLD is increased levels of reactive oxygen species (ROS) [4]. Some studies have shown that high levels of ROS promote the development of NAFLD/NASH and hepatocellular carcinoma by inducing ER stress [5] or regulating the AMPK signaling pathway [6]. There are several antioxidant enzymes such as superoxide dismutase (SOD), catalase (CAT), and glutathione peroxidase (GPX) responsible for scavenging cellular ROS. Meanwhile, the expression levels of SOD and other antioxidant enzymes are decreased in NAFLD/NASH [4]. Interestingly, lipid droplets (LDs) have been shown to be involved in the cellular stress response process. Bailey et al. demonstrated that lipid droplets can act as antioxidant organelles that protect Drosophila neural stem cells from hypoxia-triggered ROS [7], by allowing neuronal stem cells to keep proliferating under hypoxic conditions, and protection likely involves sequestering vulnerable membrane lipids away from ROS [8]. Furthermore, LDs also respond to starvation-induced stress by increasing their contact with mitochondria and lysosomes, which could consist in the role of these contacts in transferring fatty acids from LDs to mitochondria or lysosomes for energy supply [9]. Moreover, the formation of nuclear LDs is related to the stress induced by phospholipid shortages [10,11]. Our previous study has shown that hydrogen peroxide promoted the formation of cellular LDs [12]. However, whether the increased cellular LDs play a role as anti-oxidants is largely unknown.
Perilipin 5 (PLIN5) is one of the conserved LD proteins, which belongs to the PAT (perilipin, adipophilin, and TIP47) protein family [13]. Oxidative tissues such as skeletal muscle, liver, and brown fat have high expression levels of PLIN5, indicating that PLIN5 plays an important role in lipid storage and LD function [14,15,16]. Previous studies identified that PLIN5 regulated triglyceride contents in hepatocytes [17] and skeletal muscle [18]. Overexpression of PLIN5 in skeletal muscle promotes oxidative gene expression and lipid content [19]. Recently, PLIN5 was reported to be the key factor that regulated LD contacting mitochondria [20,21]. The N-terminal (1-188aa) of PLIN5 is the conserved PAT domain, and 189-391aa is the domain contacting with patatin like phospholipase domain containing 2 (PNPLA2, ATGL). The C-terminal of PLIN5 (443-463aa) is the key sequence related to mitochondrial recruiting [22]. LD–mitochondria contact is important for the energy supply during starvation stress, which promotes lipid β-oxidation [9,23], and the transfer process of fatty acids from LDs to mitochondria was also observed by probe imaging [24,25]. Recently, a study also found that LD–mitochondria contact contributed to lipid synthesis and LD expansion [22]. Furthermore, LDs are able to protect against cellular apoptosis by clearing harmful proteins from outer mitochondrial membranes [26]. Moreover, PLIN5 has been shown to limit fatty acid toxicity [27]. These studies suggested that PLIN5 was involved in the process of cellular anti-oxidation.
In the present study, we found that hydrogen peroxide- or lipopolysaccharide (LPS)-induced oxidative stress up-regulated both mRNA and protein levels of PLIN5. The overexpression of PLIN5 increased the cellular LD content, promoted LD–mitochondria contact, reduced cellular ROS level, and enhanced mitochondrial function-related gene expression, whereas knockdown PLIN5 indicated opposite phenotypes. Moreover, we identified that the promoter region of PLIN5 contained the binding sites of JUN, ATF1, ATF3, and ATF4, and therefore PLIN5 expression was activated by the JNK-p38-ATF pathway. By bioinformatic analysis, it has been found that PLIN5 has a high expression in liver hepatocellular carcinoma (LIHC), and additionally, low expression of PLIN5 is correlated with poor prognosis in LIHC. Therefore, PLIN5 can be a potential therapeutic target in NAFLD and NAFLD-induced LIHC.

2. Results

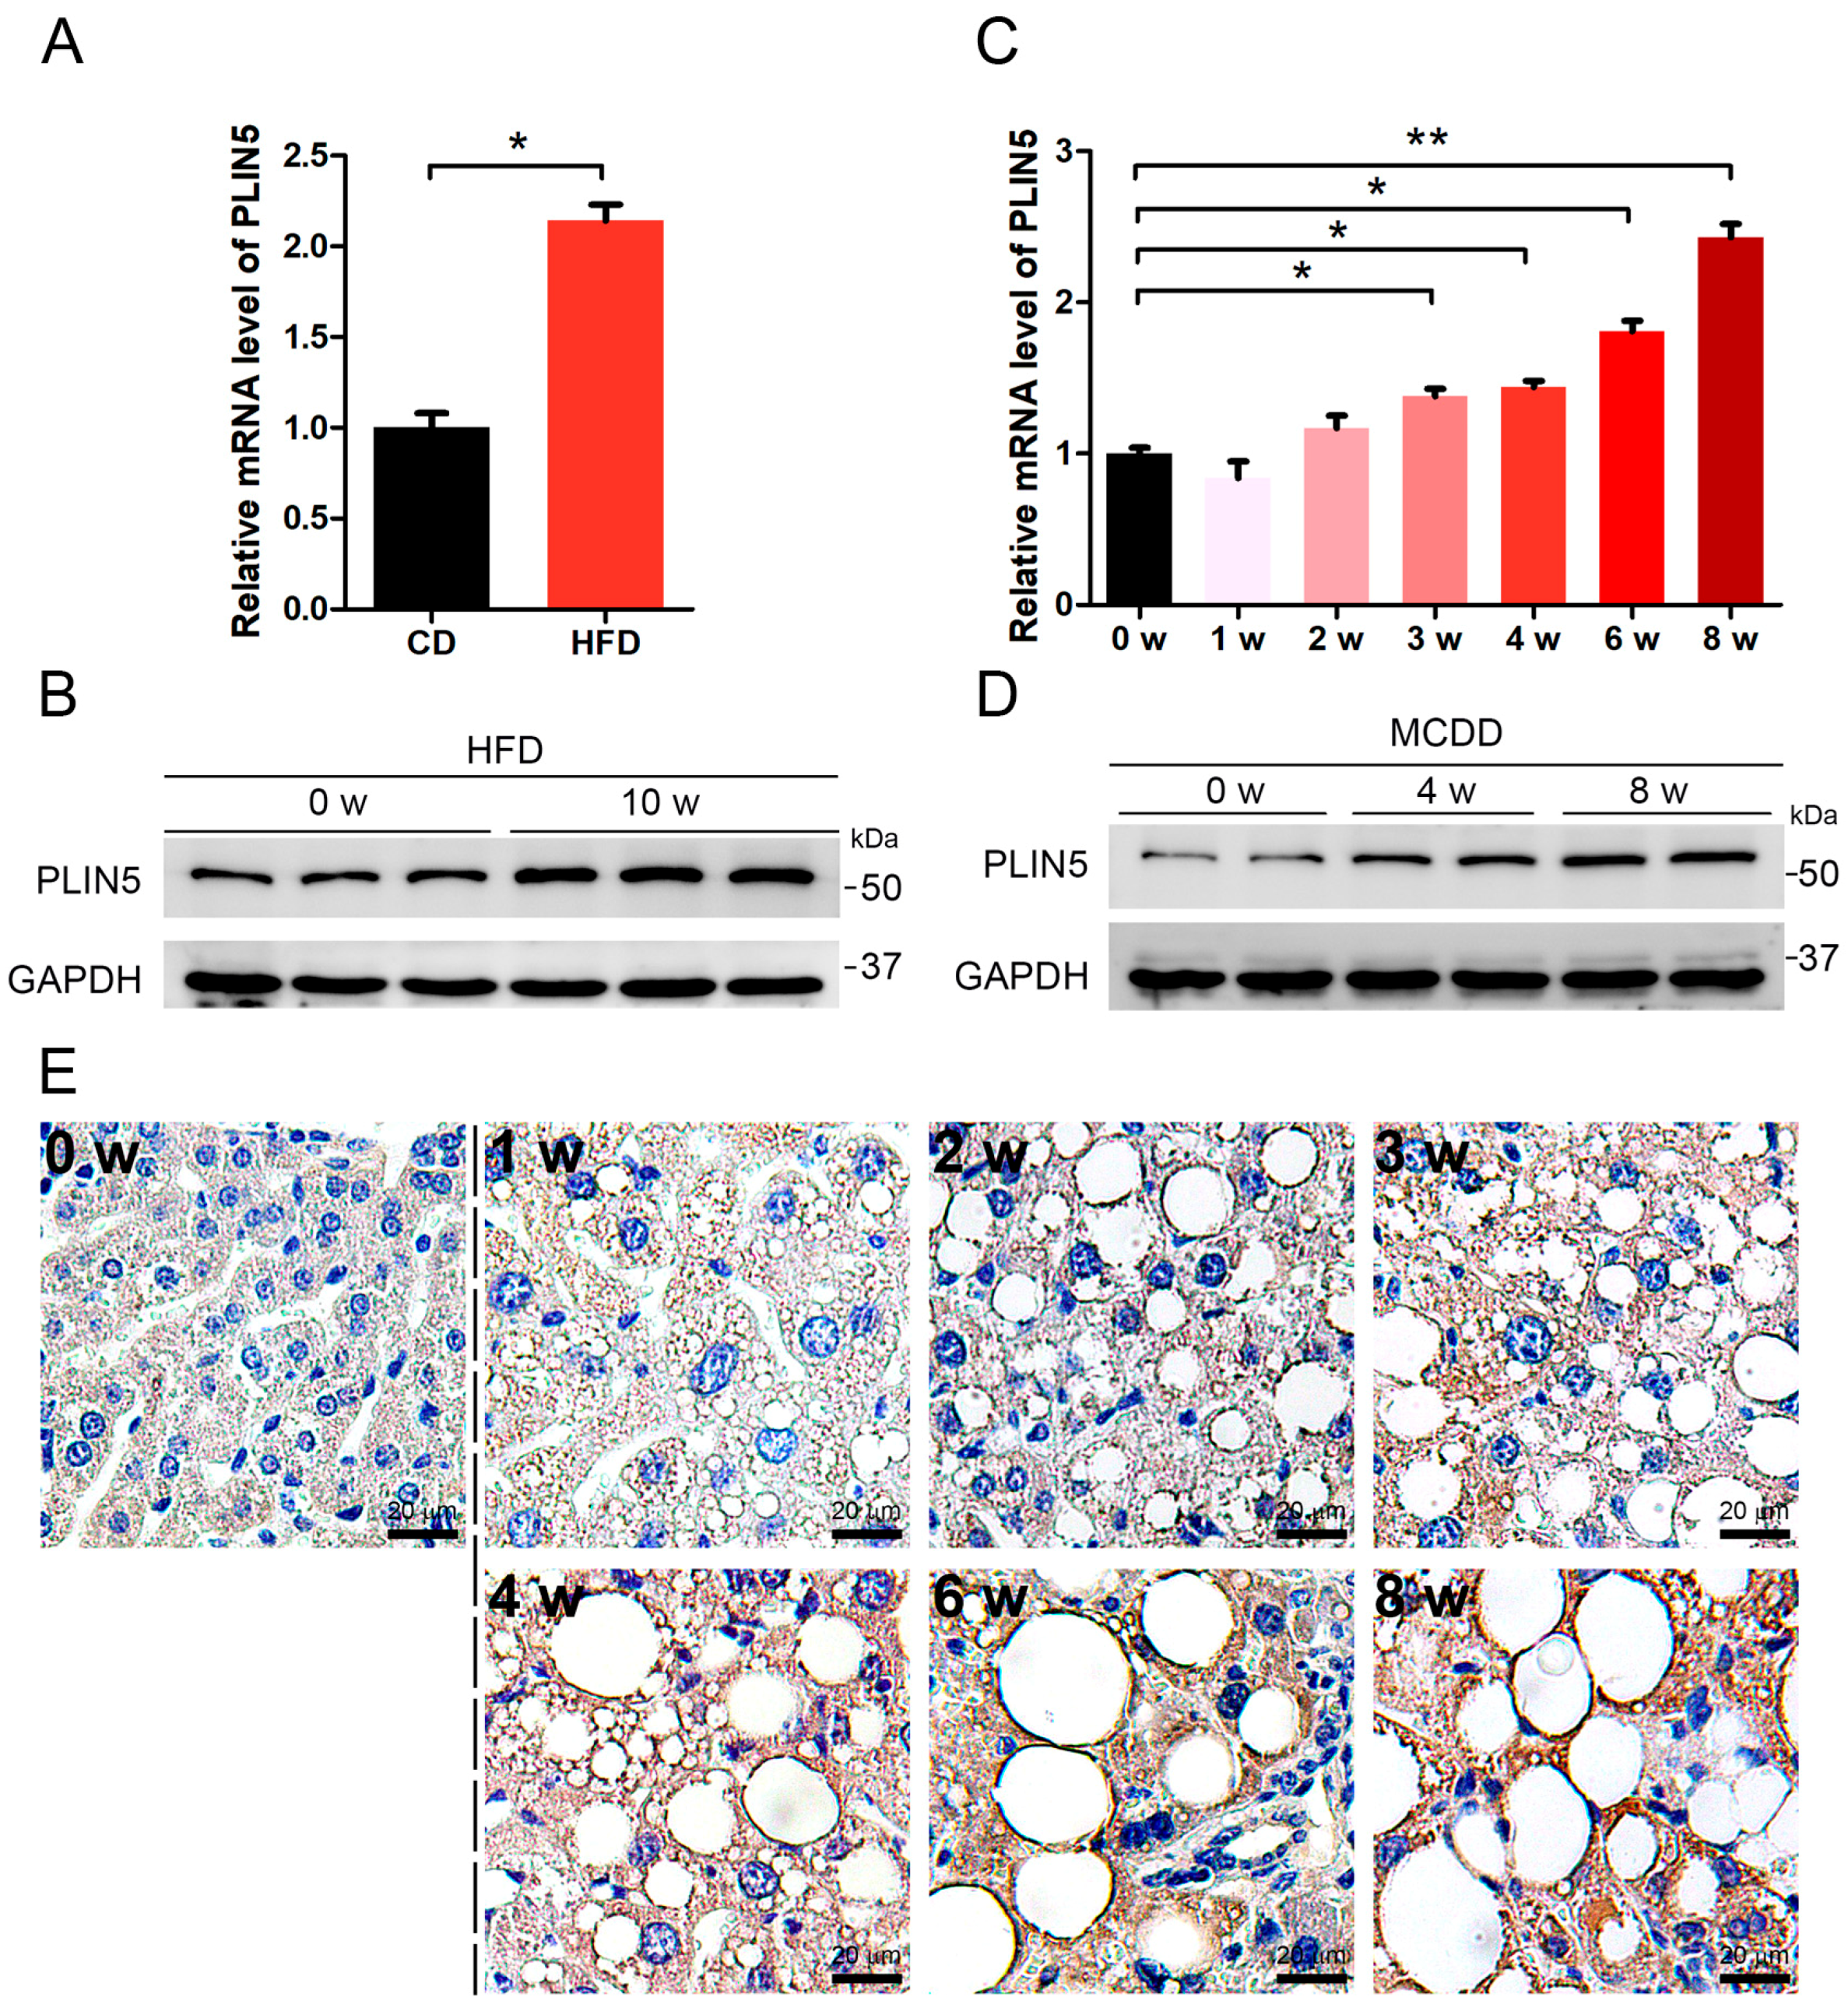
2.1. PLIN5 Was Up-Regulated in Liver Tissues of NAFLD Mice

NAFLD is characterized by the accumulation of LDs and a raised ROS level. We induced NAFLD in mice by two classical methods, which were the methionine-choline-deficient diet (MCDD) treatment and high-fat diet (HFD) treatment, respectively. The liver tissues of mice fed with MCDD for 0 week, 1 week, 2 weeks, 3 weeks, 4 weeks, 6 weeks, and 8 weeks, and mice fed with HFD for 0 week and 10 weeks were collected. Then, the changes in hepatic PLIN5 expression were investigated in these collected samples. The results showed that the mRNA level of PLIN5 was up-regulated significantly in hepatic tissues of mice fed with MCDD for 4 weeks, 6 weeks, and 8 weeks, and mice fed with HFD for 10 weeks, compared to the corresponding control samples (fed with chow diet, CD; p < 0.05; Figure 1A–D). To validate this phenotype and further investigate the localization of PLIN5, immunohistochemistry was performed. The hepatic tissues of mice fed with MCDD for 0 week, 1 week, 2 weeks, 3 weeks, 4 weeks, 6 weeks, and 8 weeks were detected. The results showed that PLIN5 protein was mainly localized surrounding the LDs, and additionally, in mice fed with MCDD, the expression of PLIN5 was activated (Figure 1E). These results indicate that the expression levels of PLIN5 were enhanced and PLIN5 was mainly recruited on the surface of LDs during NAFLD development.

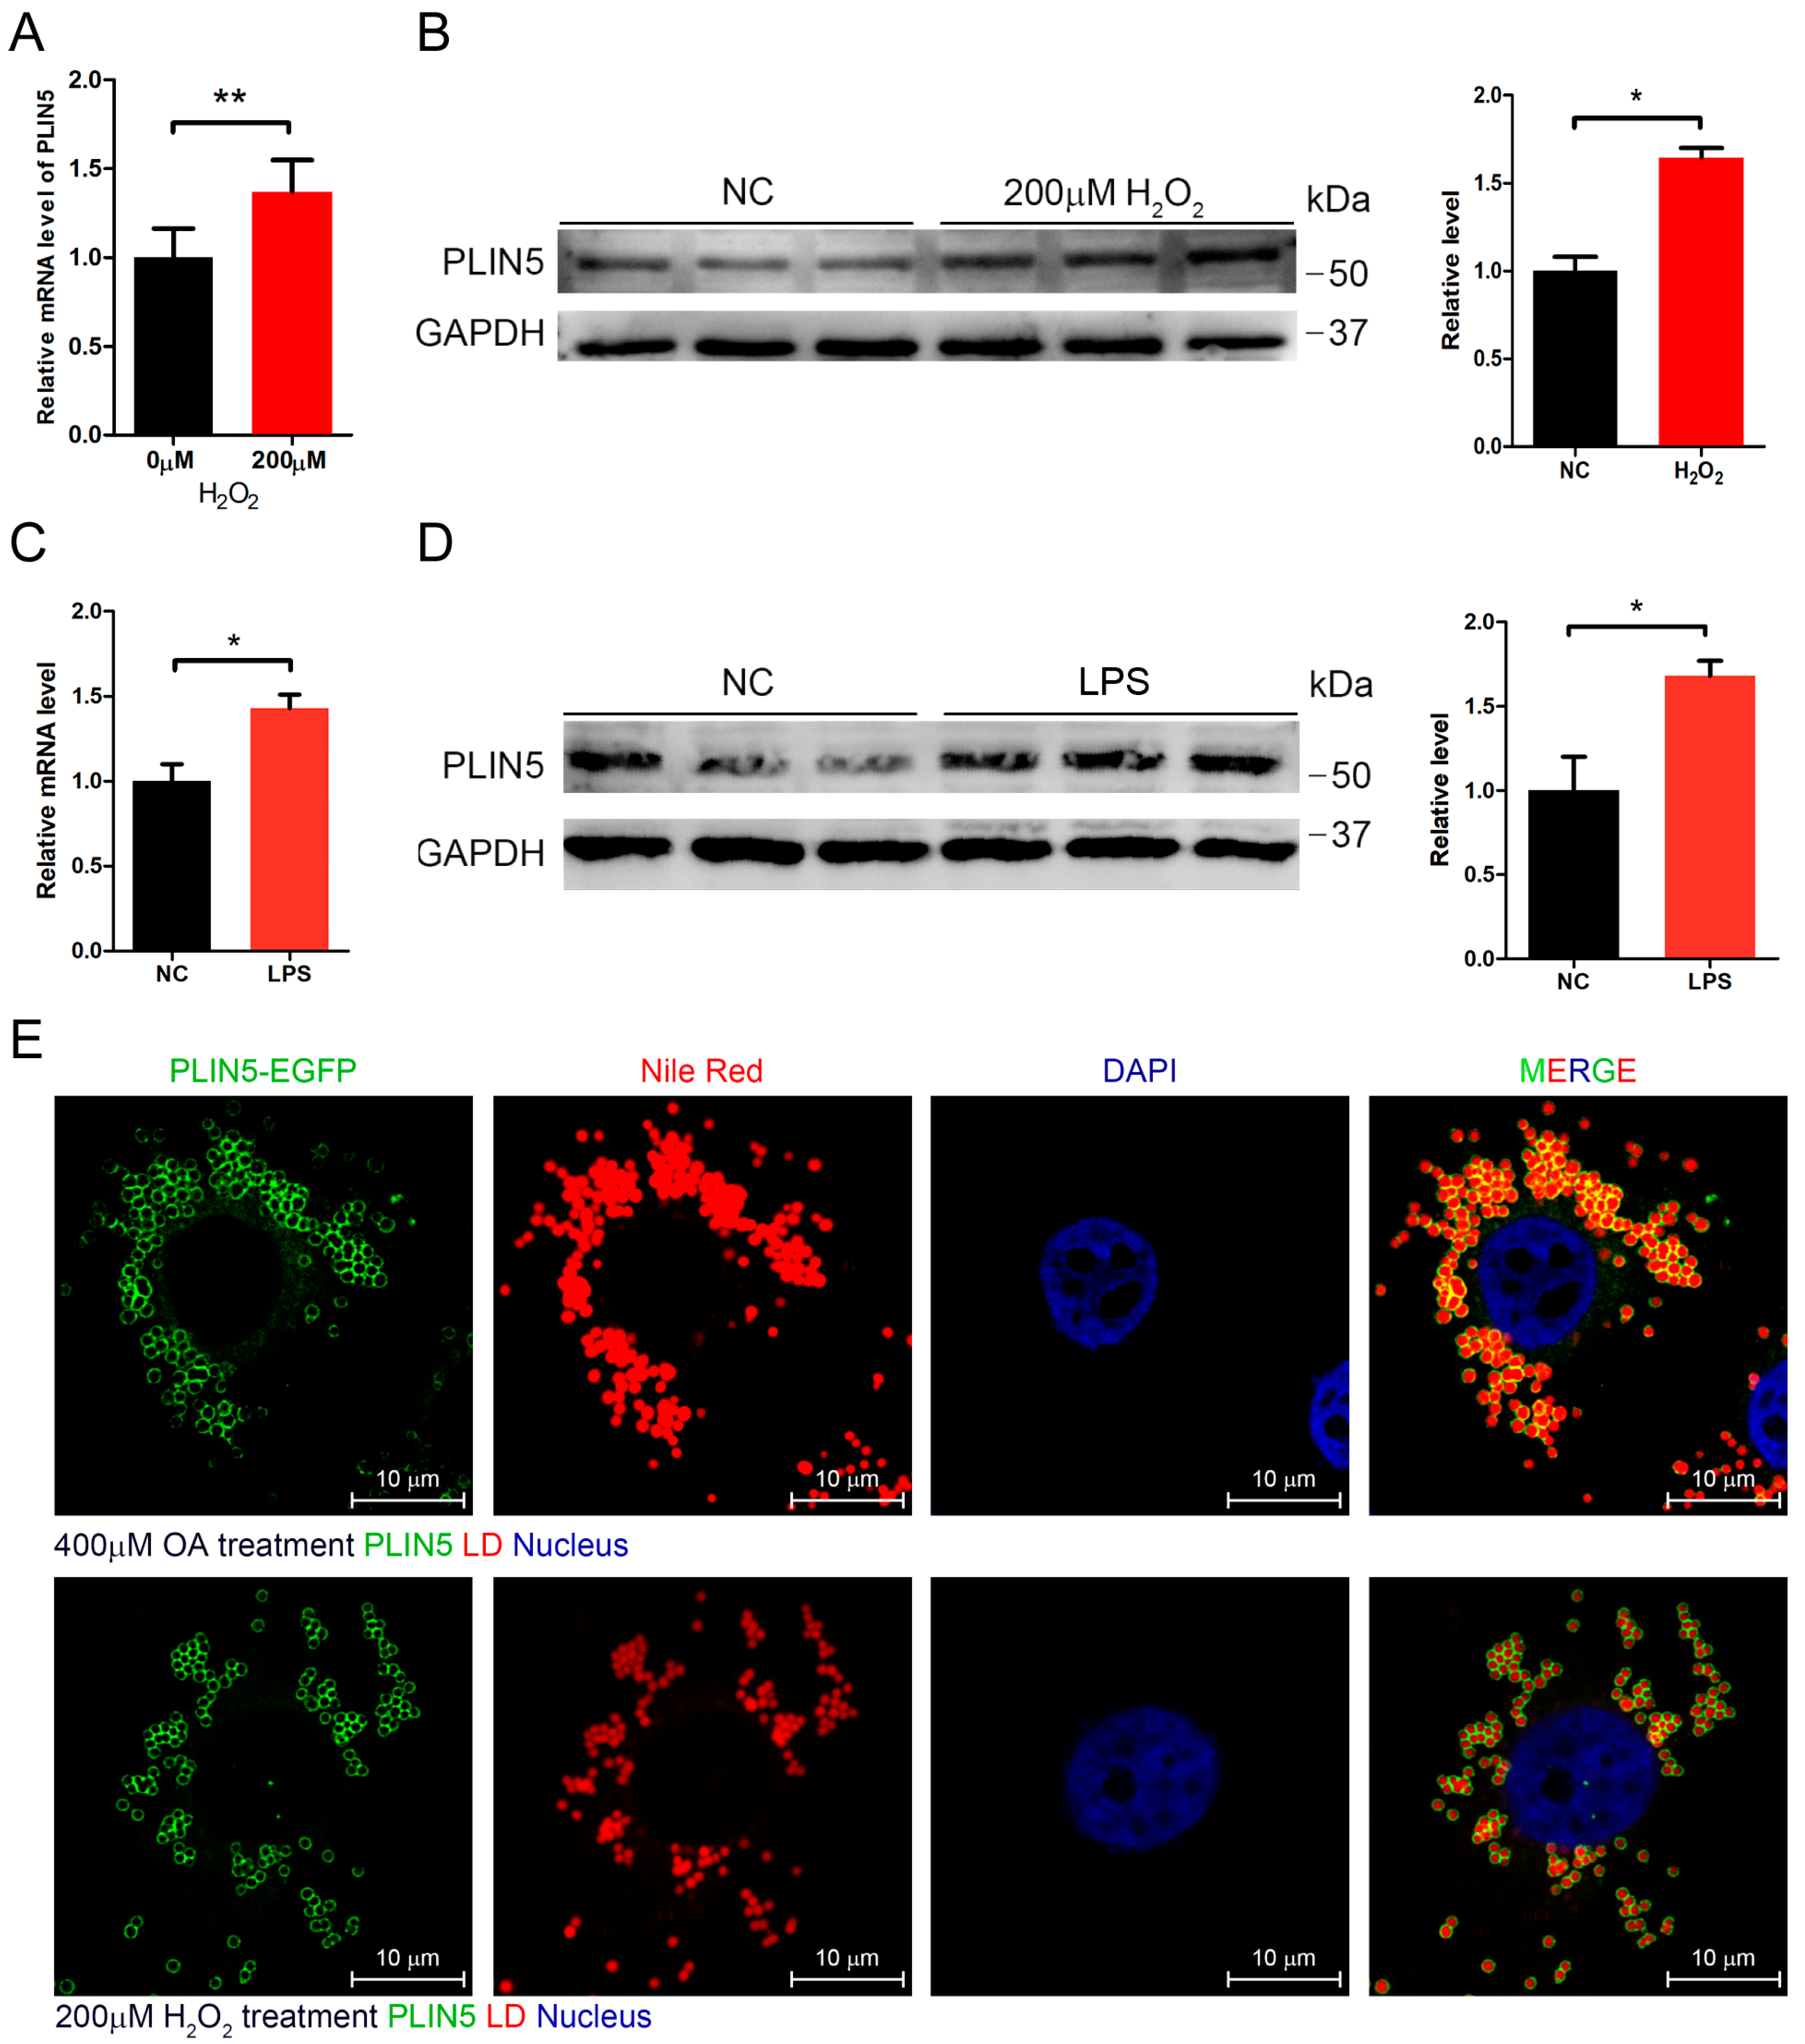
2.2. Hydrogen Peroxide or LPS Treatment Enhanced Expression of PLIN5

It was already well known that ROS levels were increased in hepatic tissues with NAFLD. Moreover, we did not observe any significant up-regulation of hepatic PLIN5 in mice fed with MCDD for 1 week, 2 weeks, and 3 weeks, although many hepatic LDs had accumulated. Therefore, we assumed that the raised ROS levels activated PLIN5 expression. ROS represents a variety of molecules and free radicals (chemical species with one unpaired electron) derived from molecular oxygen. Superoxide anion (O2•), the product of a one-electron reduction of oxygen, is the precursor of most ROS and a mediator in oxidative chain reactions [28], and then hydrogen peroxide arises from O2• [29,30]. Hydrogen peroxide and LPS are classical regents that induce cellular oxidation. Therefore, we investigated whether inducing cellular oxidative stress affected the expression level of PLIN5. The HepG2 cells were treated with 200 μM hydrogen peroxide for 12 h. qRT-PCR showed that PLIN5 mRNA was up-regulated significantly by hydrogen peroxide treatment (p < 0.05; Figure 2A), and, additionally, the Western Blot indicated that PLIN5 protein was also significantly up-regulated (p < 0.05; Figure 2B). Furthermore, we also investigated the changes in PLIN5 expression levels with the lipopolysaccharide (LPS) treatment. The results showed that both mRNA and protein levels of PLIN5 were up-regulated significantly (p < 0.05; Figure 2C,D). The oleic acid (OA) treatment can induce cells to form more and larger LDs, which is well applicable to observe the subcellular localization of PLIN5. Therefore, we subsequently detected the subcellular localization of PLIN5 in OA treated cells by the PLIN5-EGFP expression vector. The results indicated that PLIN5 was located on the surface of LDs (Figure 2E). To investigate whether hydrogen peroxide treatment changes the localization of PLIN5, we detected subcellular localization of PLIN5 in cells with the 200 μM hydrogen peroxide treatment. We found that hydrogen peroxide treatment did not change the localization of PLIN5 (Figure 2E). These results indicated that increased cellular ROS levels promoted the expression of PLIN5.

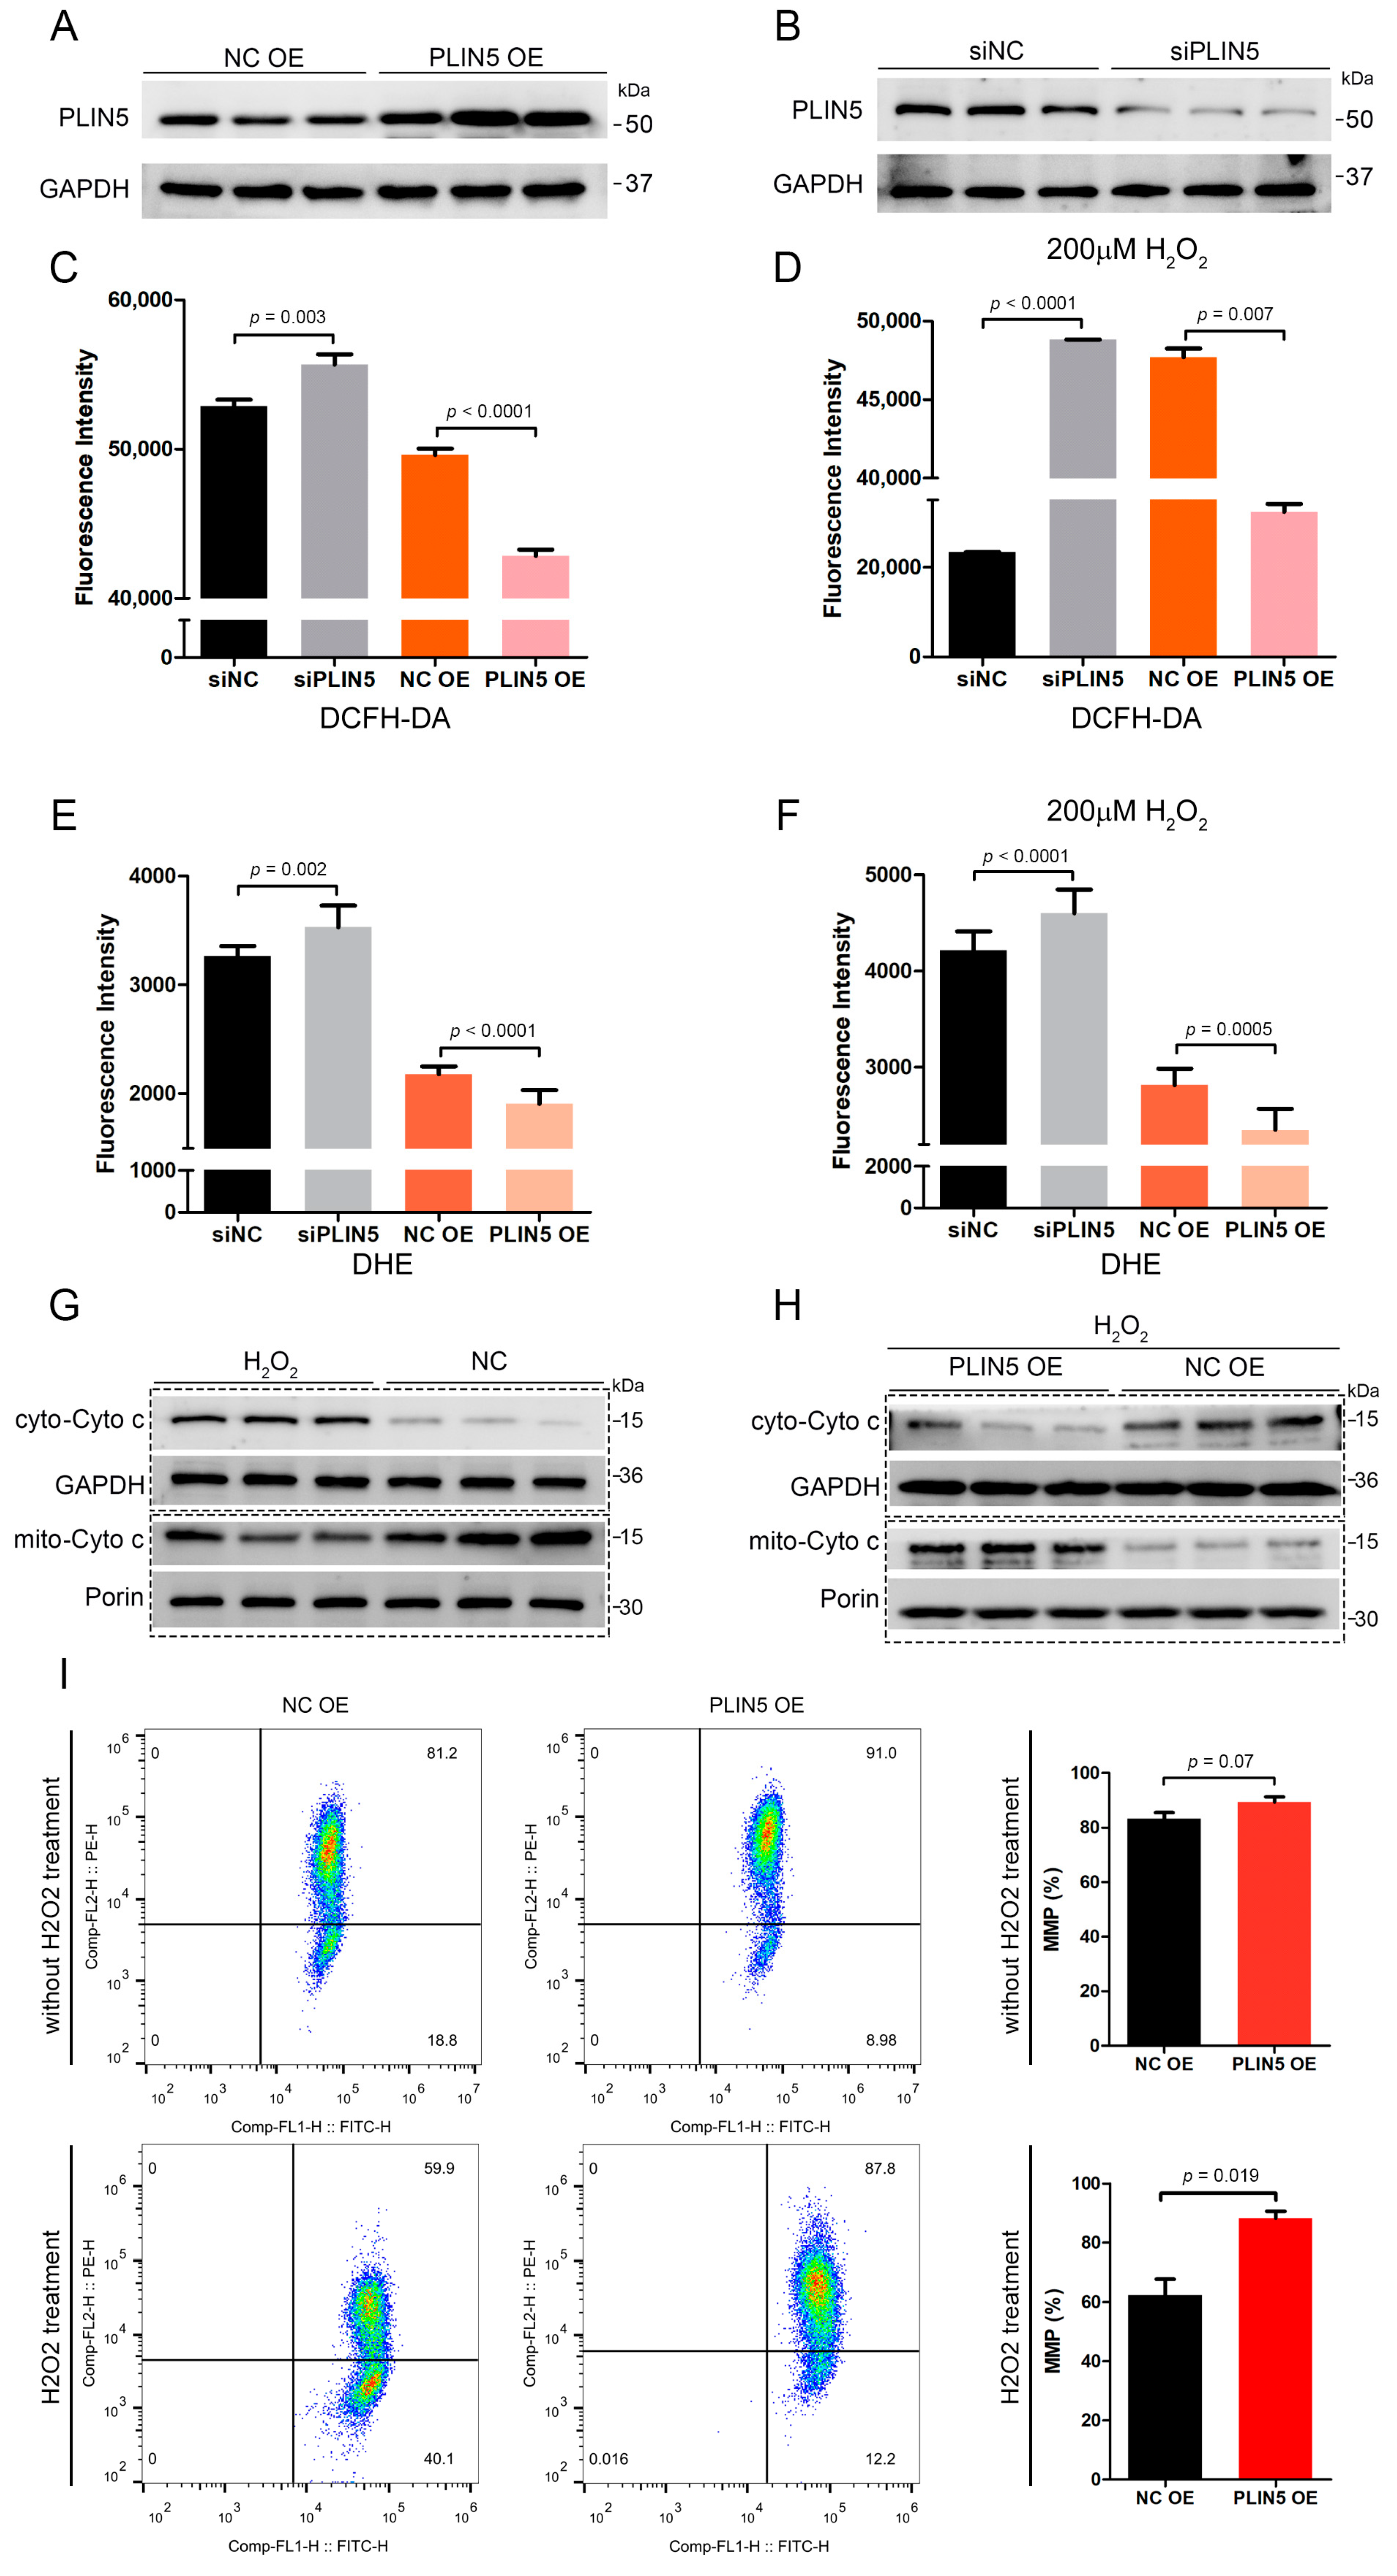
2.3. PLIN5 Regulated Cellular ROS Levels

To investigate whether PLIN5 was involved in the anti-oxidant process, we validated the efficiency of PLIN5 overexpression and knockdown by the Western Blot method first. The result showed that PLIN5 was overexpressed and interfered successfully (Figure 3A,B). Subsequently, we knocked down and overexpressed PLIN5 to detect ROS levels by the DCFH-DA (2,7-dichlorodihydrofluorescein diacetate) method, respectively. The results showed that PLIN5 knockdown increased ROS levels, whereas PLIN5 overexpression decreased ROS levels significantly (p < 0.05; Figure 3C). Subsequently, we used 200 μM hydrogen peroxide to treat cells with PLIN5 knockdown and overexpression in order to investigate whether PLIN5 expression affected ROS levels of cells in oxidative stress. The results indicated that PLIN5 knockdown increased ROS levels, whereas PLIN5 overexpression decreased ROS levels significantly in cells treated with 200 μM hydrogen peroxide (p < 0.05; Figure 3D). To validate the phenotype, we further used the DHE (dihydroethidium) method to detect the O2• levels in PLIN5 knockdown, overexpression, and corresponding control cells, respectively. The microplate reader indicated that PLIN5 knockdown increased ROS levels, whereas PLIN5 overexpression decreased ROS levels (Figure 3E,F). The release level of cytochrome c from mitochondria to cell plasma is the gold standard to reflect the level of cellular oxidative stress. Therefore, we investigated whether PLIN5 knockdown aggravated or whether PLIN5 overexpression reduced hydrogen peroxide-induced cytochrome c release. Firstly, we treated the cells with 200 μM hydrogen peroxide and then isolated the cytosolic and mitochondrial fractions respectively to detect the levels of cytochrome c (Figure 3G). The result showed that hydrogen peroxide treatment increased cytosolic cytochrome c levels and decreased mitochondrial cytochrome c levels, which indicated that hydrogen peroxide treatment increased cytochrome c releasing from mitochondria to cytoplasm. Then we detected the effect of PLIN5 overexpression on the hydrogen peroxide treatment-induced cytochrome c release. The cells were transfected with PLIN5 expression vector or pcDNA3.1 (control) vector, and then treated with 200 μM hydrogen peroxide. The cytoplasm and mitochondria were isolated, and then cytosolic and mitochondrial cytochrome c levels were detected through Western Blot, respectively. The result showed that PLIN5 overexpression decreased cytosolic cytochrome c levels but increased mitochondrial cytochrome c levels compared to the control in the presence of hydrogen peroxide (Figure 3H). Mitochondrial membrane potential is an important indicator for mitochondrial oxidative damage. Therefore, we detected the mitochondrial membrane potential in cells with PLIN5 overexpression or control by the JC-1 (5,5′,6,6′-tetrachloro-1,1′,3,3′-tetraethyl-imidacarbocyanine) method. As expected, the mitochondrial membrane potential was significantly higher in cells with PLIN5 overexpression than in the corresponding control cells (Figure 3I). Furthermore, we detected the mitochondrial membrane potential in cells with PLIN5 overexpression or control in the presence of hydrogen peroxide. The result showed that mitochondrial membrane potential of PLIN5 overexpression group was higher than the control group (Figure 3I).

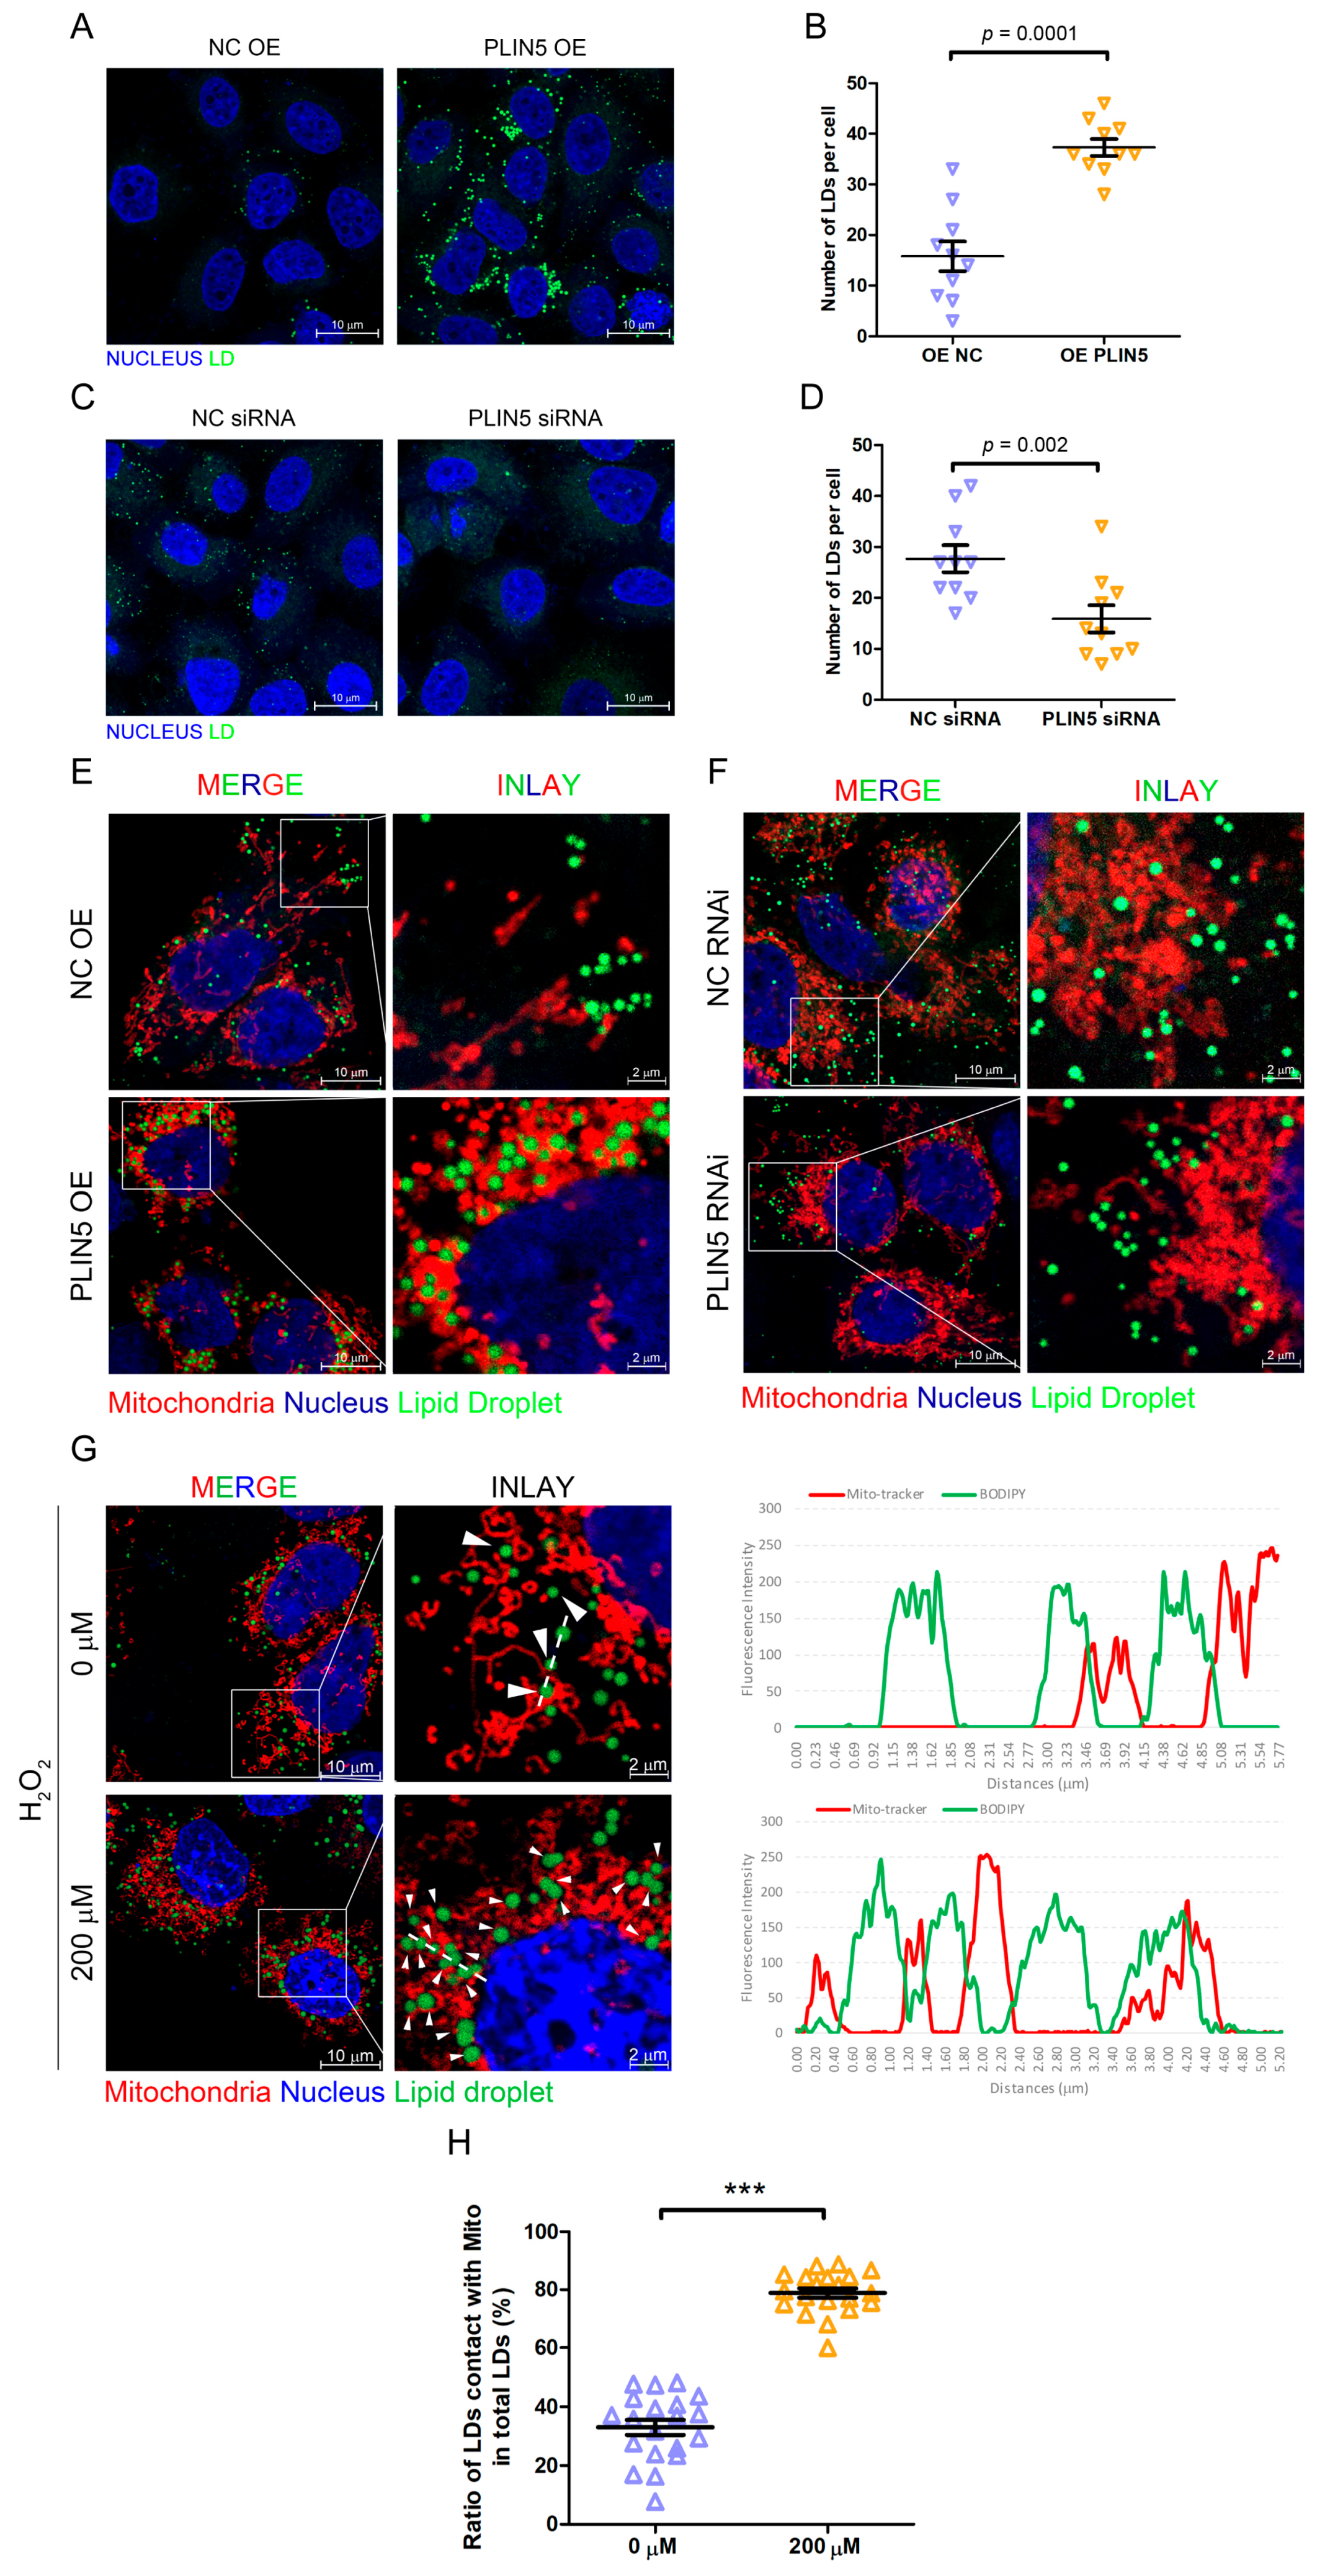
2.4. PLIN5 Promoted LD Formation and Contact with Mitochondria

We have shown that up-regulated PLIN5 decreased cellular ROS levels, so we then investigated the regulatory mechanism. Our previous study has shown that the up-regulation of PLIN2 promoted the formation of cellular LDs [12]. Therefore, PLIN5 was overexpressed in HepG2 cells, and then the cellular LDs were labeled by BODIPY493/503 (4,4-difluoro-1,3,5,7,8-pentamethyl-4-bora-3a,4a-diaza-s-indacene) to reflect the effect of PLIN5 up-regulation on LD content. As expected, the number of cellular LDs in cells with PLIN5 overexpression was higher than the LDs in control cells (p < 0.05; Figure 4A,B). To validate the phenotype, the LD content was detected in cells transfected with siRNA oligos targeting PLIN5 and control cells. The result indicated that PLIN5 knockdown decreased the number of cellular LDs (p < 0.05; Figure 4C,D). A previous study showed that PLIN5 promoted LD contact with mitochondria, and subsequently, we validated this phenotype in HepG2 cells. There was no doubt that the result indicated that the overexpression of PLIN5 highly enhanced this contact in HepG2 cells (p < 0.05; Figure 4E,F). Moreover, we also investigated whether hydrogen peroxide treatment induced LD contact with mitochondria, since the high levels of ROS up-regulated PLIN5. The mitochondria were labeled by a mito-tracker, and LDs were marked by BODIPY. After the treatment with hydrogen peroxide, the contact events were increased significantly compared to corresponding cells (p < 0.05; Figure 4G,H). The results indicated that high ROS levels enhanced LD formation and promoted LD contact with mitochondria by up-regulating PLIN5.

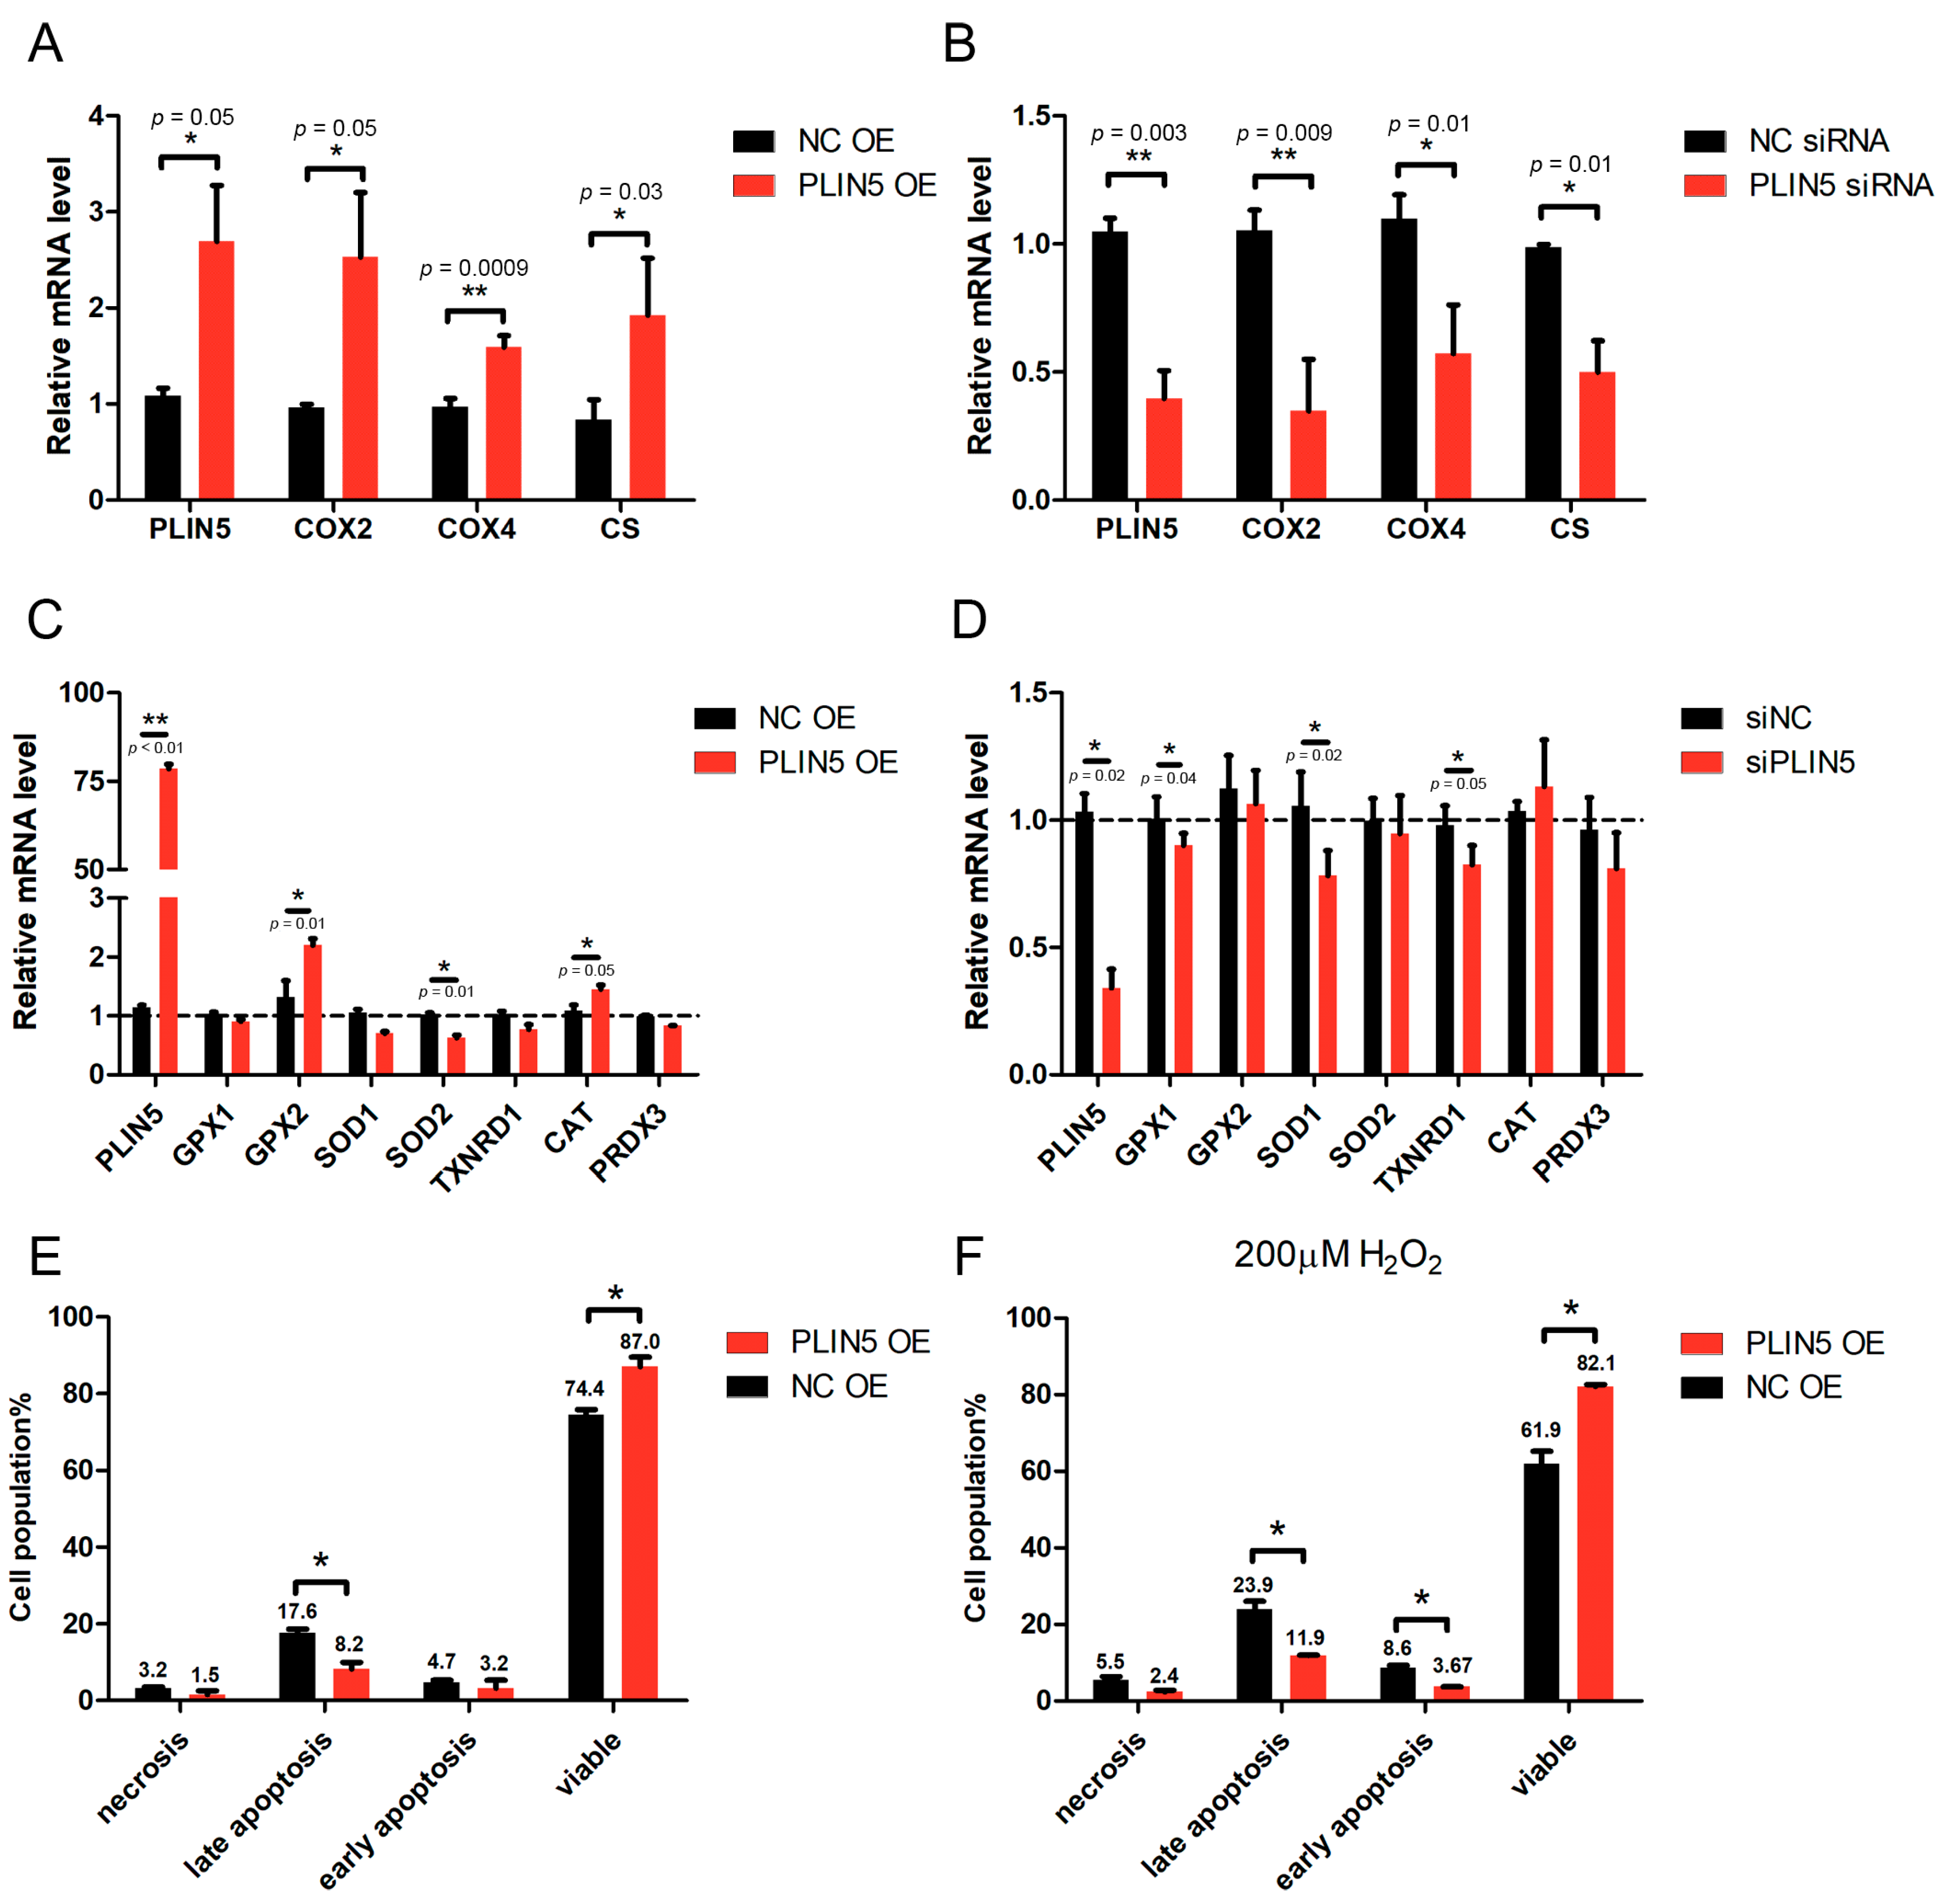
2.5. PLIN5 Regulated the Expression Levels of Mitochondrial Function-Related Genes

One of the functions of mitochondria is oxidative metabolism, which requires several mitochondrial respiratory chain oxidases, such as COX and CS. The expression levels of COX and CS are related to the mitochondria activity. Therefore, we further investigated whether PLIN5 expression affected the expression of COX and CS. The qPCR results showed that COX2, COX4, and CS were up-regulated in the cells with PLIN5 overexpression (Figure 5A), whereas they were down-regulated significantly in cells with PLIN5 knockdown (p < 0.05; Figure 5B). Subsequently, we investigated the effect of PLIN5 expression on the expression levels of several cellular anti-oxidant genes including GPX1, GPX2, SOD1, SOD2, TXNRD1, CAT, and PRDX3 through qPCR. The result showed that GPX2 and CAT mRNA levels were increased significantly after PLIN5 overexpression (p < 0.05), but SOD2 mRNA level was decreased (Figure 5C). After PLIN5 knockdown, the mRNA levels of GPX1, SOD1, and TXNRD1 were decreased significantly (p < 0.05; Figure 5D).

2.6. PLIN5 Reduced Apoptotic Rates of HepG2 Cells

The mitochondrial activity is important for the cellular apoptosis process; therefore, we further investigated the effect of PLIN5 on the regulation of cellular apoptosis. The rates of apoptosis of HepG2 cells were detected by the flow cytometry method. The results showed that PLIN5 overexpression decreased the apoptotic rates significantly (p < 0.05; Figure 5E). Subsequently, a rescue experiment was carried out. PLIN5 was overexpressed in the cells treated with hydrogen peroxide for 12 h, and then the apoptotic rates were detected. The result indicated that PLIN5 overexpression rescued the enhancement of cellular apoptosis induced by hydrogen peroxide treatment (p < 0.05; Figure 5F).

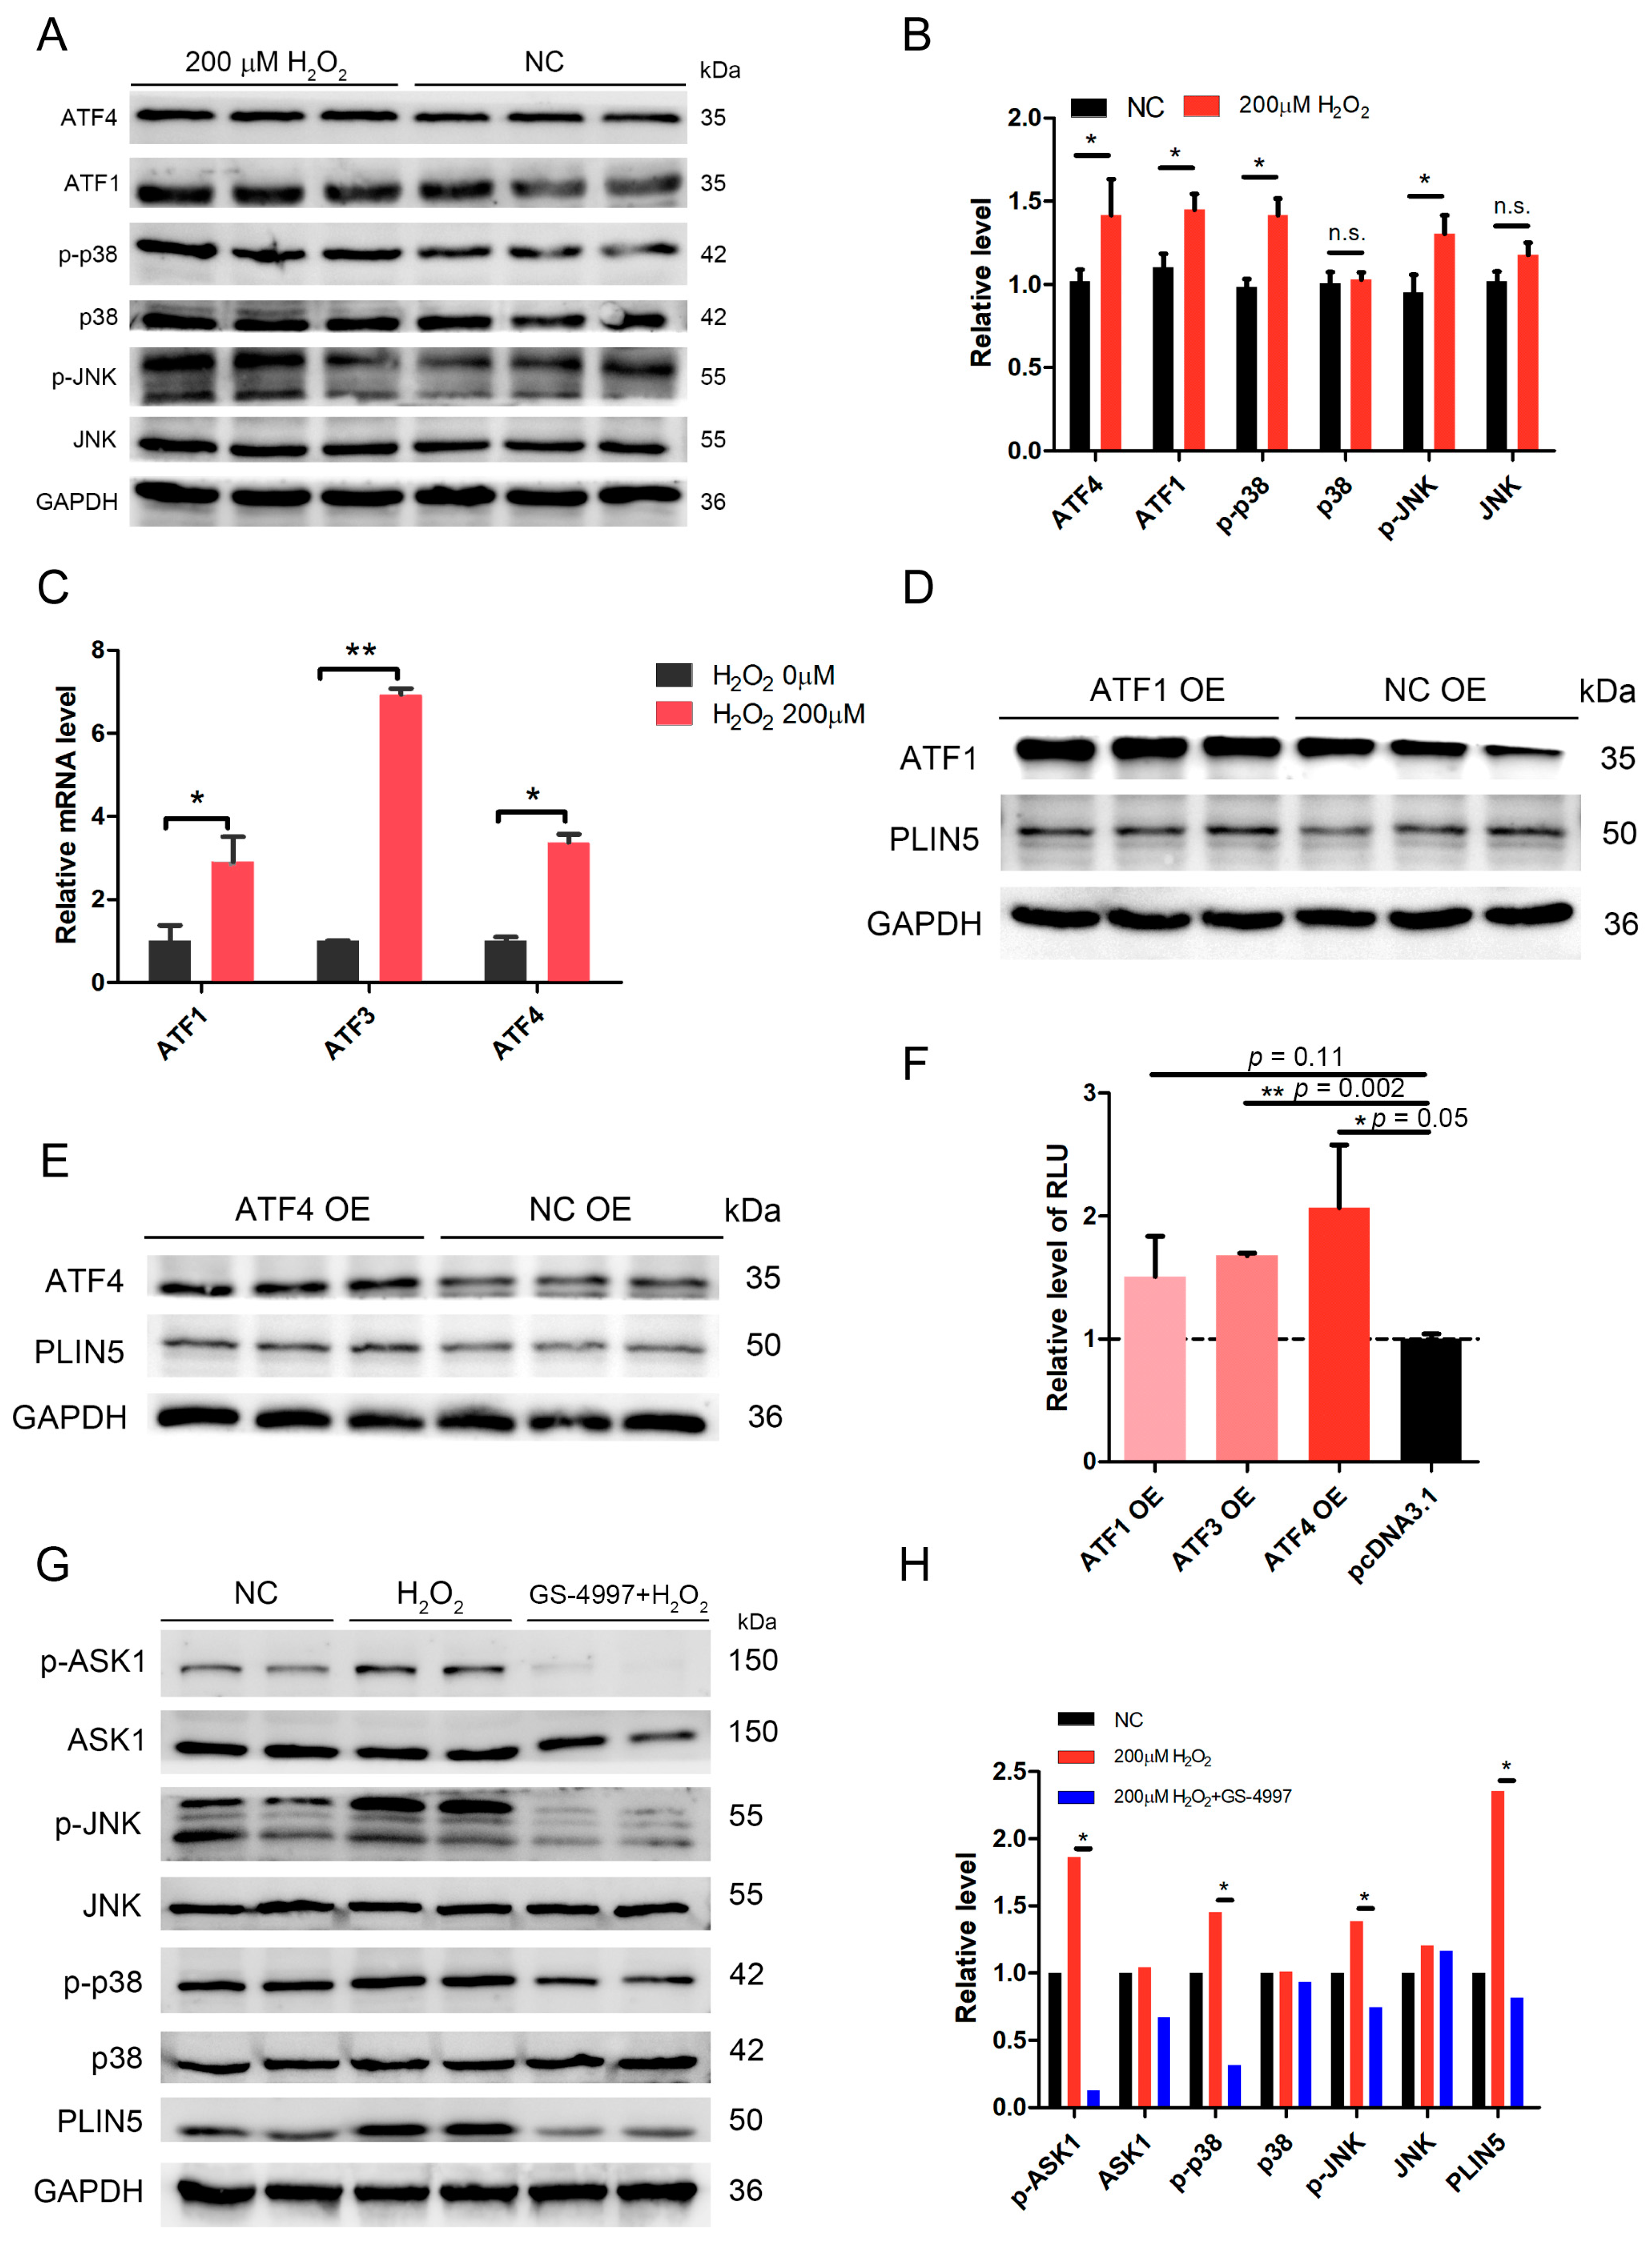
2.7. The Expression of PLIN5 Was Regulated by the JNK-p38-ATF Pathway

We analyzed the promoter region to investigate the transcriptional regulation mechanism of PLIN5 expression. The GeneHancer dataset showed two potential promoter/enhancer regions (GH19J004539 and GH19J004534) whose distances from TSS (transcription start site) were −5.3 kb and +0.1 kb. Then, the transcription factor binding sites in these two regions were analyzed. We found that these two regions contained JNK, ATF1, and ATF4 binding sites. It is well known that JNK-p38 is an important signaling involved in stress response, which is activated by oxidative stress, DNA damage, and UV, and subsequently regulates the downstream targets’ expression, such as ATFs and STATs [31,32,33,34]. We have shown that PLIN5 was up-regulated by hydrogen peroxide treatment; therefore, we assumed that PLIN5 expression was regulated by the JNK-p38-ATF pathway. The phosphorylation levels of p38 and JNK were detected. The Western Blot results indicated that p-p38 and p-JNK levels were significantly increased in cells with hydrogen peroxide treatment (p < 0.05; Figure 6A,B). Moreover, the downstream targets of JNK-p38, ATF1, and ATF4 were also up-regulated (Figure 6A,B). To further investigate whether ATFs regulate PLIN5 expression, we overexpressed ATF1 and ATF4 and detected the PLIN5 expression levels of both mRNA and protein. The qPCR and WB results showed that both mRNA and protein levels of PLIN5 were increased significantly by either ATF1 or ATF4 overexpression (p < 0.05; Figure 6C–E). Subsequently, we cloned the promoter/enhancer regions of PLIN5 (−2 kb) into pGL3-basic reporter vector to confirm the regulatory role of ATFs in PLIN5 expression. The dual luciferase reporter gene assay showed that the fluorescence intensity of cells with ATF1 or ATF4 overexpression was much higher than that of the control cells (Figure 6F). The results indicated that both ATF1 and ATF4 did promote the transcriptional activity of PLIN5. To further validate the effect of JNK-p38 pathway on the expression of PLIN5, we utilized the p38-JNK pathway inhibitor, GS-4997 (Selonsertib). GS-4997 could inhibit the activity of ASK1 so that to suppress the phosphorylation of downstream targets, JNK and p38. We found that hydrogen peroxide treatment activated the JNK-p38 pathway, but the GS-4997 treatment suppressed the JNK-p38 pathway (Figure 6G,H). Furthermore, we also found that hydrogen peroxide treatment increased the expression levels of PLIN5, and whereas GS-4997 treatment blocked the upregulation of PLIN5 induced by hydrogen peroxide treatment (Figure 6G,H).

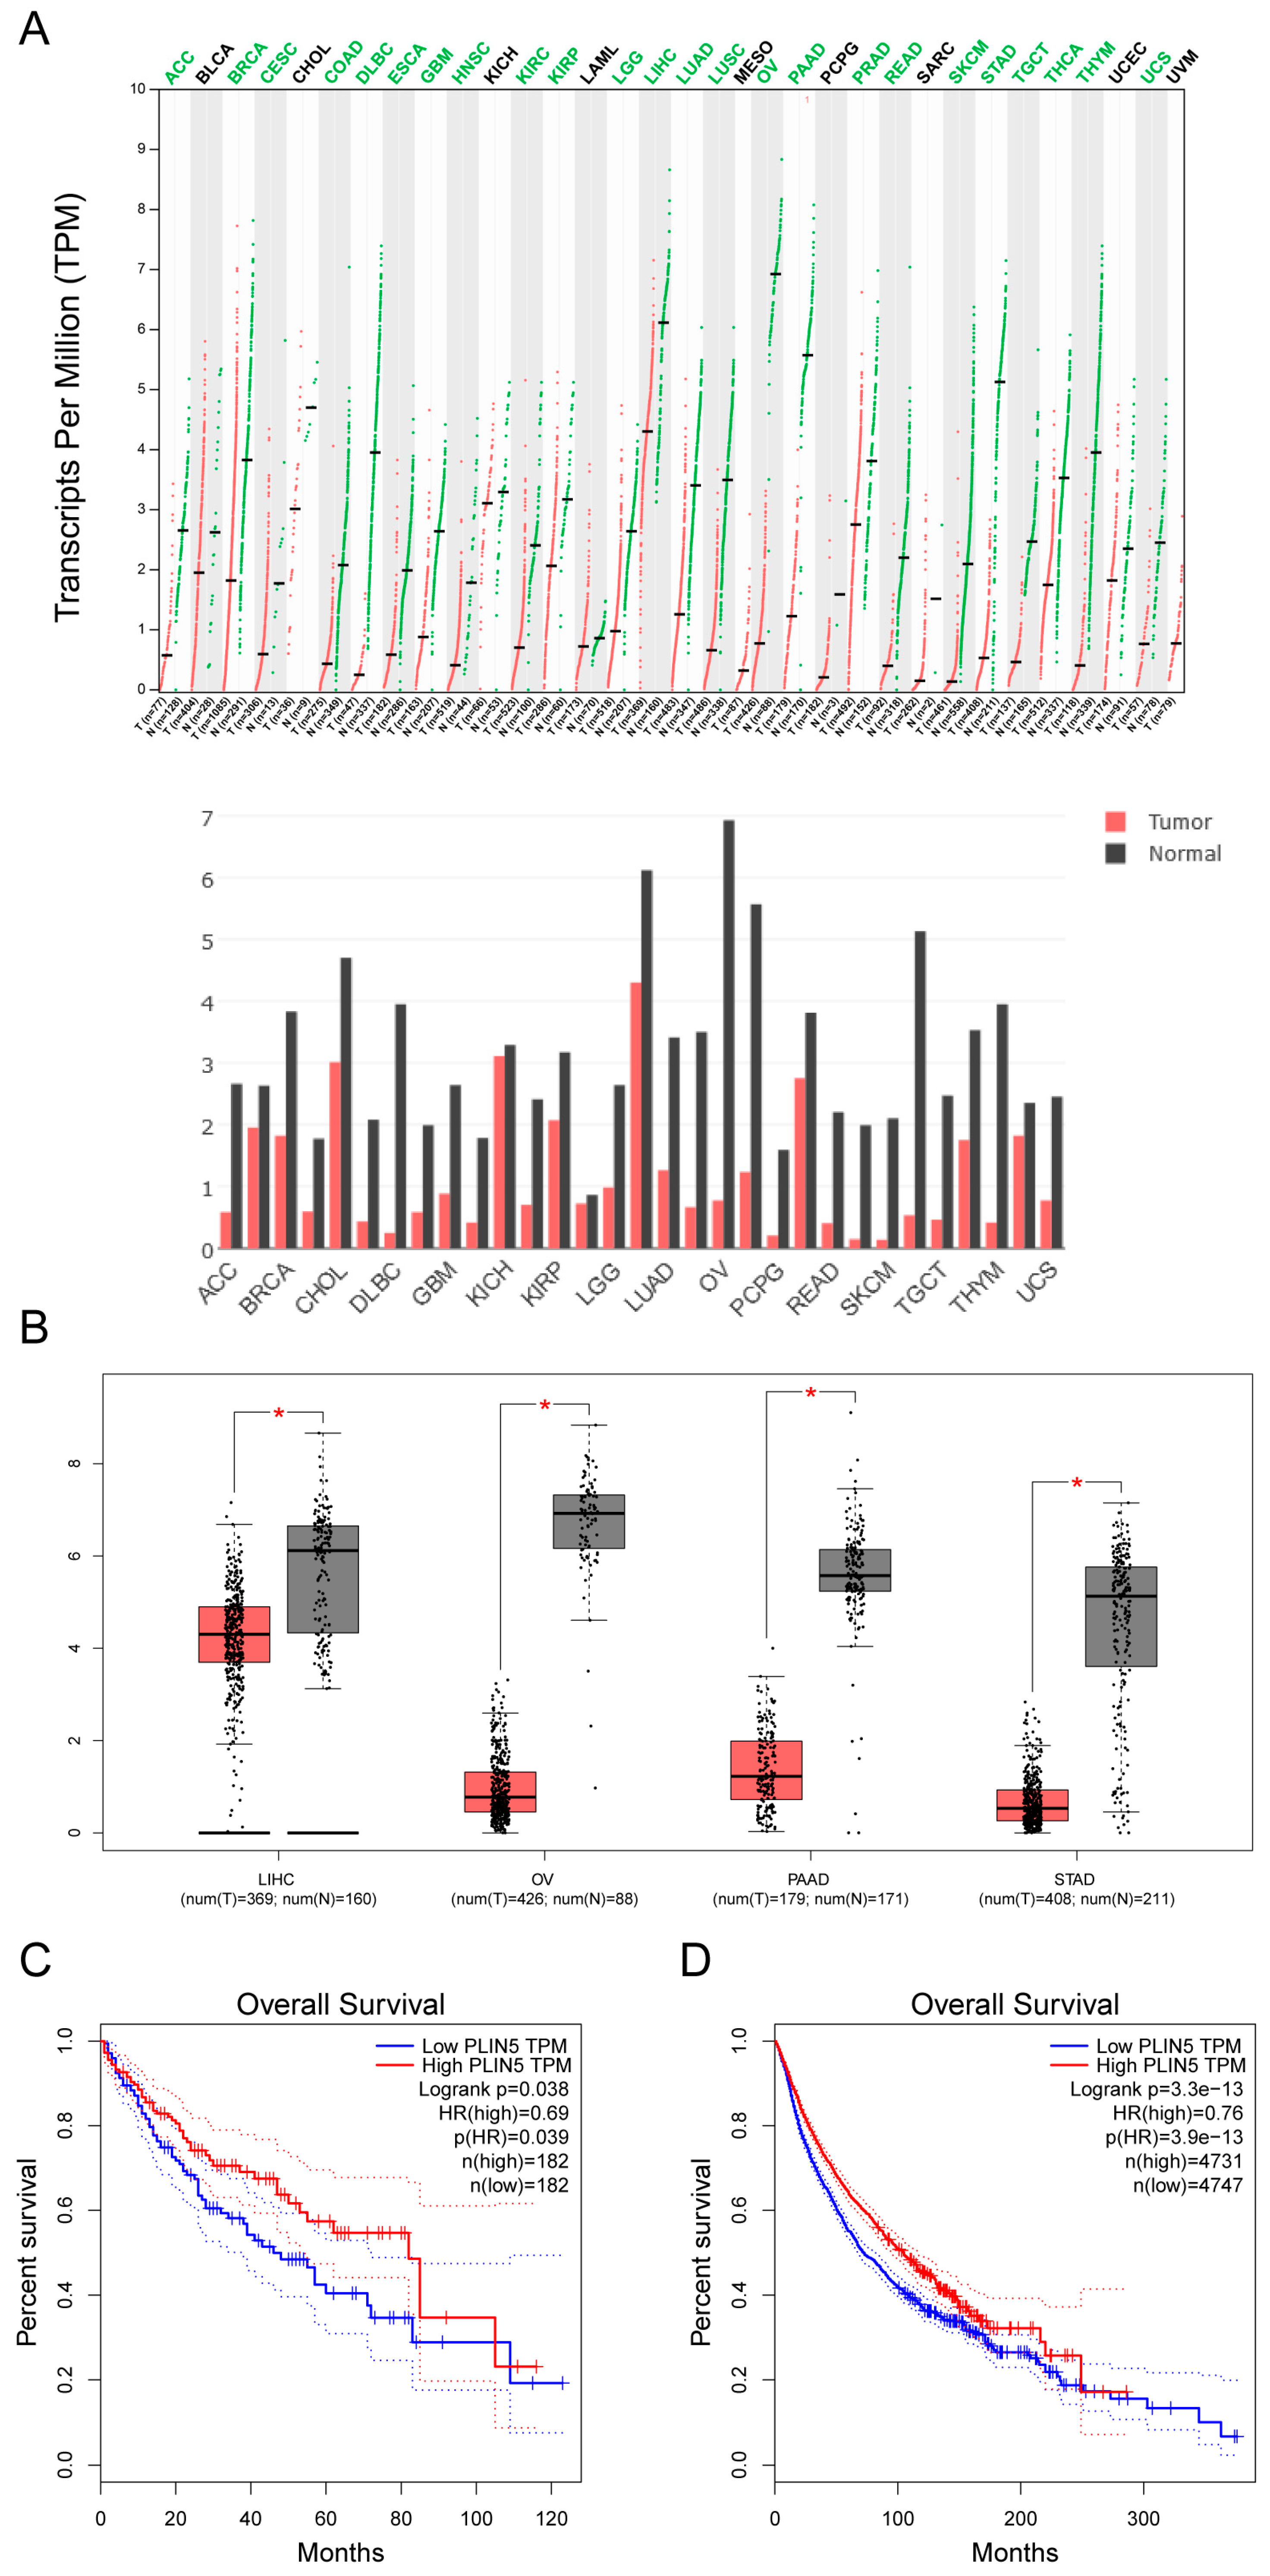
2.8. Low Expression of PLIN5 Is Associated with Poor Prognosis

We have shown that PLIN5 expression was enhanced by oxidative stress and PLIN5 could alleviate cellular ROS levels. We then analyzed the expression level of PLIN5 in different kinds of tumors via the GEPIA (gene expression profiling interactive analysis) database (http://gepia.cancer-pku.cn/). Interestingly, many kinds of tumor samples showed lower PLIN5 expression compared to normal samples (Figure 7A). Furthermore, among these kinds of tumor samples, liver hepatocellular carcinoma (LIHC), ovarian serous cystadenocarcinoma (OA), pancreatic adenocarcinoma (PAAD), and stomach adenocarcinoma (STAD) showed the largest differences (Figure 7B). Subsequently, survival analysis showed that the prognosis of LIHC was poor with a low expression level of PLIN5 (Figure 7C). Then, survival analysis was performed to predicate the prognosis of 31 kinds of tumors with lower expressions of PLIN5 (including ACC, BLCA, BRCA, CESC, CHOL, COAD, DLBC, ESCA, GBM, HNSC, KICH, KIRC, KIRP, LAML, LGG, LICH, LUAD, LUSC, OV, PPAD, READ, SARC, SKCM, STAD, TGCT, THCA, THYM, UCEC, and UCS; the extension of tumor abbreviations can be referred to in GEPIA). The result indicated that a low expression level of PLIN5 was associated with poor prognosis (Figure 7D). These results indicated that low expression levels of PLIN5 were bad for the prognosis of tumors.

3. Discussion and Conclusions

NAFLD has become one of the most common liver metabolic diseases worldwide. One obvious characterization of NALFD is an accumulation of LDs. A high level of hepatic fat accumulation increased cellular free fatty acids in hepatocytes, which was induced by lipolysis. However, the overaccumulation of free acids is dangerous because of toxic metabolites generated by fatty acid breakdown. Moreover, high lipid content showed higher levels of ROS [35]. Indeed, in liver tissues with NAFLD, a high level of oxidative damage was observed [4]. The enhanced oxidative stress resulted in changes in mitochondrial permeability transition, which was able to decrease the mitochondrial membrane potential and subsequently induce cell apoptosis. It is well known that decreasing the number of hepatocytes impairs the hepatic function and promotes NAFLD/NASH development [36]. Therefore, reducing cellular ROS levels contributed to the alleviation of oxidative damage, which was good for NAFLD/NASH treatment. However, the expression levels of SOD and other antioxidant enzymes, the main scavengers of cellular ROS, were decreased in NAFLD/NASH tissues [4]. Therefore, we considered that a compensation mechanism could exist to respond to this case.
PLIN5 is a conserved LD protein that belongs to the PAT family [13]. PLIN5 is expressed mainly in tissues with high oxidative metabolism such as liver, skeletal muscle, cardiac muscle, and brown adipose tissues. It is interesting that PLIN5 was reported to be the key factor regulating LDs contacting mitochondria [37]. 443-463aa is the key region that promotes LDs’ recruitment to mitochondria [22]. The deletion of 443-463aa of PLIN5 deprived the ability of PLIN5 promoting LDs contacting mitochondria [22]. Additionally, 443-463aa region of PLIN5 is highly conserved between different species [22]. A previous study has showed that the overexpression of PLIN5 promoted cellular LD accumulation, whereas knockdown PLIN5 enhanced fatty acid oxidation metabolism in liver cells [38]. Moreover, an SNP (single nucleotide polymorphism; rs327694326, NC_010444.4:g.74314701T>C) in Italy big white, Italy Duroc, and Peter ran pigs, which induced high expression levels of PLIN5, promoted lipid accumulation and decreased the levels of HSL, an important lipolysis. Ilan et al. overexpressed PLIN5 in mouse brown adipocytes and found that more mitochondria surrounded LDs and lipid synthesis was enhanced to promote the expansion of LDs [22]. In our study, we found that the overexpression of PLIN5 increased the number of cellular LDs, whereas PLIN5 knockdown decreased the number of cellular LDs (Figure 4C,D). Moreover, we also found that PLIN5 overexpression promoted LD contact with mitochondria.
It is well known that organelle contacts usually induce the exchange of proteins in the outer membrane. LD is a highly dynamic organelle, which contacts other organelles frequently, such as endoplasmic reticulum (ER), mitochondria, peroxisome, and autolysosome. Many studies have reported that LD–ER contacts resulted in ER proteins, such as lipid synthetases (DGAT2, GPAT4) transferring to LDs [39,40,41,42]. LD contact with ER is important to LDs’ expansion and cellular lipid homeostasis. A previous study showed an interesting phenotype involving LDs contacting mitochondria and clearing harmful proteins from the outer mitochondrial membrane [26]. A high level of cellular ROS induced the damage, and when accumulated damage exceeded a certain threshold, the cells would undergo the apoptosis process. During this process, some specific proteins were translocated to mitochondria such as pro- and anti-apoptotic proteins, for example, BAX, BCL-XS, BIK, BAK, BCL-2, BCL-XL, and CED [43,44]. Among these proteins, BAX played an important role in leading to a permeabilization of the outer mitochondrial membrane, which was able to subsequently induce the release of cytochrome c and apoptosis [45,46]. Interestingly, BAX and BCL-XL contained a protein domain consisting of two α-helices, which allowed them to localize to LDs. When LDs were in contact with mitochondria, BAX and BCL-XL were translocated to LDs from mitochondria [26]. Therefore, we considered that enhancing LD contact with mitochondria promoted the translocation process, which would subsequently modulate the stress response. In the present study, PLIN5 overexpression enhanced the contacts between LDs and mitochondria, and the cellular ROS levels were significantly decreased (p < 0.05; Figure 3 and Figure 4). Moreover, we also detected the influence of PLIN5 expression on the expression of several anti-oxidant genes. The results showed that PLIN5 did affect several anti-oxidant enzymes. We considered that there was a little effect, because not so many anti-oxidant enzymes such as some isoforms of SOD, CAT, and GPX can be influenced by the change of PLIN5 expression. Therefore, the PLIN5-mediated LD contact with mitochondria could be an important mechanism for cells to respond to oxidative stress. For further study, the proteins of mitochondria and LDs in cells with PLIN5 overexpression and control could be isolated, respectively, to investigate whether PLIN5 overexpression promotes the proteins’ translocation between these two organelles and to analyze the terms of proteins translocated through the mass spectrum method.
We investigated the regulatory pathway of PLIN5 during the oxidative stress process. It is well known that the JNK-p38 signaling pathway plays an important role in the stress response. When the ROS levels (such as cellular hydrogen peroxide) were elevated, apoptosis signal-regulating kinase 1 (ASK1) was activated and subsequently sustained the activation of JNK and p38 MAPK signaling [47]. The activated JNK and p38 MAPK signaling would further activate ATFs’ expression [31,32,33,34]. In our study, JNK-p38 MAPK signaling was activated by hydrogen peroxide treatment, and then ATF1 and ATF4 expression levels were significantly increased (p < 0.05; Figure 6A), which corresponds to the previous studies. Through bioinformatic analysis, we found that the promoter region of PLIN5 contained the binding sites of ATFs. Therefore, we considered that the expression of ATFs could affect the expression levels of PLIN5. Overexpression of ATF1 or ATF4 indeed up-regulated PLIN5 (Figure 6B,C). Furthermore, we also validated the regulatory role of ATFs on PLIN5 expression experimentally, through dual luciferase reporter gene assay. The results confirmed that ATFs did indeed enhance the transcriptional activity of PLIN5. Therefore, we demonstrated that the ROS-JNK-p38-ATFs regulatory axis modulated the expression of PLIN5 so that it regulated the cellular stress response process. Moreover, many studies have reported that ASK1 signaling played an important role in NAFLD/NASH processes by promoting the inhibition of lipid and glucose metabolism [48,49,50] and by driving a strong inflammatory response [51]. Currently, ASK1 has become a key therapeutic target for NAFLD/NASH. For example, Selonsertib (GS-4997) is a highly selective and potent ASK1 inhibitor with potential anti-inflammatory, anti-tumor, and anti-fibrotic activities [52]. ASK1-JNK-p38 signaling was activated in NAFLD/NASH; therefore, PLIN5 expression levels were supported to increase also. Our results showed that PLIN5 expression was indeed up-regulated in liver tissues of mice fed with MCDD, which supported our hypothesis. We considered that PLIN5 up-regulation could be a rescue mechanism during NAFLD/NASH processes. Increased PLIN5 expression promoted LDs contacting mitochondria, enhanced the expression of mitochondrial functional genes and subsequently alleviated the cellular oxidative stress. We found that many kinds of tumors cells showed low expression levels of PLIN5 (Figure 7A). Previous studies showed that NAFLD and NASH were well-known risk factors of hepatocellular carcinoma (HCC) [53,54], whereas and HCC was a lipid-rich tumor. Patients with obesity and NAFLD/NASH show an increased intake of dietary fatty acids (FAs). Meanwhile, insulin resistance enhances lipolysis of adipose tissue, which causes an increased exogenous FA supply and results in the development of a “lipid-rich” environment for hepatocytes. As we all know, more FAs would promote cells to generate more ROS through β-oxidation process. High level of cellular ROS often induced cellular stress and promoted cell apoptosis. However, we found that PLIN5 could reduce cellular ROS levels and reduce cell apoptosis in the present study. Moreover, we also found that expression of PLIN5 could increase cellular lipid content. Previous studies reported that the lipid-rich environment is considered to promote the proliferation and metastasis of tumor cells [55,56,57]. Therefore, we considered that both functions of PLIN5, regulating cellular ROS levels and regulating cellular lipid content and lipolysis, could influence the tumor development process. Consequently, the down-regulation of PLIN5 could be a predisposition for tumors’ occurrence. PLIN5 can be a good therapeutic target for NAFLD due to its ability to protect against oxidative stress and enhance mitochondrial function.
In the present study, we found that increase of cellular ROS induced by hydrogen peroxide or LPS treatment could up-regulate PLIN5 expression. We then identified that ROS regulates the expression levels of PLIN5 through JNK-p38-ATF signaling. Furthermore, we found that PLIN5 could regulate the expression levels of mitochondrial cytochrome c oxidases (COXs) such as COX2, COX4 and CS. Therefore, PLIN5 could decrease cellular ROS levels through reducing the generation of ROS products by mitochondria, because up-regulation of COXs could reduce ROS products. Above is the novelty of this study. However, there are also several limitations in this study. The regulatory mechanism of PLIN5 modulating the expression of COXs need further study. For example, studying the mechanism of protein exchange between LD and mitochondria during these two organelles contact. The LDs in cells with PLIN5 overexpression could be isolated and the LD-related proteins on LD surface could be analyzed by mass spectrometry. Subsequently, whether PLIN5 could promote protein exchange between LD and mitochondria can be investigated, by detecting the levels of mitochondrial-derived proteins on LD surface. Moreover, we noted that PLIN5 could influence the expression levels of cellular anti-oxidative enzymes, such as SOD1, SOD2, GPX1, GPX2, and CAT. Although the effect of PLIN5 on the expression of these enzymes was very mild, the mechanism is worth further study.
In conclusion, ROS-mediated activation of JNK-p38-ATF signaling up-regulated expression levels of PLIN5, and, then, increased PLIN5 levels enhanced lipid synthesis and promoted LD contact with mitochondria, which helped cells to modulate stress response (Figure 8). Moreover, our study suggests that PLIN5 could be a therapeutic target for NAFLD.

4. Materials and Methods

4.1. Animals

Six-week-old c57/bl6 male mice were purchased from Hubei Center for Disease Control and Prevention. All mice were housed in a normal environment and were provided with food and water. The methods were carried out in accordance with approved guidelines from Huazhong Agricultural University and the scientific, ethical, and legal principles of the Hubei Regulations for the Administration of Affairs Concerning Experimental Animals. All of the experimental protocols were subject to approval by the Ethics Committee of Huazhong Agricultural University (HZAUMU2013-0005). The mice were fed with either a methionine-choline-deficient diet (MCDD) or a high-fat diet (HFD) to make a NAFLD phenotype in liver tissue. The mice were divided into nine groups, which were fed with MCDD for 0 week (control groups), 1 week, 2 weeks, 3 weeks, 4 weeks, 6 weeks, 8 weeks, and HFD for 10 weeks. The control groups of mice were fed with chow diet.

4.2. Cell Culture

The HepG2 cell line was gifted by the lab of Prof. Xianghua Yan, Huazhong Agricultural University (Wuhan, China), which was purchased from the Type Culture Collection of the Chinese Academy of Sciences (Wuhan, China). HepG2 cells were cultured in Dulbecco’s Modified Eagle Medium (DMEM; HyClone, Logan, UT, USA) with 10% fetal bovine serum (FBS; #SH30396.03, Hyclone, Canada), 100 unit/mL penicillin, and 100 μg/mL streptomycin in dishes at 37 °C, in a humidified atmosphere, with 5% CO2. For oleic acid treatment, a 20 mM oleic acid-phosphate buffer saline (PBS) mixture and 20% FA-free bovine serum albumin (BSA) medium were prepared, and both media were heated in a 70 °C water bath for 30 min. Finally, the media were mixed. The 10 mM oleic acid-BSA mixture was added to the cell cultural medium at 1:49 (v:v). The cells were then either seeded on slides, or on plates that had been washed three times using PBS. Then, 1 mL oleic acid medium was added to the well, and the cells were cultured for 12 h.

4.3. Antibodies

Rabbit polyclonal antibodies that were used included anti-PLIN5 (#26951-1-AP, Proteintech, Wuhan, China), anti-ATF1 (#11946-1-AP, Proteintech, Wuhan, China), anti-ATF4 (#10835-1-AP, Proteintech, Wuhan, China), anti-MAPK14 (p38; #A10832, Abclonal, Wuhan, China), anti-Phospho-MAPK14-T180/Y182 (#AP0526, Abclonal, Wuhan, China), anti-Phospho-JNK1/2/3- T183/T183/T221 (#AP0631, Abclonal, Wuhan, China), anti-ASK1 (#A6274; rabbit polyclonal antibody; ABclonal; 1:2000 dilution), anti- p-ASK1 (#AP0394; rabbit polyclonal antibody; ABclonal; 1:2000 dilution), anti-VDAC1/Porin (#55259-1-AP, Proteintech, Wuhan, China), and anti-GAPDH (#AC027, Abclonal, Wuhan, China). The mouse monoclonal antibody that was used included anti-JNK1/2/3 (#A11119, Abclonal, Wuhan, China). The following secondary antibodies were used: HRP (horseradish peroxidase)-labeled Goat Anti-Rabbit IgG (H+L; #AS014, Abclonal, Wuhan, China), and HRP-labeled Goat Anti-Mouse IgG (H+L; #AS003, Abclonal, Wuhan, China).

4.4. Transfection Assay

Cells were seeded on a 6-well plate or on slides in a 24-well plate. Then, the cells were transfected with Lipo8000™ Transfection Reagent (#C0533, Beyotime, Nanjing, China). For the preparation of RNAi working solution, 10 μL siRNA oligo (20 μM, Ribobio, Guangzhou, China) was mixed with 10 μL Lipo8000 regent in 100 μL DMEM. For the preparation of the overexpression working solution, 2.5 μg plasmid was mixed with 4 μL Lipo8000 regent in 50 μL DMEM. The working solution was added in the plate well and incubated for 6 h. Then, the plate well was changed with fresh cultural medium (DMEM with 10% FBS) for another 48 h of culture.

4.5. Plasmid DNA Construction

For the overexpression assay and the localization assay, expression vector and fluorescence-labeled vector were constructed. In brief, the PLIN5/ATF1/ATF4 CDS region was amplified by the cDNA library of HepG2 cells using KOD-Plus-Neo DNA polymerase (#KOD-401, TOYOBO, Shanghai, China). After gel extraction, the PLIN5 CDS fragment was cloned into the digested pcDNA3.1 vector (digestion sites, HindIII and BamHI) using a seamless cloning kit (#C112-01, ClonExpress II One Step Cloning Kit, Vazyme, Nanjing, China). For the localization assay, the gene CDS region was cloned into the digested pCMV-C-Dsred (#D2624, Beyotime Biotechnology, Nanjing, China) or pCMV-C-EGFP (#D2626, Beyotime Biotechnology, Nanjing, China). For the luciferase reporter assay, the promoter region of PLIN5 (about 2000 bp upstream of the transcription initiation site of PLIN5) was cloned into the digested pGL3-basic vector (digestion sites, KpnI and XhoI).

4.6. Hydrogen Peroxide and LPS Treatment

The treatment process was the same as in our previous study [12]. Briefly, 30% hydrogen peroxide (i.e., 10 M) was diluted 10,000× by DMEM medium to 1 mM concentration, after the medium had been sterilized using a 0.22 μm filter. The hydrogen peroxide was then diluted to 200 μM and the medium was used to treat cells. The cells were then washed three times using PBS and were treated with different concentrations of hydrogen peroxide media; this operation is important for the treatment of hydrogen peroxide, especially if in low concentrations. Due to the significant impacts of small amounts of metals, such as iron and copper, on the outcomes of in vitro experiments, the medium contained ferric nitrate·9H2O (0.1 mg/L). No other iron or copper was present. The water that was used in this experiment was double distilled and deionized.

4.7. Lipid Droplets Marking and Observation

The cell slides were fixed with 4% paraformaldehyde for 15 min at room temperature. The slides were stained with BODIPY 493/503 (#D3922, Invitrogen, Carlsbad, CA, USA) for 10 min at 37 °C and were then stained with DAPI (#G-1012, Servicebio) for 10 min at 37 °C. After washing three times with PBS for 10 min each, the slides were sealed with an anti-fluorescent quenching solution (#P36961, ProLong™ Diamond Antifade Mountant, Invitrogen, Thermo Fisher, USA) for confocal microscopic observation (63× oil lens, BODIPY FL and DAPI channels, Zeiss LSM 800, Germany).

4.8. Western Blot

Western blotting was performed as reported previously [58]. Briefly, cells were collected and homogenized in lysis buffer (#P0013, Beyotime Biotechnology, Nanjing, China). Then, the homogenates were incubated with an SDS-PAGE sample loading buffer (#P0015A, Beyotime Biotechnology, Nanjing, China) at 98 °C for 10 min. Subsequently, the samples were separated by 10% sodium dodecyl sulfate-polyacrylamide gel electrophoresis (SDS-PAGE) and were transferred to a polyvinylidene fluoride (PVDF) membrane (Biorad, USA) using a semidry electrophoretic apparatus. The blocked membranes (#P0252-100mL, QuickBlock™ Blocking Buffer for Western Blot, Beyotime Biotechnology, Nanjing, China) were incubated with antibodies overnight at 4 °C. The blots were extensively washed three times with tris-buffered saline with tween20 (TBST) buffer for 10 min and were incubated under gentle agitation with the primary antibodies for immunodetection at 37 °C for 1.5 h (diluted in QuickBlock™ Primary Antibody Dilution Buffer for Western Blot, #P0256, Beyotime Biotechnology, Nanjing, China). Then, the blots were extensively washed three times with TBST. Subsequently, blots were incubated under gentle agitation with the secondary antibodies for immunodetection at 37 °C for 1 h (diluted in QuickBlock™ Secondary Antibody Dilution Buffer for Western Blot, #P0258, Beyotime Biotechnology, Nanjing, China). For detection, M5 eECL Western Blot Kit (#MF-078-01, Mei5bio, Beijing, China) and the chemiluminescence imaging system (LAS4000, ImageQuant, Germany) were used.

4.9. Real-Time PCR

Real-time PCR was performed using the QuantStudio 6 Flex Real-Time PCR System (ABI, Thermo Fisher, Shanghai, China) and Roche LightCycler® 480 (Roche, Switzerland), and the following PCR program: Denaturation at 95 °C for 10 min; amplification for 45 cycles at 95 °C for 15 s; annealing and extension at 60 °C for 1 min. 2× SYBR Green qPCR Master Mix (#B21203, Bimake, Shanghai, China) were used for the detection of RT-qPCR. Primer sequences are shown in Table 1. Specific amplifications for certain PCR reactions were assessed using a melting curve. One negative control reaction, in which the cDNA template was replaced by water, was performed to avoid potential contamination. The sample from each well was repeated three times, and the comparative Ct (2−ΔΔCt) value method was used for relative quantification. GAPDH (NM_002046.6) was used as the reference gene.

4.10. Apoptosis and Mitochondrial Membrane Potential Analysis

The analysis was performed by Servicebio Co., Ltd. (Wuhan, China). Briefly, the cells with transfections were collected through trypsin digestion. Then, the cells were incubated by annexin V-FITC and propidium iodide (PI). Then, the apoptosis rates were detected through flow cytometry (Ex = 488 nm, FL1 (Em = 525 ± 20 nm) and FL2 (Em = 585 ± 21 nm)). Flow Jo software was used to analysis the rates of cells in different conditions. For mitochondrial membrane potential (MMP) analysis, JC-1 probe was used. Briefly, the cells were collected and counted. The cells were then incubated with 10 μg/mL JC-1 probe at 37 °C for 20 min. Cells were detected through flow cytometry (Ex = 488 nm, FL1 (Em = 525 ± 20 nm) and FL2 (Em = 585 ± 20 nm)). Flow Jo software was used for the analysis.

4.11. Bioinformatics and Data Analysis

The survival predication was performed using the GEPIA database (http://gepia.cancerpku.cn/). The prognosis analysis and gene expression analysis were performed according to the construction of the creator of this database [59].

4.12. Dual-Luciferase Reporter Assay

The promoter region of PLIN5 was amplified by PCR with total DNA of HepG2 cells. The primers were used as following, F: 5′-GAAAACTGGATCGGATGAATTGG-3′ and R: 5′-CACCCCCGCCGGTCCCGC-3′. Then, the promoter region was cloned into the pGL3-basic vector. Then, the reconstructed vector was co-transfected with the ATFs expression or pcDNA3.1 (control) vectors and TK vector into HepG2 cells seeded into the 12-well plate. Moreover, pGL3-basic vector was used as the negative control and pGL3-CMV vector was used as the positive vector. Luciferase enzymatic activity was measured by a microplate reader from a multi-wavelength measurement system (PE Enspire, PerkinElmer, Germany) using a dual-luciferase reporter assay system (#RG027, Beyotime Biotechnology, Nanjing, China). The relative light unit (RLU) was normalized by a control group. The result was showed by the relative RLU. All transfections were performed in triplicate, and the data are expressed as the means ± SD.

4.13. Immunohistochemistry Assay

Liver tissue samples of MCDD- and HFD-fed mice and control mice were collected. Then, the samples were fixed in 4% paraformaldehyde for 24 h. The immunohistochemistry assay was entrusted by Servicebio (Wuhan, China). The detailed processes of this experiment can be referred to in our previous study [12].

4.14. Isolation of Cytosolic and Mitochondrial Fractions

The cell mitochondria isolation kit (#C3601, Beyotime Biotechnology, Nanjing, China) was utilized to isolate the cytosolic and mitochondrial fractions. Briefly, wash the cells with cold PBS and harvest the cells by trypsin-EDTA solution. Re-wash the cells two times and collect the cells by centrifuge, and then remove the supernatant. Add 1 mL mitochondrial isolation regent (with 1 mM PMSF) and resuspend the cells, and then incubate the suspension in an ice bath. Then the cell suspension was transferred to a glass homogenizer of appropriate size, and the homogenate was about 10–30 times. Centrifuge the cell homogenate at 600× g, 4 °C for 10 min. Then carefully transfer the supernatant to another centrifugal tube and centrifuge for 10 min at 11,000× g, 4 °C. The precipitation was the isolated mitochondria. The supernatant collected was then centrifuged for 10 min at 12,000× g, 4 °C. The supernatant was the cytoplasmic protein without mitochondria.

4.15. Fluorescence Image Analysis

The ImageJ software was utilized to analyze the number of mitochondria interacting LDs. Briefly, the fluorescence intensity was analyzed along with the dotted line (Figure 4G). If the LD is contacting mitochondria, the signal of Dsred (mitochondria) can be detected between or overlap the signal of BODIPY493/503 (lipid droplet). If the LD does not contact mitochondria, the signal of Dsred (mitochondria) is supposed to be losing between the signal of BODIPY493/503 (lipid droplet).

4.16. Survival Analysis and Normal/Cancer Gene Expression Comparison Analysis

The survival predication was performed by the GEPIA database (http://gepia.cancer-pku.cn/). The prognosis analysis and gene expression analysis were performed according to the construction of the creator of this database [59].

4.17. Statistical Analyses

All quantitative experiments were evaluated for statistical significance using the software GraphPad Prism v.5.0 (GraphPad Software, Inc. 7825 Fay Avenue, Suite 230 La Jolla, CA, USA), after verifying the normality of values and equivalence of variances. For lipid droplet counts, pixel quantification, LD-mitochondria contact site counts, fluorescence intensity, and qPCR analyses, means ± s.d. are displayed, and the statistical differences between overexpression or RNAi-treated or peroxide hydrogen-treated samples and controls were addressed using Student’s two-tailed t-tests. The Student’s t-test was utilized because the sample size in the experiment was small, and a sample mean and standard deviation can be obtained, and additionally samples came from normal or approximate normal population. A p-value < 0.05 was considered statistically significant.

Author Contributions

Y.J. conceived and designed the experiments. Y.T. and Q.W. performed the experiments (Y.T. performed the main part). Y.T. and Q.W. analyzed data. J.H. and X.W. contributed to the preparation of reagents/materials/analysis tools. Y.T. wrote the manuscript. Z.R. supervised this study.

Funding

This work was supported by the Fundamental Research Funds for the Central Universities (No. 2662018PY043), Hubei Agricultural Sciences and Technology Innovation Center Team of Livestock and Poultry Genetic Improvement and Healthy Breeding (2019-620-000-001-30) and the National Project for Breeding of Transgenic Pig (No. 2016ZX08006-002).

Conflicts of Interest

The authors declare that they have no competing interests.

Abbreviations

AMPKprotein kinase AMP-activated catalytic subunit
ASKapoptosis signal-regulating kinase
ATFactivating transcription factor
BODIPY4,4-difluoro-1,3,5,7,8-pentamethyl-4-bora-3a,4a-diaza-s-indacene
CATcatalase
COXcytochrome c oxidase subunit IV
CScitrate synthase
Cyto ccytochrome c
DCFH-DA2,7-Dichlorodihydrofluorescein diacetate
GEPIAgene expression profiling interactive analysis
GPXglutathione peroxidase
HFDhigh-fat diet
JC-15,5′,6,6′-Tetrachloro-1,1′,3,3′-tetraethyl-imidacarbocyanine
JNKjnk c-Jun N-terminal kinase
LDlipid droplet
LIHCliver hepatocellular carcinoma
LPSlipopolysaccharide
MAPKmitogen-activated protein kinase
MCDDmethionine-choline-deficient diet
NAFLDnon-alcoholic fatty liver disease
NASHnon-alcoholic hepatitis
P38mitogen-activated protein kinase 14
PATperilipin, adipophilin, and TIP47
PLIN5perilipin 5
PNPLA2/ATGLpatatin like phospholipase domain containing 2
ROSreactive oxygen species
SODsuperoxide dismutase

References

  1. Anderson, N.; Borlak, J. Molecular Mechanisms and Therapeutic Targets in Steatosis and Steatohepatitis. Pharmacol. Rev. 2008, 60, 311–357. [Google Scholar] [CrossRef] [PubMed] [Green Version]
  2. Malaguarnera, M.; Di, R.M.; Nicoletti, F.; Malaguarnera, L. Molecular mechanisms involved in NAFLD progression. J. Mol. Med. 2009, 87, 679. [Google Scholar] [CrossRef] [PubMed]
  3. Wierzbicki, A.S.; Oben, J. Nonalcoholic fatty liver disease and lipids. Curr. Opin. Lipidol. 2012, 23, 345. [Google Scholar] [CrossRef] [PubMed]
  4. Videla, L.A.; Rodrigo, R.; Orellana, M.; Fernandez, V.; Tapia, G.; Quiñones, L.; Varela, N.; Contreras, J.; Lazarte, R.; Csendes, A. Oxidative stress-related parameters in the liver of non-alcoholic fatty liver disease patients. Clin. Sci. 2004, 106, 261. [Google Scholar] [CrossRef] [PubMed]
  5. Ashraf, N.U.; Sheikh, T.A. Endoplasmic reticulum stress and Oxidative stress in the pathogenesis of Non-alcoholic fatty liver disease. Free Radic. Res. 2015, 49, 1405–1418. [Google Scholar] [CrossRef] [PubMed]
  6. Ceni, E.; Mello, T.; Galli, A. Pathogenesis of alcoholic liver disease: Role of oxidative metabolism. World J. Gastroenterol. 2014, 20, 17756–17772. [Google Scholar] [CrossRef] [PubMed]
  7. Bailey, A.P.; Koster, G.; Guillermier, C.; Hirst, E.M.A.; MacRae, J.I.; Lechene, C.P.; Postle, A.D.; Gould, A.P. Antioxidant Role for Lipid Droplets in a Stem Cell Niche of Drosophila. Cell 2015, 163, 340–353. [Google Scholar] [CrossRef] [Green Version]
  8. Welte, M.A. How Brain Fat Conquers Stress. Cell 2015, 163, 269–270. [Google Scholar] [CrossRef] [Green Version]
  9. Valm, A.M.; Cohen, S.; Legant, W.R.; Melunis, J.; Hershberg, U.; Wait, E.; Cohen, A.R.; Davidson, M.W.; Betzig, E.; Lippincott-Schwartz, J. Applying systems-level spectral imaging and analysis to reveal the organelle interactome. Nature 2017, 546, 162–167. [Google Scholar] [CrossRef]
  10. Romanauska, A.; Kohler, A. The Inner Nuclear Membrane is a Metabolically Active Territory that Generates Nuclear Lipid Droplets. Cell 2018, 174, 700–715. [Google Scholar] [CrossRef]
  11. Soltysik, K.; Ohsaki, Y.; Tatematsu, T.; Cheng, J.L.; Fujimoto, T. Nuclear lipid droplets derive from a lipoprotein precursor and regulate phosphatidylcholine synthesis. Nat. Commun. 2019, 10, 473. [Google Scholar] [CrossRef] [PubMed]
  12. Jin, Y.; Tan, Y.; Chen, L.; Liu, Y.; Ren, Z. Reactive Oxygen Species Induces Lipid Droplet Accumulation in HepG2 Cells by Increasing Perilipin 2 Expression. Int. J. Mol. Sci. 2018, 19, 3445. [Google Scholar] [CrossRef] [PubMed]
  13. Dalen, K.T.; Dahl, T.; Holter, E.; Arntsen, B.; Londos, C.; Sztalryd, C.; Nebb, H.I. LSDP5 is a PAT protein specifically expressed in fatty acid oxidizing tissues. BBA-Mol. Cell Biol. Lipids 2007, 1771, 210–227. [Google Scholar] [CrossRef] [PubMed]
  14. Mason, R.R.; Watt, M.J. Unraveling the roles of PLIN5: Linking cell biology to physiology. Trends Endocrinol. Metab. 2015, 26, 144–152. [Google Scholar] [CrossRef] [PubMed]
  15. Wang, H.; Sztalryd, C. Oxidative tissue: Perilipin 5 links storage with the furnace. Trends Endocrinol. Metab. 2011, 22, 197–203. [Google Scholar] [CrossRef] [PubMed]
  16. Whytock, K.L.; Shepherd, S.O.; Wagenmakers, A.J.M.; Strauss, J.A. Hormone-sensitive lipase preferentially redistributes to lipid droplets associated with perilipin-5 in human skeletal muscle during moderate-intensity exercise. J. Physiol. 2018, 596, 2077–2090. [Google Scholar] [CrossRef] [PubMed] [Green Version]
  17. Langhi, C.; Marquart, T.J.; Allen, R.M.; Baldan, A. Perilipin-5 is regulated by statins and controls triglyceride contents in the hepatocyte. J. Hepatol. 2014, 61, 358–365. [Google Scholar] [CrossRef] [Green Version]
  18. Harris, L.A.; Skinner, J.R.; Shew, T.M.; Pietka, T.A.; Abumrad, N.A.; Wolins, N.E. Perilipin 5-Driven Lipid Droplet Accumulation in Skeletal Muscle Stimulates the Expression of Fibroblast Growth Factor 21. Diabetes 2015, 64, 2757–2768. [Google Scholar] [CrossRef]
  19. Bosma, M.; Sparks, L.M.; Hooiveld, G.J.; Jorgensen, J.A.; Houten, S.M.; Schrauwen, P.; Kersten, S.; Hesselink, M.K.C. Overexpression of PLIN5 in skeletal muscle promotes oxidative gene expression and intramyocellular lipid content without compromising insulin sensitivity. BBA-Mol. Cell Biol. Lipids 2013, 1831, 844–852. [Google Scholar] [CrossRef]
  20. Bosma, M.; Minnaard, R.; Sparks, L.M.; Schaart, G.; Losen, M.; de Baets, M.H.; Duimel, H.; Kersten, S.; Bickel, P.E.; Schrauwen, P.; et al. The lipid droplet coat protein perilipin 5 also localizes to muscle mitochondria. Histochem. Cell Biol. 2012, 137, 205–216. [Google Scholar] [CrossRef]
  21. Wang, H.; Sreenevasan, U.; Hu, H.; Saladino, A.; Polster, B.M.; Lund, L.M.; Gong, D.W.; Stanley, W.C.; Sztalryd, C. Perilipin 5, a lipid droplet-associated protein, provides physical and metabolic linkage to mitochondria. J. Lipid Res. 2011, 52, 2159–2168. [Google Scholar] [CrossRef] [PubMed] [Green Version]
  22. Benador, I.Y.; Veliova, M.; Mahdaviani, K.; Petcherski, A.; Wikstrom, J.D.; Assali, E.A.; Acin-Perez, R.; Shum, M.; Oliveira, M.F.; Cinti, S.; et al. Mitochondria Bound to Lipid Droplets Have Unique Bioenergetics, Composition, and Dynamics that Support Lipid Droplet Expansion. Cell Metab. 2018, 27, 869–885. [Google Scholar] [CrossRef]
  23. Nguyen, T.B.; Louie, S.M.; Daniele, J.R.; Tran, Q.; Dillin, A.; Zoncu, R.; Nomura, D.K.; Olzmann, J.A. DGAT1-Dependent Lipid Droplet Biogenesis Protects Mitochondrial Function during Starvation-Induced Autophagy. Dev. Cell 2017, 42, 9–21.e5. [Google Scholar] [CrossRef] [PubMed] [Green Version]
  24. Rambold, A.S.; Cohen, S.; Lippincott-Schwartz, J. Fatty acid trafficking in starved cells: Regulation by lipid droplet lipolysis, autophagy, and mitochondrial fusion dynamics. Dev. Cell 2015, 32, 678–692. [Google Scholar] [CrossRef] [PubMed]
  25. Herms, A.; Bosch, M.; Ariotti, N.; Reddy, B.J.N.; Fajardo, A.; Fernandez-Vidal, A.; Alvarez-Guaita, A.; Fernandez-Rojo, M.A.; Rentero, C.; Tebar, F.; et al. Cell-to-Cell Heterogeneity in Lipid Droplets Suggests a Mechanism to Reduce Lipotoxicity. Curr. Biol. 2013, 23, 1489–1496. [Google Scholar] [CrossRef] [PubMed] [Green Version]
  26. Bischof, J.; Salzmann, M.; Streubel, M.K.; Hasek, J.; Geltinger, F.; Duschl, J.; Bresgen, N.; Briza, P.; Haskova, D.; Lejskovas, R.; et al. Clearing the outer mitochondrial membrane from harmful proteins via lipid droplets. Cell Death Discov. 2017, 3, 17016. [Google Scholar] [CrossRef] [PubMed]
  27. Kimmel, A.R.; Sztalryd, C. Perilipin 5, a lipid droplet protein adapted to mitochondrial energy utilization. Curr. Opin. Lipidol. 2014, 25, 110–117. [Google Scholar] [CrossRef] [PubMed] [Green Version]
  28. Turrens, J.F. Mitochondrial formation of reactive oxygen species. J. Physiol. 2003, 552, 335–344. [Google Scholar] [CrossRef] [PubMed]
  29. Forman, H.J.; Kennedy, J.A. Role of Superoxide Radical in Mitochondrial Dehydrogenase Reactions. Biochem. Biophys. Res. Commun. 1974, 60, 1044–1050. [Google Scholar] [CrossRef]
  30. Loschen, G.; Azzi, A.; Richter, C.; Flohe, L. Superoxide Radicals as Precursors of Mitochondrial Hydrogen-Peroxide. FEBS Lett. 1974, 42, 68–72. [Google Scholar] [CrossRef]
  31. Bogoyevitch, M.A.; Ngoei, K.R.; Zhao, T.T.; Yeap, Y.Y.; Ng, D.C. c-Jun N-terminal kinase (JNK) signaling: Recent advances and challenges. Biochim. Biophys. Acta 2010, 1804, 463–475. [Google Scholar] [CrossRef] [PubMed]
  32. Chen, F. JNK-induced apoptosis, compensatory growth, and cancer stem cells. Cancer Res. 2012, 72, 379–386. [Google Scholar] [CrossRef] [PubMed]
  33. Coulthard, L.R.; White, D.E.; Jones, D.L.; McDermott, M.F.; Burchill, S.A. p38(MAPK): Stress responses from molecular mechanisms to therapeutics. Trends Mol. Med. 2009, 15, 369–379. [Google Scholar] [CrossRef] [PubMed]
  34. Cuadrado, A.; Nebreda, A.R. Mechanisms and functions of p38 MAPK signalling. Biochem. J. 2010, 429, 403–417. [Google Scholar] [CrossRef] [PubMed] [Green Version]
  35. Welte, M.A. Expanding Roles for Lipid Droplets. Curr. Biol. 2015, 25, R470–R481. [Google Scholar] [CrossRef] [PubMed] [Green Version]
  36. Cao, S.S.; Kaufman, R.J. Targeting endoplasmic reticulum stress in metabolic disease. Expert Opin. Ther. Targets 2013, 17, 437–448. [Google Scholar] [CrossRef]
  37. Olzmann, J.A.; Carvalho, P. Dynamics and functions of lipid droplets. Nat. Rev. Mol. Cell Biol. 2018. [Google Scholar] [CrossRef] [PubMed]
  38. Li, H.; Song, Y.; Zhang, L.J.; Gu, Y.; Li, F.F.; Pan, S.Y.; Jiang, L.N.; Liu, F.; Ye, J.; Li, Q. LSDP5 enhances triglyceride storage in hepatocytes by influencing lipolysis and fatty acid beta-oxidation of lipid droplets. PLoS ONE 2012, 7, e36712. [Google Scholar] [CrossRef]
  39. Yuki, O.; Jinglei, C.; Michitaka, S.; Akikazu, F.; Toyoshi, F. Lipid droplets are arrested in the ER membrane by tight binding of lipidated apolipoprotein B-100. J. Cell Sci. 2008, 121, 2415–2422. [Google Scholar] [Green Version]
  40. Jacquier, N.; Choudhary, V.; Mari, M.; Toulmay, A.; Reggiori, F.; Schneiter, R. Lipid droplets are functionally connected to the endoplasmic reticulum in Saccharomyces cerevisiae. J. Cell Sci. 2011, 124, 2424–2437. [Google Scholar] [CrossRef]
  41. Alexandra, G.; Laura, B.; Gabriel, M.; Charlotta, F.; Fatima-Zahra, I.; Francesco, M.; Raul, G.; Júlia, M.; Eduard, S.; Pedro, C. The seipin complex Fld1/Ldb16 stabilizes ER-lipid droplet contact sites. J. Cell Biol. 2015, 211, 829–844. [Google Scholar]
  42. Wang, H.; Becuwe, M.; Housden, B.E.; Chitraju, C.; Porras, A.J.; Graham, M.M.; Liu, X.N.; Thiam, A.R.; Savage, D.B.; Agarwal, A.K. Seipin is required for converting nascent to mature lipid droplets. eLife 2016, 5, e16582. [Google Scholar] [CrossRef] [PubMed] [Green Version]
  43. Lindsay, J.; Esposti, M.D.; Gilmore, A.P. Bcl-2 proteins and mitochondria-Specificity in membrane targeting for death. BBA-Mol. Cell Res. 2011, 1813, 532–539. [Google Scholar] [CrossRef] [PubMed]
  44. Happo, L.; Strasser, A.; Cory, S. BH3-only proteins in apoptosis at a glance. J. Cell Sci. 2012, 125, 1081–1087. [Google Scholar] [CrossRef] [PubMed] [Green Version]
  45. Oltvai, Z.N.; Milliman, C.L.; Korsmeyer, S.J. Bcl-2 Heterodimerizes in-Vivo with a Conserved Homolog, Bax, That Accelerates Programmed Cell-Death. Cell 1993, 74, 609–619. [Google Scholar] [CrossRef]
  46. Westphal, D.; Dewson, G.; Czabotar, P.E.; Kluck, R.M. Molecular biology of Bax and Bak activation and action. BBA-Mol. Cell Res. 2011, 1813, 521–531. [Google Scholar] [CrossRef] [Green Version]
  47. Tobiume, K.; Matsuzawa, A.; Takahashi, T.; Nishitoh, H.; Morita, K.; Takeda, K.; Minowa, O.; Miyazono, K.; Noda, T.; Ichijo, H. ASK1 is required for sustained activations of JNK/p38 MAP kinases and apoptosis. EMBO Rep. 2001, 2, 222–228. [Google Scholar] [CrossRef]
  48. Sun, P.; Zeng, Q.; Cheng, D.; Zhang, K.; Zheng, J.; Liu, Y.; Yuan, Y.F.; Tang, Y.D. Caspase Recruitment Domain Protein 6 protects against hepatic steatosis and insulin resistance by suppressing Ask1. Hepatology 2018, 68, 2212–2229. [Google Scholar] [CrossRef]
  49. Ye, P.; Xiang, M.; Liao, H.; Liu, J.; Luo, H.; Wang, Y.; Huang, L.; Chen, M.; Xia, J. Dual-specificity Phosphatase 9 Protects Against Non-alcoholic Fatty Liver Disease in Mice via ASK1 Suppression. Hepatology 2018, 69, 76–93. [Google Scholar] [CrossRef]
  50. Lawan, A.; Zhang, L.; Gatzke, F.; Min, K.; Jurczak, M.J.; Al-Mutairi, M.; Richter, P.; Camporez, J.P.; Couvillon, A.; Pesta, D. Hepatic mitogen-activated protein kinase phosphatase 1 selectively regulates glucose metabolism and energy homeostasis. Mol. Cell. Biol. 2015, 35, 26. [Google Scholar] [CrossRef]
  51. Cingolani, F.; Czaja, M.J. Oxidized Albumin—A Trojan Horse for p38 MAPK-Mediated Inflammation in Decompensated Cirrhosis. Hepatology 2018, 68, 1678–1680. [Google Scholar] [CrossRef] [PubMed]
  52. Loomba, R.; Lawitz, E.; Mantry, P.S.; Jayakumar, S.; Caldwell, S.H.; Arnold, H.; Diehl, A.M.; Djedjos, C.S.; Han, L.; Myers, R.P.; et al. The ASK1 inhibitor selonsertib in patients with nonalcoholic steatohepatitis: A randomized, phase 2 trial. Hepatology 2018, 67, 549–559. [Google Scholar] [CrossRef] [PubMed]
  53. Nakagawa, H.; Umemura, A.; Taniguchi, K.; Font-Burgada, J.; Dhar, D.; Ogata, H.; Zhong, Z.Y.; Valasek, M.A.; Seki, E.; Hidalgo, J.; et al. ER Stress Cooperates with Hypernutrition to Trigger TNF-Dependent Spontaneous HCC Development. Cancer Cell 2014, 26, 331–343. [Google Scholar] [CrossRef] [PubMed] [Green Version]
  54. Ohki, T.; Tateishi, R.; Shiina, S.; Goto, E.; Sato, T.; Nakagawa, H.; Masuzaki, R.; Goto, T.; Hamamura, K.; Kanai, F.; et al. Visceral fat accumulation is an independent risk factor for hepatocellular carcinoma recurrence after curative treatment in patients with suspected NASH. Gut 2009, 58, 839–844. [Google Scholar] [CrossRef] [PubMed] [Green Version]
  55. Le, T.T.; Huff, T.B.; Cheng, J.X. Coherent anti-Stokes Raman scattering imaging of lipids in cancer metastasis. BMC Cancer 2009, 9, 42. [Google Scholar] [CrossRef] [PubMed]
  56. Ramos, C.V.; Taylor, H.B. Lipid-rich carcinoma of the breast. A clinicopathologic analysis of 13 examples. Cancer 1974, 33, 812–819. [Google Scholar] [CrossRef]
  57. de los Monteros, A.E.; Hellmen, E.; Ramirez, G.A.; Herraez, P.; Rodriguez, F.; Ordas, J.; Millán, Y.; Lara, A.; de las Mulas, J.M. Lipid-rich Carcinomas of the Mammary Gland in Seven Dogs: Clinicopathologic and Immunohistochemical Features. Vet. Pathol. 2003, 40, 718–723. [Google Scholar] [CrossRef] [PubMed] [Green Version]
  58. Lv, Y.; Jin, Y.; Zhou, Y.; Jin, J.; Ma, Z.; Ren, Z. Deep sequencing of transcriptome profiling of GSTM2 knock-down in swine testis cells. Sci. Rep. 2016, 6, 38254. [Google Scholar] [CrossRef] [Green Version]
  59. Tang, Z.; Li, C.; Kang, B.; Gao, G.; Li, C.; Zhang, Z. GEPIA: A web server for cancer and normal gene expression profiling and interactive analyses. Nucleic Acids Res. 2017, 45, W98–W102. [Google Scholar] [CrossRef]
Figure 1. Perilipin 5 (PLIN5) was up-regulated in liver tissues of non-alcoholic fatty liver disease (NAFLD) mice. (A) Six-week-old C57/bl male mice were fed with a high-fat diet (HFD) or chow diet (CD) for 10 weeks. The mRNA levels of PLIN5 in liver tissues of mice fed with chow diet (CD) and HFD were detected by qRT-PCR. (B) The protein levels of PLIN5 in liver tissues of mice fed with chow diet (CD) and HFD were detected by Western Blot. (C) Six-week-old C57/bl male mice were fed with methionine-choline-deficient diet (MCDD) for 1 week, 2 weeks, 3 weeks, 4 weeks, 6 weeks, and 8 weeks, respectively. The mRNA levels of PLIN5 were detected by qRT-PCR. (D) The protein levels of PLIN5 were detected by Western Blot. (E) Immunohistochemistry analysis of liver tissues of mice fed with MCDD (1–8 weeks) and control mice (0 week). Scale bar, 20 μm. These experiments were performed in triplicate. * p < 0.05; and ** p < 0.01.
Cells 08 01241 g001
Figure 2. Hydrogen peroxide or lipopolysaccharide (LPS) treatment enhanced the expression of PLIN5. Hydrogen peroxide and LPS were used to induce cellular oxidative stress. (A) mRNA level of PLIN5 in cells with H2O2 treatment or control (phosphate buffer saline, PBS). (B) Western Blot analysis of PLIN5 protein levels in cells with H2O2 treatment or control (PBS). (C) mRNA level of PLIN5 in cells with LPS treatment or control (PBS). (D) Western Blot analysis of PLIN5 protein levels in cells with LPS treatment or control (PBS). (E) H2O2 treatment did not change the localization of PLIN5. PLIN5 localization analysis of cells with 400 μM oleic acid medium or H2O2 treatment. Green, PLIN5-EGFP; red, lipid droplets; blue, nucleus. Bar, 10 μm. These experiments were performed in triplicate. * p < 0.05; and ** p < 0.01.
Cells 08 01241 g002
Figure 3. PLIN5 regulated cellular reactive oxygen species (ROS) levels. (A,B) Western blot validation of PLIN5 overexpression (A) and RNAi (B) efficiency. (C) HepG2 cells were transfected with PLIN5 siRNAs or negative control siRNAs or PLIN5 expression vector or pcDNA3.1 (control) vector, respectively. Then, the cellular ROS levels were detected by DCFH-DA probes through a microplate reader (Ex = 488 nm, Em = 525 nm). (D) The cells were transfected with PLIN5 siRNAs or negative control siRNAs or PLIN5 expression vector or pcDNA3.1 (control) vector, respectively, and then treated with 200 μM H2O2. Then, the cellular ROS levels were detected by DCFH-DA probes through a microplate reader (Ex = 488 nm, Em = 525 nm). (E) HepG2 cells were transfected with PLIN5 siRNAs or negative control siRNAs or PLIN5 expression vector or pcDNA3.1 (control) vector, respectively. Then, the cellular ROS levels were detected by DHE through a microplate reader (Ex = 535 nm, Em = 610 nm). (F) The cells were transfected with PLIN5 siRNAs or negative control siRNAs or PLIN5 expression vector or pcDNA3.1 (control) vector, respectively, and then treated with 200 μM H2O2. Then, the cellular ROS levels were detected by DCFH-DA probes through a microplate reader (Ex = 488 nm, Em = 525 nm). (G) The cells were treated with 200 μM H2O2. The cytoplasm and mitochondria were isolated respectively, and then cytosolic and mitochondrial cytochrome c levels were detected respectively through Western Blot. (H) The cells were transfected with PLIN5 expression vector or pcDNA3.1 (control) vector, and then treated with 200 μM H2O2. The cytoplasm and mitochondria were isolated, and then cytosolic and mitochondrial cytochrome c levels were detected respectively through Western Blot. GAPDH was the reference protein of cytosolic component and the Porin/VDAC1 was the reference protein of mitochondrial component. (I) The mitochondrial membrane potential (MMP) was detected by JC-1 probes using the flow cytometry method. These experiments were performed in triplicate. * p < 0.05. Ex, excitation wavelength; Em, emission wavelength.
Cells 08 01241 g003
Figure 4. PLIN5 promoted LD formation and contact with mitochondria. (A) HepG2 cells were transfected with PLIN5 expression vector or pcDNA3.1 (control) vector. Then, the cellular lipid droplets were stained with BODIPY493/503 and observed by a confocal microscope. (B) The counts of cellular LDs in A. (C) HepG2 cells were transfected with PLIN5 siRNAs or negative control siRNAs. Then, the cellular lipid droplets were stained with BODIPY493/503 and observed by a confocal microscope. (D) The counts of cellular LDs in C. (E) HepG2 cells were transfected with the mito-Dsred vector and PLIN5 expression vector or pcDNA3.1 (control) vector. Then, the cellular lipid droplets were stained with BODIPY493/503 and observed by a confocal microscope. (F) HepG2 cells were transfected with mito-Dsred vector and PLIN5 siRNAs or negative control siRNAs. Then, the cellular lipid droplets were stained with BODIPY493/503 and observed by a confocal microscope. (G) HepG2 cells were transfected with mito-Dsred vector and then treated with 200 μM H2O2. Then, the cellular lipid droplets were stained with BODIPY493/503 and observed by a confocal microscope. The fluorescence intensity along with the dotted line was performed to illustrate the contacts between LDs and mitochondria. (H) The ratio of contacts between LDs and mitochondria was analyzed. These experiments were performed in triplicate. *** p < 0.0001.
Cells 08 01241 g004
Figure 5. PLIN5 regulated the expression levels of mitochondrial function-related genes and apoptosis rate. (A) mRNA levels of COX2, COX4, and CS in cells transfected with PLIN5 expression vector or control vector. (B) mRNA levels of COX2, COX4, and CS in cells transfected with PLIN5 siRNAs or control siRNAs. (C) mRNA levels of GPX1, GPX2, SOD1, SOD2, TXNRD1, CAT, and PRDX3 in cells transfected with PLIN5 expression vector or control vector. (D) mRNA levels of GPX1, GPX2, SOD1, SOD2, TXNRD1, CAT, and PRDX3 in cells transfected with PLIN5 siRNAs or control siRNAs. (E) Apoptosis rate of cells transfected with PLIN5 expression vector or control vector. (F) Cells transfected with PLIN5 expression vector or control vector were treated with 200 μM H2O2 for 12 h. Then, the apoptosis rate was analyzed. These experiments were performed in triplicate. GAPDH was used as the reference gene. * p < 0.05; and ** p < 0.01.
Cells 08 01241 g005
Figure 6. The expression of PLIN5 was regulated by the JNK-p38-ATF pathway. (A) Protein levels of ATF1, ATF4, p-p38, p38, p-JNK, and JNK were detected by Western Blot. (B) The gray value analysis of A. (C) mRNA levels of ATF1, ATF3, and ATF4 in cells with 200 μM H2O2 treatment were detected by qPCR. (D) The cells were transfected with ATF1 expression vector or pcDNA3.1 vector. The protein levels of ATF1 and PLIN5 were detected through Western Blot. (E) The cells were transfected with ATF4 expression vector or pcDNA3.1 vector. The protein levels of ATF4 and PLIN5 were detected through Western Blot. (F) The effects of ATFs’ expression on PLIN5 transcriptional activity were detected by dual-luciferase reporter assay. (G) Protein levels of p-ASK1, Ask1, p-p38, p38, p-JNK, JNK, and PLIN5 were detected by Western Blot. (H) The gray value analysis of G. GAPDH was used as the reference protein. These experiments were performed in triplicate. * p < 0.05; ** p < 0.01; and n. s., not significant.
Cells 08 01241 g006
Figure 7. Low expression of PLIN5 is associated with poor prognosis. Gene expression analysis and survival analysis were performed using the GEPIA database (http://gepia.cancer-pku.cn/). (A) Gene expression analysis of PLIN5 by cancer type. The lower pattern is the histogram illustration of the upper pattern. (B) The expression levels of PLIN5 in samples with LIHC, OV, PAAD, STAD, and corresponding controls, respectively. (C) Survival analysis of PLIN5 in LIHCtumor samples. (D) Survival analysis of PLIN5 in different kinds of tumor samples including ACC, BLCA, BRCA, CESC, CHOL, COAD, DLBC, ESCA, GBM, HNSC, KICH, KIRC, KIRP, LAML, LGG, LICH, LUAD, LUSC, OV, PPAD, READ, SARC, SKCM, STAD, TGCT, THCA, THYM, UCEC and UCS; E, CESC, DLBC, HNSC, LIHC, LUSC, PPAD and THYM; F, ACC, BLCA, BRCA, CESC, CHOL, COAD, DLBC, ESCA, GBM, HNSC, KICH, KIRC, KIRP, LAML, LGG, LICH, LUAD, LUSC, OV, PPAD, READ, SARC, SKCM, STAD, TGCT, THCA, THYM, UCEC, and UCS. The extension of tumor abbreviations can be referred to in the GEPIA database. * p < 0.05.
Cells 08 01241 g007
Figure 8. Diagrammatic sketch of this study. PLIN5 was up-regulated by cellular stress induced by H2O2 or LPS treatment. Then, the increased PLIN5 levels promoted cellular LD formation and expansion, expression levels of COXs and LDs contacting with mitochondria. Subsequently, LD formation and expansion reduced the levels of cellular fatty acids, which promoted the alleviation of stress. COXs’ up-regulation reduced the release of cytochrome c from mitochondria to cytoplasm and reduced the mitochondrial damage. The contacts between LDs and mitochondria helped the transfer of potential harmful proteins from mitochondria to LDs. Therefore, cellular stress was alleviated.
Cells 08 01241 g008
Table 1. Primer used for SYBR Green I qRT-PCR validation.
Gene SymbolPrimer Sequence 5′-3′
PLIN5 (Perilipin 5)Forward: AAGGCCCTGAAGTGGGTTC
Reverse: GCATGTGGTCTATCAGCTCCA
CSForward: GCTCCTGTTTCCATGGGTCA
Reverse: TGCCAAAGCATGTCCAGCTA
COX2Forward: GCTGTCCCCACATTAGGCTT
Reverse: ACCGTAGTATACCCCCGGTC
COX4Forward: CCCGGCATTTTACGACGTTC
Reverse: AAAAATGTACACCTGCCGCC
ATF1Forward: TTCGGATCTACCTGGGAGGG
Reverse: CTGATAAAGATGATACCTGTTGAGC
ATF3Forward: GACCAACCATGCCTTGAGGA
Reverse: GGATGGCAAACCTCAGCTCT
ATF4Forward: TAAGCCATGGCGTGAGTACC
Reverse: GCGCTCGTTAAATCGCTTCC
GAPDHForward: CTGGGCTACACTGAGCACC
Reverse: AAGTGGTCGTTGAGGGCAATG
CATForward: TGGGATCTCGTTGGAAATAACAC
Reverse: TCAGGACGTAGGCTCCAGAAG
GPX1Forward: CAGTCGGTGTATGCCTTCTCG
Reverse: GAGGGACGCCACATTCTCG
GPX2Forward: GAATGGGCAGAACGAGCATC
Reverse: CCGGCCCTATGAGGAACTTC
SOD1Forward: GGTGGGCCAAAGGATGAAGAG
Reverse: CCACAAGCCAAACGACTTCC
SOD2Forward: TTTCAATAAGGAACGGGGACAC
Reverse: GTGCTCCCACACATCAATCC
TXNRD1Forward: ATGGGCAATTTATTGGTCCTCAC
Reverse: CCCAAGTAACGTGGTCTTTCAC
PRDX3Forward: ACTGTGAAGTTGTCGCAGTCT
Reverse: CACACCGTAGTCTCGGGAAA

