Article

Effects of Obeticholic Acid Treatment on Primary Human Hepatocytes in a Novel Tri-Culture Model System

by
Justin J. Odanga
1,
Sharon M. Anderson
1,
Edward L. LeCluyse
2,
Sharon C. Presnell
1,
Jingsong Chen
1 and
Jessica R. Weaver
1,*
1
Institute of Regenerative Medicine, LifeNet Health, VA Beach, VA 23453, USA
2
Research and Development, LifeNet Health, Research Triangle Park, NC 27709, USA
*
Author to whom correspondence should be addressed.
Cells 2025, 14(13), 968; https://doi.org/10.3390/cells14130968
Submission received: 27 April 2025 / Revised: 21 June 2025 / Accepted: 22 June 2025 / Published: 24 June 2025

Abstract

Metabolic dysfunction-associated fatty liver disease (MAFLD) is a growing health concern worldwide. Human cell-based in vitro culture models that retain disease-relevant phenotypic pathways and responses to assess the efficacy and liability of new therapeutics are needed. Obeticholic Acid (OCA), a Farnesoid X Receptor agonist, has been identified for MAFLD treatment, and clinically shown to have anti-inflammatory and anti-fibrotic effects. In this study, healthy and disease-origin primary human hepatocytes (PHHs) were cultured in TruVivo®, an all-human hepatic system for 14 days and treated with OCA to determine its’ effects on lipogenic, inflammatory, and fibrogenic pathways. Decreases in lipogenesis and triglyceride levels were measured in OCA treated healthy and diseased PHHs. Significant decreases in CYP3A4 activity and gene expression were quantified. Macrophage marker expression, pro-inflammatory cytokines and fibrotic markers were lowered in OCA treated diseased PHHs. CYP7A1 gene expression decreased, while BSEP gene expression increased in OCA treated healthy and diseased PHHs. Overall, OCA treatment reduced lipogenic, inflammatory, and fibrogenic markers in diseased PHHs. Differences in the potency and efficacy of OCA against different disease-relevant pathways were observed in healthy and diseased PHHs indicating divergence of key regulatory mechanisms between healthy versus diseased phenotypes.

1. Introduction

Metabolic dysfunction-associated fatty liver disease (MAFLD) leading to metabolic dysfunction-associated steatohepatitis (MASH) and cirrhosis is a major health concern with greater than 25% of the general population being affected [1,2]. The severity of liver disease can range from steatosis, MASH, cirrhosis, and ultimately hepatocellular carcinoma [3]. Development of human cell-based in vitro models exhibiting hallmark features and biochemical pathways of disease progression and regression would greatly aid the identification and validation of effective therapeutics for disease treatment. Other key features, including maintenance of a diseased morphology and retention of phenotypic characteristics, such as lipid accumulation and inflammatory and fibrogenic response mechanisms, in a standard convenient culture format over extended culture periods would be of immense value to the biomedical research community. An all-human cell-based in vitro hepatic system known as TruVivo® has been shown to maintain stable albumin and urea production, and Cytochrome P450 (CYP) 3A4 activity for at least two weeks [4,5]. Primary human hepatocytes (PHHs) derived from diseased livers have been used to develop a counterpart diseased system that sustains certain features of a fatty liver disease phenotype, including in vivo-like shifts in hepatocyte functionality, significant basal lipid accumulation, and increased pro-inflammatory cytokine production making it a promising platform for studying differences between PHHs from healthy versus diseased liver tissues [6].
There are numerous different pathways of liver disease that are being considered as drug targets [7,8]. One target being explored is the Farnesoid X Receptor (FXR), a nuclear transcription factor that is activated by bile acids (BAs) [9]. FXR regulates BA synthesis, transport, and reabsorption through its effect on cholesterol 7-α-hydroxylase (CYP7A1), sodium taurocholate co-transporting polypeptide (NTCP), and bile salt export pump (BSEP) [10,11,12]. CYP7A1 is the first and rate-limiting enzyme in the classical BA synthesis pathway [13]. BSEP excretes BAs from PHHs into the biliary system, while NTCP transports BAs from the sinusoidal blood into the hepatocytes [14,15]. FXR plays a critical role in modulating glucose and lipid activity in the liver. Upon BA binding to the FXR, circulating triglycerides and gluconeogenesis from hepatocytes are reduced and downregulated, respectively [16,17].
Obeticholic Acid (OCA) is a small molecule that targets FXR and serves as an agonist with a potency 100 times higher than endogenous BAs [18,19]. OCA has been proposed for use to treat patients with primary biliary cholangitis (PBC), an autoimmune disease that attacks the liver bile ducts [20,21]. OCA was shown to have anti-inflammatory and anti-fibrotic effects by targeting liver sinusoidal endothelial cells (LSECs), kupffer cells (KCs), and stellate cells (SCs) [22]. In addition, OCA has been tested in clinical trials for treatment of liver disease including steatosis, inflammation, and fibrosis [19,23,24,25]. It has been shown to have effects on glucose metabolism and insulin sensitivity [26]. Although OCA has been shown to have these effects, the Food and Drug Administration has yet to fully approve it for treatment of PBC due to the potential of increasing the risk of liver injury in PBC patients with advanced cirrhosis, which resulted in contraindication for prescribing OCA [27]. Furthermore, an increased risk of serious liver injury has been observed in PBC patients without cirrhosis who were not at risk of advanced liver disease. Currently, OCA is being monitored for efficacy and safety [28]. Under these circumstances, it is of critical importance to understand how OCA treatment can affect a specific patient population with varying disease phenotypes in preclinical models, such as TruVivo, ideally before advancing to clinical trials.
The current study uses TruVivo® to determine the effects of OCA on lipogenesis, inflammation, and fibrosis in PHHs from healthy and diseased liver tissues. The aim of this study was to investigate how OCA treatment affects both healthy hepatocytes and hepatocytes in varying disease states. The effect of OCA on hepatocyte functions such as albumin, urea, and CYP450 3A4 activity was measured. In addition, expression of the target genes of FXR, including NTCP, BSEP, and CYP7A1, were examined in healthy and diseased PHHs when treated with OCA. Overall, OCA decreased lipid accumulation in healthy and diseased PHHs. Expression of inflammatory and fibrotic markers was lowered in OCA treated diseased PHHs. However, hepatic function was decreased. An increase in BSEP gene expression and a decrease in CYP7A1 gene expression with OCA treatment was seen in healthy and diseased PHHs. In conclusion, TruVivo® with either healthy or diseased PHHs showed differences in response to OCA allowing for a better understanding of potential heterogeneity in hepatocellular responses that can better mimic the in vivo hepatic microenvironments and phenotypes in liver disease patients.

2. Materials and Methods

2.1. TruVivo® and OCA Treatment

The approved methods were performed according to the guidelines and regulations of LifeNet Health’s ethics committee. LifeNet Health obtained informed consent for research purposes for all donor tissue. Using the standard NASH (Nonalcoholic steatohepatitis) CRN Scoring system, the liver tissue was histologically assessed by a board-certified liver pathologist to identify the PHHs as healthy or diseased [29]. Tissues with a NAFLD (Nonalcoholic Fatty Liver Disease) Activity Score of ≥4 were identified as “Diseased” and those with a NAFLD Activity Score of ≤1 were identified as “Healthy” (Table 1).
As referenced before, TruVivo® media and cell types were utilized with expected hepatic functional performance [5]. Briefly, PHHs from either healthy or diseased liver tissues were cultured in a 24-well plate under identical conditions for the initial 7 days. Treatment with OCA (0.5 μM) (AdipoGen Life Sciences, San Diego, CA, USA) was initiated on culture day 7 and continued to culture day 14 with daily medium changes [30,31,32]. Due to the heterogeneity in donor lots, there is a possibility of the presence of additional cell types, such as macrophages.

2.2. Morphological Assessment and PHH Attachment

Zeiss Observer.Z1 fluorescent microscope (Zeiss, Dublin, CA, USA) and a BX41 microscope (Olympus, Tokyo, Japan) were used to image the cells on the designated days. PHH attachment was determined by the previously described method [5]. Total number of images taken for each condition and time point are stated in the figure legends.

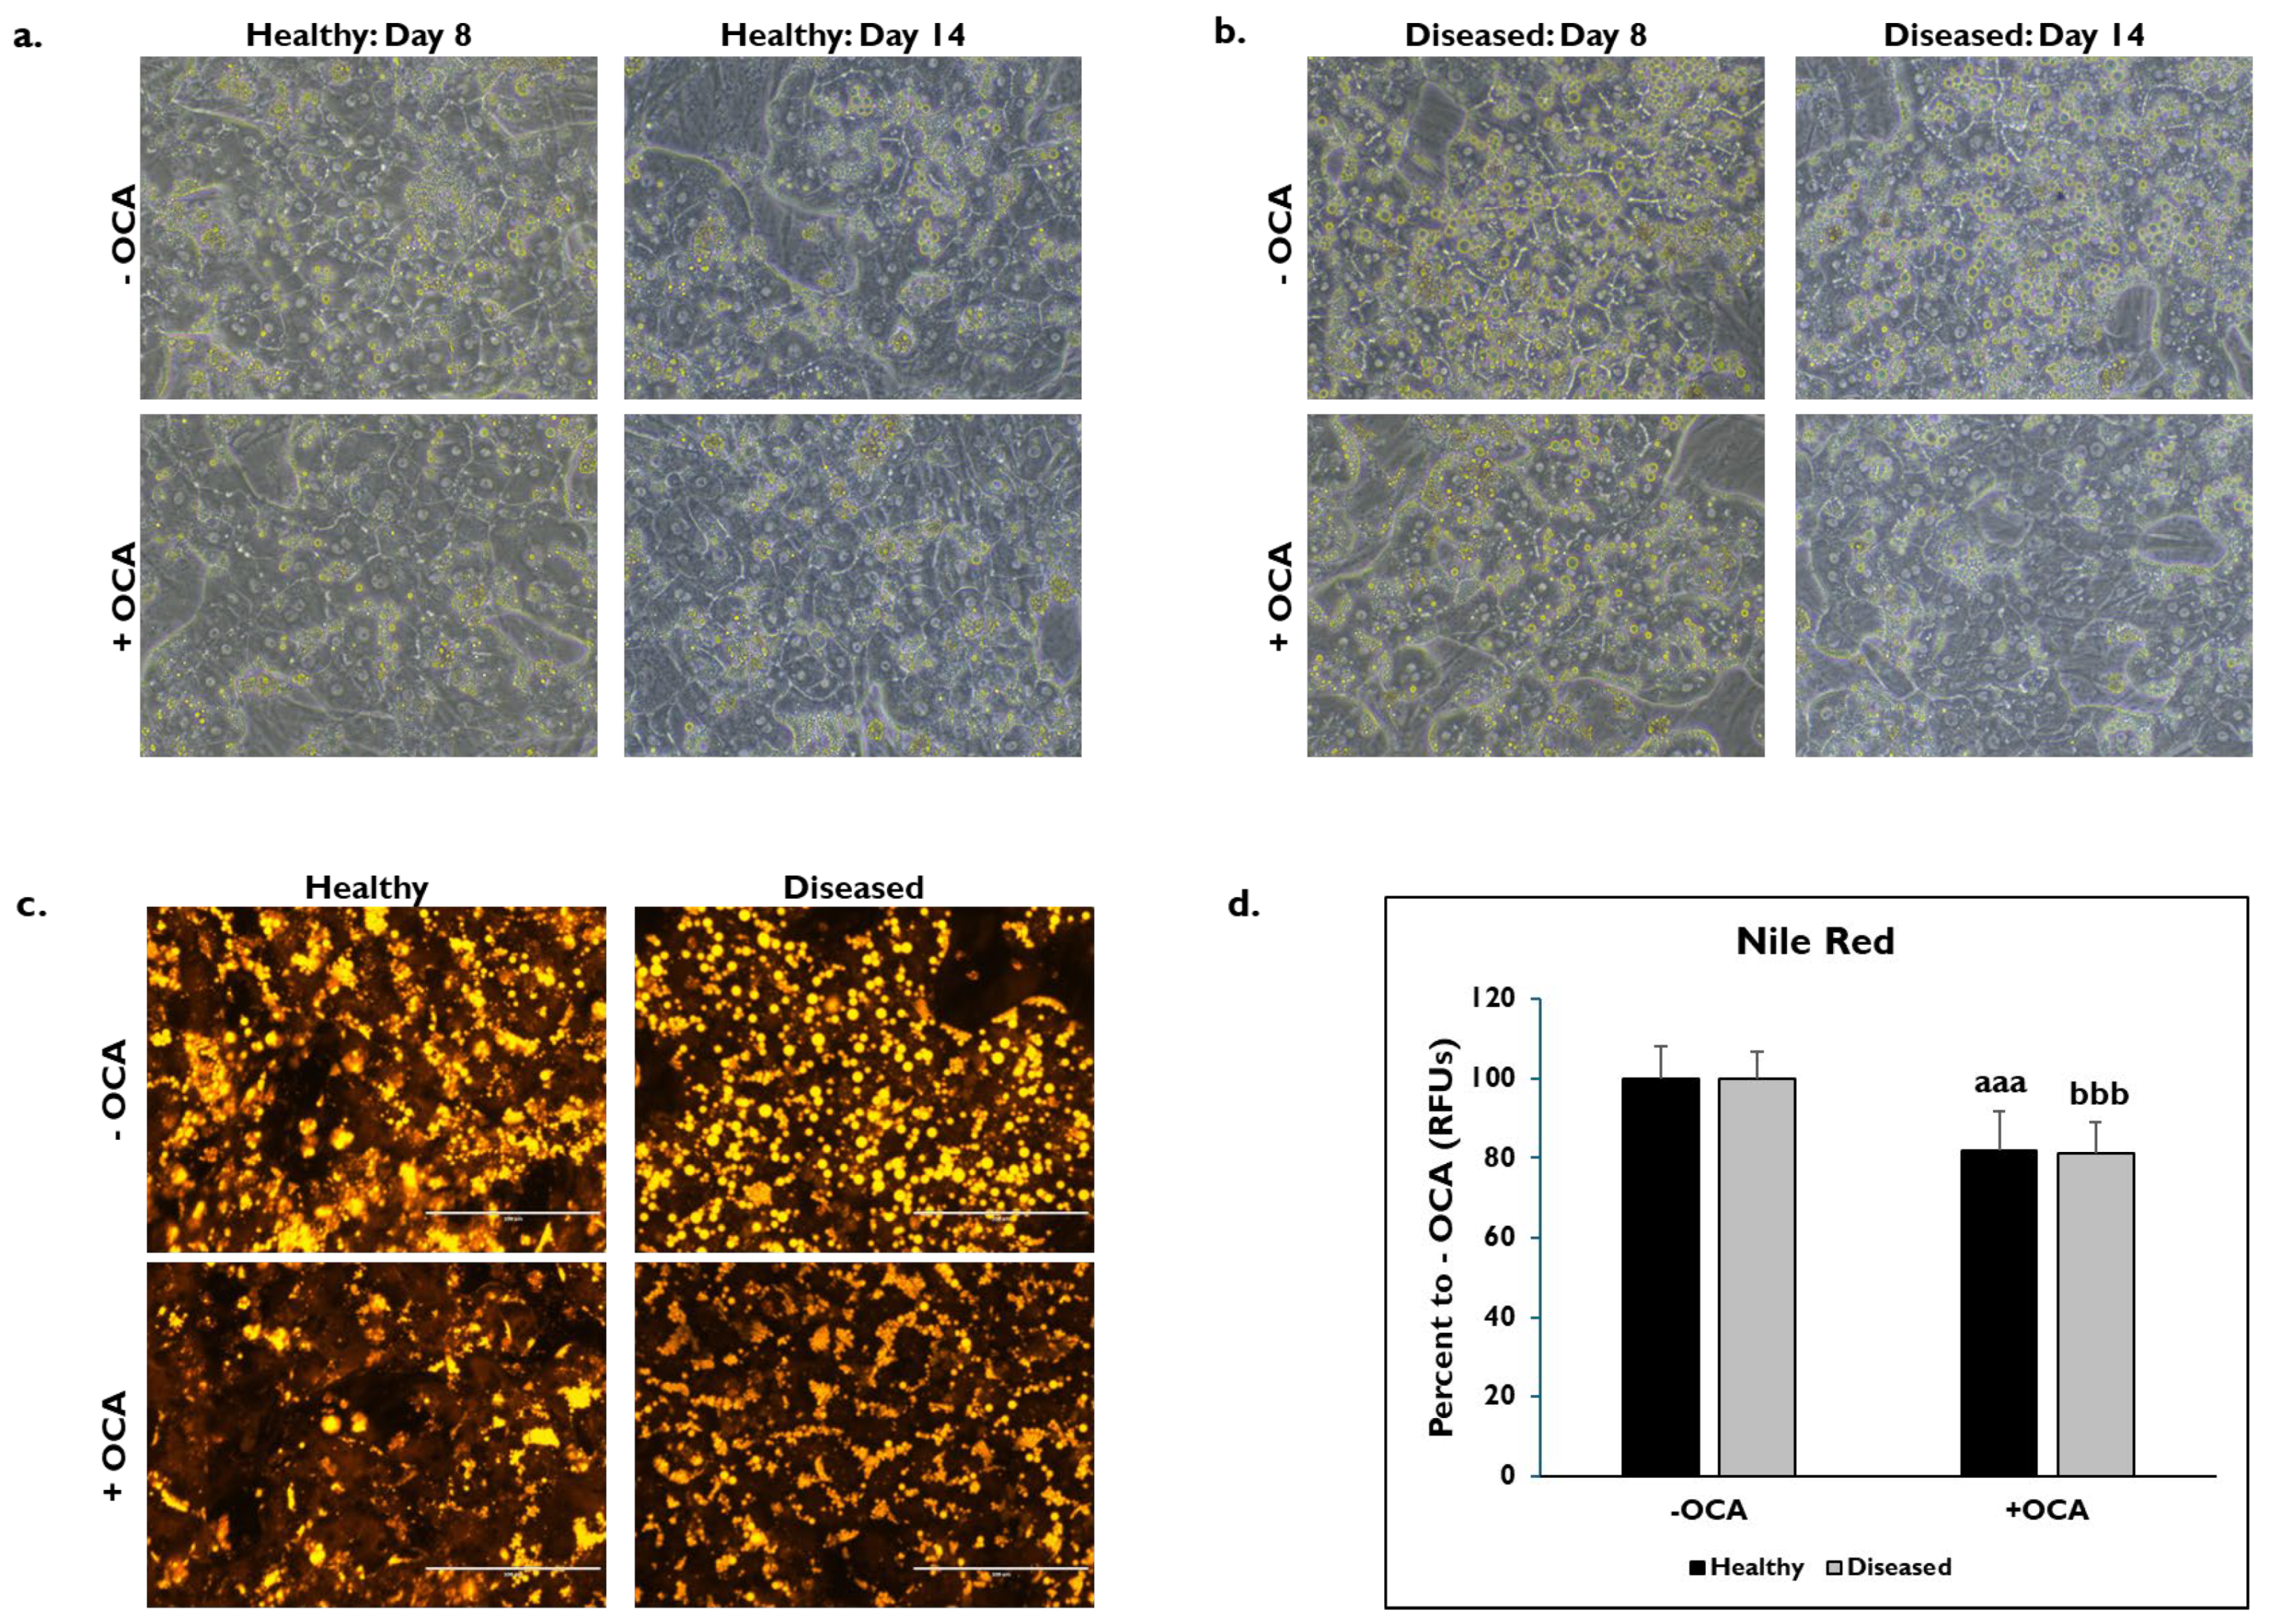
2.3. Nile Red Staining

After washing the cells three times with 1X Dulbecco’s PBS (DPBS) (-Ca++/-Mg++) (Thermo Fisher, Waltham, MA, USA), Nile Red (Abcam, Cambridge, MA, USA) was added (1:500 dilution) on culture day 14. After 15 min at 37 °C, the cells were washed twice with 1X DPBS (-Ca++/-Mg++). An EVOS FL cell imaging system (Thermo Fisher) on the 20× objective was used to capture images. Total number of images taken for each condition and time point are stated in the figure legends. Quantification of Nile Red fluorescence was done by determining the densitometric fluorescence value (red channel) using ImageJ (version 1.52a). The values were normalized to the determined number of attached PHHs as described above.

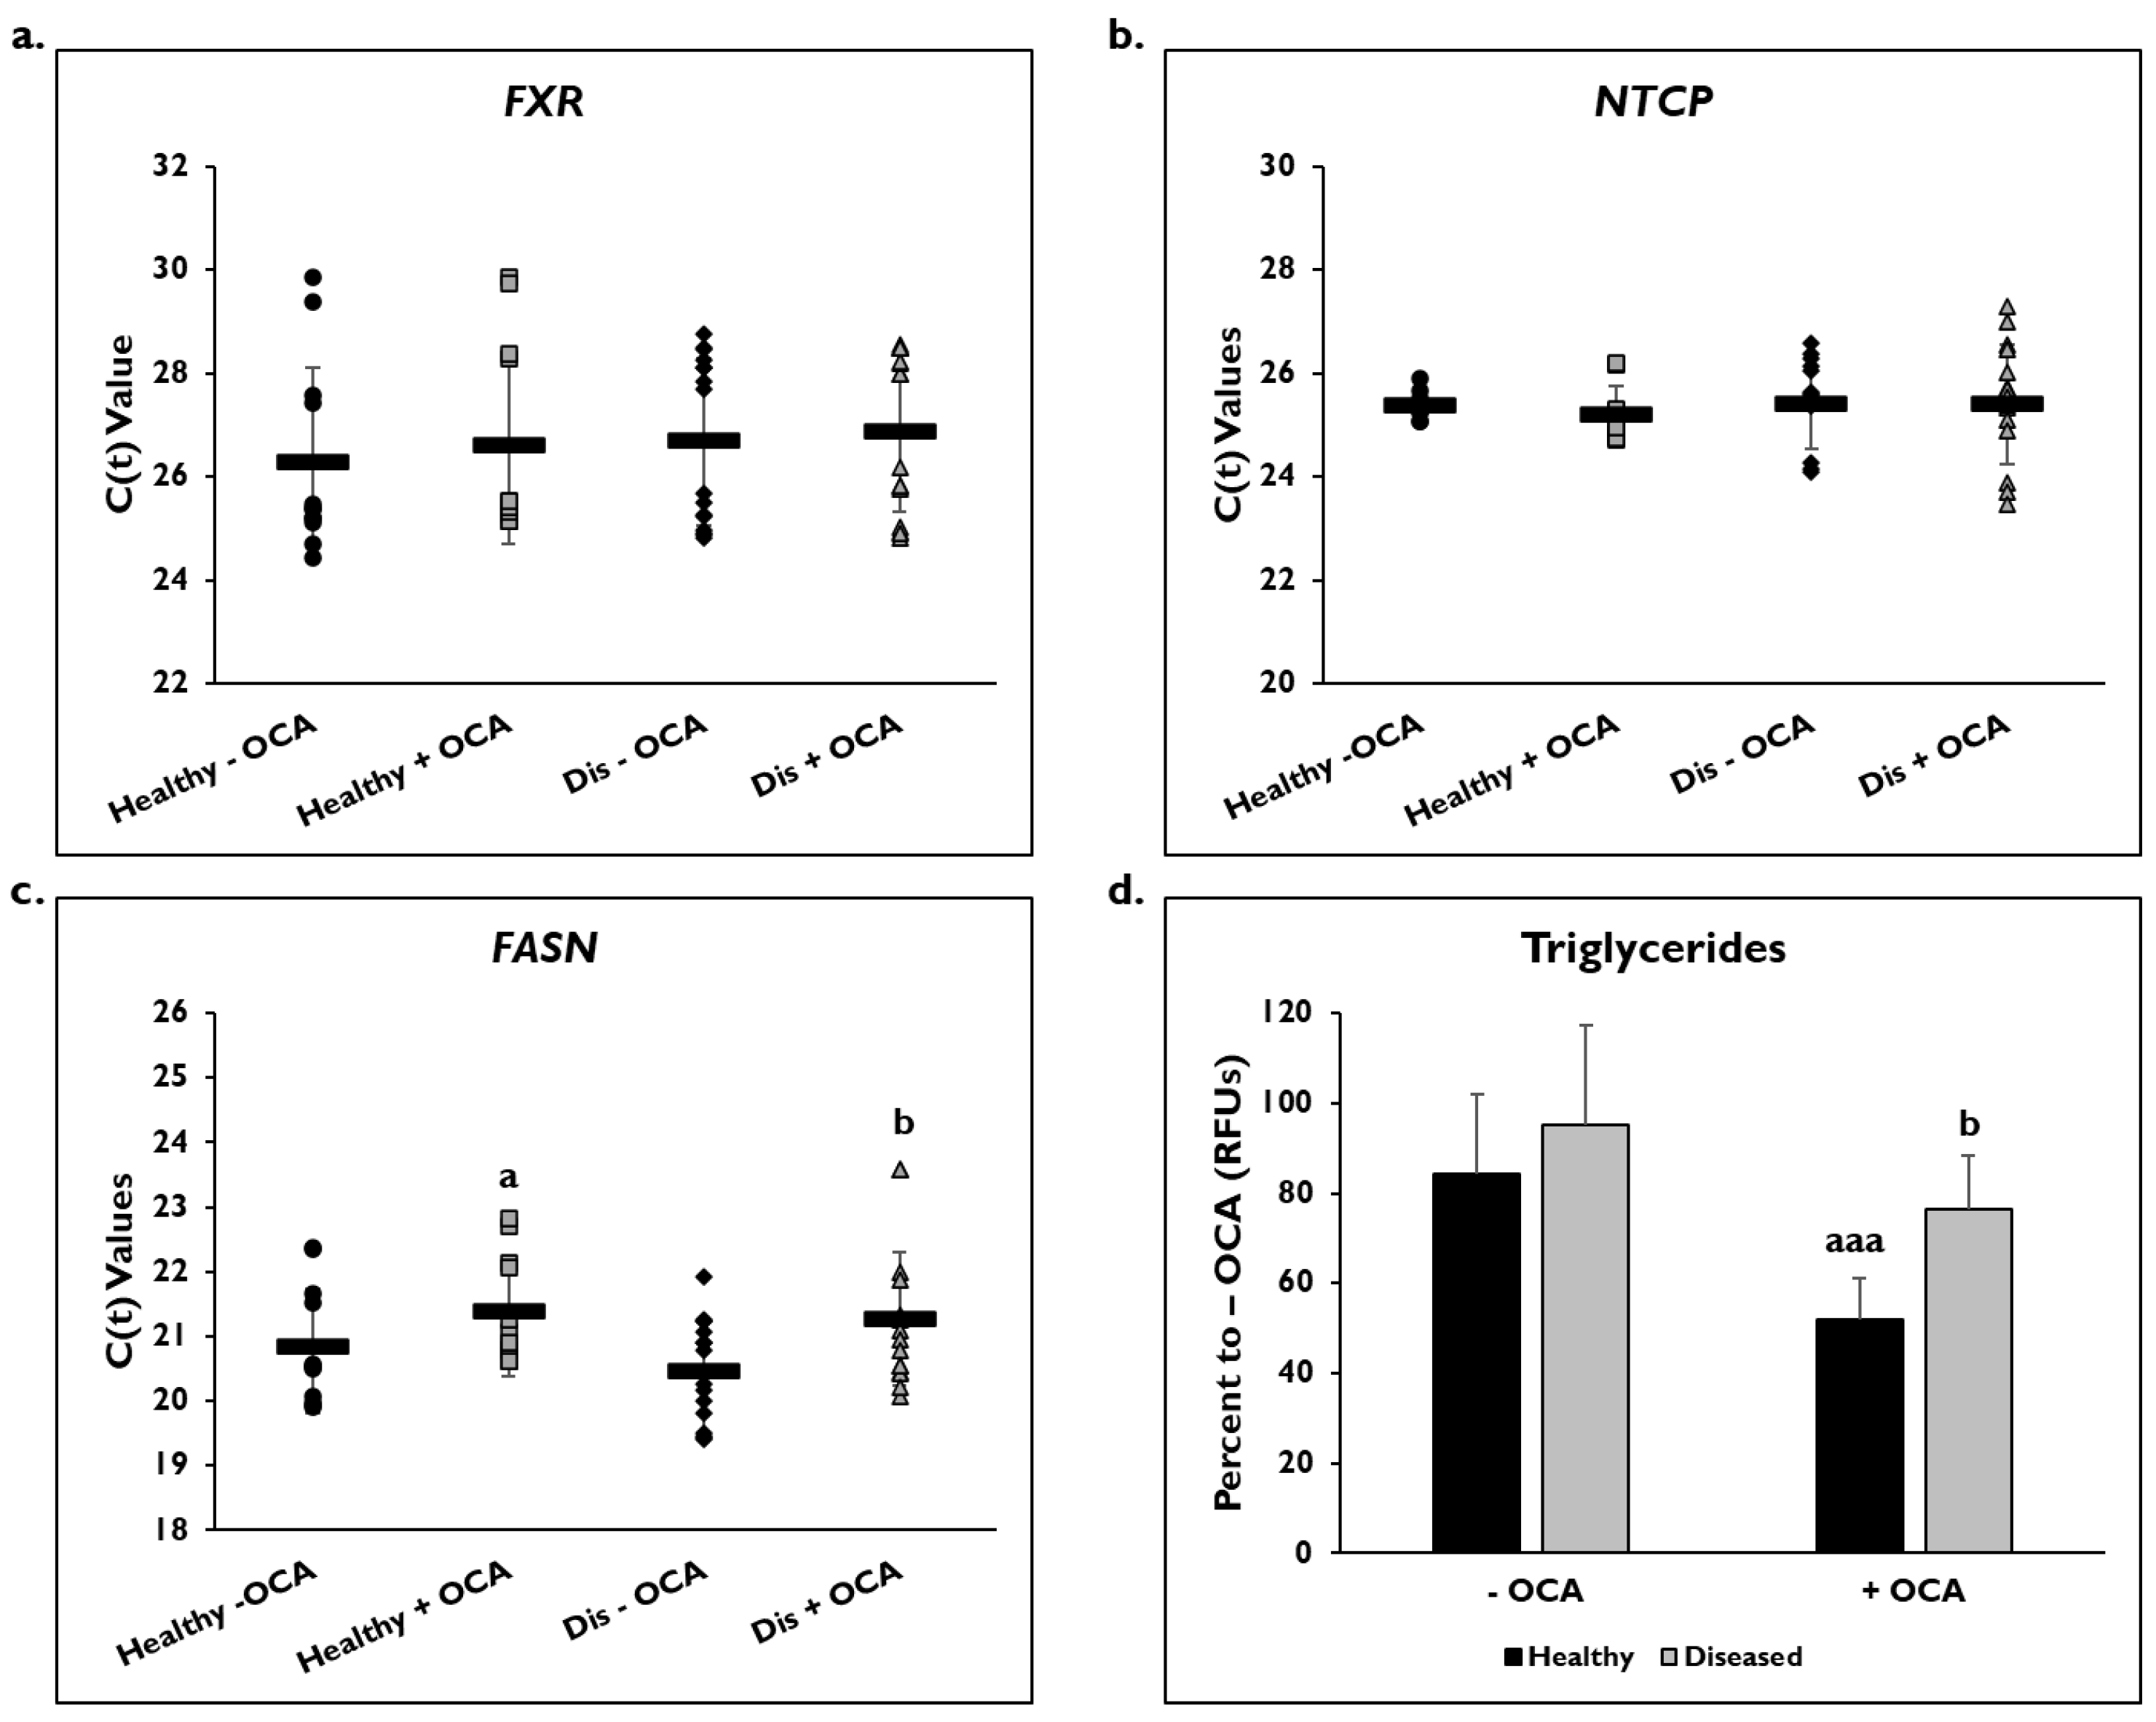
2.4. Gene Expression

On day 14, RLT buffer (Qiagen, Germantown, MD, USA) was used to lyse the cells. The RNeasy kit (Qiagen) was used to isolate RNA according to the manufacturer’s instructions. A 30 μL volume reaction containing 6 μL PrimeScript RT Master Mix, 20 μL RNA, and 4 μL ddH2O was prepared using the PrimeScript RT reagent kit (Takara Bio, Shiga, Japan) to make cDNA. qRT-PCR reactions were prepared using 10 μL QuantiNova 2X SYBR Green Master mix (Qiagen), 2 μL ROX reference dye (1:10 dilution) (Qiagen), 5 μL RNAse/DNase free H2O, and 2 μL designated primer set (10 pM). Taqman primers (Thermo) were used for the following genes: FXR, NTCP, CYP3A4, CD68, CD163, CYP2E1, BSEP, CYP7A1, and CYP27A1. Primer sequences (Thermo) used for Glyceraldehyde-3-phosphate dehydrogenase (GAPDH), Fatty Acid Synthase (FASN), Interleukin-6 (IL-6), Interleukin-10 (IL-10), Cytokeratin-18 (CK18), and Transforming Growth Factor-beta (TGF-β) are listed in Table 2. PCR amplification was performed on a QuantStudioTM 7 Flex Real-Time PCR System (Thermo Fisher) using the following program: Step (1) 02:00 min at 95 °C; Step (2) 00:05 s at 95 °C; Step (3) 00:10 s at 60 °C. Repeat steps 2 and 3 for 40 cycles. Data was analyzed with QuantStudioTM 7 Flex Real-Time PCR System software (Thermo Fisher) and Microsoft Excel. The housekeeping gene GAPDH was used for normalization. Data is shown as C(t) values after normalization to GAPDH.

2.5. Triglycerides Assay

After washing the cells with 1X DPBS (-Ca++/-Mg++) (Thermo Fisher), they were lysed in Assay Buffer/Triglyceride Assay Buffer (Abcam). Cell lysates were then incubated for 10 min on ice, centrifuged at 14,000 rpm for 5 min at 4 °C, and supernatants were collected. The fluorometric Picoprobe Triglyceride Quantification Assay kit (Abcam) was performed according to the manufacturer’s instructions to measure triglycerides.

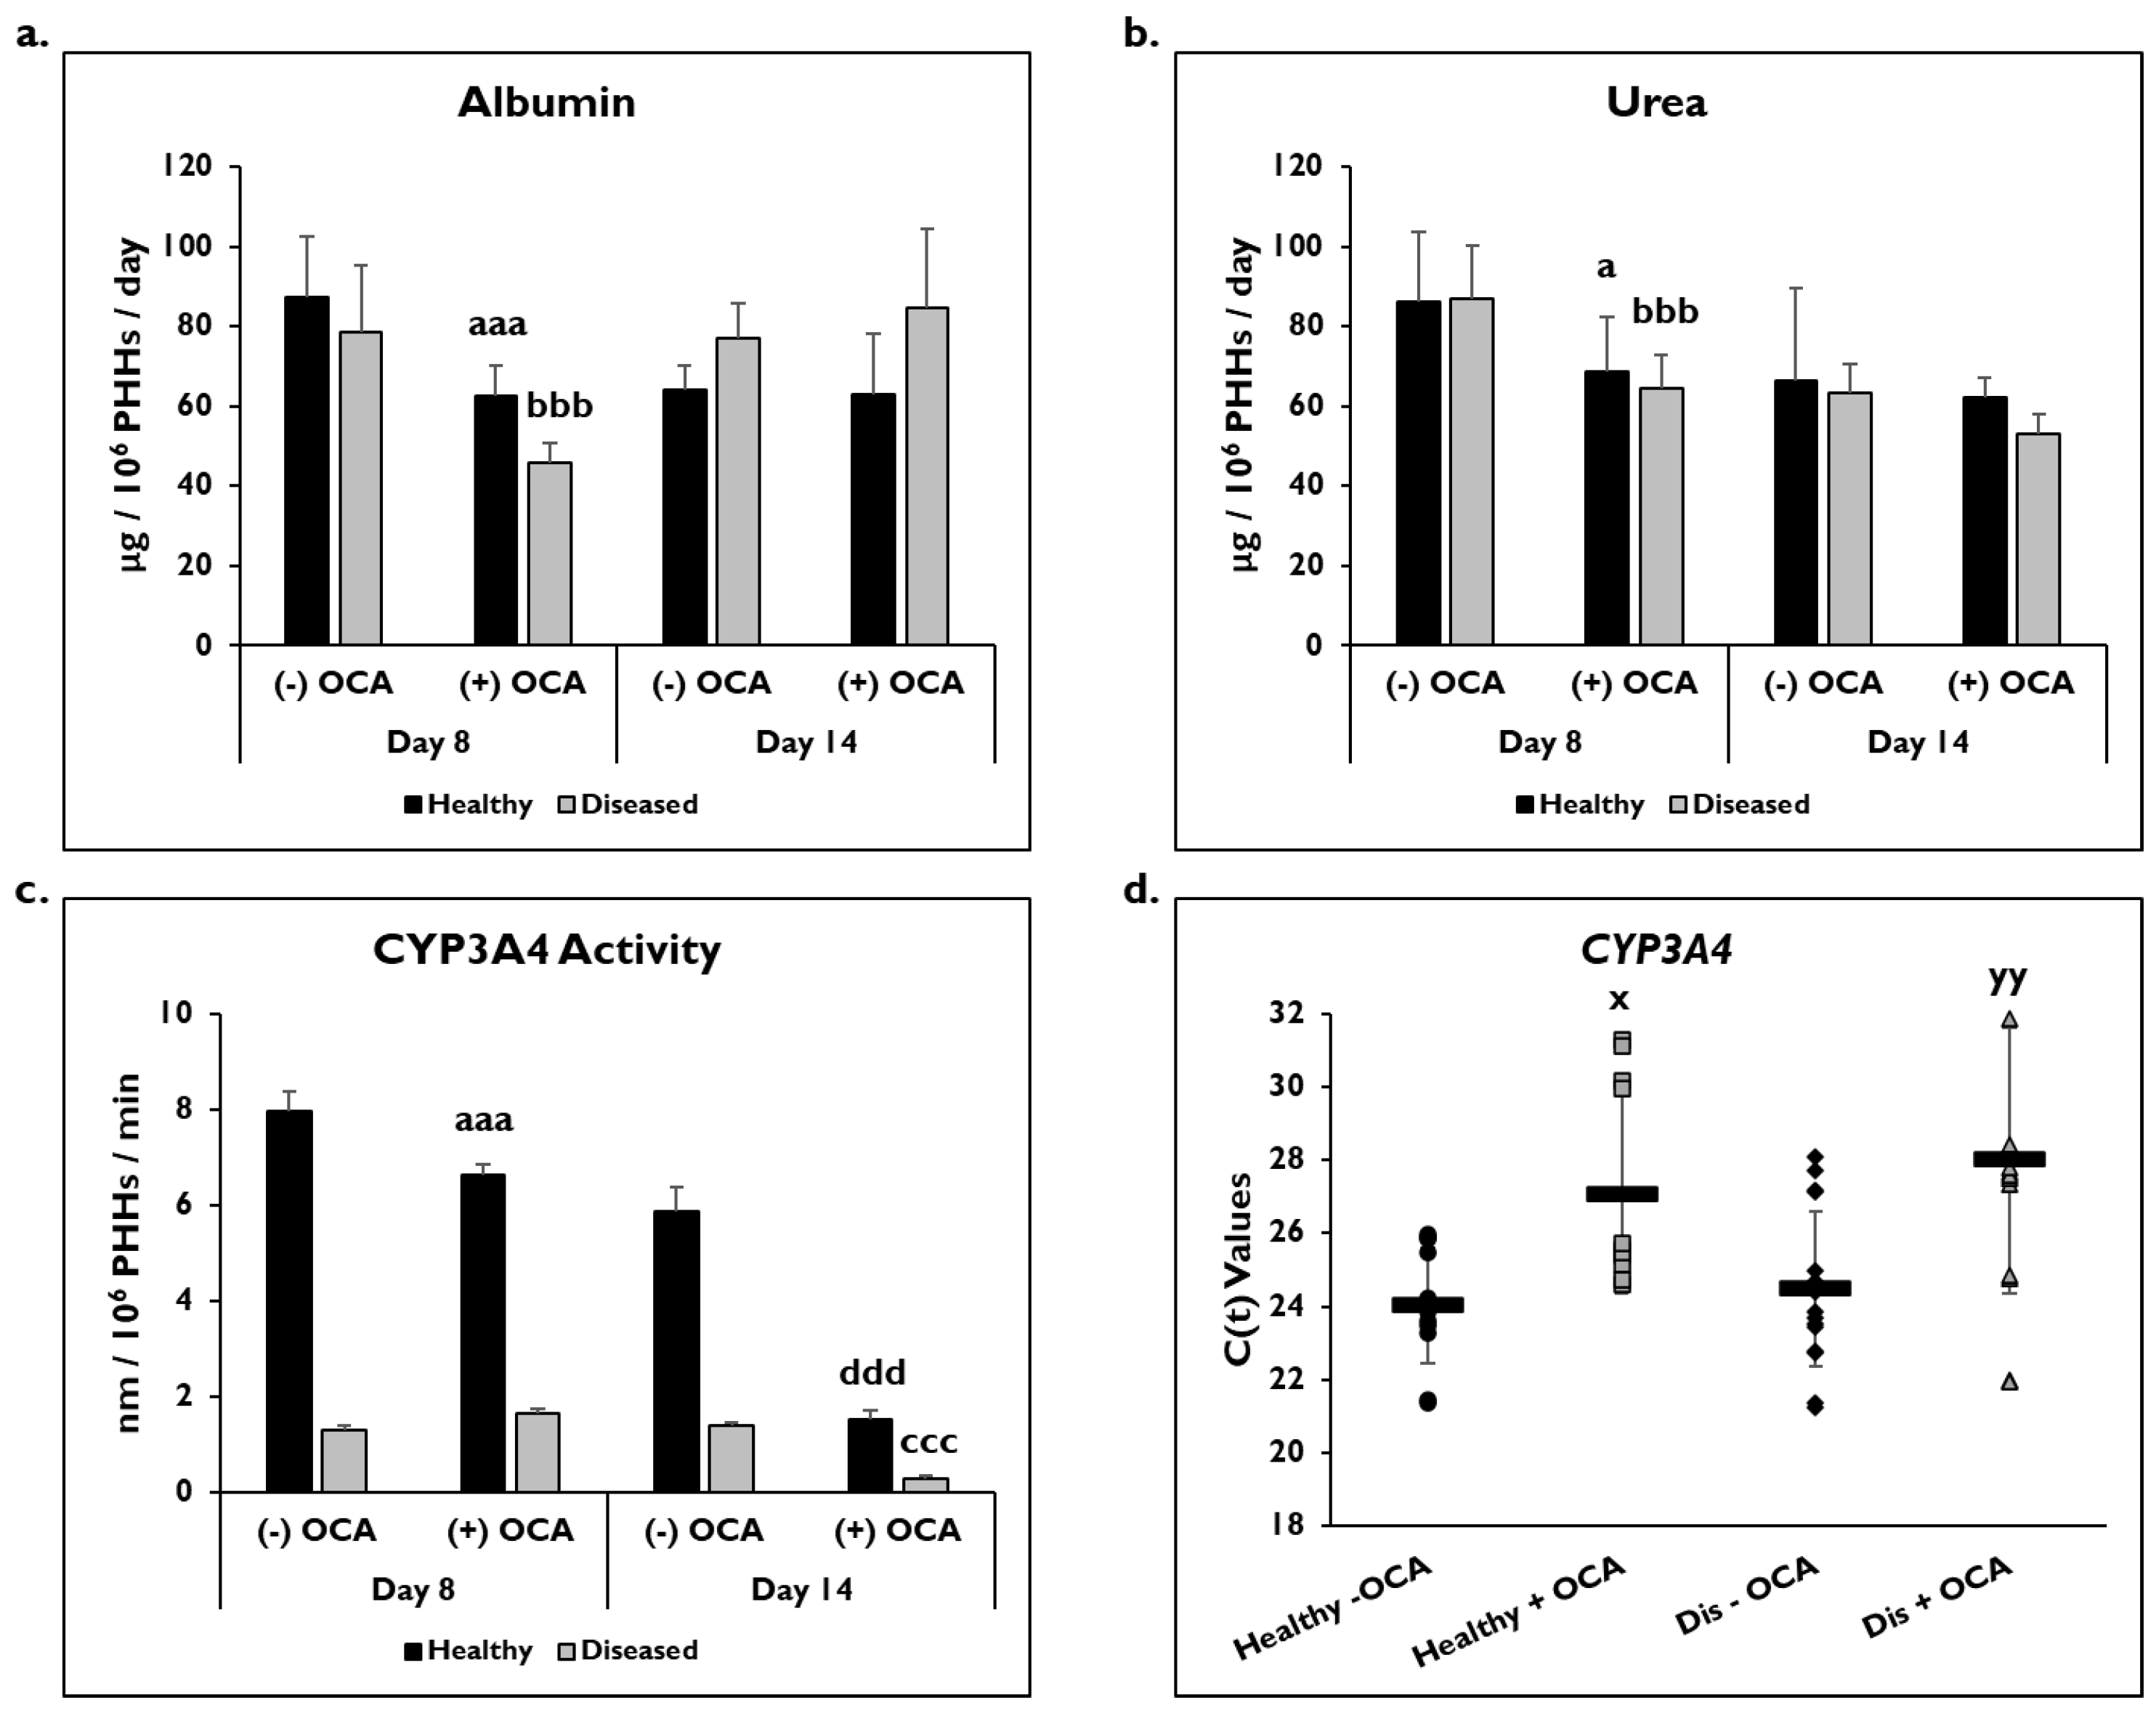
2.6. Albumin, Urea, and ELISAs

Cell culture supernatants were collected on the designated days for determining albumin, urea, CK18, and Collagen 1A (COL1A1) levels as described previously [6]. Samples were run in duplicate. ELISA kits were used to determine the level of albumin (Abcam), CK18 (Abcam), and COL1A1 (Abcam). A colorimetric kit (Stanbio, Boerne, TX, USA) was used to determine the level of urea. All kits were performed according to the manufacturer’s instructions.

2.7. Assay for Basal CYP3A4 Activity

Baseline CYP3A4 activity (Promega, Madison, WI, USA) was measured using the P450-Glo assay as described previously [6]. A minimum of three wells were used for each condition, and duplicates were run for each sample. After 24 h, the cell culture supernatant was removed, and the cells were washed with DMEM without phenol red (Thermo Fisher). Cyp-Luciferin-IPA stock was added to the cells and incubated at 37 °C for 30 min. After collecting the supernatant, the assay was performed according to the manufacturer’s instructions.

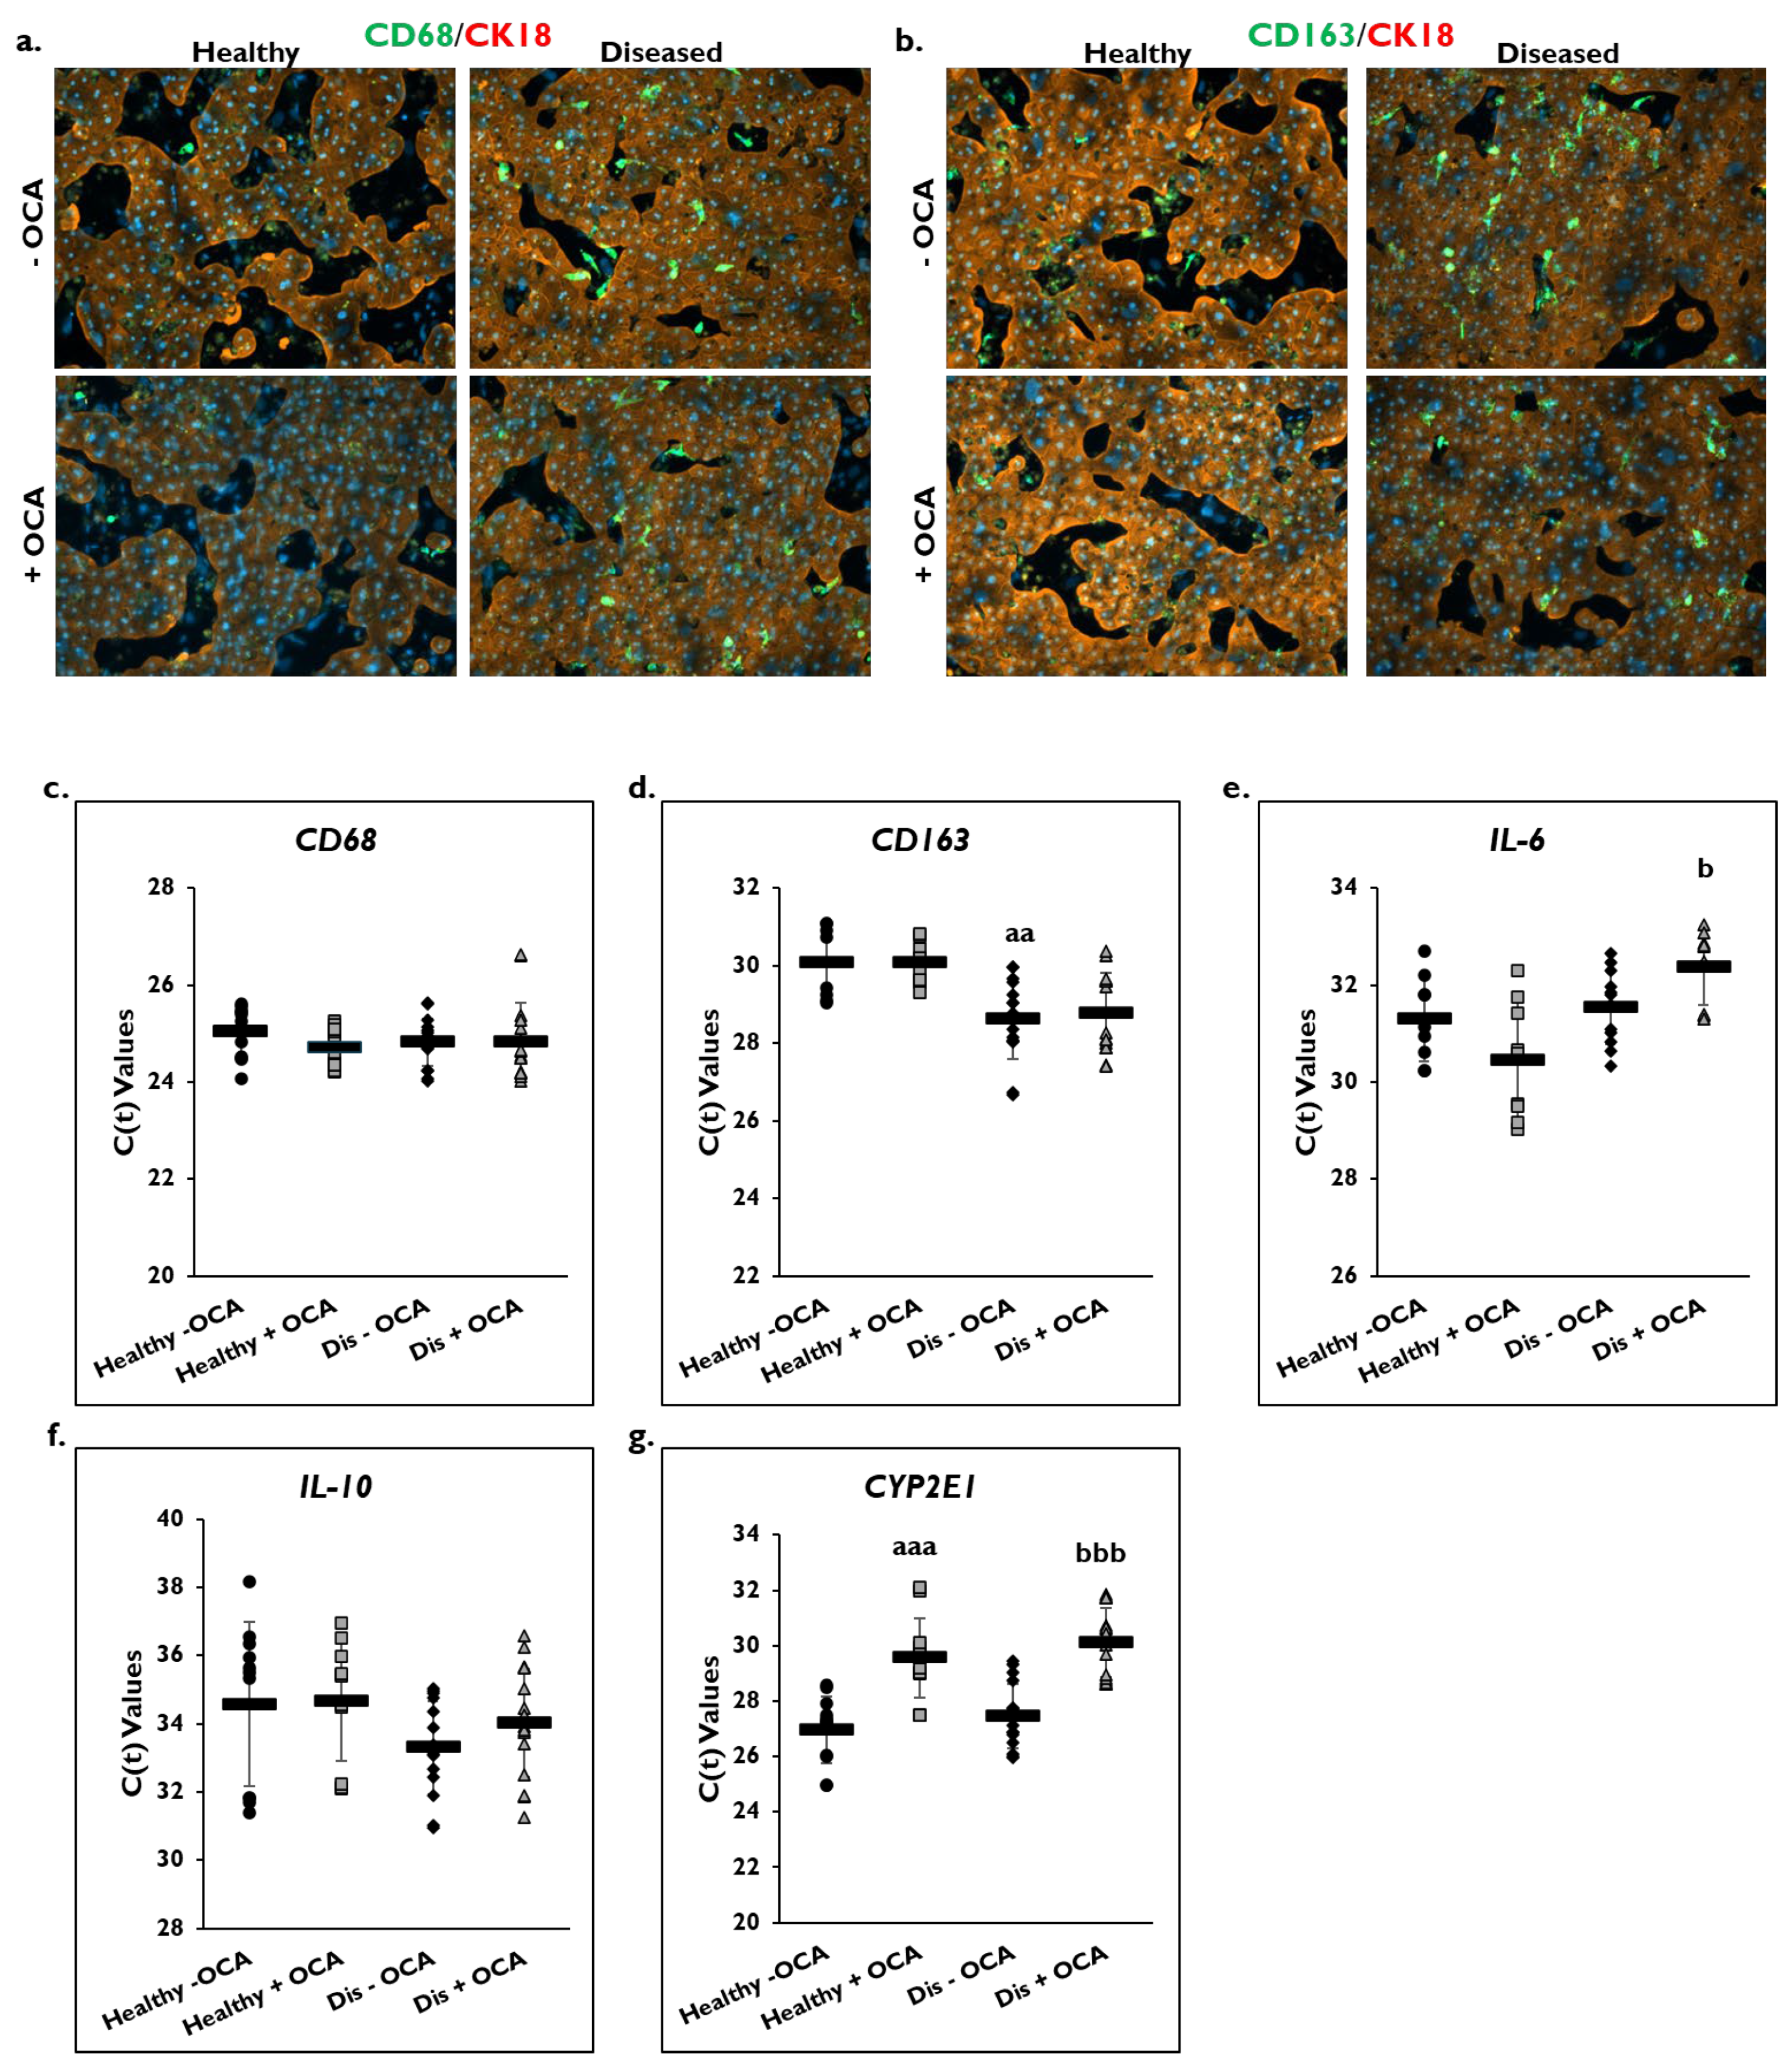
2.8. Immunofluorescence

Using Fixation Solution (eBioScience, San Diego, CA, USA), cells were fixed at 4 °C for 30 min. After washing twice with 1X Permeabilization buffer (eBioscience), primary antibody was added and incubated at 4 °C overnight. The following antibodies were used: (1) CD68 at 1:100 (Abcam, ab955); (2) CD163 at 1:100 (Abcam, ab87099); and (3) CK18 at 1:1000 (Abcam, ab24561). After washing the cells two times with 1X Permeabilization buffer, secondary goat anti-mouse IgG Alexa Fluor 488 conjugated antibody (Thermo Fisher) or secondary goat anti-rabbit IgG Alexa Fluor 555 conjugated antibody (Thermo Fisher) was added at a 1:500 dilution at 4 °C for 30 min in the dark. An additional two washes with 1X Permeabilization buffer and one wash with 1X DPBS (-Ca++/-Mg++) (Thermo Fisher) was done. Fluoromount-G mounting medium with DAPI (Invitrogen, Waltham, MA, USA) was added. A Zeiss Observer.Z1 fluorescent microscope was used to capture the images. Z-stack using a Zeiss ApoTome.2 was used to acquire the images on the 10X objective lens. Total number of images taken for each condition and time point are stated in the figure legends.

2.9. 5-(and-6)-Carboxy-2′,7′-Dichlorofluorescein Diacetate (CDFDA) Staining

After washing two times with 1X DPBS (-Ca++/-Mg++) (Thermo Fisher), DMEM without phenol red (Thermo Fisher) plus CDFDA (5 μm) (Thermo Fisher) was added to the cells on day 14. They were incubated at 37 °C for 20 min. An additional two washes were done with 1X DPBS (-Ca++/-Mg++), and then DMEM without phenol red (Thermo Fisher) was added to the cells. An EVOS FL imaging system (Thermo Fisher) on the 10X objective was used to capture the images. Total number of images taken for each condition and time point are stated in the figure legends.

2.10. Statistical Analysis

Representative donor lots are shown in the images. Values were normalized to the determined number of attached PHHs as described above for albumin, urea, CYP3A4, CK18, and COL1A1 measurements. One-way ANOVA with Tukey or Fisher post hoc testing was used to calculate statistical significance with 95% confidence and * p ≤ 0.05 in MiniTab (MiniTab, State College, PA, USA).

3. Results

3.1. OCA Treatment and PHH Lipogenesis

The morphological features between healthy and diseased PHHs treated with OCA and untreated for either 24 h (day 8) or 7 days (day 14) were compared (Figure 1). Healthy and diseased PHHs had hepatocyte morphology with compact, cuboidal shapes and formed colonies with well-defined borders on days 8 and 14 (Figure 1a,b). It appeared that there was increased lipogenesis in the untreated diseased PHHs at both time points compared to the untreated healthy PHHs. Treatment with OCA appeared to decrease lipogenesis in both groups of PHHs. Lipids were stained with Nile Red on day 14 in healthy and diseased PHHs treated with and without OCA with decreased lipid granule size and peripheral localization in diseased PHHs (Figure 1c). There was ~20% decrease in fluorescence in healthy (81.9% ± 10.0 Relative Fluorescent Units (RFUs)) and diseased (81.1% ± 7.8 RFUs) PHHs treated with OCA compared to those not treated (healthy: 100% ± 8.1 RFUs; diseased: 100% ± 6.8 RFUs) (Figure 1d).
Gene expression on day 14 as shown by C(t) values of FXR and NTCP after normalization to GAPDH were measured after treatment with and without OCA for 7 days (Figure 2). There were no significant differences in expression of the FXR gene in healthy (26.3 ± 1.8) and diseased PHHs (26.7 ± 1.6) at baseline or after treatment with OCA (healthy: 26.6 ± 1.9; diseased: 26.9 ± 1.5) (Figure 2a). NTCP gene expression was also unchanged in both groups before (healthy: 25.4 ± 0.3; diseased: 25.4 ± 0.9) and after OCA treatment (healthy: 25.2 ± 0.6; diseased: 25.4 ± 1.2) (Figure 2b).
FASN gene expression as shown by C(t) values after normalization to GAPDH was measured to determine whether OCA treatment would influence genes involved in fatty acid synthesis (Figure 2c). In healthy and diseased PHHs, there was a decrease in expression after OCA treatment (healthy: 20.6 ± 0.7 vs. 21.4 ± 1.1; diseased: 20.3 ± 0.7 vs. 21.0 ± 0.9). Both OCA treated healthy and diseased PHHs had a significant change in expression when compared to the untreated PHHs.
When the level of triglycerides was measured, the diseased PHHs (95.1% ± 9.2 RFUs) had a higher baseline value compared to healthy PHHs (84.3% ± 17.7 RFUs) (Figure 2d). The level of triglycerides significantly decreased when OCA was added to the diseased (76.6% ± 11.8 RFUs) and healthy PHHs (51.9% ± 22.1 RFUs); however, the healthy PHHs had a larger decrease (32.4%) compared to the diseased PHHs (18.5%).

3.2. OCA Treatment and PHH Functionality

PHH functionality was determined by measuring albumin and urea levels and catabolic activity (CYP3A4) in healthy and diseased PHHs with or without OCA treatment (Figure 3). On day 8, there was a significant decrease in albumin in healthy (62.5 ± 7.6 µg/106 PHHs/day) and diseased (46.0 ± 4.7 µg/106 PHHs/day) PHHs with OCA treatment compared to without treatment (healthy: 87.3 ± 15.2 µg/106 PHHs/day; diseased: 78.6 ± 16.6 µg/106 PHHs/day) (Figure 3a). Although an increase in albumin was seen in the diseased PHHs with OCA treatment (84.5 ± 20.1 µg/106 PHHs/day) compared to no treatment (77.2 ± 8.6 µg/106 PHHs/day) on day 14, it was not significant; however, no increase was seen in the healthy PHHs when OCA was added compared to untreated PHHs (62.8 ± 15.4 vs. 64.0 ± 6.3 µg/106 PHHs/day).
A significant decrease was seen in urea levels on day 8 in healthy (86.3 ± 17.2 µg/106 PHHs/day) and diseased (87.0 ± 13.3 µg/106 PHHs/day) PHHs treated with OCA (healthy: 68.7 ± 13.8 µg/106 PHHs/day; diseased: 64.6 ± 8.4 µg/106 PHHs/day) (Figure 3b). OCA treatment (62.2 ± 5.0 µg/106 PHHs/day) did not affect urea levels in healthy untreated PHHs (66.3 ± 23.3 µg/106 PHHs/day) on day 14. However, the urea levels in diseased PHHs decreased when treated with OCA (53.0 ± 5.2 µg/106 PHHs/day) compared to no treatment (63.5 ± 7.3 µg/106 PHHs/day); however, it was not a significant decrease.
The effect of OCA on CYP3A4 functional activity was measured after 24 h or 7 days of treatment (days 8 and 14, respectively) (Figure 3c). There was a significant decrease in activity in healthy PHHs treated with OCA (6.6 ± 0.2 nm/106 PHHs/min) compared to untreated (8.0 ± 0.4 nm/106 PHHs/min) on day 8. Diseased PHHs exhibited a slight increase in CYP3A4 activity after 24 h of OCA treatment (1.7 ± 0.1 nm/106 PHHs/min) versus no treatment (1.3 ± 0.1 nm/106 PHHs/min). However, by day 14, OCA treatment had a negative impact on CYP3A4 activity with significant decreases seen in both healthy (1.5 ± 0.2 nm/106 PHHs/min) and diseased (0.3 ± 0.06 nm/106 PHHs/min) PHHs when compared to the no treatment group (healthy: 5.9 ± 0.5 nm/106 PHHs/min; diseased: 1.4 ± 0.05 nm/106 PHHs/min). In addition to CYP3A4 activity, CYP3A4 gene expression after normalization to GAPDH was significantly decreased in treated PHHs on day 14 (Figure 3d). OCA treated healthy (27.1 ± 2.7) and diseased (28.0 ± 3.6) PHHs had higher C(t) values after normalization to GAPDH compared to untreated healthy (24.0 ± 1.6) and diseased (24.5 ± 2.1) PHHs.

3.3. OCA Treatment and Inflammation

The effect of OCA treatment on markers of inflammation was determined in healthy and diseased PHHs by examining the macrophage markers CD68 and CD163 (Figure 4). Cultures of healthy and diseased PHHs stained positive for CD68 and CD163 marker expression on day 14 (Figure 4a,b; Supplementary Figure S1a,b). There appeared to be higher CD68 and CD163 staining in the diseased PHHs compared to the healthy PHHs. OCA treatment did not appear to alter CD68 or CD163 staining in healthy PHHs. However, there appeared to be less staining for both markers when diseased PHHs were treated with OCA.
Gene expression levels for CD68 and CD163 on day 14 were measured in OCA treated and non-treated groups in healthy and diseased PHHs (Figure 4c,d). No change in C(t) values after normalization to GAPDH for CD68 gene expression was measured in healthy and diseased PHHs with OCA treatment (healthy: 24.7 ± 0.4; diseased: 24.8 ± 0.8) compared to no treatment (healthy: 25.0 ± 0.5; diseased: 24.8 ± 0.5). This was also true for CD163 gene expression with no change in C(t) values after normalization to GAPDH being measured for treated (healthy: 30.0 ± 0.6; diseased: 28.8 ± 1.0) versus untreated healthy (30.1 ± 1.0) and diseased (28.6 ± 1.0) PHHs. It should be noted that diseased PHHs had a significantly higher C(t) value than healthy PHHs meaning diseased PHHs had greater CD163 expression.
OCA treatment on expression of the IL-6 and IL-10 genes as shown by C(t) values after normalization to GAPDH on day 14 was determined (Figure 4e,f). An increase in IL-6 gene expression was measured in healthy PHHs treated with OCA (30.4 ± 1.2) compared to no treatment (31.3 ± 0.9). However, OCA treatment (32.4 ± 0.8) significantly decreased IL-6 gene expression compared to untreated (31.6 ± 0.8) diseased PHHs. This decrease was seen for IL-10 gene expression in diseased PHHs treated with OCA (34.0 ± 1.6) compared to diseased PHHs that did not receive treatment (33.3 ± 1.4); however, it was not significant. No change in C(t) values for IL-10 gene expression were measured in healthy PHHs whether they were treated (34.7 ± 1.8) or not (34.6 ± 2.4).
CYP2E1 gene expression as shown by C(t) values after normalization to GAPDH was measured in OCA treated healthy and diseased PHHs (Figure 4g). OCA treatment significantly decreased expression of CYP2E1 in healthy (29.6 ± 1.4) and diseased (30.1 ± 1.3) PHHs versus untreated healthy (27.0 ± 1.2) and diseased (27.5 ± 1.2) PHHs.

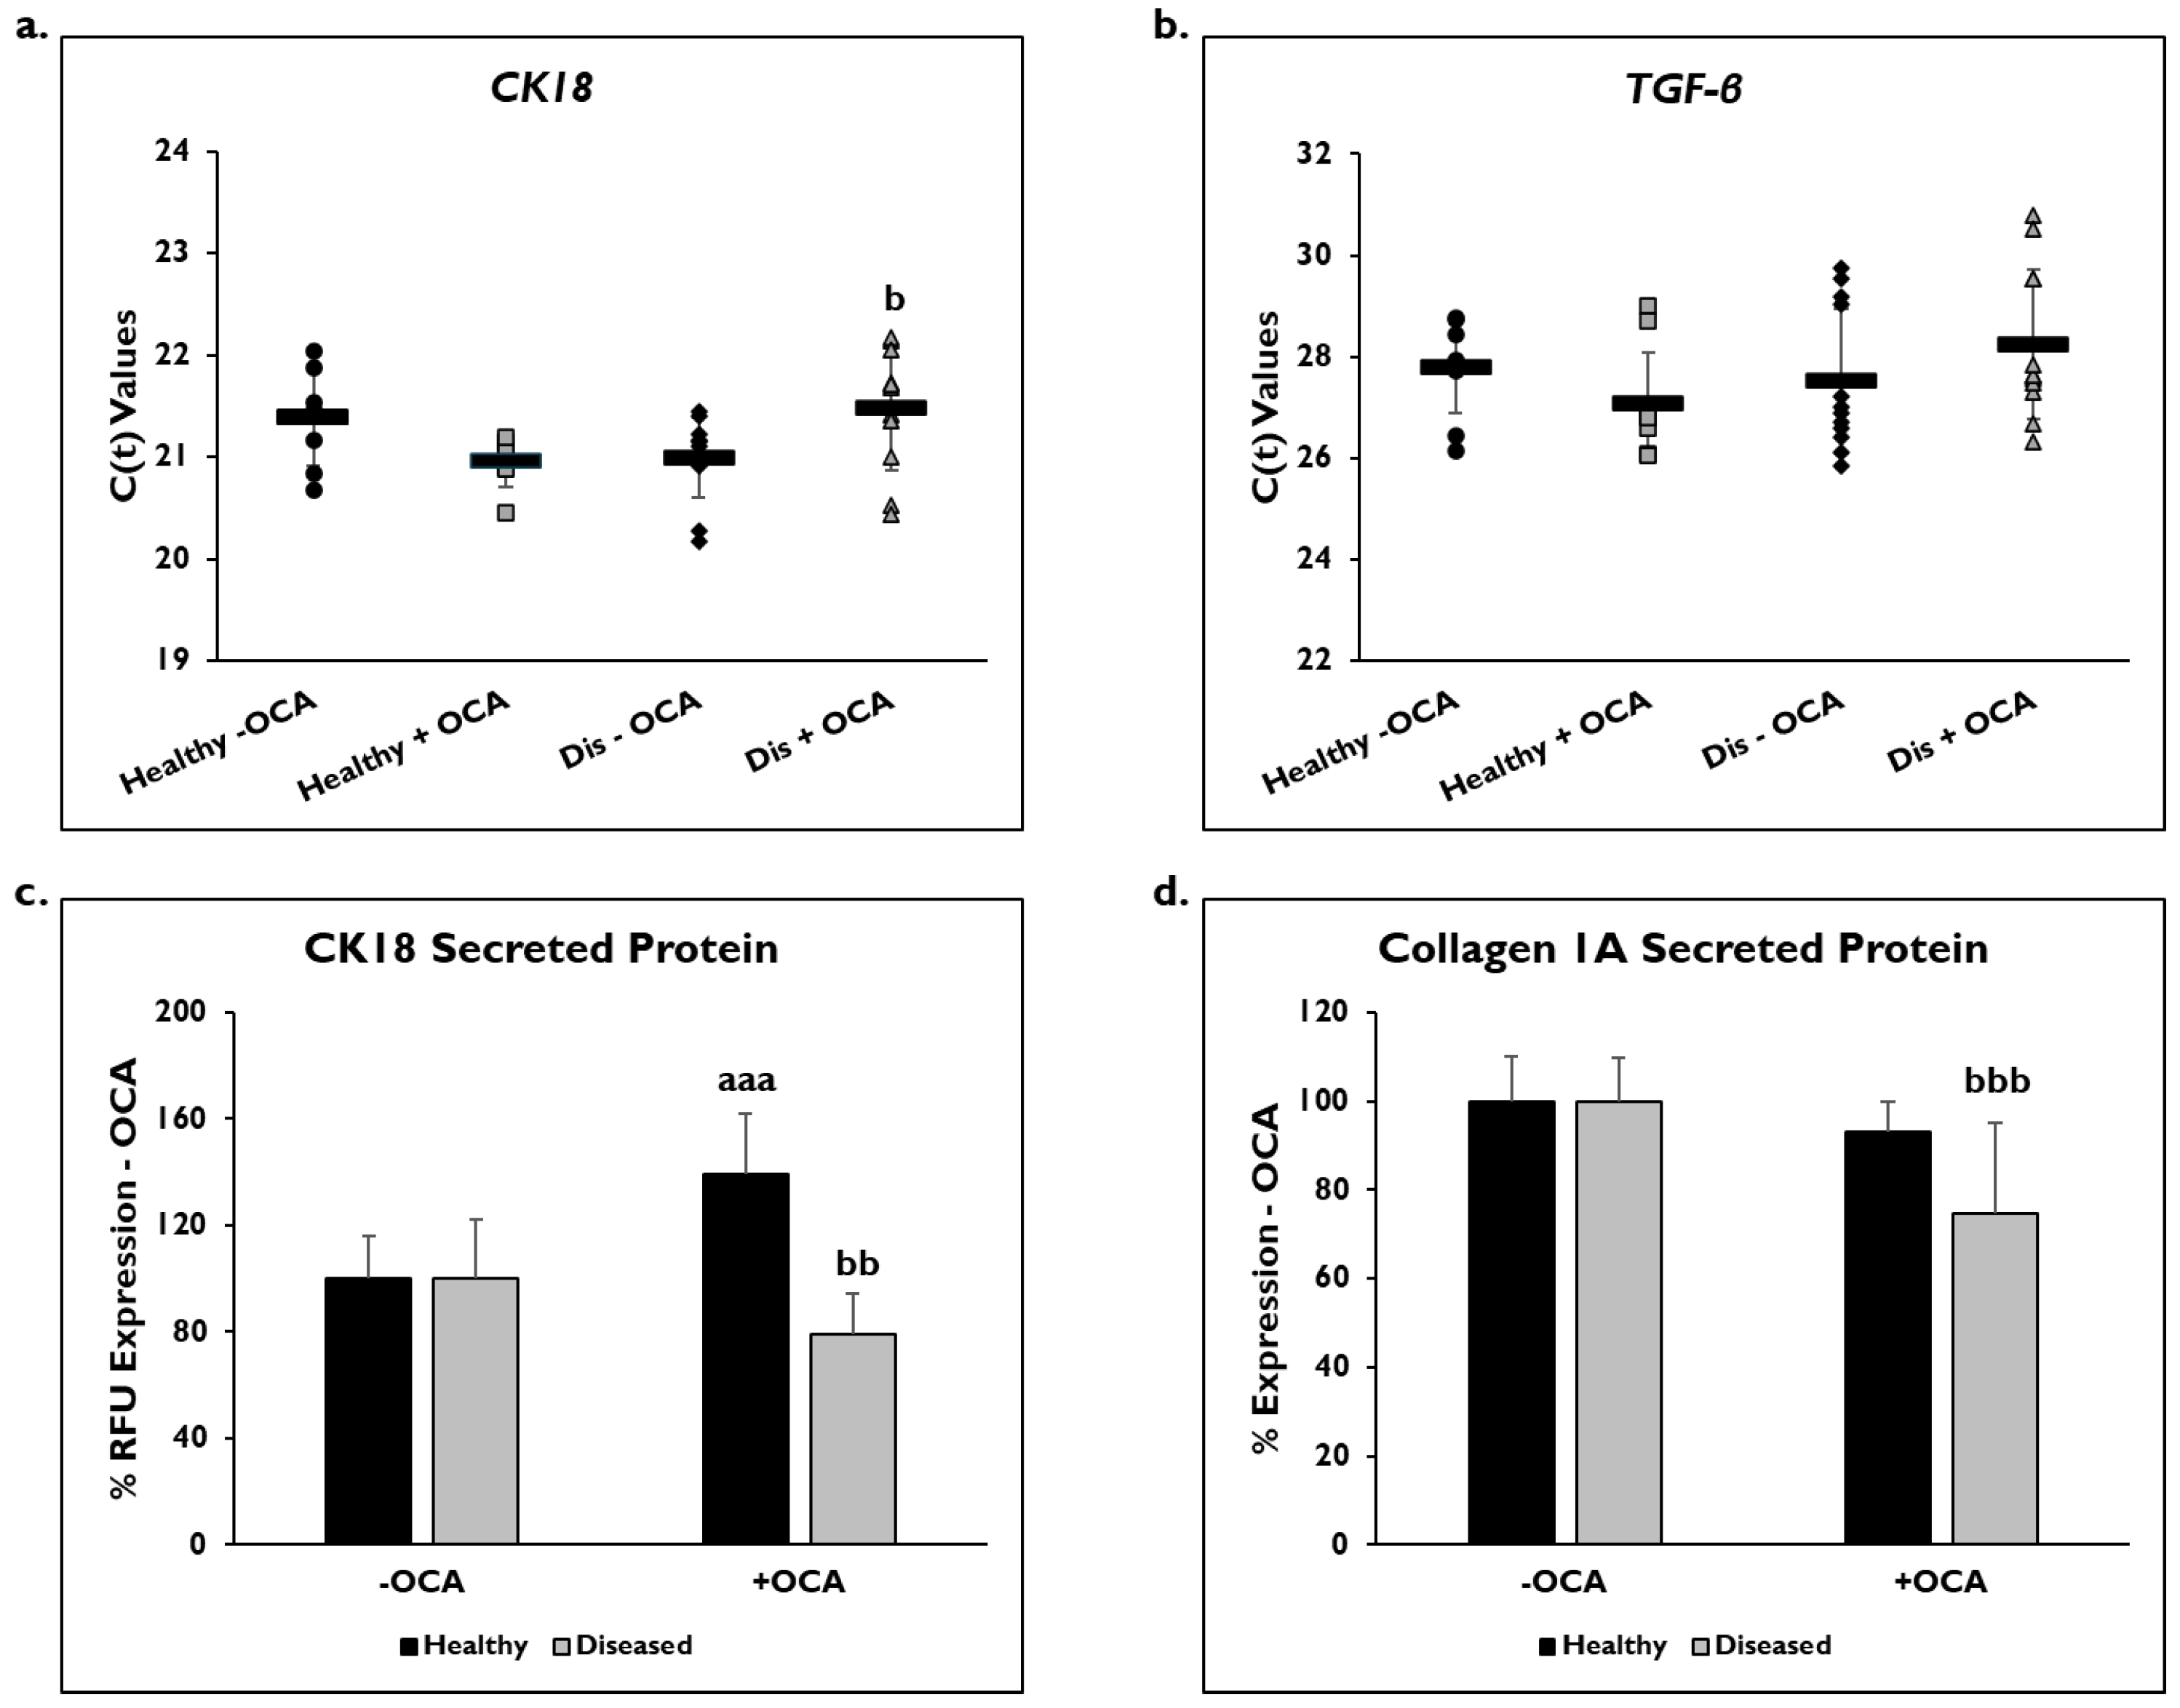
3.4. OCA Treatment and Fibrogenic Markers

Markers of fibrogenic response, CK18, TFG-β, and COL1A1, were examined to determine if OCA influenced their expression (Figure 5). Gene expression was measured on day 14 in healthy and diseased PHHs that were treated with or without OCA. C(t) values after normalization to GAPDH for CK18 gene expression were significantly decreased in diseased PHHs treated with OCA (21.6 ± 0.7) compared to untreated diseased PHHs (21.0 ± 0.4) (Figure 5a). OCA treatment did not seem to influence CK18 expression (21.1 ± 0.6) in healthy PHHs compared to untreated (21.4 ± 0.5). When TGF-β gene expression was measured, untreated diseased PHHs had higher expression levels (27.5 ± 1.4) compared to OCA treated (28.2 ± 1.5) diseased PHHs (Figure 5b); however, this increase was not significant. There was an increase in TGF-β expression in healthy PHHs with OCA treatment (27.1 ± 1.0) versus no treatment (27.8 ± 0.9), a trend similar to CK18 gene expression.
Secreted CK18 protein and COL1A1 were measured in OCA treated healthy and diseased PHHs on day 14 (Figure 5c,d), and quantified values were normalized to untreated PHHs. There was a significant decrease in CK18 protein in diseased PHHs treated with OCA (79.7% ± 15.5 RFUs) compared to untreated diseased PHHs (100% ± 22.5 RFUs). However, in healthy untreated PHHs (100% ± 16.1 RFUs), there was a significant increase in CK18 secreted protein when treated with OCA (139.1% ± 22.6 RFUs). COL1A1 significantly decreased in diseased PHHs (74.7% ± 20.6 RFUs) treated with OCA compared to untreated diseased PHHs (100% ± 9.7). A similar decrease was observed in healthy PHHs with OCA treatment (93.0% ± 6.9 RFUs) versus untreated PHHs (100% ± 10.3 RFUs); however, it was not significant.

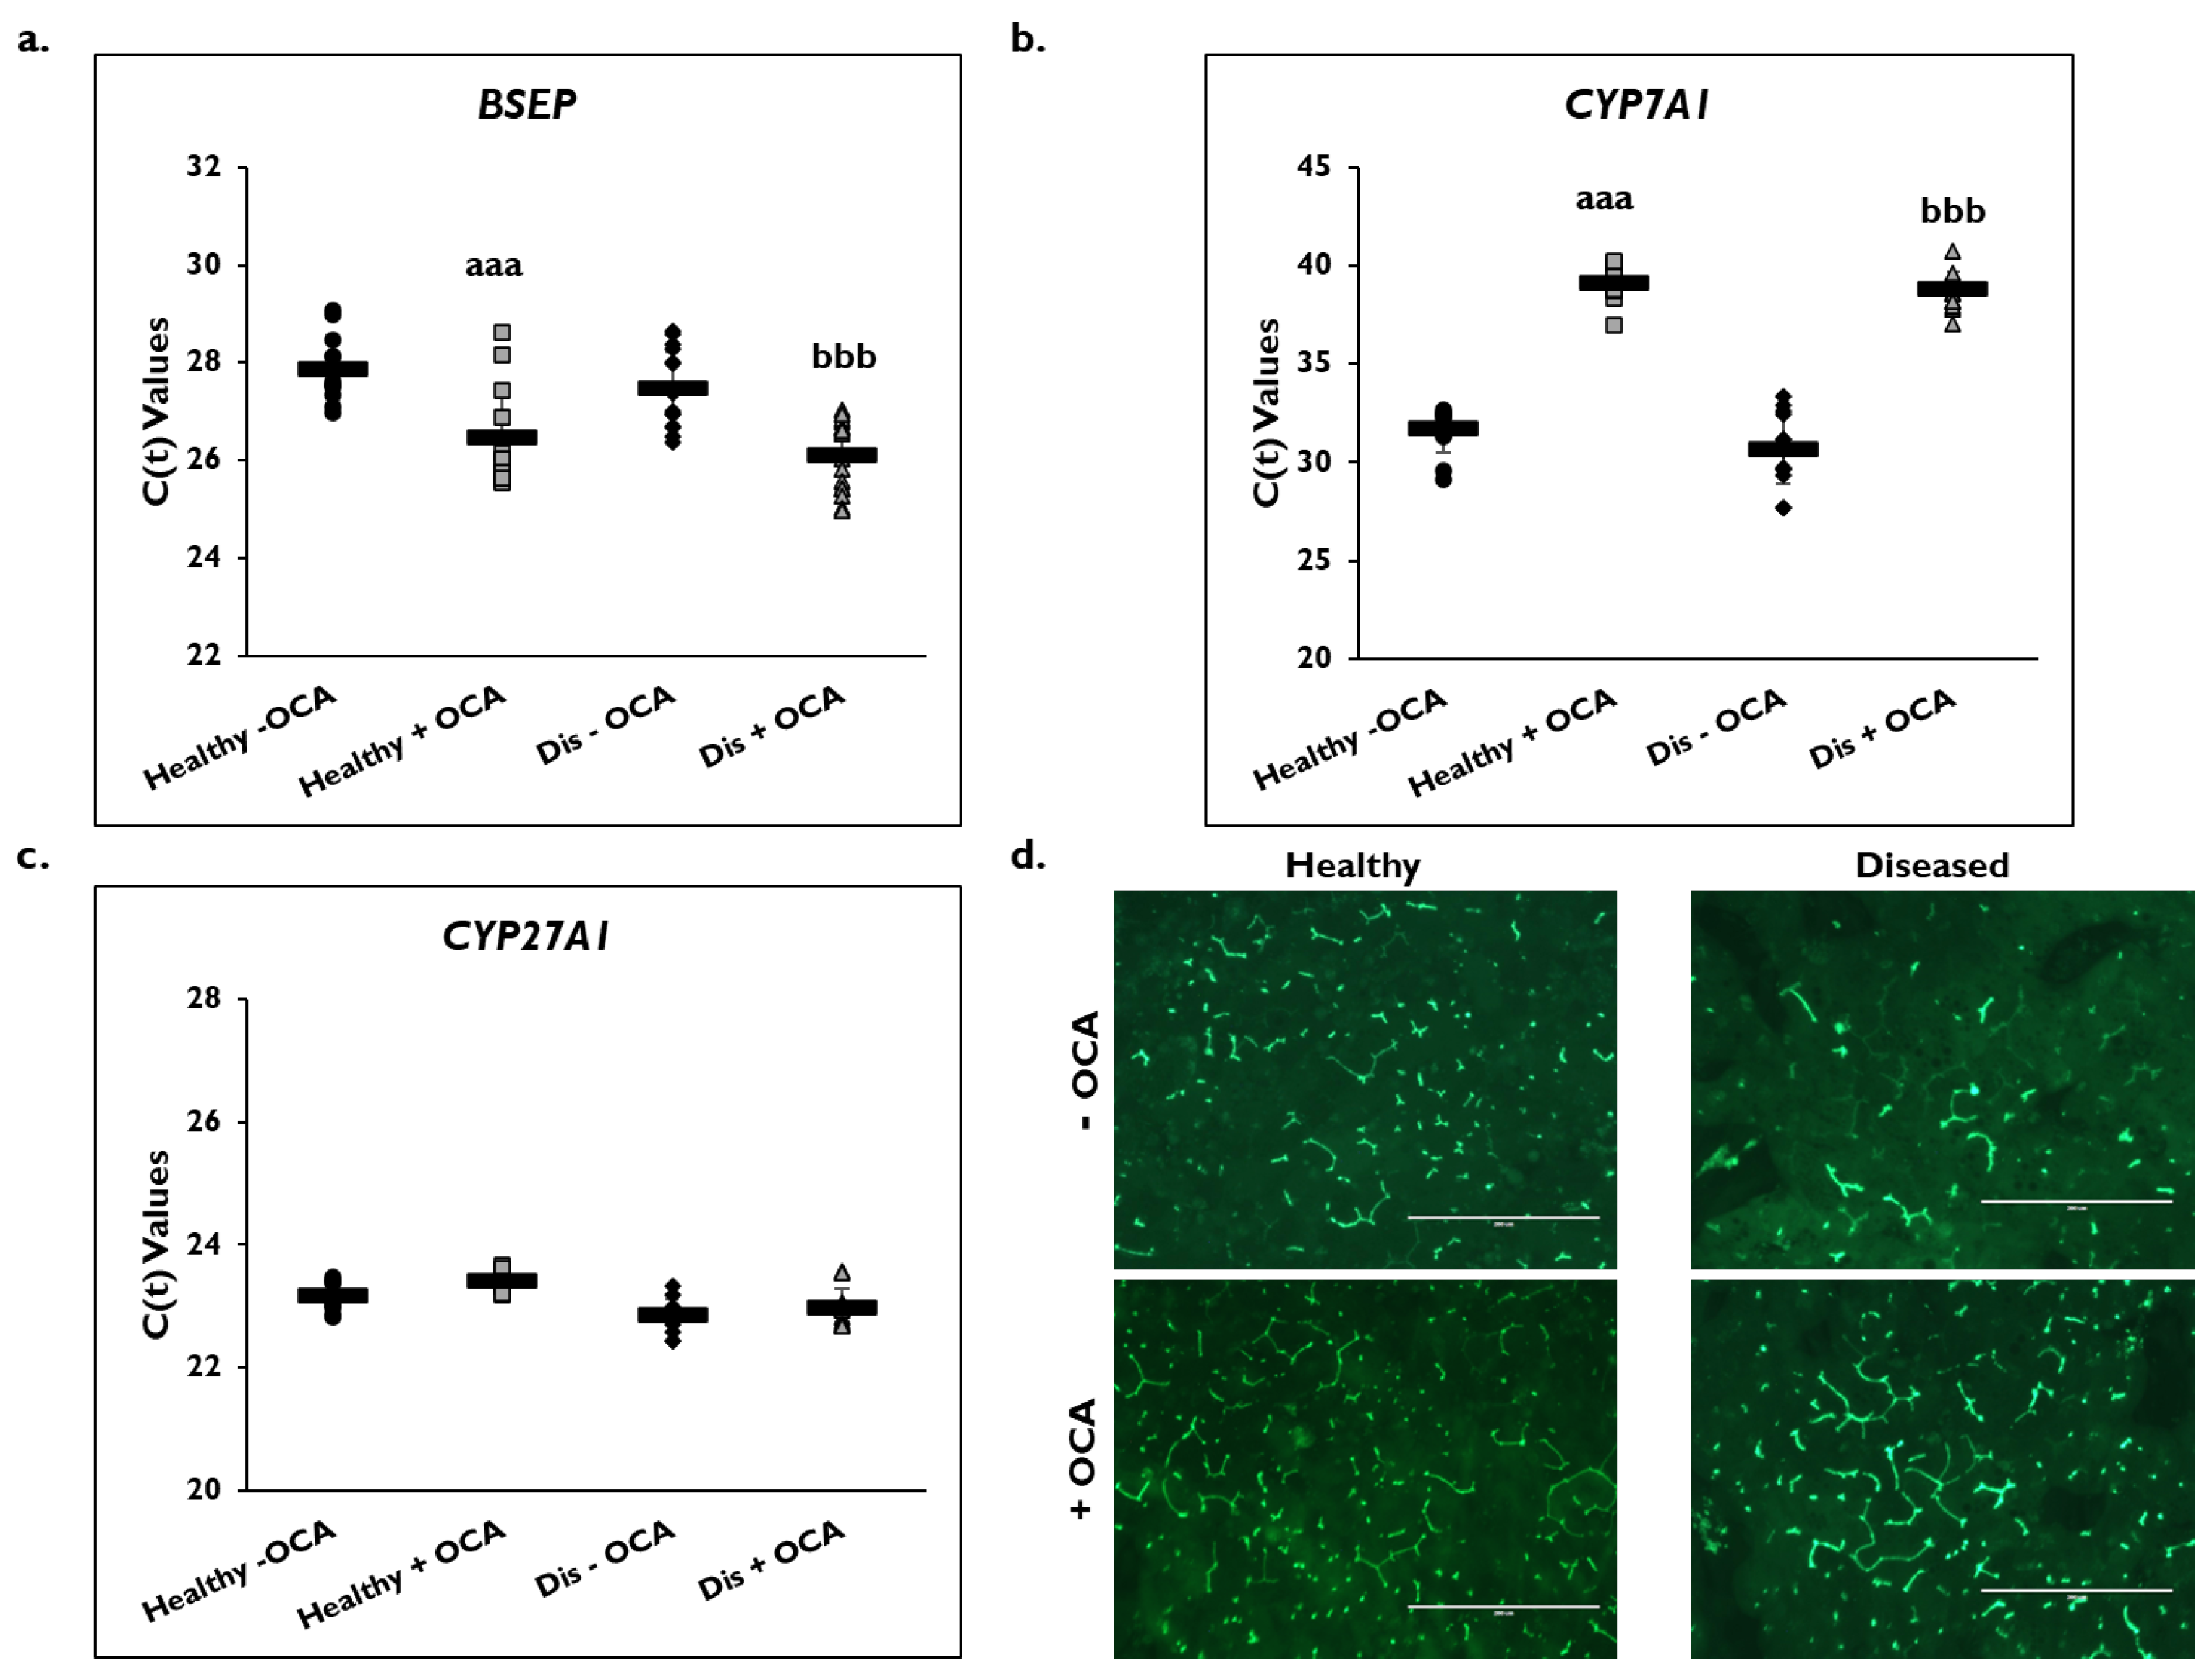
3.5. Effects of OCA on BA Synthesis Pathways

Expression of several genes in the BA synthesis and transport pathways were examined on day 14 (Figure 6). BSEP gene expression significantly increased in healthy (26.5 ± 1.1) and diseased (26.1 ± 0.7) PHHs with the addition of OCA compared to untreated PHHs (healthy: 27.9 ± 0.7; diseased: 27.5 ± 0.8) based on C(t) values after normalization to GAPDH (Figure 6a). Gene expression of CYP7A1 significantly decreased in OCA treated healthy (39.1 ± 1.0) and diseased (38.8 ± 0.9) PHHs compared to untreated PHHs (healthy: 31.7 ± 1.2; diseased: 30.7 ± 1.7) (Figure 6b). Similar CYP27A1 gene expression was measured in the treated (23.4 ± 0.2) versus untreated (23.2 ± 0.3) healthy PHHs and in the treated (23.0 ± 0.3) disease compared to the untreated diseased (22.9 ± 0.3) PHHs (Figure 6c).
Because OCA is an FXR agonist that is used to treat PBC, its effect on the BA synthetic and transport pathways was examined (Figure 6d). The formation of bile canaliculi was examined by immunofluorescence microscopy using CDFDA on day 14 in healthy and diseased PHHs when treated with and without OCA. There appeared to be an increase in the anatomizing of the bile canaliculi network when healthy and diseased PHHs were treated with OCA. This effect was observed to be more prominent in the diseased versus healthy PHHs treated with OCA.

4. Discussion

When OCA was evaluated in TruVivo®, there was a significant decrease in lipogenesis and triglyceride levels in healthy and diseased PHHs. Although there was no change in FXR gene expression, FXR activation is thought to have occurred through its pathway effects including decreased triglyceride levels potentially through Sterol Regulatory Element Binding Protein 1c, which is involved in fatty acid synthesis in the liver [33]. In addition, there was a significant decrease in FASN gene expression, which is regulated by Sterol Regulatory Element Binding Protein 1c, in the healthy and diseased PHHs [34,35]. Overall, OCA treatment significantly reduced the accumulation of lipid vesicles in healthy and diseased PHHs in TruVivo®.
OCA had varying effects on albumin and urea levels and CYP3A4 activity. It increased albumin in diseased treated PHHs, though not significantly, and decreased urea levels throughout the culture period in diseased PHHs. A review of the Phase II and Phase III clinical trials for OCA found no significant changes in albumin levels in the OCA treated groups compared to placebo treated groups, similar to these current findings [36]. Interestingly, FXR appears to play a role in urea synthesis by acting as a transcriptional regulator of enzymes involved in the urea cycle [37,38]. Studies using FXR-knockout mice treated with OCA showed increased expression of proteins that regulate generation of urea and glutamine synthesis suggesting that therapeutics such as OCA that activate FXR may promote ammonium clearance in MASH patients [38]. The decrease in urea levels in diseased PHHs with OCA treatment could be from OCA activating FXR and promoting ammonia clearance in order to create homeostasis and a normal physiological state in these PHHs, similar to the current condition of the healthy PHHs treated with OCA.
OCA significantly impaired CYP3A4 activity in healthy PHHs but increased activity in diseased PHHs on day 8. However, by day 14, the CYP3A4 activity in healthy and diseased PHHs was significantly decreased. Corresponding gene expression of CYP3A4 on day 14 showed a significant decrease. This result is similar to what has been previously observed in studies done by Nørgaard and others when examining OCA in advanced in vitro systems [39,40]. However, these data do not correspond to the clinical findings, although CYP3A4 suppression was suggested at the higher dose of OCA [41]. Upregulation of CYP3A4 expression has been observed after FXR activation, which was suppressed by the FXR agonist GW4064 through a mechanism mediated by a small heterodimer partner [42,43]. Further studies examining the mechanism of regulation would need to be performed to obtain a better understanding of CYP3A4 upregulation and/or suppression by OCA through FXR in vitro.
The impact of OCA treatment on inflammatory responses in healthy and diseased PHHs was examined. The two macrophage markers CD68 and CD163 were examined. CD68 is categorized under the M1 phenotype and thought to express pro-inflammatory cytokines, such as IL-6 and Monocyte chemoattractant protein-1 [44]. The M2 phenotype includes CD163 expressing macrophages that secrete anti-inflammatory cytokines such as IL-10 [44]. Staining of these macrophage markers appeared to decrease in diseased PHHs treated with OCA but not in healthy PHHs under the same conditions. However, gene expression of CD68 and CD163 did not show a significant change when healthy and diseased PHHs were treated with OCA. Notably, there was a decrease in gene expression of IL-6 and IL-10 in cultures of diseased PHHs treated with OCA. These results are consistent with previous work showing the inhibition of murine liver KCs by OCA after activation with lipopolysaccharide or Tumor Necrosis Factor-α [22]. In that study, Monocyte Chemoattractant Protein-1 and IL-10 gene expression in KCs were decreased with OCA treatment after stimulation but measured no changes in expression without stimulation, a condition that may be similar to the healthy PHHs shown. Additional studies showed a decrease in gene expression of the IL-6 signaling pathway after treatment with OCA in PHHs [35]. In our current studies, decreases in cytokine expression in diseased PHHs may be attributable to decreases in activation of the NLR family pyrin domain containing 3 inflammasome in macrophages because of OCA treatment [45]. Preliminary unpublished FLOW cytometry data suggests a level of cell heterogeneity including the inclusion of functional macrophages in the PHH donor lots. The diseased PHH donor lots showed a higher level of CD68+ expressing cells versus healthy donor lots. The level of CD163+ cells was similar between the two types of donors. In our previously published data, changes in CD68+ and CD163+ marker expression were observed between diseased fibrotic versus healthy PHHs after enriching in either high or low Percoll post-thaw [46]. It should be noted that the PHHs were not under stress or pharmacological stimulation. Future studies will determine the degree of heterogeneity between healthy and diseased donor lots. This could also explain why macrophage gene expression was unchanged, yet macrophage marker expression and cytokine expression were affected with OCA treatment.
The effects of OCA on CK18 gene expression and protein levels, a marker of fibrogenic responses, were determined. There was a decrease in diseased PHHs treated with OCA compared to untreated diseased PHHs. Interestingly, normal PHHs showed an increase in both CK18 gene expression and secreted protein. A decrease in COL1A1 secreted protein was also seen in diseased PHHs with OCA treatment versus nontreated diseased PHHs. TGF-β gene expression had a similar result with increased expression in healthy OCA treated PHHs and a decrease in expression for diseased OCA treated PHHs. Several studies showed decreases in TGF-β gene expression and genes in its pathway in cirrhotic rat livers and PHHs treated with OCA [22,35]. A study examining liver biopsies from the Phase III REGENERATE trial found OCA to have antifibrotic effects [23,47]. A better understanding of how OCA is working to reduce fibrogenic responses and outcomes has been performed using several murine models [22,48,49]. These murine models show OCA inhibiting hepatic SC proliferation and activation, which occurred through an increase in BA accumulation. Inhibition of CYP7A1 was also detected in some of these models providing further evidence of OCA’s influence on BA accumulation [48,49]. Overall, this decrease in SC activity results in lessening of fibrosis. Based on our data, a similar mechanism of how OCA works to improve fibrosis may be occurring in the diseased PHHs, but further studies are needed.
Gene expression of CYP7A1, CYP27A1, BSEP, and NTCP were examined due to OCA’s effects on PBC. While CYP7A1 gene expression was significantly reduced in healthy and diseased PHHS treated with OCA, BSEP gene expression was significantly increased in healthy and diseased PHHS that received OCA treatment. There did not seem to be an effect on CYP27A1 gene expression, the initiator for the alternative BA synthesis pathway, in the healthy and the diseased PHHs treated with OCA. There was no change in NTCP gene expression in the absence of exogenous BAs in the medium, which may be expected due to there being no change in FXR gene expression or its’ influence on NTCP expression [50]. The effect of OCA treatment on lowering triglyceride levels in healthy and diseased PHHs could be the result of decreased CYP7A1 and increased BSEP expression.
In addition to changes in gene expression, healthy and diseased PHHs treated with OCA appeared to have increased bile canaliculi networks. This effect seemed to be greater in the diseased PHHs that had less bile canaliculi formation compared to healthy PHHs; however, with the addition of OCA, these networks became more extensive in the diseased PHHs. It has been found that increased FXR expression plus the addition of a FXR agonist increased BA secretion due to increased BSEP expression [51]. It may be that these results in TruVivo® indicate that OCA activation of FXR is having a choleretic effect by increasing both BSEP expression and translocation of subcellular storage vesicles, leading to increased BA transport and more extensive bile canalicular network formation in the diseased PHHs. Because healthy PHHs inherently possess higher capacity to transport BA excretion, there is less of a requirement for an increased bile canaliculi network capacity and function [52].
Overall, TruVivo® demonstrates greater efficacy compared to other co-culture models due to testing diseased hepatocytes in this model system. Several co-culture models, including sandwich culture, have shown anti-fibrotic and anti-inflammatory effects by culturing healthy hepatocytes in a lipogenic medium that induces a diseased state [35,53]. However, this model system has the capability of culturing diseased hepatocytes for 14 days without a collagen overlay, without the addition of NPCs, and uses standard cell culture medium to determine the effects of the OCA.
In conclusion, healthy and diseased PHHs maintained in TruVivo® and treated with OCA showed decreased lipogenic capacity that is consistent with known clinical effects. Gene expression of FASN and triglyceride levels were lowered. Little to no changes were seen in albumin levels with OCA treatment; however, urea levels and CYP3A4 gene expression and activity significantly declined. OCA treated diseased PHHs showed lessening of inflammatory and fibrogenic response pathways. Decreases in IL-6, IL-10, CK18, and TGF-β gene expression were measured plus lower CK18 and COL1A1 protein levels in diseased PHHs with OCA treatment. Healthy and diseased PHHs treated with OCA had decreased CYP7A1 gene expression and increased BSEP gene expression. Although OCA treatment influenced inflammation and fibrosis, this effect was dependent on disease designation. Furthermore, these disease-like features were increased in healthy PHHs treated with OCA, suggesting uncharacteristic mechanisms are happening with treatment. This study highlights the potential danger of therapeutic treatment when not fully understood and the inconsistencies in response to treatment across a diseased population. The use of these preclinical model systems, such as TruVivo®, where both healthy and diseased PHHs can be studied will allow for increased understanding of molecular mechanisms regarding disease states and ultimately connect preclinical models to clinical outcomes. These preclinical models also have the potential to more effectively address regulatory concerns from agencies such as the FDA before entering into clinical trials. TruVivo® has the potential to further distinguish important differences in disease origin signaling pathways and other targets that can represent both healthy and diseased phenotypes.

5. Conclusions

In summary, the advantages of this model system, coupled with the flexibility and convenience of employing standard plate formats, suggest that this novel platform represents a promising new tool for testing the effects of new drug therapeutics for liver disease.

Supplementary Materials

The following supporting information can be downloaded at: https://www.mdpi.com/article/10.3390/cells14130968/s1, Figure S1: Additional representative images of inflammatory marker expression after OCA treatment.

Author Contributions

Conceptualization, J.R.W.; methodology, J.J.O. and J.R.W.; software, J.J.O. and J.R.W.; validation, J.J.O. and J.R.W.; formal analysis, J.J.O. and J.R.W.; investigation, J.J.O. and J.R.W.; resources, S.C.P., E.L.L. and J.C.; data curation, J.J.O. and J.R.W.; writing—original draft preparation, J.J.O., S.M.A. and J.R.W.; writing—review and editing, J.J.O., S.M.A., J.R.W., S.C.P., E.L.L. and J.C.; visualization, J.J.O. and J.R.W.; supervision, S.C.P., E.L.L. and J.C.; project administration, S.C.P., E.L.L. and J.C.; funding acquisition, S.C.P. and J.C. All authors have read and agreed to the published version of the manuscript.

Funding

This research was funded by LifeNet Health.

Institutional Review Board Statement

The study was conducted in accordance with the Declaration of Helsinki, and the protocols were approved by the LifeNet Health Ethics Committee for Project OPO-1502 (healthy liver) on 23 September 2016 and Project OPO-2101 (diseased liver) on 1 January 2021.

Informed Consent Statement

Informed consent was obtained from all donor tissues involved in the study for research purposes by LifeNet Health.

Data Availability Statement

The datasets presented in this article are not readily available because the data is part of an ongoing study. Requests to access the datasets should be directed to jessica_weaver@lifenethealth.org.

Conflicts of Interest

The authors are all employees of LifeNet Health. The funders had a role in the design of the study; in the collection, analyses, or interpretation of data; in the writing of the manuscript; and in the decision to publish the results.

Abbreviations

The following abbreviations are used in this manuscript:
BABile acids
BSEPBile salt export pump
CDFDA5-(and-6)-Carboxy-2′,7′-Dichlorofluorescein Diacetate
COL1A1Collagen 1A
CYP Cytochrome P450
CYP7A1Cholesterol 7-α-hydroxylase
CK18Cytokeratin-18
DPBSDulbecco’s PBS
FASNFatty Acid Synthase
FXRFarnesoid X Receptor
GAPDHGlyceraldehyde-3-phosphate dehydrogenase
IL-6Interleukin-6
IL-10Interleukin-10
KCKupffer Cell
LSECLiver Sinusoidal Endothelial Cell
MAFLDMetabolic Dysfunction-Associated Fatty Liver Disease
MASHMetabolic Dysfunction-Associated Steatohepatitis
NAFLDNonalcoholic Fatty Liver Disease
NASHNonalcoholic steatohepatitis
NTCPsodium taurocholate co-transporting polypeptide
OCAObeticholic Acid
PBCPrimary biliary cholangitis
PHHPrimary Human Hepatocyte
RFURelative Fluorescent Unit
SCStellate Cell
TGF-βTransforming Growth Factor-beta

References

  1. Riazi, K.; Azhari, H.; Charette, J.H.; Underwood, F.E.; King, J.A.; Afshar, E.E.; Swain, M.G.; Congly, S.E.; Kaplan, G.G.; Shaheen, A.-A. The prevalence and incidence of NAFLD worldwide: A systematic review and meta-analysis. Lancet Gastroenterol. Hepatol. 2023, 7, 851–861. [Google Scholar] [CrossRef]
  2. Younossi, Z.M.; Koenig, A.B.; Abdelatif, D.; Fazel, Y.; Henry, L.; Wymer, M. Global Epidemiology of Nonalcoholic Fatty Liver Disease- Meta-Analytic Assessment of Prevalence, Incidence, and Outcomes. Hepatology 2016, 64, 73–84. [Google Scholar] [CrossRef]
  3. Younossi, Z.; Anstee, Q.M.; Marietti, M.; Hardy, T.; Henry, L.; Eslam, M.; George, J.; Bugianesi, E. Global burden of NAFLD and NASH: Trends, predictions, risk factors and prevention. Nat. Rev. Gastroenterol. Hepatol. 2018, 15, 11–20. [Google Scholar] [CrossRef]
  4. Weaver, J.R.; Odanga, J.J.; Wolf, K.K.; Piekos, S.; Biven, M.; Taub, M.; LaRocca, J.; Thomas, C.; Byer-Alcorace, A.; Chen, J.; et al. The morphology, functionality, and longevity of a novel all human hepatic cell-based tri-culture system. Toxicol. In Vitro 2023, 86, 105504. [Google Scholar] [CrossRef]
  5. Odanga, J.J.; Gianulis, E.; Whaley, L.; LeCluyse, E.L.; Presnell, S.; Weaver, J.R. An All-Human Hepatic Culture System for Drug Development Applications. J. Vis. Exp. 2023, 200, e65992. [Google Scholar] [CrossRef]
  6. Odanga, J.J.; Anderson, S.M.; Breathwaite, E.K.; Presnell, S.C.; LeCluyse, E.L.; Chen, J.; Weaver, J.R. Characterization of diseased primary human hepatocytes in an all-human cell-based triculture system. Sci. Rep. 2024, 14, 6772. [Google Scholar] [CrossRef]
  7. Zhang, J.; Liu, Q.; He, J.; Li, Y. Novel Therapeutic Targets in Liver Fibrosis. Front. Mol. Biosci. 2021, 8, 766855. [Google Scholar] [CrossRef]
  8. Trauner, M.; Fuchs, C.D. Novel therapeutic targets for cholestatic and fatty liver disease. Gut 2022, 71, 194–209. [Google Scholar] [CrossRef]
  9. Lee, F.Y.; Lee, H.; Hubbert, M.L.; Edwards, P.A.; Zhang, Y. FXR, a multipurpose nuclear receptor. Trends Biochem. Sci. 2006, 31, 572–580. [Google Scholar] [CrossRef]
  10. Salhab, A.; Amer, J.; Lu, Y.; Safadi, R. Sodium +/Taurocholate Cotransporting Polypeptide as Target Therapy for Liver Fibrosis. Gut 2022, 71, 1373–1385. [Google Scholar] [CrossRef]
  11. Halilbasic, E.; Claudel, T.; Trauner, M. Bile Acid Transporters and Regulatory Nuclear Receptors in the Liver and Beyond. J. Hepatol. 2013, 58, 155–168. [Google Scholar] [CrossRef]
  12. Jiang, L.; Zhang, H.; Xiao, D.; Wei, H.; Chen, Y. Farnesoid X receptor (FXR): Structures and ligands. Comput. Struct. Biotechnol. J. 2021, 19, 2148–2159. [Google Scholar] [CrossRef]
  13. Myant, N.B.; Mitropoulos, K.A. Cholesterol 7 alpha-hydroxylase. J. Lipid Res. 1977, 18, 135–153. [Google Scholar] [CrossRef]
  14. Kubitz, R.; Dröge, C.; Stindt, J.; Weissenberger, K.; Häussinger, D. The bile salt export pump (BSEP) in health and disease. Clin. Res. Hepatol. Gastroenterol. 2012, 36, 536–553. [Google Scholar] [CrossRef]
  15. Floerl, S.; Kuehne, A.; Geyer, J.; Brockmoeller, J.; Tzvetkov, M.V.; Hagos, Y. Functional and Pharmacological Comparison of Human and Mouse Na+/Taurocholate Cotransporting Polypeptide (NTCP). SLAS Discov. 2021, 26, 1055–1064. [Google Scholar] [CrossRef]
  16. Jiao, Y.; Lu, Y.; Li, X. Farnesoid X receptor: A master regulator of hepatic triglyceride and glucose homeostasis. Acta Pharmacol. Sin. 2015, 36, 44–50. [Google Scholar] [CrossRef]
  17. Porez, G.; Prawitt, J.; Gross, B.; Staels, B. Bile acid receptors as targets for the treatment of dylipidemia and cardiovascular disease. J. Lipid Res. 2012, 53, 1723–1737. [Google Scholar] [CrossRef]
  18. Pellicciari, R.; Costantino, G.; Camaioni, E.; Sadeghpour, B.M.; Entrena, A.; Willson, T.M.; Fiorucci, S.; Clerici, C.; Gioiello, A. Bile Acid Derivatives as Ligands of the Farnesoid X Receptor. Synthesis, Evaluation, and Structure-Activity Relationship of a Series of Body and Side Chain Modified Analogues of Chenodeoxycholic Acid. J. Med. Chem. 2004, 47, 4559–4569. [Google Scholar] [CrossRef]
  19. Floreani, A.; Gabbia, D.; De Martin, S. Obeticholic Acid for Primary Cholangitis. Biomedicines 2022, 10, 2464. [Google Scholar] [CrossRef]
  20. Gulamhusein, A.F.; Hirschfield, G.M. Primary biliary cholangitis: Pathogenesis and therapeutic opportunities. Nat. Rev. Gastroenterol. Hepatol. 2020, 17, 93–110. [Google Scholar] [CrossRef]
  21. Ronca, V.; Davies, S.P.; Oo, Y.H.; Lleo, A. The immunological landscape of primary biliary cholangitis: Mechanisms and therapeutic prospects. Hepatology 2025, 10-1097. [Google Scholar] [CrossRef]
  22. Verbeke, L.; Mannaerts, I.; Schierwagen, R.; Govaere, O.; Klein, S.; Vander Elst, I.; Windmolders, P.; Farre, R.; Wenes, M.; Mazzone, M.; et al. FXR Agonist Obeticholic Acid Reduces Hepatic Inflammation and Fibrosis in a Rat Model of Toxic Cirrhosis. Sci. Rep. 2016, 6, 33453. [Google Scholar] [CrossRef]
  23. Younossi, Z.M.; Ratziu, V.; Loomba, R.; Rinella, M.; Anstee, Q.M.; Goodman, Z.; Bedossa, P.; Geier, A.; Beckebaum, S.; Newsome, P.N.; et al. Obeticholic acid for the treatment of non-alcoholic steatohepatitis: Interim analysis from a multicentre, randomised, placebo-controlled phase 3 trial. Lancet 2019, 394, 2184–2196. [Google Scholar] [CrossRef]
  24. Neuschwander-Tetri, B.A.; Loomba, R.; Sanyal, A.J.; Lavine, J.E.; Van Natta, M.L.; Abdelmalek, M.F.; Chalasani, N.; Dasarathy, S.; Diehl, A.M.; Hameed, B.; et al. Farnesoid X nuclear receptor ligand obeticholic acid for non-cirrhotic, non-alcoholic steatohepatitis (FLINT): A multicentre, randomised, placebo-controlled trial. Lancet 2015, 385, 959–965. [Google Scholar] [CrossRef]
  25. Alkhouri, N.; LaCerte, C.; Edwards, J.; Poordad, F.; Lawitz, E.; Lee, L.; Karan, S.; Sawhney, S.; Erickson, M.; MacConell, L.; et al. Safety, pharmacokinetics and pharmacodynamics of obeticholic acid in subjects with fibrosis or cirrhosis from NASH. Liver Int. 2024, 44, 966–978. [Google Scholar] [CrossRef]
  26. Mudaliar, S.; Henry, R.R.; Sanyal, A.J.; Morrow, L.; Marschall, H.U.; Kipnes, M.; Adorini, L.; Sciacca, C.I.; Clopton, P.; Castelloe, E.; et al. Efficacy and safety of the farnesoid X receptor agonist obeticholic acid in patients with type 2 diabetes and nonalcoholic fatty liver disease. Gastroenterology 2013, 145, 574–582. [Google Scholar] [CrossRef]
  27. Ghabril, M.; Vuppalanchi, R.; Chalasani, N. Drug-Induced Liver Injury in Patients With Chronic Liver Disease. Liver Int. 2025, 45, e70019. [Google Scholar] [CrossRef]
  28. U.S. Food & Drug Administration Drug Safety and Availability. “Serious Liver Injury Being Observed in Patients Without Cirrhosis Taking Ocaliva (Obeticholic Acid) to Treat Primary Biliary Cholangitis.” 12-12-2024 FDA Drug Safety Communication. Available online: https://www.fda.gov/drugs/drug-safety-and-availability/serious-liver-injury-being-observed-patients-without-cirrhosis-taking-ocaliva-obeticholic-acid-treat (accessed on 12 December 2024).
  29. Kleiner, D.E.; Brunt, E.M.; Van Natta, M.; Behling, C.; Contos, M.J.; Cummings, O.W.; Ferrell, L.D.; Liu, Y.C.; Torbenson, M.S.; Unalp-Arida, A.; et al. Design and validation of a histological scoring system for nonalcoholic fatty liver disease. Hepatology 2005, 41, 1313–1321. [Google Scholar] [CrossRef]
  30. Hirschfield, G.M.; Mason, A.; Luketic, V.; Lindor, K.; Gordon, S.C.; Mayo, M.; Kowdley, K.V.; Vincent, C.; Bodhenheimer, H.C., Jr.; Parés, A.; et al. Efficacy of obeticholic acid in patients with primary biliary cirrhosis and inadequate response to ursodeoxycholic acid. Gastroenterology 2015, 148, 751–761.e8. [Google Scholar] [CrossRef]
  31. Feaver, R.E.; Cole, B.K.; Lawson, M.J.; Hoang, S.A.; Marukian, S.; Blackman, B.R.; Figler, R.A.; Sanyal, A.J.; Wamhoff, B.R. and Dash, A. Development of an in vitro human liver system for interrogating nonalcoholic steatohepatitis. JCI Insight 2016, 1, e90954. [Google Scholar] [CrossRef] [PubMed]
  32. Anfuso, B.; Tiribelli, C.; Adorini, L.; Rosso, N. Obeticholic acid and INT-767 modulate collagen deposition in a NASH in vitro model. Sci. Rep. 2020, 10, 1699. [Google Scholar] [CrossRef]
  33. Watanabe, M.; Houten, S.M.; Wang, L.; Moschetta, A.; Mangelsdorf, D.J.; Heyman, R.A.; Moore, D.D.; Auwerx, J. Bile acids lower triglyceride levels via a pathway involving FXR, SHP, and SREBP-1c. J. Clin. Investig. 2004, 113, 1408–1418. [Google Scholar] [CrossRef]
  34. Shimano, H.; Horton, J.D.; Shimomura, I.; Hammer, R.E.; Brown, M.S.; Goldstein, J.L. Isoform 1c of sterol regulatory element binding protein is less active than isoform 1a in livers of transgenic mice and in cultured cells. J. Clin. Investig. 1997, 99, 846–854. [Google Scholar] [CrossRef]
  35. Dash, A.; Figler, R.A.; Blackman, B.R.; Marukian, S.; Collado, M.S.; Lawson, M.J.; Hoang, S.A.; Mackey, A.J.; Manka, D.; Cole, B.K.; et al. Pharmacotoxicology of clinically-relevant concentrations of obeticholic acid in an organotypic human hepatocyte system. Toxicol. In Vitro 2017, 39, 93–103. [Google Scholar] [CrossRef]
  36. Smith, S.M.; Pegram, A.H. Obeticholic Acid: A Farnesoid X Receptor Agonist for Primary Biliary Cholangitis. J. Pharm. Technol. 2017, 2, 66–71. [Google Scholar] [CrossRef]
  37. Renga, B.; Mencarelli, A.; Cipriani, S.; D’Amore, C.; Zampella, A.; Monti, M.C.; Distrutti, E.; Fiorucci, S. The nuclear receptor FXR regulates hepatic transport and metabolism of glutamine and glutamate. Biochim. Biophys. Acta 2011, 1812, 1522–1531. [Google Scholar] [CrossRef]
  38. Massafra, V.; Milona, A.; Vos, H.R.; Ramos, R.J.; Gerrits, J.; Willemsen, E.C.; Pittol, J.M.R.; Ijssennagger, N.; Houweling, M.; Prinsen, H.C.; et al. Farnesoid X Receptor Activation Promotes Hepatic Amino Acid Catabolism and Ammonium Clearance in Mice. Gastroenterology 2017, 152, 1462–1476. [Google Scholar] [CrossRef]
  39. Nørgaard, R.A.; Bhatt, D.K.; Järvinen, E.; Stage, T.B.; Gabel-Jensen, C.; Galetin, A.; Säll, C. Evaluating Drug-Drug Interaction Risk Associated with Peptide Analogs Using advanced In Vitro Systems. Drug Metab. Dispos. 2024, 52, 1170–1180. [Google Scholar] [CrossRef]
  40. Zhang, Y.; LaCerte, C.; Kansra, S.; Jackson, J.P.; Brouwer, K.R.; Edwards, J.E. Comparative potency of obeticholic acid and natural bile acids on FXR in hepatic and intestinal in vitro cell models. Pharmacol. Res. Perspect. 2017, 5, e00368. [Google Scholar] [CrossRef]
  41. Edwards, J.E.; Eliot, L.; Parkinson, A.; Karan, S.; MacConell, L. Assessment of Pharmacokinetic Interactions Between Obeticholic Acid and Caffeine, Midazolam, Warfarin, Dextromethorphan, Omeprazole, Rosuvastatin, and Digoxin in Phase 1 Studies in Healthy Subjects. Adv. Ther. 2017, 34, 2120–2138. [Google Scholar] [CrossRef]
  42. Gnerre, C.; Blättler, S.; Kaufmann, M.R.; Looser, R.; Meyer, U.A. Regulation of CYP3A4 by the bile acid receptor FXR: Evidence for functional binding sites in the CYP3A4 gene. Pharmacogenetics 2004, 14, 635–645. [Google Scholar] [CrossRef]
  43. Zhang, S.; Pan, X.; Jeong, H. GW4064, an agonist of farnesoid X receptor, represses CYP3A4 expression in human hepatocytes by inducing small heterodimer partner expression. Drug Metab. Dispos. 2015, 43, 743–748. [Google Scholar] [CrossRef]
  44. Alisi, A.; Carpino, G.; Oliveira, F.L.; Panera, N.; Nobili, V.; Gaudio, E. The Role of Tissue Macrophage-Mediated Inflammation on NAFLD Pathogenesis and Its Clinical Implications. Mediators Inflamm. 2017, 8162421. [Google Scholar] [CrossRef]
  45. Huang, S.; Wu, Y.; Zhao, Z.; Wu, B.; Sun, K.; Wang, H.; Qin, L.; Bai, F.; Leng, Y.; Tang, W. A new mechanism of obeticholic acid on NASH treatment by inhibiting NLRP3 inflammasome activation in macrophage. Metabolism 2021, 120, 154797. [Google Scholar] [CrossRef]
  46. Odanga, J.J.; Anderson, S.M.; Presnell, S.C.; LeCluyse, E.L.; Chen, J.; Weaver, J.R. Impact of Post-Thaw Enrichment of Primary Human Hepatocytes on Steatosis, Inflammation, and Fibrosis in the TruVivo® System. Pharmaceuticals 2024, 17, 1624. [Google Scholar] [CrossRef]
  47. Sanyal, A.J.; Ratziu, V.; Loomba, R.; Anstee, Q.M.; Kowdley, K.V.; Rinella, M.E.; Sheikh, M.Y.; Trotter, J.F.; Knapple, W.; Lawitz, E.J.; et al. Results from a new efficacy and safety analysis of the REGENERATE trial of obeticholic acid for treatment of pre-cirrhotic fibrosis due to non-alcoholic steatohepatitis. J. Hepatol. 2023, 79, 1110–1120. [Google Scholar] [CrossRef]
  48. Zhou, J.; Huang, N.; Guo, Y.; Cui, S.; Ge, C.; He, Q.; Pan, X.; Wang, G.; Wang, H.P.; Hao, H. Combined obeticholic acid and apoptosis inhibitor treatment alleviates liver fibrosis. Acta Pharm. Sin. B 2019, 9, 526–536. [Google Scholar] [CrossRef]
  49. Azizsoltani, A.; Hatami, B.; Zali, M.R.; Mahdavi, V.; Baghaei, K.; Alizadeh, E. Obeticholic acid-loaded exosomes attenuate liver fibrosis through dual targeting of the FXR signaling pathway and ECM remodeling. Biomed. Pharmacother. 2023, 168, 115777. [Google Scholar] [CrossRef]
  50. Tan, X.; Xiang, Y.; Shi, J.; Chen, L.; Yu, D. Targeting NTCP for liver disease treatment: A promising strategy. J. Pharm. Anal. 2024, 14, 100979. [Google Scholar] [CrossRef]
  51. Nell, P.; Kattler, K.; Feuerborn, D.; Hellwig, B.; Rieck, A.; Salhab, A.; Lepikhov, K.; Gasparoni, G.; Thomitzek, A.; Belgasmi, K.; et al. Identification of an FXR-modulated liver-intestine hybrid state in iPSC-derived hepatocyte-like cells. J. Hepatol. 2022, 77, 1386–1398. [Google Scholar] [CrossRef]
  52. Kosters, A.; Karpen, S.J. Bile acid transporters in health and disease. Xenobiotica 2008, 38, 1043–1071. [Google Scholar] [CrossRef] [PubMed]
  53. Zhang, Y.; Jackson, J.P.; St Claire, R.L., 3rd; Freeman, K.; Brouwer, K.R.; Edwards, J.E. Obeticholic acid, a selective farnesoid X receptor agonist, regulates bile acid homeostasis in sandwich-cultured human hepatocytes. Pharmacol. Res. Perspect. 2017, 5, e00329. [Google Scholar] [CrossRef]
Figure 1. Representative images of (a) healthy and (b) diseased primary human hepatocytes (PHHs) on days 8 (left column) and 14 (right column) treated without (−) (top row) and with (+) Obeticholic Acid (OCA) (bottom row). PHHs were treated with or without OCA for 24 h (day 8) and 7 days (day 14). Total magnification: 200X. n = 4 healthy donors, n = 4 diseased donors. (c) Lipids stained with Nile Red in healthy (left column) and diseased (right column) PHHs when untreated (−) (top row) and treated (+) with OCA (bottom row) on day 14. Total magnification: 200X. n = 2 healthy donors, n = 2 diseased donors. (d) Quantitation of fluorescent signal from Nile Red staining on day 14 in healthy (black bars) and diseased (grey bars) PHHs treated without (−) and with (+) OCA. Values have been normalized to untreated PHHs and are shown as percent to untreated PHHs (− OCA). Error bars represent SD. n = 2 healthy donors, n = 2 diseased donors. Nine images were analyzed for each donor. aaa p ≤ 0.001 to untreated healthy PHHs. bbb p ≤ 0.001 to untreated diseased PHHs. Significance was determined using ANOVA with Tukey post-hoc testing.
Cells 14 00968 g001
Figure 2. FASN gene expression and levels of triglycerides are lowered in healthy and diseased PHHs treated with OCA. Gene expression on day 14 of (a) Farnesoid X Receptor (FXR), (b) Sodium Taurocholate Co-transporting Polypeptide (NTCP), and (c) Fatty Acid Synthase (FASN) in untreated healthy primary human hepatocytes (PHHs) (black circles), Obeticholic Acid (OCA) treated healthy PHHs (grey squares), untreated diseased (Dis) PHHs (black diamonds), and OCA treated Dis PHHs (grey triangles). Error bars represent SD. n ≥ 3 healthy donors, n = 4 diseased donors. b p ≤ 0.05 to untreated Dis PHHs. (d) Levels of triglycerides on day 14 in untreated (−) and OCA treated (+) healthy (black bars) and diseased (grey bars) PHHs. Values have been normalized to untreated PHHs and are shown as percent to untreated PHHs (− OCA). Error bars represent SD. n = 2 healthy donors, n = 2 diseased donors. For each donor, 2 wells were sampled, and each sample was run in duplicate. a p ≤ 0.05, aaa p ≤ 0.001 to untreated healthy PHHs. b p ≤ 0.05 to untreated diseased PHHs. Significance was determined using ANOVA with Tukey post-hoc testing.
Cells 14 00968 g002
Figure 3. PHH functionality decreases with OCA treatment. Levels of (a) albumin, (b) urea, and (c) Cytochrome P450 (CYP) 3A4 activity in healthy (black bars) and diseased (grey bars) primary human hepatocytes (PHHs) treated without (−) and with (+) Obeticholic Acid (OCA) for 24 h (day 8) and 7 days (day 14). Error bars represent SD. n = 2 healthy donors, n = 2 diseased donors. For each donor, 3 wells were sampled, and each sample was run in duplicate. For CYP3A4 activity, graph depicts representative data from 1 healthy donor and 1 diseased donor. a p ≤ 0.05, aaa p ≤ 0.001 to untreated healthy PHHs on day 8. bbb p ≤ 0.001 to untreated diseased PHHs on day 8. ccc p ≤ 0.001 to untreated diseased PHHs on day 14. ddd p ≤ 0.001 to untreated healthy PHHs on day 14. (d) CYP3A4 gene expression on day 14 in untreated healthy PHHs (black circles), OCA treated healthy PHHs (grey squares), untreated diseased (Dis) PHHs (black diamonds), and OCA treated Dis PHHs (grey triangles). Error bars represent SD. n = 4 healthy donors, n = 4 diseased donors. x p ≤ 0.05 to untreated healthy PHHs. yy p ≤ 0.01 to untreated diseased PHHs. Significance was determined using ANOVA with Tukey post-hoc testing.
Cells 14 00968 g003
Figure 4. OCA effects localization of macrophage markers and gene expression of pro- and anti-inflammatory markers. Representative images on day 14 of healthy (left column) and diseased (right column) primary human hepatocytes (PHHs) stained for either (a) CD68 (green) or (b) CD163 (green), Cytokeratin-18 (CK18) (red), and DAPI (blue) when treated without (−) (top row) or with (+) (bottom row) Obeticholic Acid (OCA). Total magnification: 100×. n = 2 healthy donors, n = 2 diseased donors. Gene expression on day 14 of (c) CD68, (d) CD163, (e) Interleukin-6 (IL-6), (f) Interleukin-10 (IL-10), and (g) Cytochrome P450 (CYP) 2E1 in untreated healthy PHHs (black circles), OCA treated healthy PHHs (grey squares), untreated diseased (Dis) PHHs (black diamonds), and OCA treated Dis PHHs (grey triangles). Error bars represent SD. n ≥ 3 healthy donors, n = 4 diseased donors. aa p ≤ 0.01, aaa p ≤ 0.001 to untreated healthy PHHs. b p ≤ 0.05, bbb p ≤ 0.001 to untreated diseased PHHs. Significance was determined using ANOVA with Tukey or Fisher post-hoc testing.
Cells 14 00968 g004
Figure 5. OCA treated diseased PHHs have decreased fibrotic marker expression. (a) Cytokeratin-18 (CK18) and (b) Transforming Growth Factor-beta (TGF-β) gene expression on day 14 in untreated healthy primary human hepatocytes (PHHs) (black circles), Obeticholic Acid (OCA) treated healthy PHHs (grey squares), untreated diseased (Dis) PHHs (black diamonds), and OCA treated Dis PHHs (grey triangles). Error bars represent SD. n = 2 healthy donors, n ≥ 2 diseased donors. For each donor, 2 wells were sampled, and each sample was run in duplicate. (c) CK18 and (d) Collagen 1A secreted protein on day 14 in healthy (black bars) and diseased (grey bars) PHHs treated without (−) and with (+) OCA. Values have been normalized to untreated PHHs and are shown as percent decrease to untreated (− OCA). Error bars represent SD. n = 2 healthy donors, n = 2 diseased donors. For each donor, 3 wells were sampled, and each sample was run in duplicate. aaa p ≤ 0.001 to untreated healthy PHHs. b p ≤ 0.05, bb p ≤ 0.01, bbb p ≤ 0.001 to untreated diseased PHHs. Significance was determined using ANOVA with Tukey post-hoc testing.
Cells 14 00968 g005
Figure 6. Expression of bile acid synthesis genes are altered in healthy and diseased PHHs treated with OCA. Gene expression on day 14 of (a) Bile Salt Export Pump (BSEP), (b) Cholesterol 7-α-hydroxylase 7A1 (CYP7A1), and (c) Cytochrome P450 (CYP) 27A1 in untreated healthy primary human hepatocytes (PHHs) (black circles), Obeticholic Acid (OCA) treated healthy PHHs (grey squares), untreated diseased (Dis) PHHs (black diamonds), and OCA treated Dis PHHs (grey triangles). Error bars represent SD. n ≥ 3 healthy donors, n ≥ 3 diseased donors. aaa p ≤ 0.001 to untreated healthy PHHs. bbb p ≤ 0.001 to untreated diseased PHHs. (d) Representative images on day 14 of bile canaliculi staining in healthy (left column) and diseased (right column) PHHs treated without (−) (top row) and with (+) (bottom row) OCA. Total magnification: 100×. n ≥ 3 healthy donors, n ≥ 3 diseased donors. Significance was determined using ANOVA with Tukey post-hoc testing.
Cells 14 00968 g006
Table 1. Characteristics of Donors.
Donor
(Lot #)
AgeSexBMINAS ScoreSteatosis ScoreLobular
Inflammation Score
Hepatocyte
Ballooning Score
Fibrosis StageHealth
Category
1611741F3000000Healthy
181468052F2300000Healthy
191961360M2600001–2Healthy
211788523F23.711000Healthy
202173650F25.663120Diseased
211140128M21.853021Diseased
211616751M29.841121Diseased
222243730M26.841121Diseased
Table 2. Sequences of Primers.
Primer NameForward Sequence (5′-3′)Reverse Sequence (5′-3′)
GAPDHGGTCACCAGGGCTGCTTTTAGGATCTCGCTCCTGGAAGATG
FASNAAGGACCTGTCTAGGTTTGATGCTGGCTTCATAGGTGACTTCCA
IL-6ACAACCTGAACCTTCCAAAGATCAGCAGGCTGGCATTT
IL-10GGCTACGGCGCTGTCATCGATTGCATTCTTCACCTGCTCCACGG
CK18GGCATCCAGAACGAGAAGGAAGTGCTCCCGGATTTTGCT
TGF-βTTCCCTCGAGGCCCTCCTAGCCGCAGCTTGGACAGGATC
Disclaimer/Publisher’s Note: The statements, opinions and data contained in all publications are solely those of the individual author(s) and contributor(s) and not of MDPI and/or the editor(s). MDPI and/or the editor(s) disclaim responsibility for any injury to people or property resulting from any ideas, methods, instructions or products referred to in the content.

